
Accuracy and Clinical Impact of Estimating Low-Density Lipoprotein-Cholesterol at High and Low Levels by Different Equations
 , , ,
, , ,
Abstract
1. Introduction
2. Methods
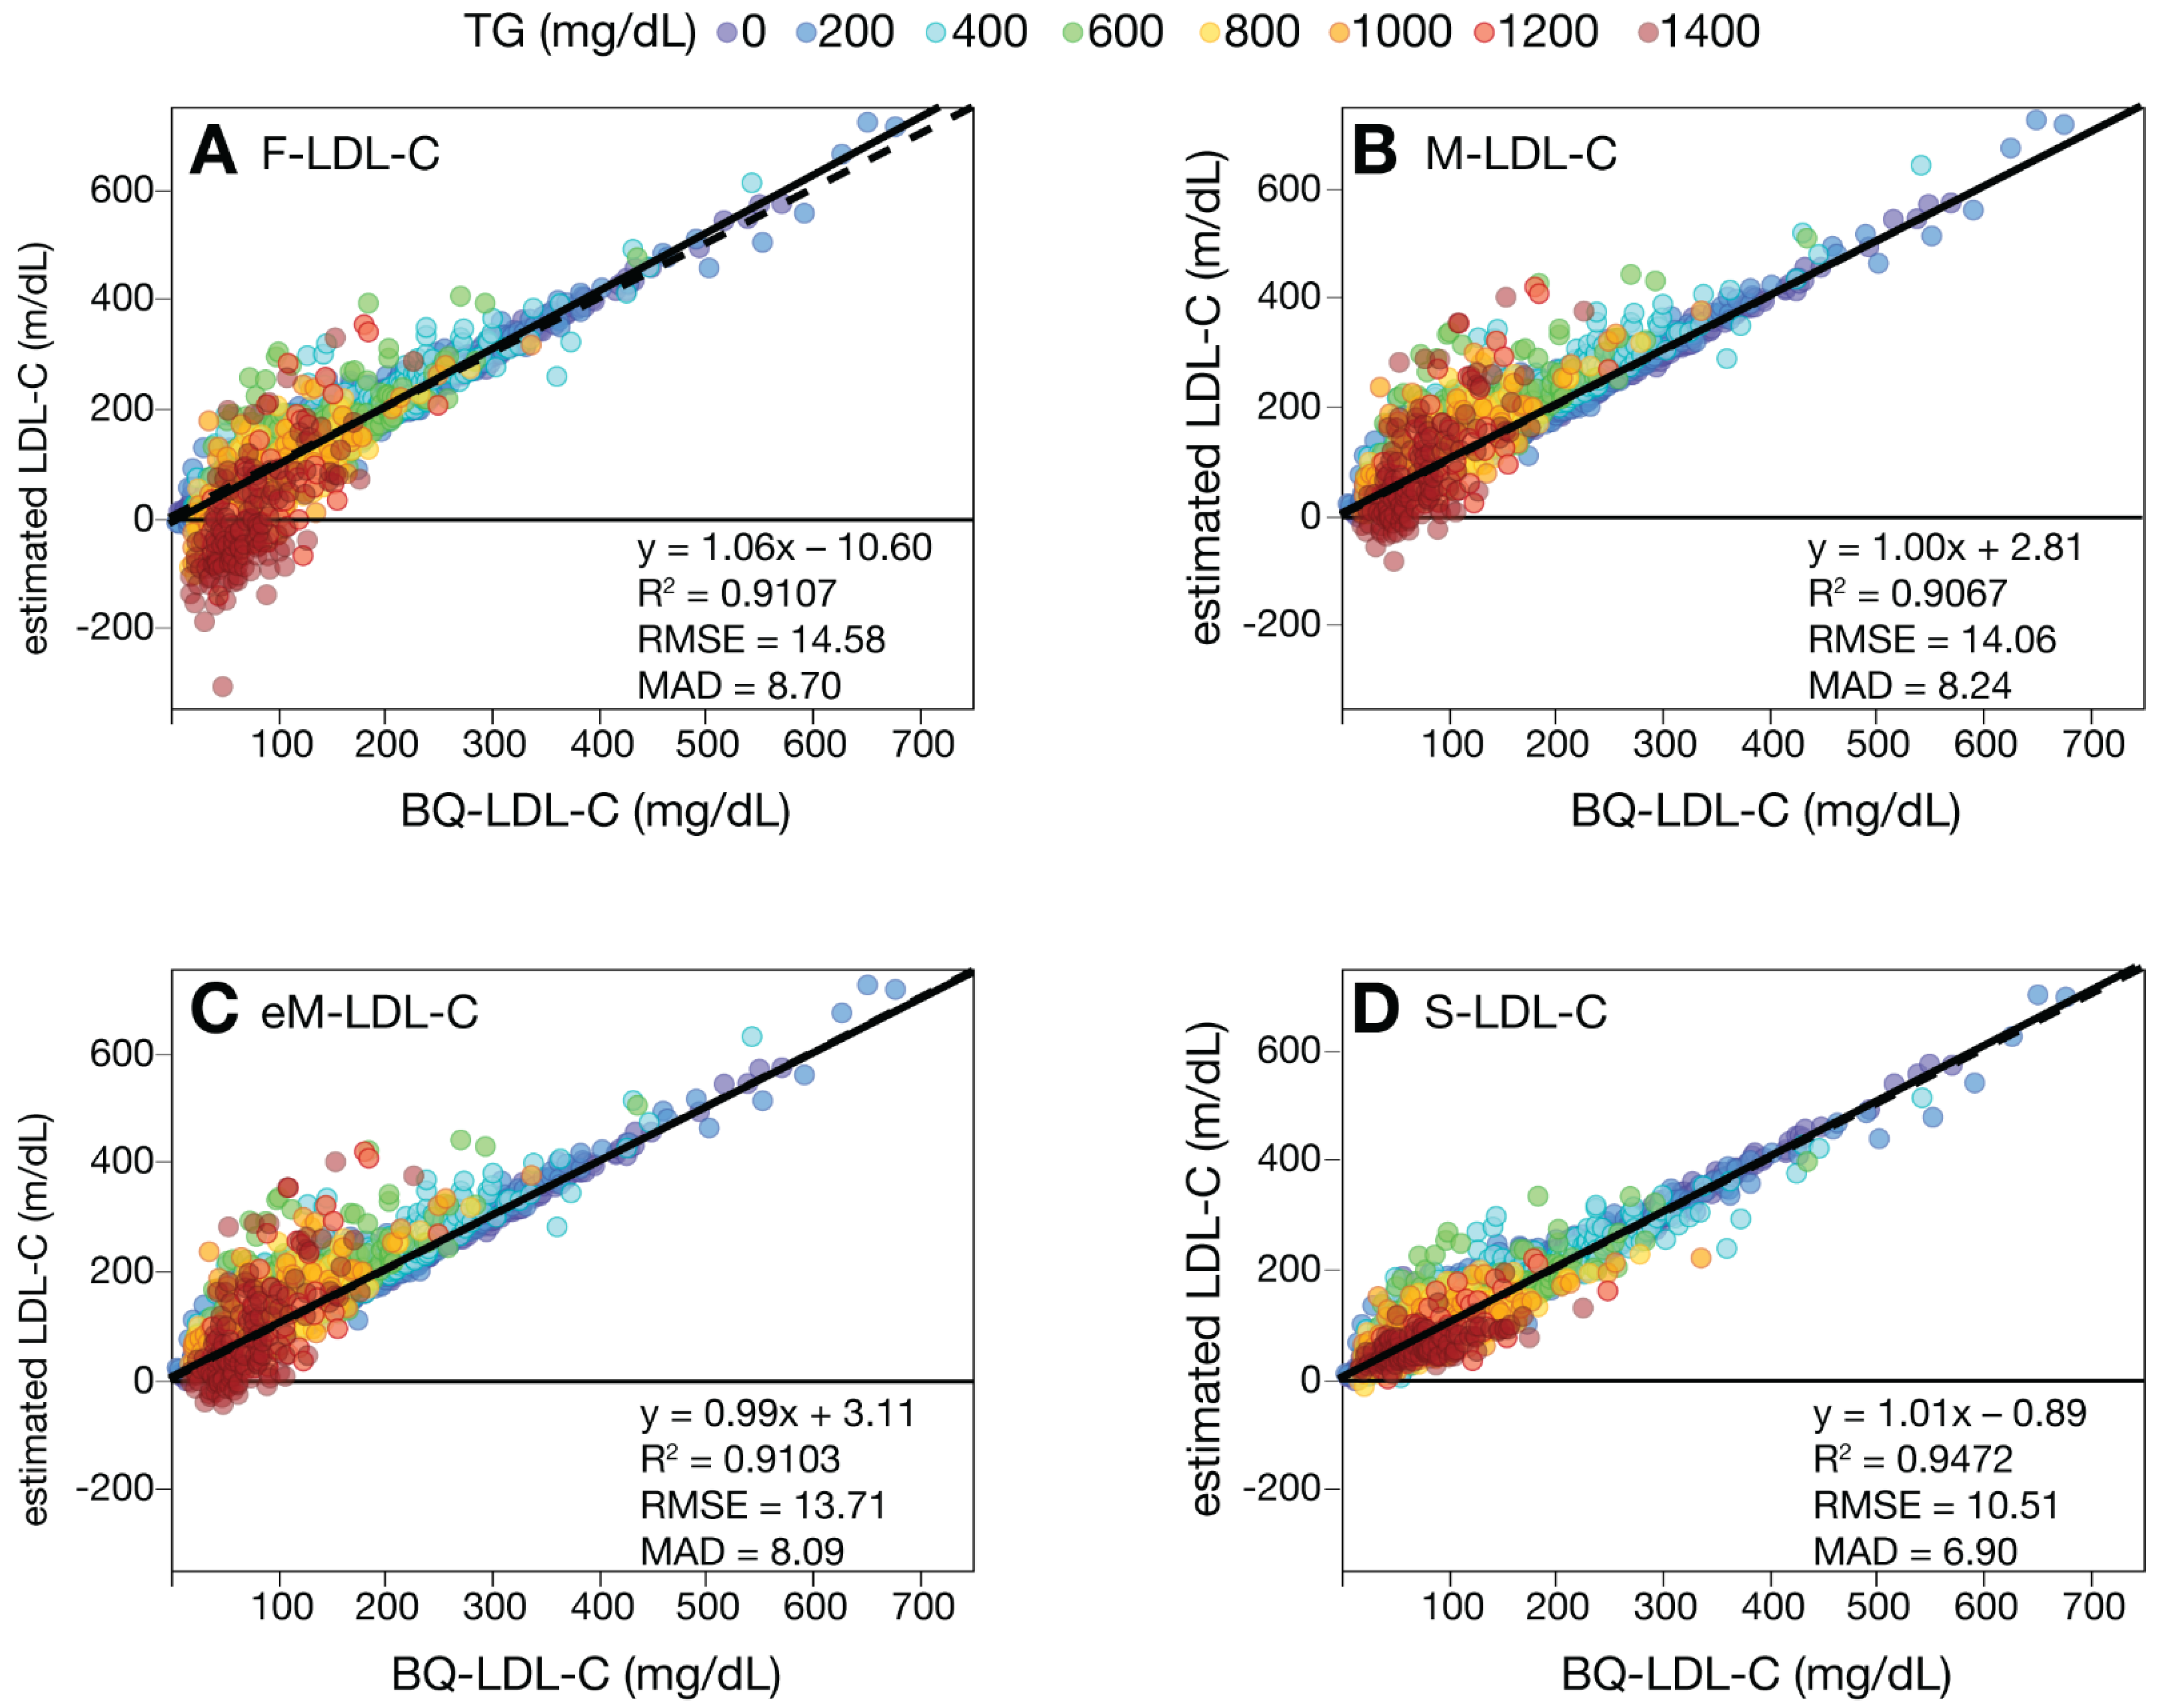
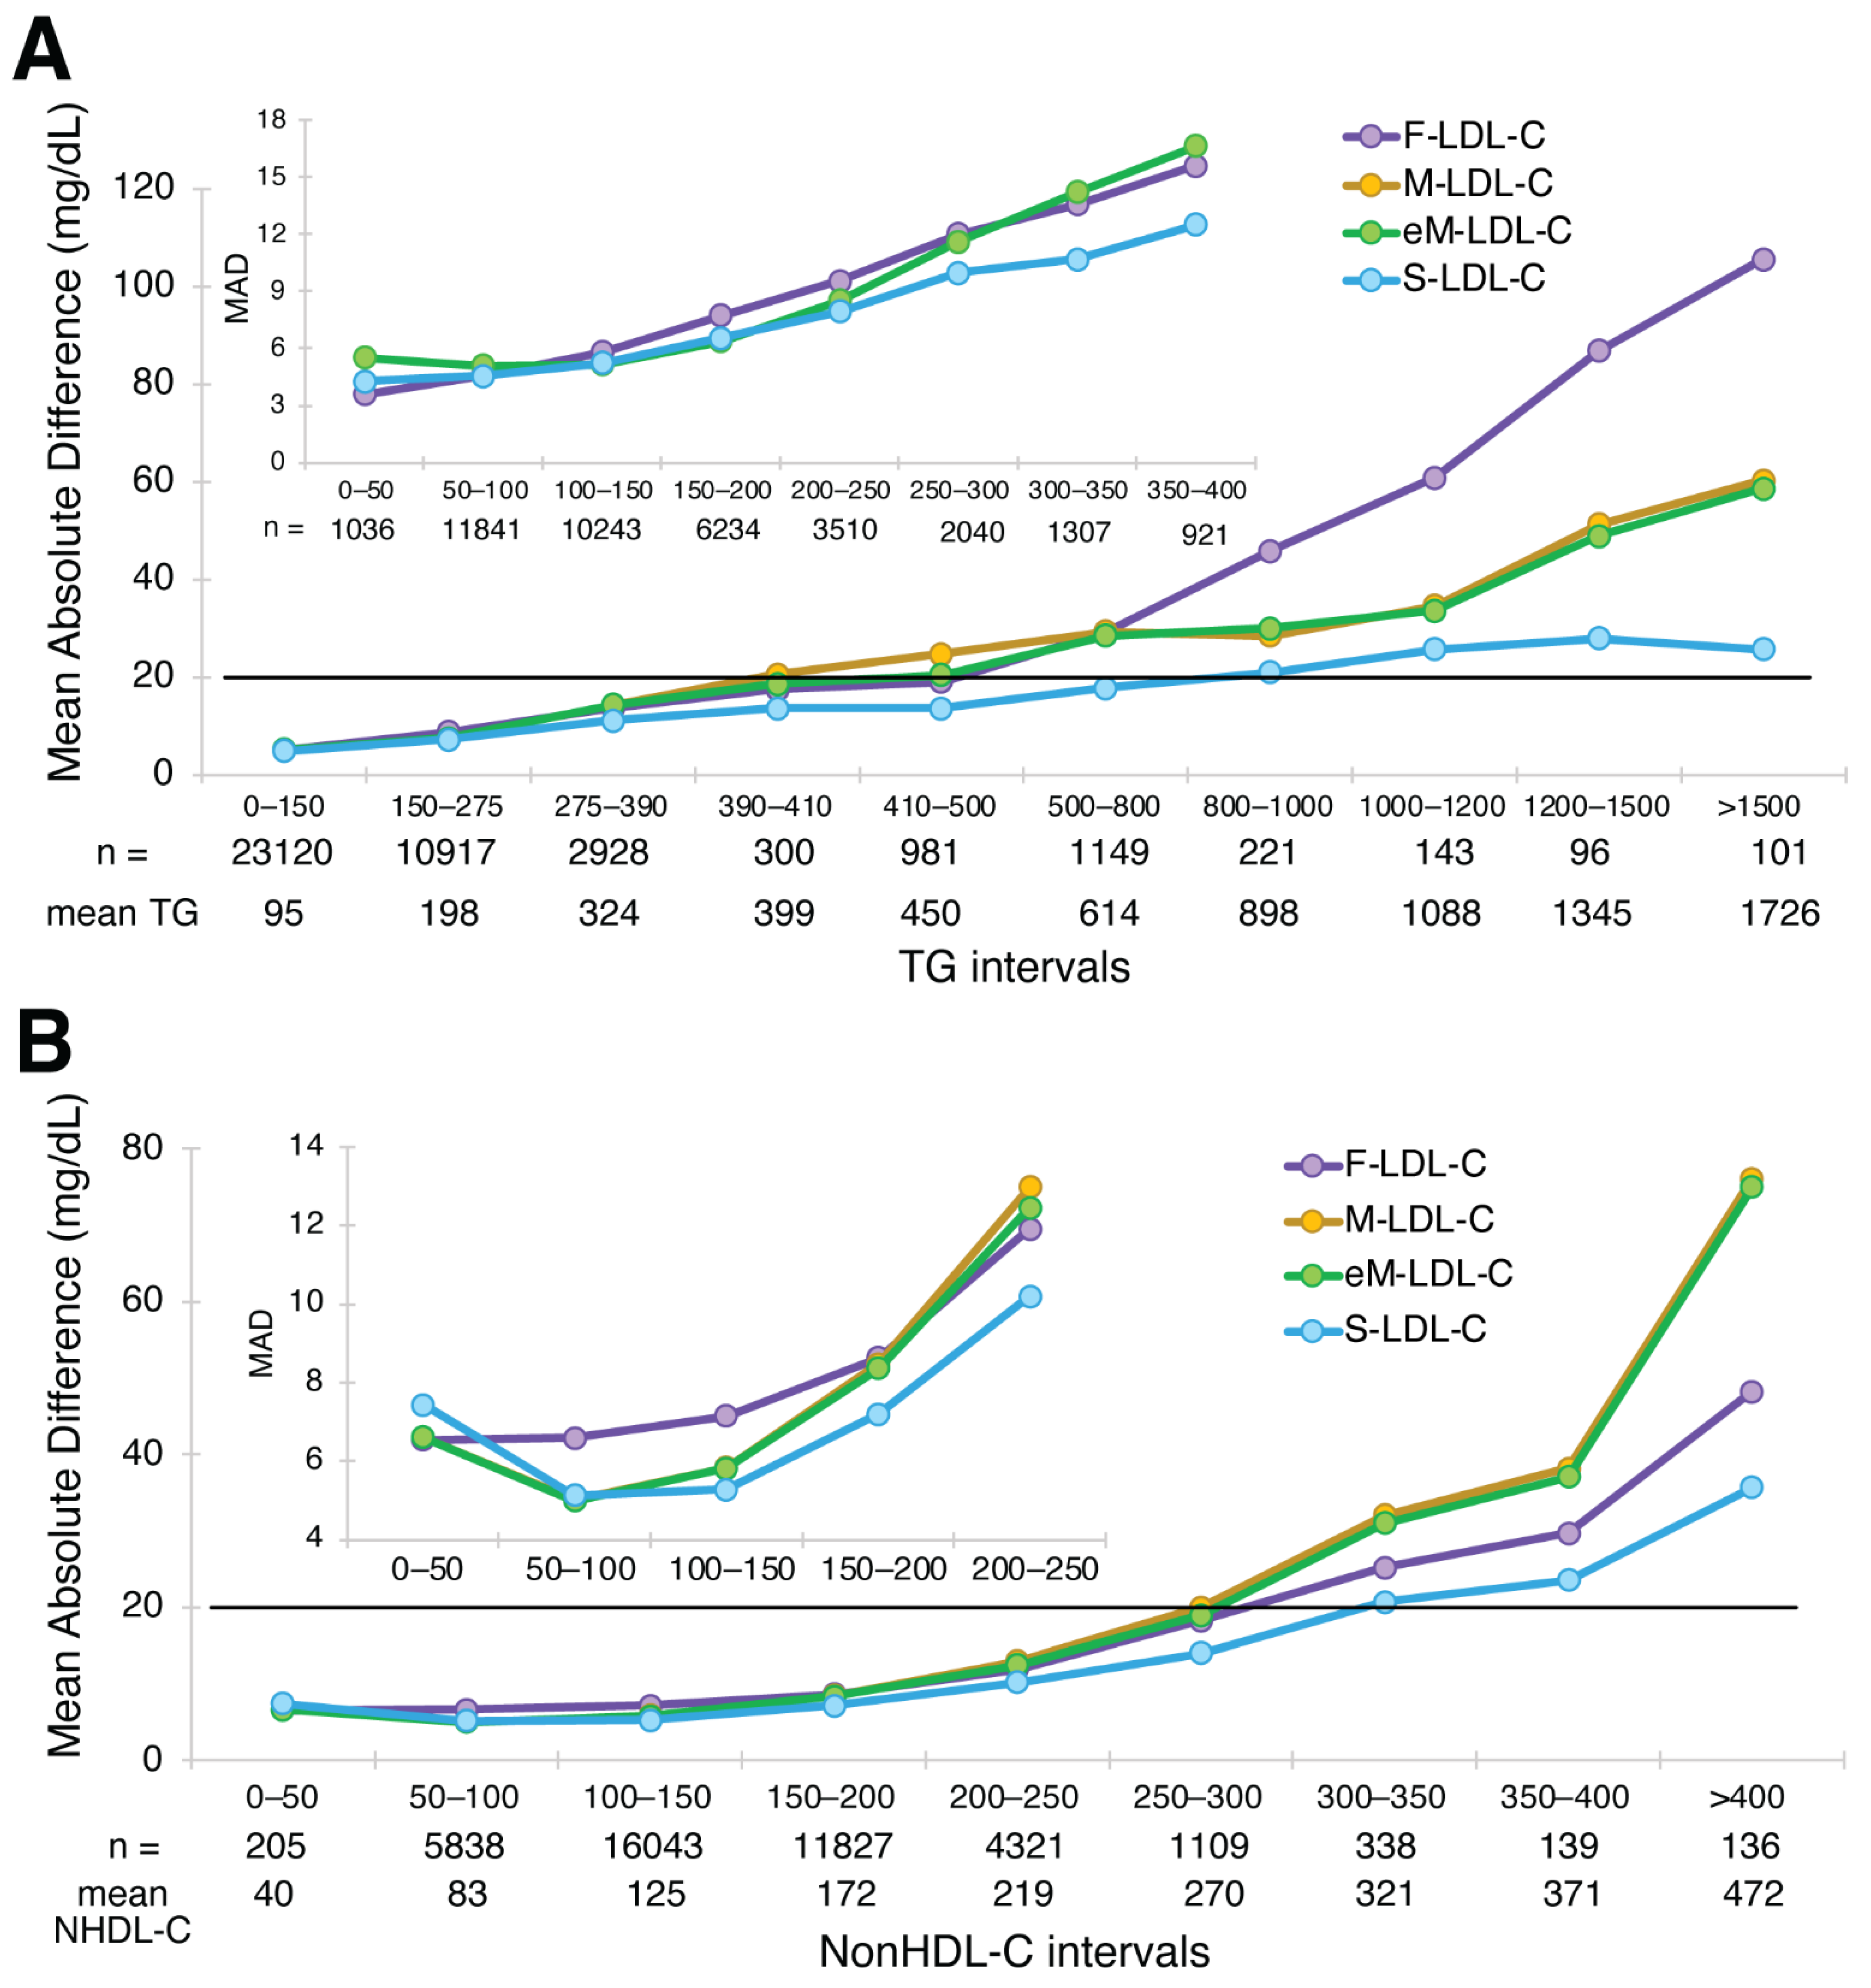
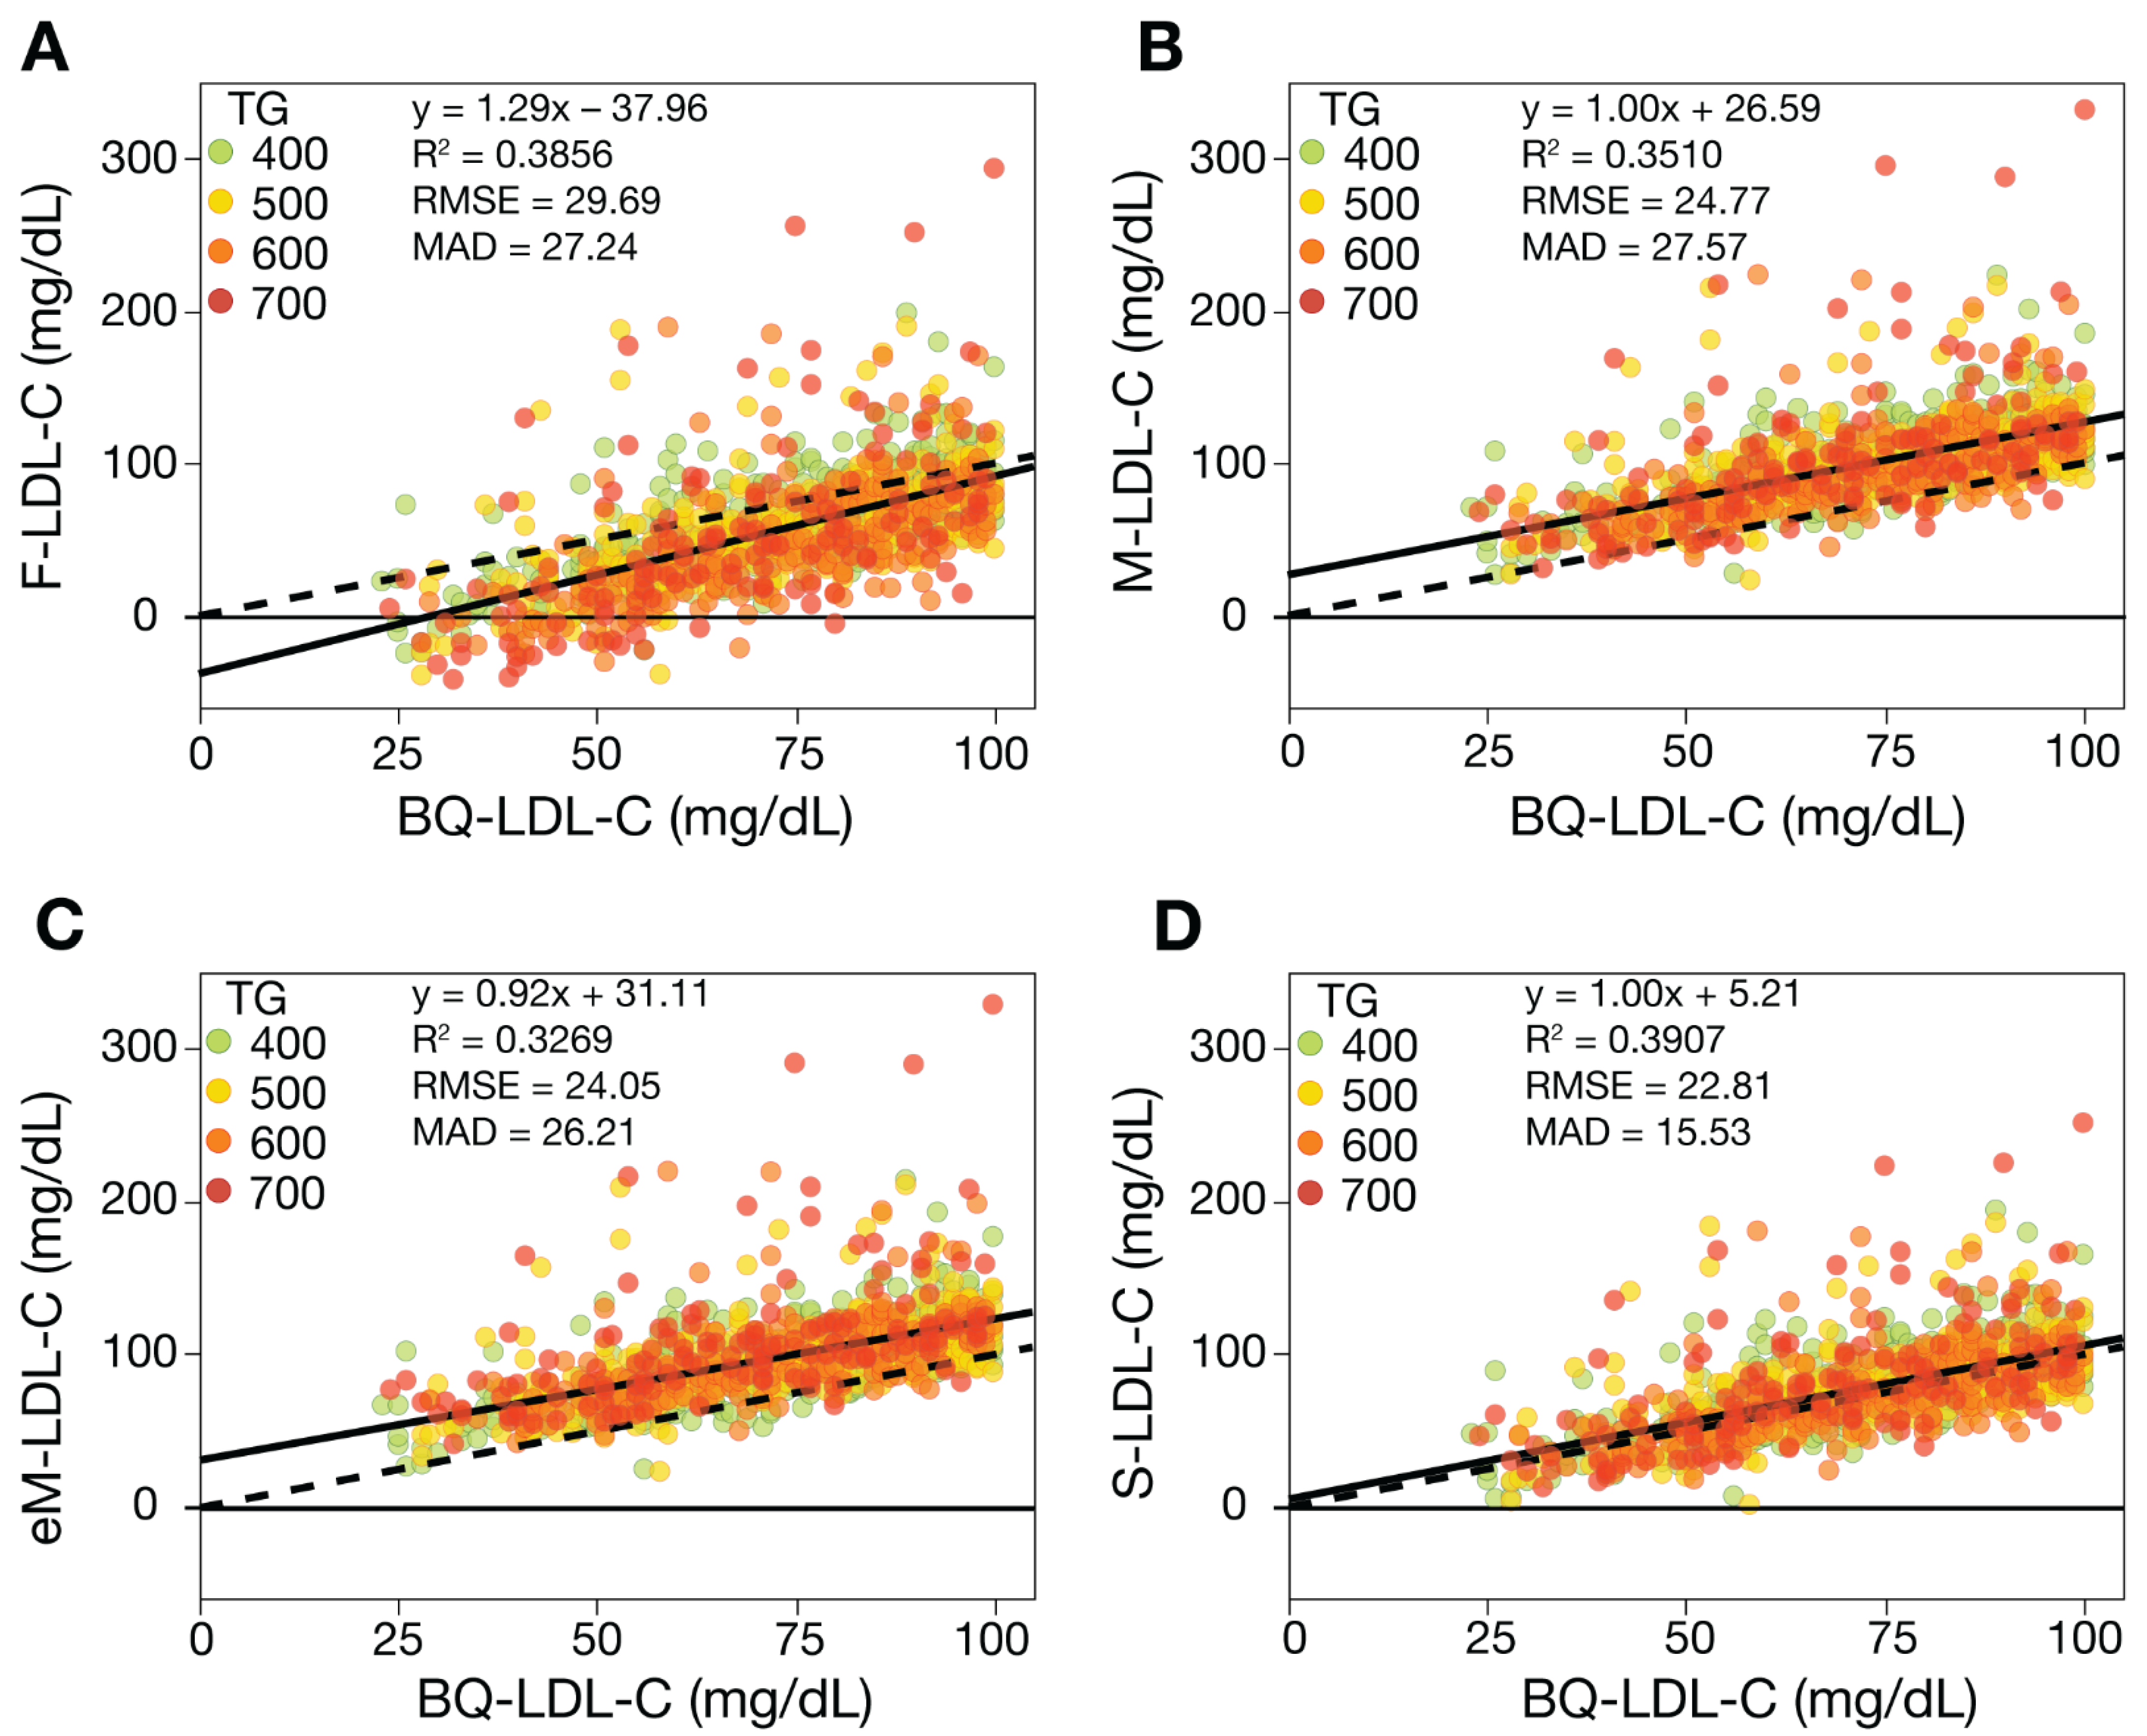
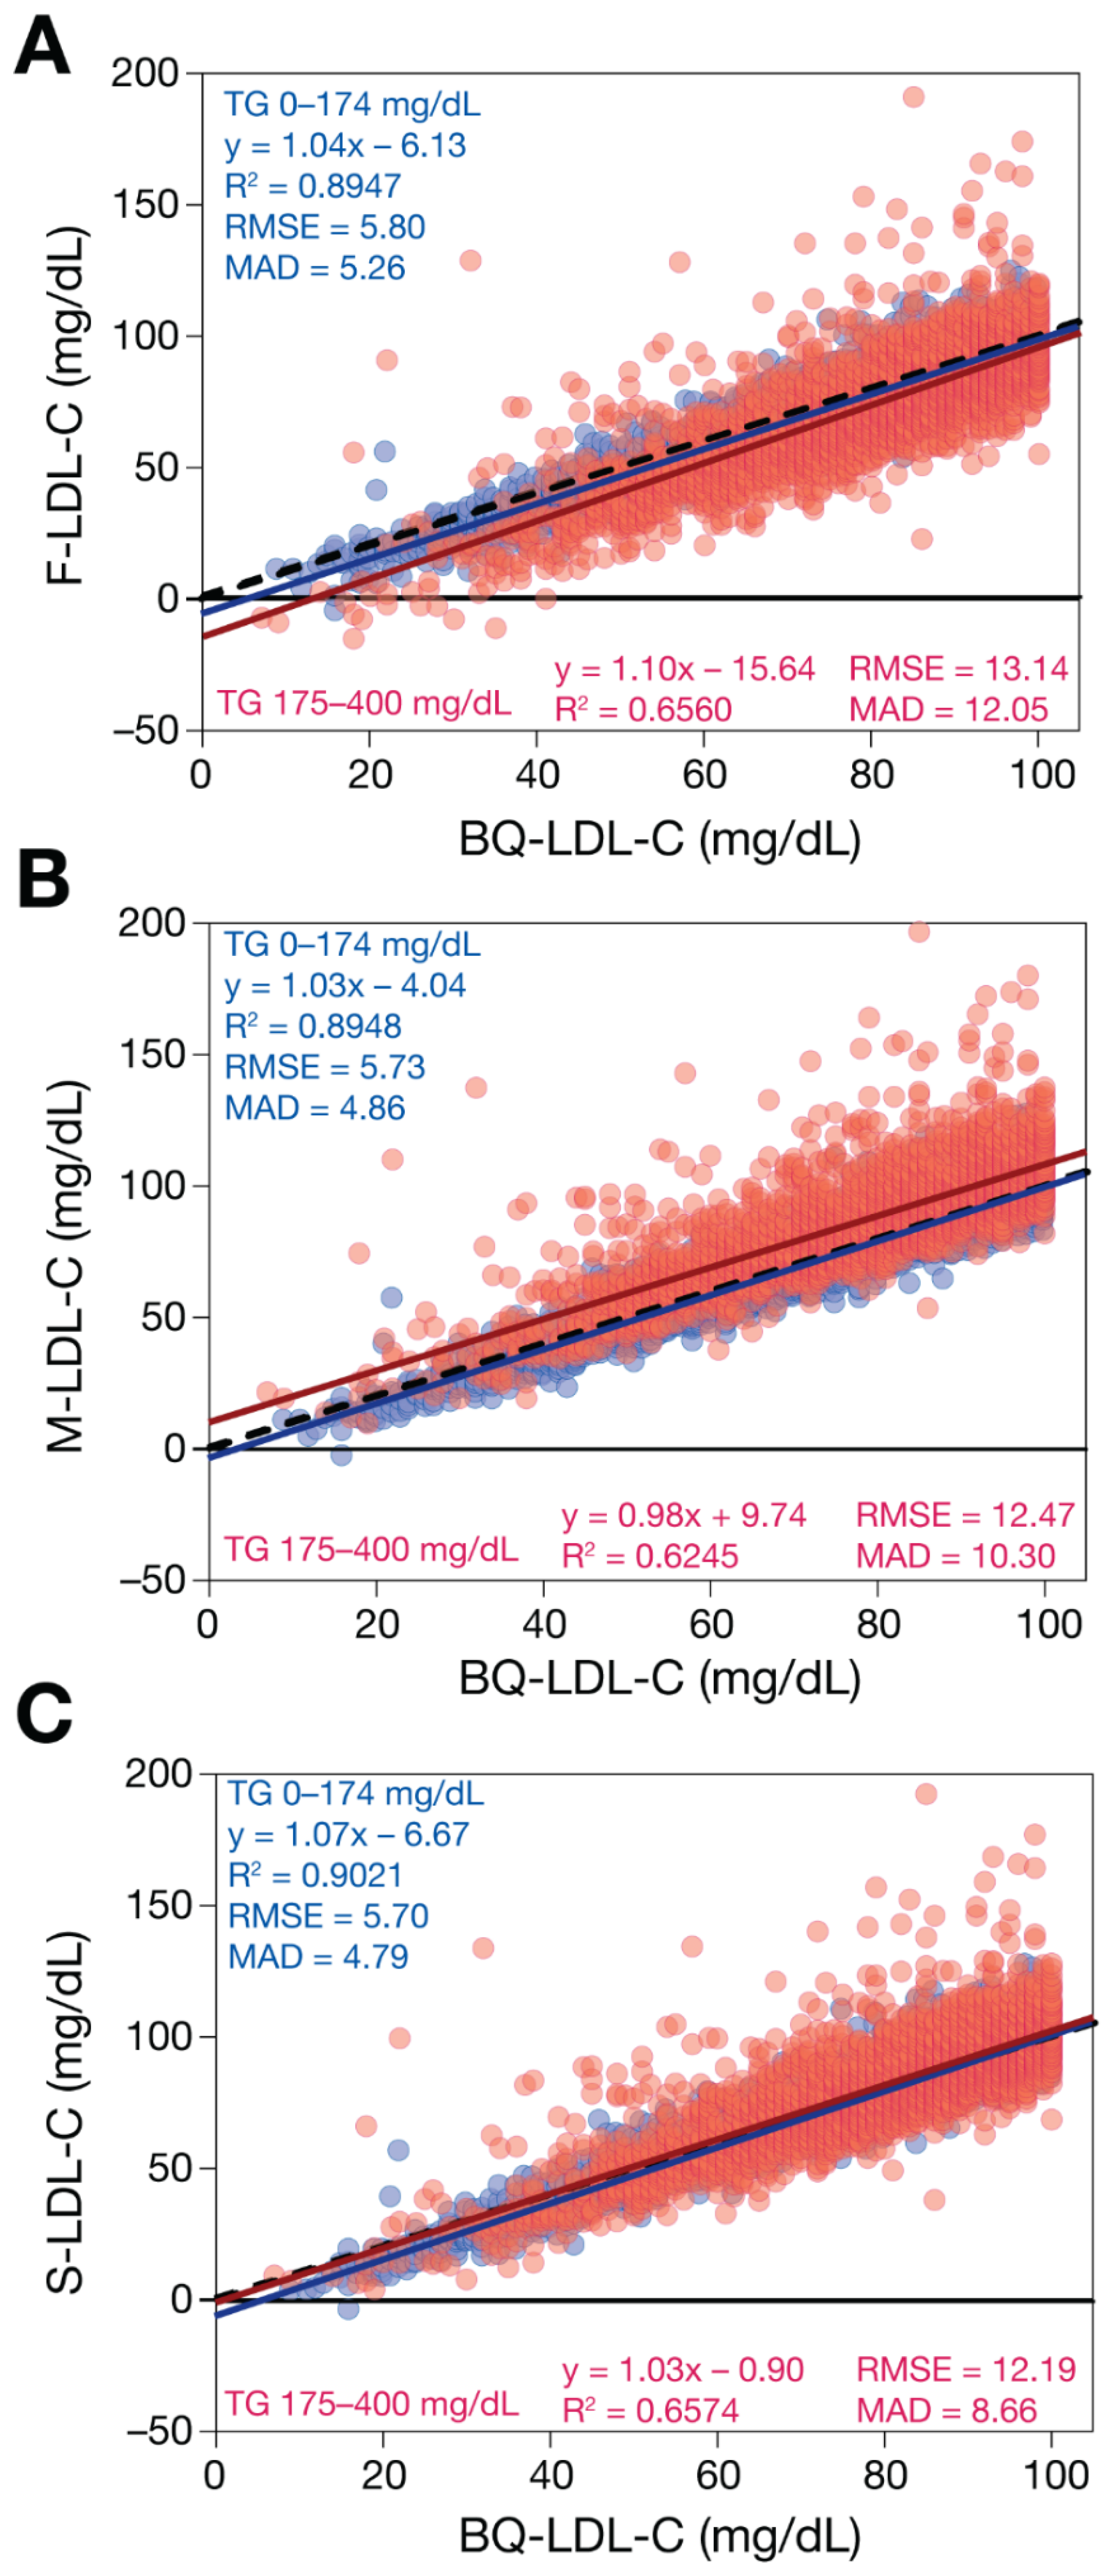
3. Results
4. Discussion
Supplementary Materials
Author Contributions
Funding
Institutional Review Board Statement
Informed Consent Statement
Data Availability Statement
Conflicts of Interest
Abbreviations
| apoB | Apolipoprotein B |
| ASCVD | Atherosclerotic Cardiovascular Diseases |
| BQ | β-quantification reference method |
| eM-LDL-C | Extended Martin equation for LDL-C |
| F-LDL-C | Friedewald equation for LDL-C |
| S-LDL-C | Sampson equation for LDL-C |
| LDL-C | Low-density lipoprotein-cholesterol |
| M-LDL-C | Martin equation for LDL-C |
| PCSK9 | Proprotein convertase subtilisin/kexin type 9 |
| HTG | Hypertriglyceridemia/hypertriglyceridemic |
References
- Ference, B.A.; Ginsberg, H.N.; Graham, I.; Ray, K.K.; Packard, C.J.; Bruckert, E.; Hegele, R.A.; Krauss, R.M.; Raal, F.J.; Schunkert, H.; et al. Low-density lipoproteins cause atherosclerotic cardiovascular disease. 1. Evidence from genetic, epidemiologic, and clinical studies. A consensus statement from the European Atherosclerosis Society Consensus Panel. Eur. Heart J. 2017, 38, 2459–2472. [Google Scholar] [CrossRef] [PubMed]
- Sniderman, A.D.; Thanassoulis, G.; Glavinovic, T.; Navar, A.M.; Pencina, M.; Catapano, A.; Ference, B.A. Apolipoprotein B Particles and Cardiovascular Disease: A Narrative Review. JAMA Cardiol. 2019, 4, 1287–1295. [Google Scholar] [CrossRef] [PubMed]
- Cole, J.; Otvos, J.D.; Remaley, A.T. A Translational Tool to Facilitate Use of Apolipoprotein B for Clinical Decision-Making. Clin. Chem. 2022. [Google Scholar] [CrossRef] [PubMed]
- Grundy, S.M.; Stone, N.J.; Bailey, A.L.; Beam, C.; Birtcher, K.K.; Blumenthal, R.S.; Braun, L.T.; de Ferranti, S.; Faiella-Tommasino, J.; Forman, D.E.; et al. 2018 AHA/ACC/AACVPR/AAPA/ABC/ACPM/ADA/AGS/APhA/ASPC/NLA/PCNA Guideline on the Management of Blood Cholesterol: A Report of the American College of Cardiology/American Heart Association Task Force on Clinical Practice Guidelines. Circulation 2019, 139, e1082–e1143. [Google Scholar]
- Chaudhary, R.; Garg, J.; Shah, N.; Sumner, A. PCSK9 inhibitors: A new era of lipid lowering therapy. World J. Cardiol. 2017, 9, 76–91. [Google Scholar] [CrossRef]
- Everett, M.B.; Smith, R.J.; Hiatt, W.R. Reducing LDL with PCSK9 Inhibitors—The Clinical Benefit of Lipid Drugs. N. Engl. J. Med. 2015, 373, 1588–1591. [Google Scholar] [CrossRef]
- Lloyd-Jones, D.M.; Morris, P.B.; Ballantyne, C.M.; Birtcher, K.K.; Covington, A.M.; DePalma, S.M.; Minissian, M.B.; Orringer, C.E.; Smith, S.C., Jr.; Waring, A.A.; et al. 2022 ACC Expert Consensus Decision Pathway on the Role of Nonstatin Therapies for LDL-Cholesterol Lowering in the Management of Atherosclerotic Cardiovascular Disease Risk: A Report of the American College of Cardiology Solution Set Oversight Committee. J. Am. Coll. Cardiol. 2022, 80, 1366–1418. [Google Scholar] [CrossRef] [PubMed]
- Visseren, F.L.; Mach, F.; Smulders, Y.M.; Carballo, D.; Koskinas, K.C.; Bäck, M.; Benetos, A.; Biffi, A.; Boavida, J.-M.; Capodanno, D.; et al. 2021 ESC Guidelines on cardiovascular disease prevention in clinical practice: Developed by the Task Force for cardiovascular disease prevention in clinical practice with representatives of the European Society of Cardiology and 12 medical societies With the special contribution of the European Association of Preventive Cardiology (EAPC). Eur. Heart J. 2021, 42, 3227–3337. [Google Scholar]
- Friedewald, T.W.; Levy, R.I.; Fredrickson, D.S. Estimation of the concentration of low-density lipoprotein cholesterol in plasma, without use of the preparative ultracentrifuge. Clin. Chem. 1972, 18, 499–502. [Google Scholar] [CrossRef]
- Wolska, A.; Remaley, A.T. Measuring LDL-cholesterol: What is the best way to do it? Curr. Opin. Cardiol. 2020, 35, 405–411. [Google Scholar] [CrossRef]
- Hainline, A., Jr.; Karon, J.; Lippel, K. (Eds.) Manual of Laboratory Operations: Lipid and Lipoprotein Analysis, 2nd ed.; HEW Pub. No. (NIH) 75-628 (rev.), US Government Printing Office Publication No. 1982-361-132:678; National Heart, Lung and Blood Institute, Lipid Research Clinics Program: Bethesda, MD, USA, 1982. [Google Scholar]
- Bachorik, S.P.; Ross, J.W. National Cholesterol Education Program recommendations for measurement of low-density lipoprotein cholesterol: Executive summary. The National Cholesterol Education Program Working Group on Lipoprotein Measurement. Clin. Chem. 1995, 41, 1414–1420. [Google Scholar] [CrossRef] [PubMed]
- Nauck, M.; Warnick, G.R.; Rifai, N. Methods for measurement of LDL-cholesterol: A critical assessment of direct measurement by homogeneous assays versus calculation. Clin. Chem. 2002, 48, 236–254. [Google Scholar] [CrossRef] [PubMed]
- Fukuyama, N.; Homma, K.; Wakana, N.; Kudo, K.; Suyama, A.; Ohazama, H.; Tsuji, C.; Ishiwata, K.; Eguchi, Y.; Nakazawa, H.; et al. Validation of the Friedewald Equation for Evaluation of Plasma LDL-Cholesterol. J. Clin. Biochem. Nutr. 2008, 43, 1–5. [Google Scholar] [CrossRef]
- Martin, S.S.; Blaha, M.J.; Elshazly, M.B.; Brinton, E.A.; Toth, P.P.; McEvoy, J.W.; Joshi, P.H.; Kulkarni, K.R.; Mize, P.D.; Kwiterovich, P.O.; et al. Friedewald-estimated versus directly measured low-density lipoprotein cholesterol and treatment implications. J. Am. Coll. Cardiol. 2013, 62, 732–739. [Google Scholar] [CrossRef] [PubMed]
- Sampson, M.; Ling, C.; Sun, Q.; Harb, R.; Ashmaig, M.; Warnick, R.; Sethi, A.; Fleming, J.K.; Otvos, J.D.; Meeusen, J.W.; et al. A New Equation for Calculation of Low-Density Lipoprotein Cholesterol in Patients With Normolipidemia and/or Hypertriglyceridemia. JAMA Cardiol. 2020, 5, 540–548. [Google Scholar] [CrossRef] [PubMed]
- Martin, S.S.; Giugliano, R.; Murphy, S.A.; Wasserman, S.M.; Stein, E.A.; Ceška, R.; Lopez-Miranda, J.; Georgiev, B.; Lorenzatti, A.J.; Tikkanen, M.J.; et al. Comparison of Low-Density Lipoprotein Cholesterol Assessment by Martin/Hopkins Estimation, Friedewald Estimation, and Preparative Ultracentrifugation: Insights From the FOURIER Trial. JAMA Cardiol. 2018, 3, 749–753. [Google Scholar] [CrossRef]
- Brinton, E.A. Management of Hypertriglyceridemia for Prevention of Atherosclerotic Cardiovascular Disease. Endocrinol. Metab. Clin. North Am. 2016, 45, 185–204. [Google Scholar] [CrossRef]
- Chung, B.H.; Wilkinson, T.; Geer, J.C.; Segrest, J.P. Preparative and quantitative isolation of plasma lipoproteins: Rapid, single discontinuous density gradient ultracentrifugation in a vertical rotor. J. Lipid. Res. 1980, 21, 284–291. [Google Scholar] [CrossRef]
- Martin, S.S.; Blaha, M.J.; Elshazly, M.; Toth, P.P.; Kwiterovich, P.O.; Blumenthal, R.S.; Jones, S.R. Comparison of a Novel Method vs the Friedewald Equation for Estimating Low-Density Lipoprotein Cholesterol Levels From the Standard Lipid Profile. JAMA 2013, 310, 2061–2068. [Google Scholar] [CrossRef]
- Sajja, A.; Park, J.; Sathiyakumar, V.; Varghese, B.; Pallazola, V.A.; Marvel, F.A.; Kulkarni, K.; Muthukumar, A.; Joshi, P.H.; Gianos, E.; et al. Comparison of Methods to Estimate Low-Density Lipoprotein Cholesterol in Patients With High Triglyceride Levels. JAMA Netw. Open 2021, 4, e2128817. [Google Scholar] [CrossRef]
- Clarke, W.L.; Cox, D.; Gonder-Frederick, L.A.; Carter, W.; Pohl, S.L. Evaluating clinical accuracy of systems for self-monitoring of blood glucose. Diabetes Care 1987, 10, 622–628. [Google Scholar] [CrossRef] [PubMed]
- Meeusen, J.W.; Lueke, A.J.; Jaffe, A.S.; Saenger, A.K. Validation of a proposed novel equation for estimating LDL cholesterol. Clin. Chem. 2014, 60, 1519–1523. [Google Scholar] [CrossRef] [PubMed]
- Meeusen, J.W.; Snozek, C.L.; Baumann, N.A.; Jaffe, A.S.; Saenger, A.K. Reliability of Calculated Low-Density Lipoprotein Cholesterol. Am. J. Cardiol. 2015, 116, 538–540. [Google Scholar] [CrossRef]
- Chicco, D.; Tötsch, N.; Jurman, G. The Matthews correlation coefficient (MCC) is more reliable than balanced accuracy, bookmaker informedness, and markedness in two-class confusion matrix evaluation. BioData Min. 2021, 14, 13. [Google Scholar] [CrossRef] [PubMed]
- Stone, N.J.; Robinson, J.G.; Lichtenstein, A.H.; Bairey Merz, C.N.; Blum, C.B.; Eckel, R.H.; Goldberg, A.C.; Gordon, D.; Levy, D.; Lloyd-Jones, D.M.; et al. 2013 ACC/AHA Guideline on the Treatment of Blood Cholesterol to Reduce Atherosclerotic Cardiovascular Risk in Adults. Circulation 2014, 129 (Suppl. S2), S1–S45. [Google Scholar] [CrossRef] [PubMed]
- Ginsberg, H.N.; Rosenson, R.S.; Hovingh, G.K.; Letierce, A.; Samuel, R.; Poulouin, Y.; Cannon, C.P. LDL-C calculated by Friedewald, Martin-Hopkins, or NIH equation 2 versus beta-quantification: Pooled alirocumab trials. J. Lipid Res. 2022, 63, 100148. [Google Scholar] [CrossRef]
- Higgins, V.; Leiter, L.A.; Delaney, S.R.; Beriault, D.R. Validating the NIH LDL-C equation in a specialized lipid cohort: Does it add up? Clin. Biochem. 2022, 99, 60–68. [Google Scholar] [CrossRef] [PubMed]
- Li, J.; Xin, Y.; Li, J.; Meng, M.; Zhou, L.; Qiu, H.; Chen, H.; Li, H. Evaluation of Sampson equation for LDL-C in acute coronary syndrome patients: A Chinese population-based cohort study. Lipids Health Dis. 2022, 21, 39. [Google Scholar] [CrossRef]
- Habeeb, N.M.W.-A.; Higgins, V.; Venner, A.A.; Bailey, D.; Beriault, D.R.; Collier, C.; Adeli, K. Canadian Society of Clinical Chemists Harmonized Clinical Laboratory Lipid Reporting Recommendations on the Basis of the 2021 Canadian Cardiovascular Society Lipid Guidelines. Can. J. Cardiol. 2022, 38, 1180–1188. [Google Scholar] [CrossRef]
- Hopkins, N.P.; Brinton, E.A.; Nanjee, M.N. Hyperlipoproteinemia type 3: The forgotten phenotype. Curr. Atheroscler Rep. 2014, 16, 440. [Google Scholar] [CrossRef]
- Kulkarni, K.R.; Garber, D.W.; Marcovina, S.M.; Segrest, J.P. Quantification of cholesterol in all lipoprotein classes by the VAP-II method. J. Lipid Res. 1994, 35, 159–168. [Google Scholar] [CrossRef] [PubMed]
- Martins, J.; Rossouw, H.M.; Pillay, T.S. How should low-density lipoprotein cholesterol be calculated in 2022? Curr. Opin. Lipidol. 2022, 33, 237–256. [Google Scholar] [CrossRef] [PubMed]
- Miller, W.G.; Myers, G.L.; Sakurabayashi, I.; Bachmann, L.M.; Caudill, S.P.; Dziekonski, A.; Edwards, S.; Kimberly, M.M.; Korzun, W.J.; Leary, E.T.; et al. Seven Direct Methods for Measuring HDL and LDL Cholesterol Compared with Ultracentrifugation Reference Measurement Procedures. Clin. Chem. 2010, 56, 977–986. [Google Scholar] [CrossRef] [PubMed]
- Ioannidis, J.P. Why most published research findings are false. PLoS Med. 2005, 2, e124. [Google Scholar] [CrossRef]
- Glaros, G.A.; Kline, R.B. Understanding the accuracy of tests with cutting scores: The sensitivity, specificity, and predictive value model. J. Clin. Psychol. 1988, 44, 1013–1023. [Google Scholar] [CrossRef]
- Shreffler, J.H.M. Diagnostic Testing Accuracy: Sensitivity, Specificity, Predictive Values and Likelihood Ratios. 2022 Updated 9 March 2022. Available online: https://www.ncbi.nlm.nih.gov/books/NBK557491/ (accessed on 17 October 2022).
- Zhao, J.P.; Hegele, R.A. The impact of low-density lipoprotein equation changes on cholesterol treatment in Canada. CJC Open 2022. [Google Scholar] [CrossRef]


| TG 0–400 mg/dL | ||||||||||
|---|---|---|---|---|---|---|---|---|---|---|
| TP | TN | FP | FN | ppv | npv | Sensitivity | Specificity | BA | nMCC | |
| BQ-LDL-C 40–69 mg/dL | ||||||||||
| F-LDL-C | 2719 | 32,342 | 1495 | 594 | 64.5 | 98.2 | 82.1 | 95.6 | 88.8 | 0.849 |
| M-LDL-C | 2675 | 33,077 | 760 | 638 | 77.9 | 98.1 | 80.7 | 97.8 | 89.2 | 0.886 |
| S-LDL-C | 2770 | 32,912 | 925 | 543 | 75.0 | 98.4 | 83.6 | 97.3 | 90.4 | 0.885 |
| BQ-LDL-C 70–99 mg/dL | ||||||||||
| F-LDL-C | 7320 | 25,613 | 2173 | 2044 | 77.1 | 92.6 | 78.2 | 92.2 | 85.2 | 0.850 |
| M-LDL-C | 7471 | 26,108 | 1678 | 1893 | 81.7 | 93.2 | 79.8 | 94.0 | 86.9 | 0.872 |
| S-LDL-C | 7544 | 26,248 | 1538 | 1820 | 83.1 | 93.5 | 80.6 | 94.5 | 87.5 | 0.879 |
| BQ-LDL-C 100–129 mg/dL | ||||||||||
| F-LDL-C | 8405 | 24,196 | 1807 | 2742 | 82.3 | 89.8 | 75.4 | 93.1 | 84.2 | 0.851 |
| M-LDL-C | 8643 | 23,944 | 2059 | 2504 | 80.8 | 90.5 | 77.5 | 92.1 | 84.8 | 0.852 |
| S-LDL-C | 8765 | 24,342 | 1661 | 2382 | 84.1 | 91.1 | 78.6 | 93.6 | 86.1 | 0.868 |
| BQ-LDL-C 130–159 mg/dL | ||||||||||
| F-LDL-C | 5636 | 28,282 | 1447 | 1785 | 79.6 | 94.1 | 75.9 | 95.1 | 85.5 | 0.862 |
| M-LDL-C | 5747 | 27,857 | 1872 | 1674 | 75.4 | 94.3 | 77.4 | 93.7 | 85.6 | 0.852 |
| S-LDL-C | 5886 | 28,113 | 1616 | 1535 | 78.5 | 94.8 | 79.3 | 94.6 | 86.9 | 0.868 |
| BQ-LDL-C 160–189 mg/dL | ||||||||||
| F-LDL-C | 2620 | 32,848 | 759 | 923 | 77.5 | 97.3 | 73.9 | 97.7 | 85.8 | 0.866 |
| M-LDL-C | 2680 | 32,592 | 1015 | 863 | 72.5 | 97.4 | 75.6 | 97.0 | 86.3 | 0.856 |
| S-LDL-C | 2785 | 32,665 | 942 | 758 | 74.7 | 97.7 | 78.6 | 97.2 | 87.9 | 0.871 |
| TG 401–800 mg/dL | ||||||||||
| TP | TN | FP | FN | ppv | npv | sensitivity | specificity | BA | nMCC | |
| BQ-LDL-C 40–69 mg/dL | ||||||||||
| F-LDL-C | 111 | 1543 | 312 | 283 | 26.2 | 84.5 | 28.2 | 83.2 | 55.7 | 0.555 |
| M-LDL-C | 110 | 1814 | 41 | 284 | 72.8 | 86.5 | 27.9 | 97.8 | 62.9 | 0.695 |
| eM-LDL-C | 103 | 1815 | 40 | 291 | 72.0 | 86.2 | 26.1 | 97.8 | 62.0 | 0.687 |
| S-LDL-C | 218 | 1736 | 119 | 176 | 64.7 | 90.8 | 55.3 | 93.6 | 74.5 | 0.760 |
| BQ-LDL-C 70–99 mg/dL | ||||||||||
| F-LDL-C | 224 | 1354 | 249 | 422 | 47.4 | 76.2 | 34.7 | 84.5 | 59.6 | 0.606 |
| M-LDL-C | 205 | 1371 | 232 | 441 | 46.9 | 75.7 | 31.7 | 85.5 | 58.6 | 0.599 |
| eM-LDL-C | 236 | 1357 | 246 | 410 | 49.0 | 76.8 | 36.5 | 84.7 | 60.6 | 0.617 |
| S-LDL-C | 374 | 1384 | 219 | 272 | 63.1 | 83.6 | 57.9 | 86.3 | 72.1 | 0.727 |
| BQ-LDL-C 100–129 mg/dL | ||||||||||
| F-LDL-C | 241 | 1497 | 191 | 320 | 55.8 | 82.4 | 43.0 | 88.7 | 65.8 | 0.674 |
| M-LDL-C | 197 | 1283 | 405 | 364 | 32.7 | 77.9 | 35.1 | 76.0 | 55.6 | 0.554 |
| eM-LDL-C | 250 | 1282 | 406 | 311 | 38.1 | 80.5 | 44.6 | 75.9 | 60.3 | 0.598 |
| S-LDL-C | 306 | 1452 | 236 | 255 | 56.5 | 85.1 | 54.5 | 86.0 | 70.3 | 0.705 |
| BQ-LDL-C 130–159 mg/dL | ||||||||||
| F-LDL-C | 121 | 1819 | 122 | 187 | 49.8 | 90.7 | 39.3 | 93.7 | 66.5 | 0.683 |
| M-LDL-C | 146 | 1567 | 374 | 162 | 28.1 | 90.6 | 47.4 | 80.7 | 64.1 | 0.615 |
| eM-LDL-C | 181 | 1616 | 325 | 127 | 35.8 | 92.7 | 58.8 | 83.3 | 71.0 | 0.673 |
| S-LDL-C | 175 | 1752 | 189 | 133 | 48.1 | 92.9 | 56.8 | 90.3 | 73.5 | 0.720 |
| BQ-LDL-C 160–189 mg/dL | ||||||||||
| F-LDL-C | 66 | 2027 | 81 | 75 | 44.9 | 96.4 | 46.8 | 96.2 | 71.5 | 0.711 |
| M-LDL-C | 55 | 1920 | 188 | 86 | 22.6 | 95.7 | 39.0 | 91.1 | 65.0 | 0.617 |
| eM-LDL-C | 58 | 1977 | 131 | 83 | 30.7 | 96.0 | 41.1 | 93.8 | 67.5 | 0.653 |
| S-LDL-C | 78 | 2015 | 93 | 63 | 45.6 | 97.0 | 55.3 | 95.6 | 75.5 | 0.733 |
Publisher’s Note: MDPI stays neutral with regard to jurisdictional claims in published maps and institutional affiliations. |
© 2022 by the authors. Licensee MDPI, Basel, Switzerland. This article is an open access article distributed under the terms and conditions of the Creative Commons Attribution (CC BY) license (https://creativecommons.org/licenses/by/4.0/).
Share and Cite
Sampson, M.; Wolska, A.; Cole, J.; Zubirán, R.; Otvos, J.D.; Meeusen, J.W.; Donato, L.J.; Jaffe, A.S.; Remaley, A.T. Accuracy and Clinical Impact of Estimating Low-Density Lipoprotein-Cholesterol at High and Low Levels by Different Equations. Biomedicines 2022, 10, 3156. https://doi.org/10.3390/biomedicines10123156
Sampson M, Wolska A, Cole J, Zubirán R, Otvos JD, Meeusen JW, Donato LJ, Jaffe AS, Remaley AT. Accuracy and Clinical Impact of Estimating Low-Density Lipoprotein-Cholesterol at High and Low Levels by Different Equations. Biomedicines. 2022; 10(12):3156. https://doi.org/10.3390/biomedicines10123156
Chicago/Turabian StyleSampson, Maureen, Anna Wolska, Justine Cole, Rafael Zubirán, James D. Otvos, Jeff W. Meeusen, Leslie J. Donato, Allan S. Jaffe, and Alan T. Remaley. 2022. "Accuracy and Clinical Impact of Estimating Low-Density Lipoprotein-Cholesterol at High and Low Levels by Different Equations" Biomedicines 10, no. 12: 3156. https://doi.org/10.3390/biomedicines10123156
APA StyleSampson, M., Wolska, A., Cole, J., Zubirán, R., Otvos, J. D., Meeusen, J. W., Donato, L. J., Jaffe, A. S., & Remaley, A. T. (2022). Accuracy and Clinical Impact of Estimating Low-Density Lipoprotein-Cholesterol at High and Low Levels by Different Equations. Biomedicines, 10(12), 3156. https://doi.org/10.3390/biomedicines10123156