Abstract
Adipose tissue-derived stromal cells (ASCs) play an important role in various therapeutic approaches to bone regeneration. However, such applications become challenging when the obtained cells show a functional disorder, e.g., an impaired osteogenic differentiation potential (ODP). In addition to ASCs, human adipose tissue is also a source for another cell type with therapeutic potential, the dedifferentiated fat cells (DFATs), which can be obtained from mature adipocytes. Here, we for the first time compared the ODPs of each donors ASC and DFAT obtained from the same adipose tissue sample as well as the role of oxidative stress or antioxidative catalase on their osteogenic outcome. Osteogenic potential of ASC and DFAT from nine human donors were compared in vitro. Flow cytometry, staining for calcium accumulation with alizarin red, alkaline phosphatase assay and Western blots were used over an osteogenic induction period of up to 14 days. H2O2 was used to induce oxidative stress and catalase was used as an antioxidative measure. We have found that ASC and DFAT cultures’ ODPs are nearly identical. If ASCs from an adipose tissue sample showed good or bad ODP, so did the corresponding DFAT cultures. The inter-individual variability of the donor ODPs was immense with a maximum factor of about 20 and correlated neither with the age nor the sex of the donors of the adipose tissue. Oxidative stress in the form of exogenously added H2O2 led to a significant ODP decrease in both cell types, with this ODP decrease being significantly lower in DFAT cultures than in the corresponding ASC cultures. Regardless of the individual cell culture-specific ODP, however, exogenously applied catalase led to an approx. 2.5-fold increase in osteogenesis in the ASC and DFAT cultures. Catalase appears to be a potent pro-osteogenic factor, at least in vitro. A new finding that points to innovative strategies and therapeutic approaches in bone regeneration. Furthermore, our results show that DFATs behave similarly to ASCs of the same adipose tissue sample with respect to ODPs and could therefore be a very attractive and readily available source of multipotent stem cells in bone regenerative therapies.
1. Introduction
Healing critical size bone defects and osteoporotic bones is still a major challenge for both the patient and the attending physician [1]. Either the defect is too large to properly heal on its own or other factors hinder sufficient recovery [2,3]. Mesenchymal stromal stem cells (MSC) like bone marrow derived stromal stem cells (BMSC) can already be used to treat some of these conditions [4,5]. Although bone marrow has long been regarded as the most suitable source for therapeutically relevant MSCs, there is now much more focus on other adult tissue types that are promising sources for potent MSC, such as adipose tissue [6].
The adipose tissue is an efficient source for the isolation of large quantities of adipose tissue-derived stroma cells (ASC). ASCs are a heterogenic cell population consisting of fibroblasts, pericytes, endothelial cells, preadipocytes and hematopoetic cells [7]. Nevertheless, ASCs exhibit all properties of MSC, including the expression of MCS-typical surface markers [8]. Furthermore, a characteristic trait of ASCs is a three lineage differentiation potential to adipocytes, chondrocytes and osteoblasts [9]. In contrast to BMSCs, however, ASCs can be obtained more easily and with fewer side effects and are now much more than just another alternative cell source for regenerative therapy options. However, it should not be left unmentioned that due to the pronounced heterogeneity with regard to the cellular composition, it is much more difficult to predict the therapeutic success than when using a cell therapeutic agent with a defined cell type.
Adipose tissue contains another, but in contrast to ASC, very homologous source of a cell type with a pronounced MSC character. These are dedifferentiated fat cells (DFATs) which can be isolated from the same adipose tissue as ASCs via dedifferentiation of adipocytes by so called ceiling culture [10,11]. The resulting DFATs are a cell type of high uniformity with a fibroblast-like phenotype, ultimately losing their last lipid droplets after passaging. They exhibit the typical MSC-like antigen phenotype and have three lineage differentiation potential [10,11].
It is a well-known phenomenon that mesenchymal stromal cells can often have an impaired, disturbed or even absent osteogenic capacity. The physiological or pathophysiological factors underlying this phenomenon are extremely broad. Previous reports suggest that a decline in the number of mesenchymal stem cells or the differentiation potential of stem cell populations may contribute to human aging and age-related diseases [12,13]. In a mouse animal model, it could be shown that bone marrow cells show age-associated differences in osteoblast differentiation [14,15]. However, an age-related decrease in the osteogenic potential of human bone MSCs could also be demonstrated in humans by determining molecular parameters [16], an observation which is based on an age-related change in intrinsic factors [17,18]. Besides age, other factors also seem to influence the osteogenic differentiation potential of human mesenchymal stem cells. Some evidence suggests that obesity decreases the osteogenic differentiation capacity of ASCs. Thus, in different user models, ASC cultures isolated from lean donors showed an improved and much stronger osteogenic differentiation than ASC cultures isolated from obese donors [19].
It now seems to be generally accepted that reactive oxygen species and the associated oxidative stress represent the main molecular mechanism behind the age- or obesity-related decrease in the osteogenic potential of mesenchymal stem cells [20]. It is postulated that oxidative stress, which is characterized by an increased presence of reactive oxygen species like superoxide anion (O2−), hydroxyl radical (•OH), hydrogen peroxide (H2O2), hypochlorous acid (HOCl), peroxyl or hydroperoxyl radicals (ROO•, HOO−), plays a special role as negative factors for osteogenesis [21,22]. An increased production of ROS can be the result of external environmental factors such as smoking [23,24] or UV exposure [25,26], but also incorrectly regulated endogenous processes. Enzymes from the NADPH oxidase family play a role as do complex I and III of the mitochondrial respiratory transport chain [27,28].
On the other hand, one can assume that the protective systems of the cell with an antioxidant effect, such as the enzymes MnSOD or catalase that can effectively break down ROS, could possibly also have a positive effect on the osteogenic differentiation potential of oxidatively stressed MSC [20]. MnSOD converts highly reactive O2−. to oxygen and less reactive H2O2. Catalase reduces H2O2 to water (2 H2O2 → O2 + 2 H2O) [29]. Studies in human BMSCs showed a decrease in intracellular H2O2 and O2− levels in osteogenic differentiation as well as an upregulation of antioxidative enzymes catalase and MnSOD [30]. H2O2 addition decreased alkaline phosphatase (ALP) activity in murine preosteoblastic cells (MC3T3-E1) and BMSC (M2-10B4) cell lines [31], an important osteogenic protein which calcifies osteoblasts extracellular matrix.
In the present study, we examined in vitro the impact of oxidative stress, especially of hydrogen peroxide, on the osteogenic differentiation capacity of ASC and DFAT cultures obtained from the same human adipose tissue samples. Furthermore, we analyzed the effect of exogenously applied catalase on the osteogenic differentiation potential of osteogenic compromised human ASCs and DFATs.
2. Materials and Methods
2.1. Materials
If not indicated otherwise, all chemicals were obtained from Sigma (Deisenhofen, Germany), plastic wares were obtained from Greiner (Frickenhausen, Germany), and culture media were purchased from Gibco (Carlsbad, CA, USA).
2.2. Source of Adipose Tissue
Adipose tissue either originated from humans undergoing abdominal flap surgery or from liposuctions. In all cases it was tissue from subcutaneous areas. Donors were made anonymous but in most cases gender, age and kind of surgery were documented (see Supplementary Table S1). For most of the osteogenic experiments’ cells of n = 9 donors were used. Abdominal flap pieces were transported to the laboratory right after surgery in DMEM at 4 °C. Lipoaspirate was harvested by Coleman technique and transported at 4 °C. Transport time was about 1 h. Tissue was processed immediately after arrival at the laboratory. Samples were used with donors’ consent and in accordance with the guidelines of the ethics committee of the University Hospital Düsseldorf (study number 3634 from 17 July 2011) and in compliance with the Declaration of Helsinki Principles (revision of October 2013).
2.3. Processing of Adipose Tissue and Isolation of ASCs and Mature Adipocytes
Adipose tissue was minced under sterile conditions using Petri dish, scalpel and forceps. It was transferred to 50 mL conical tubes adding collagenase I solution in a 1:1 ratio (0.2% type: CLS 255 U/mg). Lipoaspirate was transferred into 50 mL conical tubes and centrifuged at 300 g for 10 min. Two layers were generated. The topmost layer is the layer of interest, which is transferred into new tubes in a 1:1 ratio with collagenase solution. Tissue was digested at 37 °C under gentle shaking for 1 h. Digested tissue was filtered through 100 µM gauze. Filtrate was centrifuged at 300× g for 10 min. Three layers were generated. The topmost oil was aspirated and discarded. The middle layer contained the mature adipocytes. They were transferred into new tubes for DFAT culture. The third layer was aspirated except for the cell pellet, which contained the ASC fraction. The cell pellet was washed in NaCl solution (0.9%) for 5 min at 300× g. ASCs were seeded into cell culture flasks with medium (see cultivation of ASCs and DFAT) and incubated at 37 °C and 5% CO2. On the next day, medium was exchanged to get rid of floating erythrocytes [32].
2.4. Dedifferentiation of Mature Adipocytes
DFATs were generated by ceiling culture. Then, 3 mL of mature adipocytes from the isolation process (middle layer) were seeded into T25 cell culture flasks, which were filled with medium (see Culture conditions of ASCs and DFAT cultures) up to the brim. Flasks were turned upside down and incubated at 37 °C for 10 days (Supplementary Figure S2). Floating adipocytes adhered to the tops’ plastic and started dedifferentiation, by losing their contained lipid. After 10 days, flasks were turned to their regular side. After 1 h, in which loose adipocytes and oil could float to the surface, medium was aspirated. 5 mL of fresh medium was added. Cells were then cultured under normal conditions at the bottom of the flask. They developed a fibroblast-like phenotype. After passaging no lipid droplets were observed in DFATs.
2.5. Culture Conditions of ASC and DFAT Cultures
ASCS and DFATs were cultured in DMEM with 5% FCS (1 g glucose/500 mL, + glutamine), FGF2 (2 ng/mL) and 1% penicillin/streptomycin at 37 °C and 5% CO2. Cells were expanded in T125 cell culture flasks and cryo-conserved in FCS-10% DMSO at −80 °C. Cells were transferred from passage 2 to p3 for the experimental setups. Experiments were performed in 24 well plates, 20,000 cells were seeded per well and experiments started 3 days after seeding. Each well contained 1 mL of medium. To verify equal division of the cells into the wells we used an Eppendorf Dispenser and performed CellTiter-Blue® Assay for cell viability right before switching cells to osteogenic differentiation medium. CellTiter-Blue® Assay (Promega, Mannheim, Germany) confirmed equal amounts of cells per well. Because of the antioxidant properties of catalase and thus its reducing ability of the CellTiter-Blue® dye resazurin, resulting in unreliable results, the assay was not performed in the osteogenic process.
2.6. Induction and Quantification of Osteogenic Differentiation
Osteogenic differentiation of ASCs and DFATs was induced by DMEM containing 4.5 g/L glucose, 10% FCS, 1% Penicillin/Streptomycin, 100 nM dexamethasone, 50 µM L-ascorbic-2-phosphate and 10 mM β-glycerophosphate [32] and the degree of mineralization of the extracellular matrix as main parameter of osteogenic differentiated was quantified by Alizarin Red S staining [33] exactly as described previously [34,35].
2.7. Induction and Quantification of Chondrogenic Differentiation
Chondrogenic differentiation ASCs and DFATs was induced by maintaining cell cultures in DMEM containing 4.5 g/L glucose, 1% FCS, 1% Penicillin/Streptomycin, 50 nM L-ascorbic-2-phosphate, 1125 µM insulin and 10 ng/mL TGF-β1 [36]. Proteoglycane-containing extracellular matrix as main parameter of ongoing chondrogenesis was stained by alcianblue (1% solution, Merck, Darmstadt, Germany) and extinction at 600 nm of alcianblue extracted by isopropanol/hydrochloric acid served as quantitative parameter of chondrogenic differentiation exactly as described previously [37,38].
2.8. Induction and Quantification of Adipogenic Differentiation
Adipogenic differentiation of ASCs and DFATs was achieved by cultivating cell cultures in the first week in DMEM/F12 medium containing 1% Penicillin/Streptomycin, 2 mM L-glutamine, 10 µM dexamethasone, 0.5 mM IBMX, 66 nM insulin, 1 nM trijodthyronine, 10 µg/mL transferrine, 0.1 µg/mL rosiglitazone and in the second and third week containing 1% Penicillin/Streptomycin, 2 mM L-glutamine, 1 µM dexamethasone, 66 nM insulin, 1 nM trijodthyronine and 10 µg/mL transferrine exactly as described earlier [39,40,41]. Medium was changed every 3–4 days for 21 days total. At day 21 cells lipid vesicles were stained with Nile red and fluorescence (excitation at 485 nm and emission at 535 nm) was measured with a Multilabel counter (Victor3, PerkinEllmer). Each wells Nile red values were normalized to CelltiterBlue Fluorescence (excitation: 540 nm/emission: 590 nm).
2.9. Alkaline Phosphatase (ALP) Assay
The colorimetric Alkaline Phosphatase Assay Kitt (Abcam, Cambridge, UK) was used to quantify alkaline phosphatase activity of resting and osteogenically activated ASC and DFAT cultures exactly as recommended in the manufacturer’s instructions for use.
2.10. Cell Viability Assay
Cell proliferation and cell amount was measured by evaluating the cell metabolism/viability via CellTiterBlue Assay (Promega, Manheim, Germany) following manufactures instructions.
2.11. Use of H2O2 and Antioxidants
The influence of oxidative stress onto the osteogenic differentiation potential of ASCs and DFATs was simulated by complementing the osteogenic differentiation medium with H2O2 (50–400 µM). The situation of an antioxidant effect was simulated by adding catalase (250 U/mL).
2.12. FACS Analysis of Stroma Cell Phenotype
In order to characterize the cell surface antigen phenotype of isolated ASC and their corresponding DFAT cultures, adherently growing cells were detached by 0.5% trypsin and 0.02% EDTA, washed (centrifuged at 200× g for 5 min), and stained for 30 min on ice with fluorescent dye conjugated MSC-relevant antibodies against CD13, CD14, CD19, CD26, CD29, CD31, CD34, CD44, CD45, CD73, CD90, CD105, CD146, HLA-DR, BMPR1A, BMPR1B, TGFβR1, TGFβR2, and PPARγ for 30 min [42,43]. Labeled cells were analyzed using a FACSCalibur (BD biosciences, Heidelberg, Germany). In the case of PPARγ detection cells were first fixed with CellFix, washed, permeabilized (cellwash, 0.2% Triton) and incubated with α-PPARγ antibody (H-100, Santa Cruz BT, Heidelberg, Germany). After washing, cells were incubated with secondary antibody (α-rabbit IgG-NL557, R&D Systems, Wiesbaden, Germany) washed once more and then analyzed. There are different numbers of n. The n = 11 includes 3 additional donors data of previous experiments. CD146, BMPs and TGFs are n = 6, CD14 and 34 are n = 8, PPARy is n = 3.
2.13. Western Blotting
Western Blot analysis of protein expression was perform exactly as described by us recently [44]. 20 µg of protein was used. As primary antibodies we used monoclonal mouse-anti MnSOD, catalase (Cell Signaling, Frankfurt am Main, Germany) and GAPDH (Novus, Cambridge, Great Britain) antibodies (1:1000). After incubation, membranes were washed 3 × 5 min in TBS-T (0.1% Tween 20) and incubated with secondary antibody in 5 % TBS-T (1:1000) for one hour at room temperature. As secondary antibodies we used HRP-conjugated polyclonal goat-anti-mouse antibodies (Dako, Carpinteria, CA, USA). After washing (3 × 5 min in TBS-T), membranes were incubated in enhanced luminescence reagents (Thermo Fisher Scientific). Blots were analyzed with ImageLab software (Bio-Rad). Specific protein signals were normalized to the respective GAPDH signals or to the signal of total proteins detected on the respective lanes of the gel prior blotting.
2.14. Statistical Analysis
The statistical evaluation was carried out using the Graph Pad Prism 5 and 8 software. We used the paired two-tailed Student’s t-test or ANOVA followed by a post hoc multiple comparison test (Tukey). With a p-value < 0.05, the statistical differences were classified as statistically significant.
3. Results
3.1. Phenotype and Multilineage Differentiation of ASC and DFAT Cultures Obtained from the Same Adipose Tissue
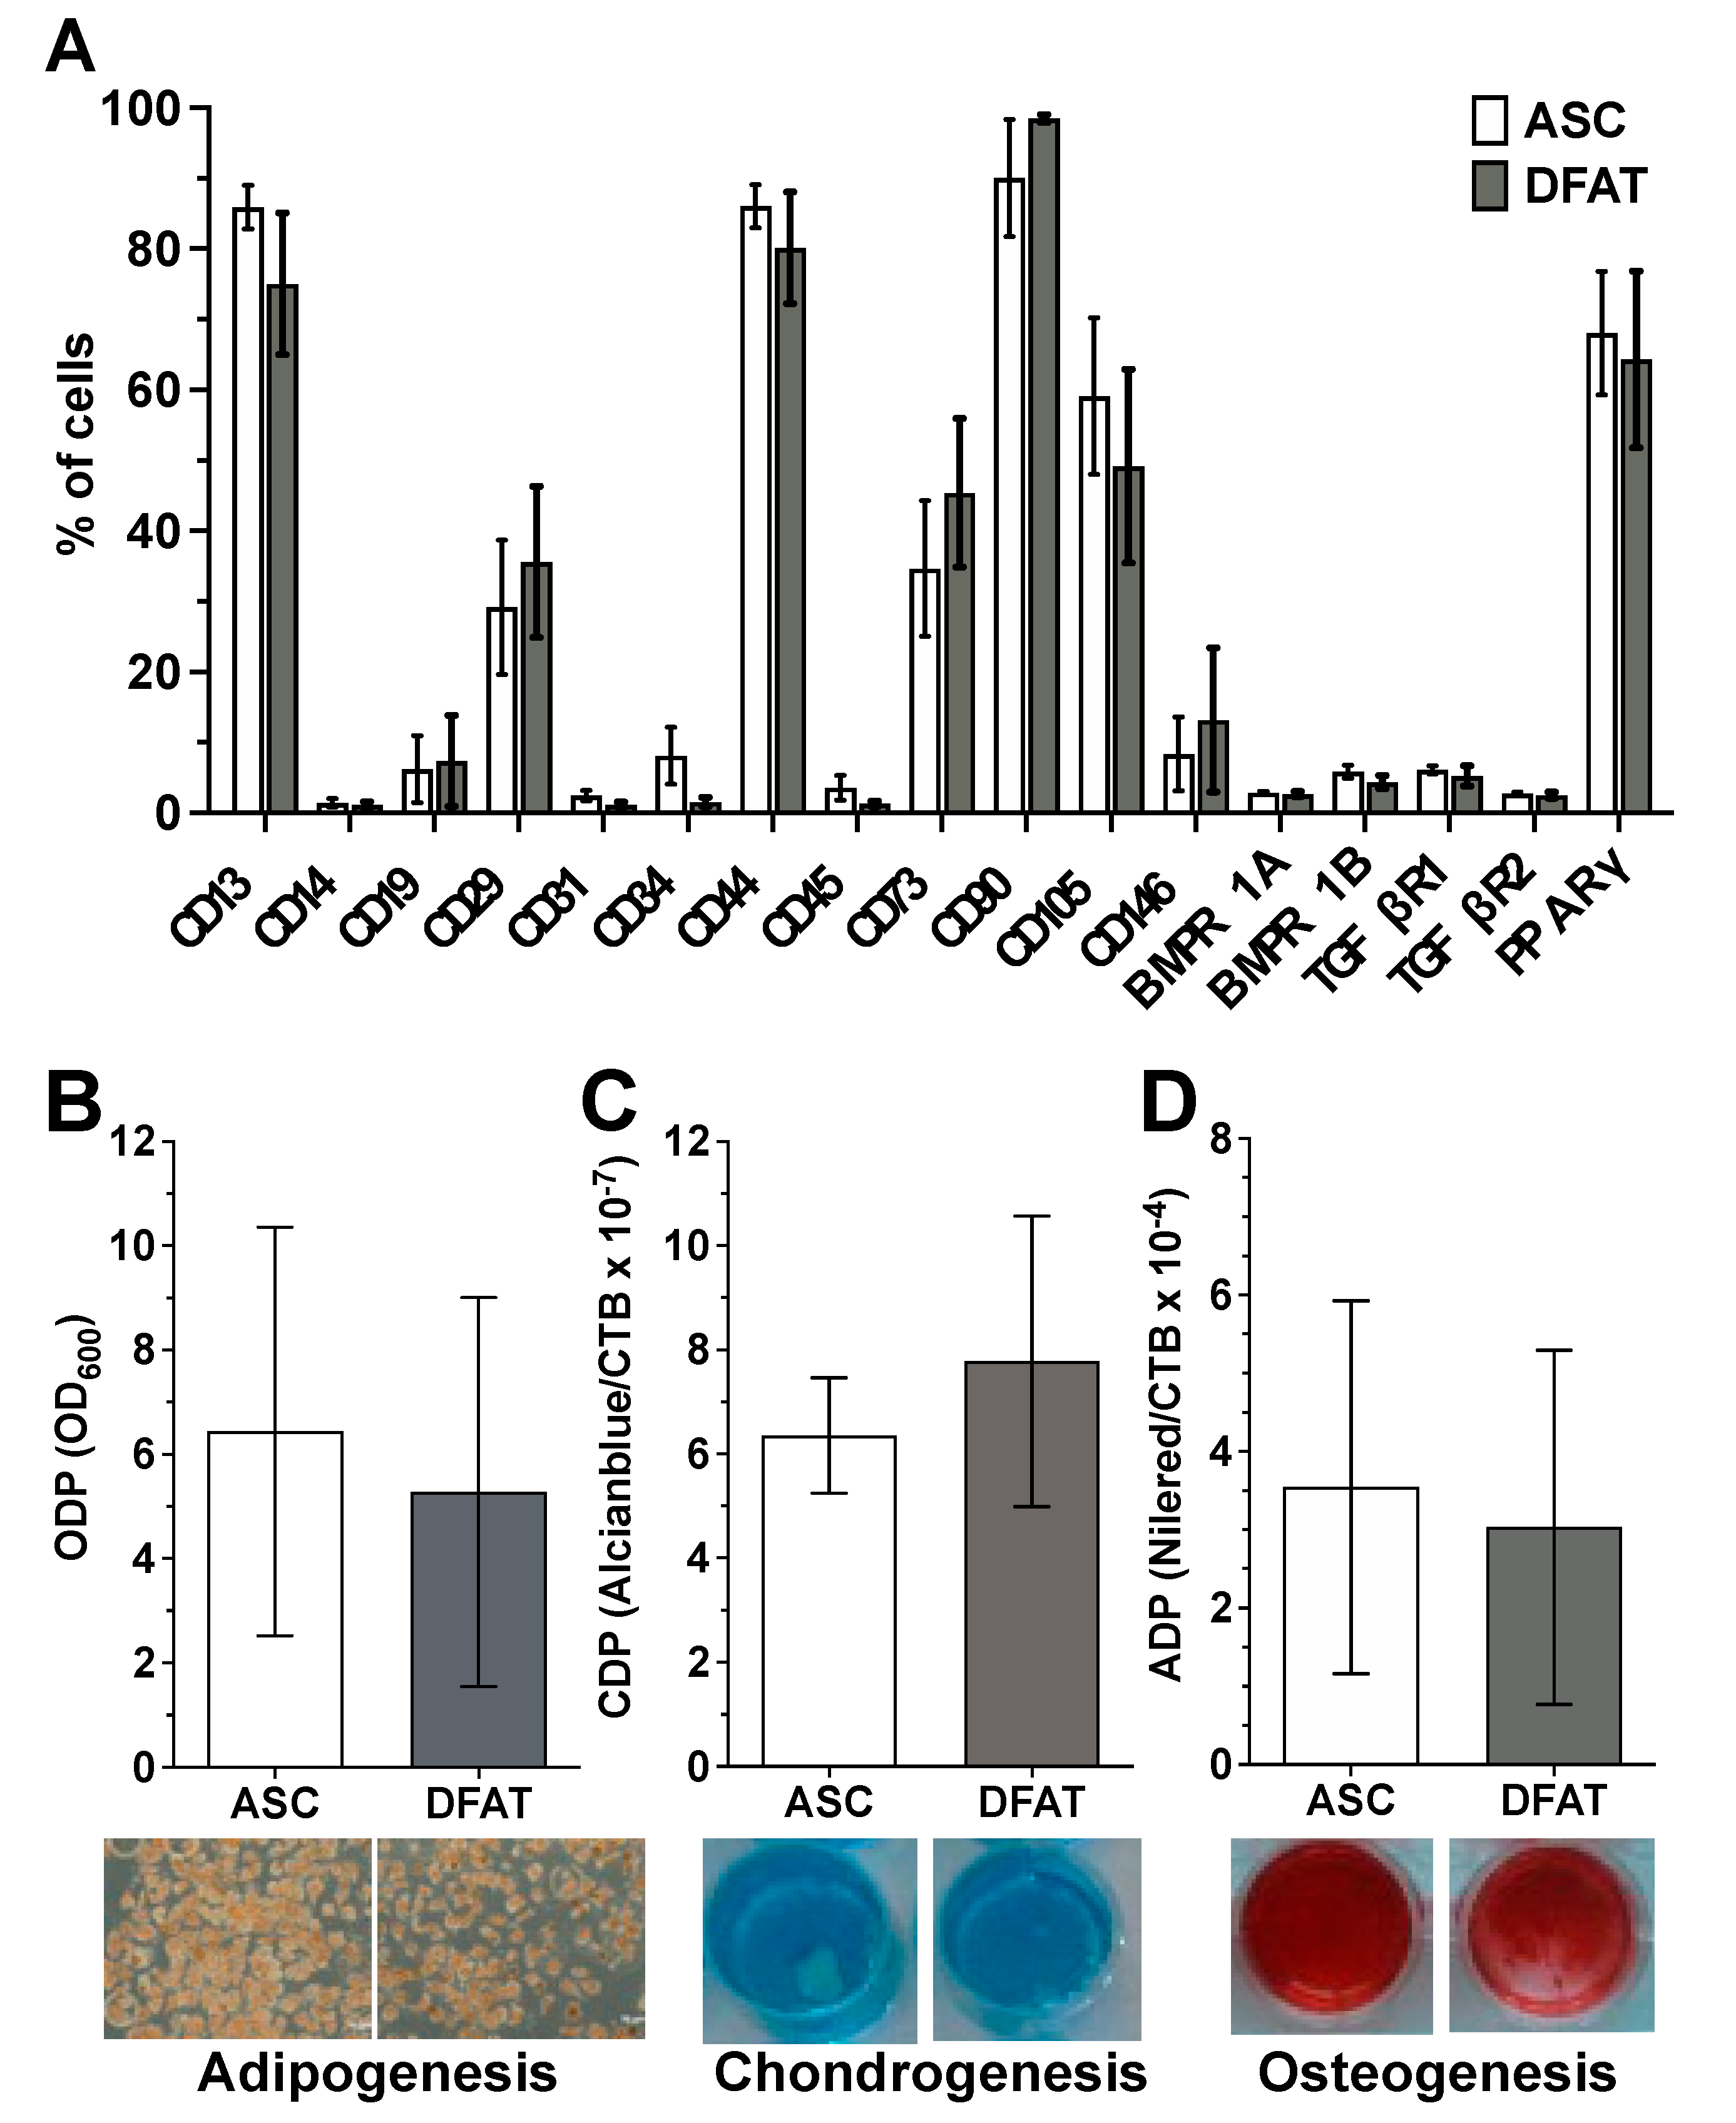
Flow cytometry-based characterization of the surface antigen phenotype of ASCs and their corresponding DFATs in passage 2 did not reveal any significant differences in the expression pattern of the examined surface proteins between both cell type (Figure 1A and Supplementary Figure S3). Both cell types show no or only a negligibly low expression of the hematopoietic markers CD14, CD19 and CD45, the endothelial markers CD31 and CD34 as well as the perivascular cell marker CD146. In contrast ASCs and DFATs are positive for CD13, CD29, CD44, CD73, CD90 and CD105 which are typical positive MSC markers. In addition, both cell types are nearly negative for osteogenic surface markers BMPR1A/B and TGFβR1/2 and express intracellular adipogenic transcription factor PPARγ (Figure 1A).
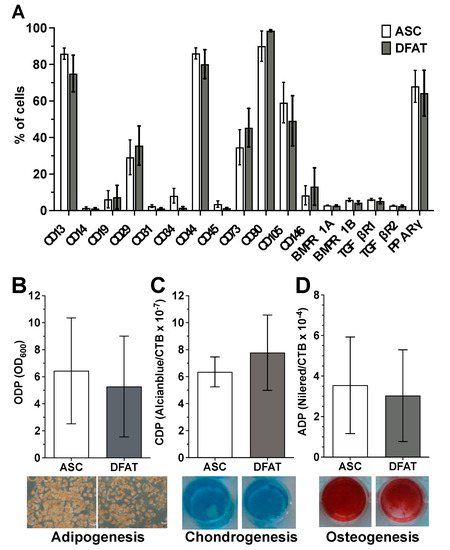
Figure 1.
Mesenchymal stem cell character of the established ASC and DFAT cultures obtained from the same adipose tissue sample. (A) Flow cytometry-based characterization of the surface antigen phenotype of ASCs and their corresponding DFATs in passage 2. CD146 and BMPs and TGFs are n = 6, CD14 and 34 are n = 8, all remaining CDs are n = 11. PPARy n = 3. (B–D), Evidence of plastic adherence and multilineage differentiation potential of ASC and DFAT cultures obtained from the same adipose tissue: adipogenic (B), chondrogenic (C), osteogenic (D) differentiation potential, scale bar 200µM. Adipo- (at day 21, n = 6), Chondrogenesis (at day 24, n = 6), Osteogenesis n = 15 (at day 14, including 6 additional donors’ data), paired t-test and mean + SD.
ASC and DFAT cultures also showed other properties that are characteristic of mesenchymal stem cells. They showed pronounced adherence to the plastic cell culture plates used and a strong, significant multilineage, adipogenic (Figure 1B), chondrogenic (Figure 1C) and osteogenic (Figure 1D) differentiation potential.
3.2. Comparison of the Osteogenic Differentiation Potential of ASC and DFAT Cultures Obtained from the Same Adipose Tissue
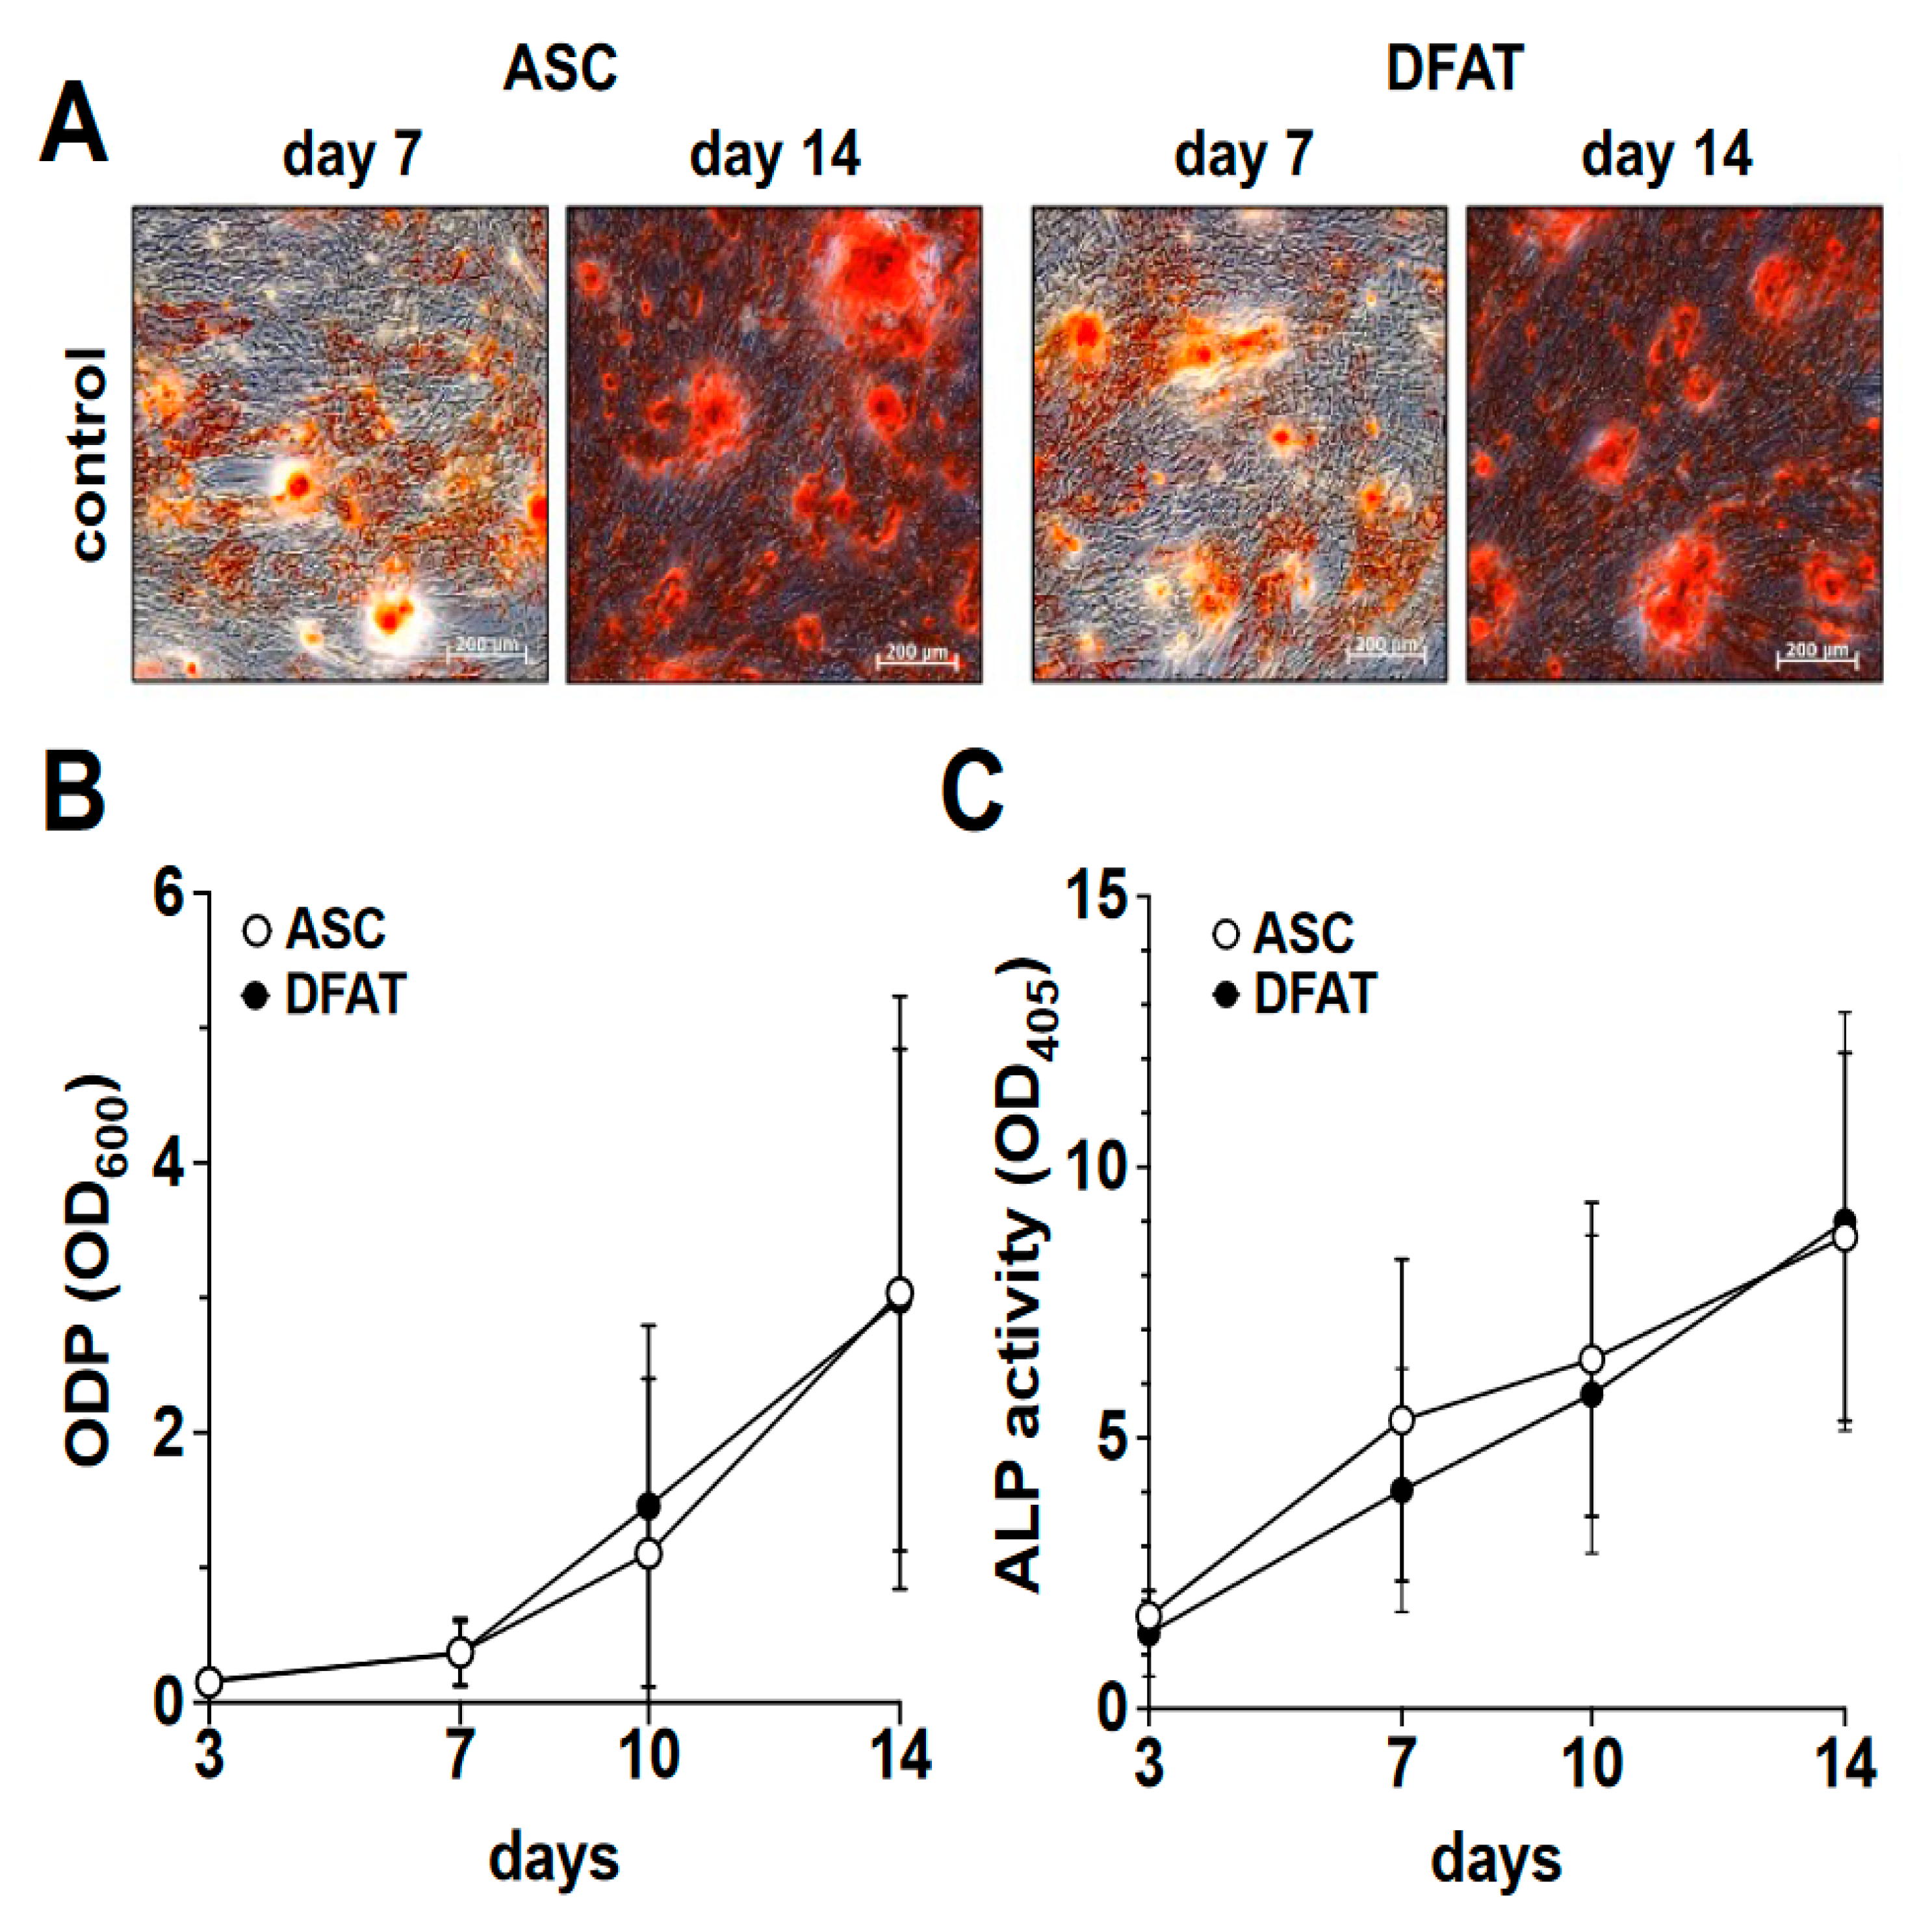
In order to compare the osteogenic differentiation of ASC and DFAT cultures of the same tissue origin, we osteogenically differentiated the corresponding cultures over a period of 14 days. On days 3, 7, 10 and 14 of differentiation, we quantified the degree of calcification of the extracellular matrix as a measure of osteogenic differentiation using alizarin red and the activity of alkaline phosphatase (Figure 2) using the corresponding activity assay.
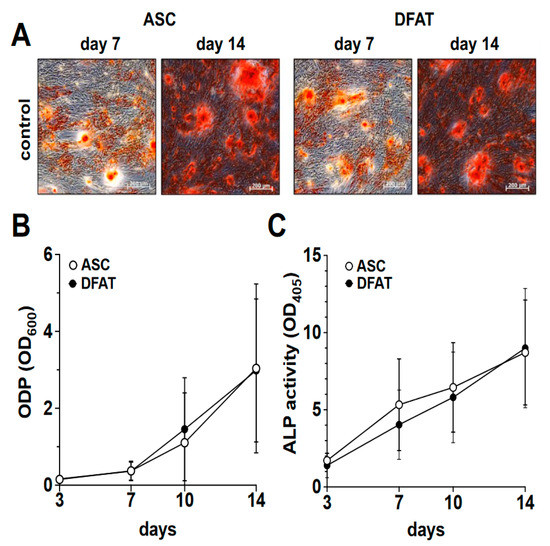
Figure 2.
Osteogenic differentiation potential of ASC and DFAT cultures obtained from the same adipose tissue sample. (A) Alizarin Red stain of osteogenically activated ASC and DFAT cultures at day 7 and day 14 of differentiation, scale bars 200 µM. (B) Quantitative evaluation of the osteogenic differentiation potential (ODP) of osteogenically activated ASC (white circles) and DFAT (black circles) cultures. The values show the mean ± standard deviation of values (n = 9) of the optical density of the Alizarin Red redissolution at 600 nm (OD600) of the cultures and days of differentiation indicated. (C) Quantitative evaluation of alkaline phosphatase (ALP) activity of osteogenically activated ASC (white circles) and DFAT (black circles) cultures. The values show the mean ± standard deviation of values (n = 9) of the optical density of the ALP-assay-specific alkaline phosphatase product 405 nm (OD405) of the cultures and days of differentiation indicated.
As we show in Figure 2A,B, a steadily increasing degree of osteogenic differentiation of the ASC and DFAT cultures could be observed in the examined time interval of 14 days. At no time was a statistically significant difference in the osteogenic differentiation potentials of the two cell types found. With regard to the activity of alkaline phosphatase, we were able to observe an almost identical course in the corresponding ASC and DFAT cultures over this period (Figure 2C).
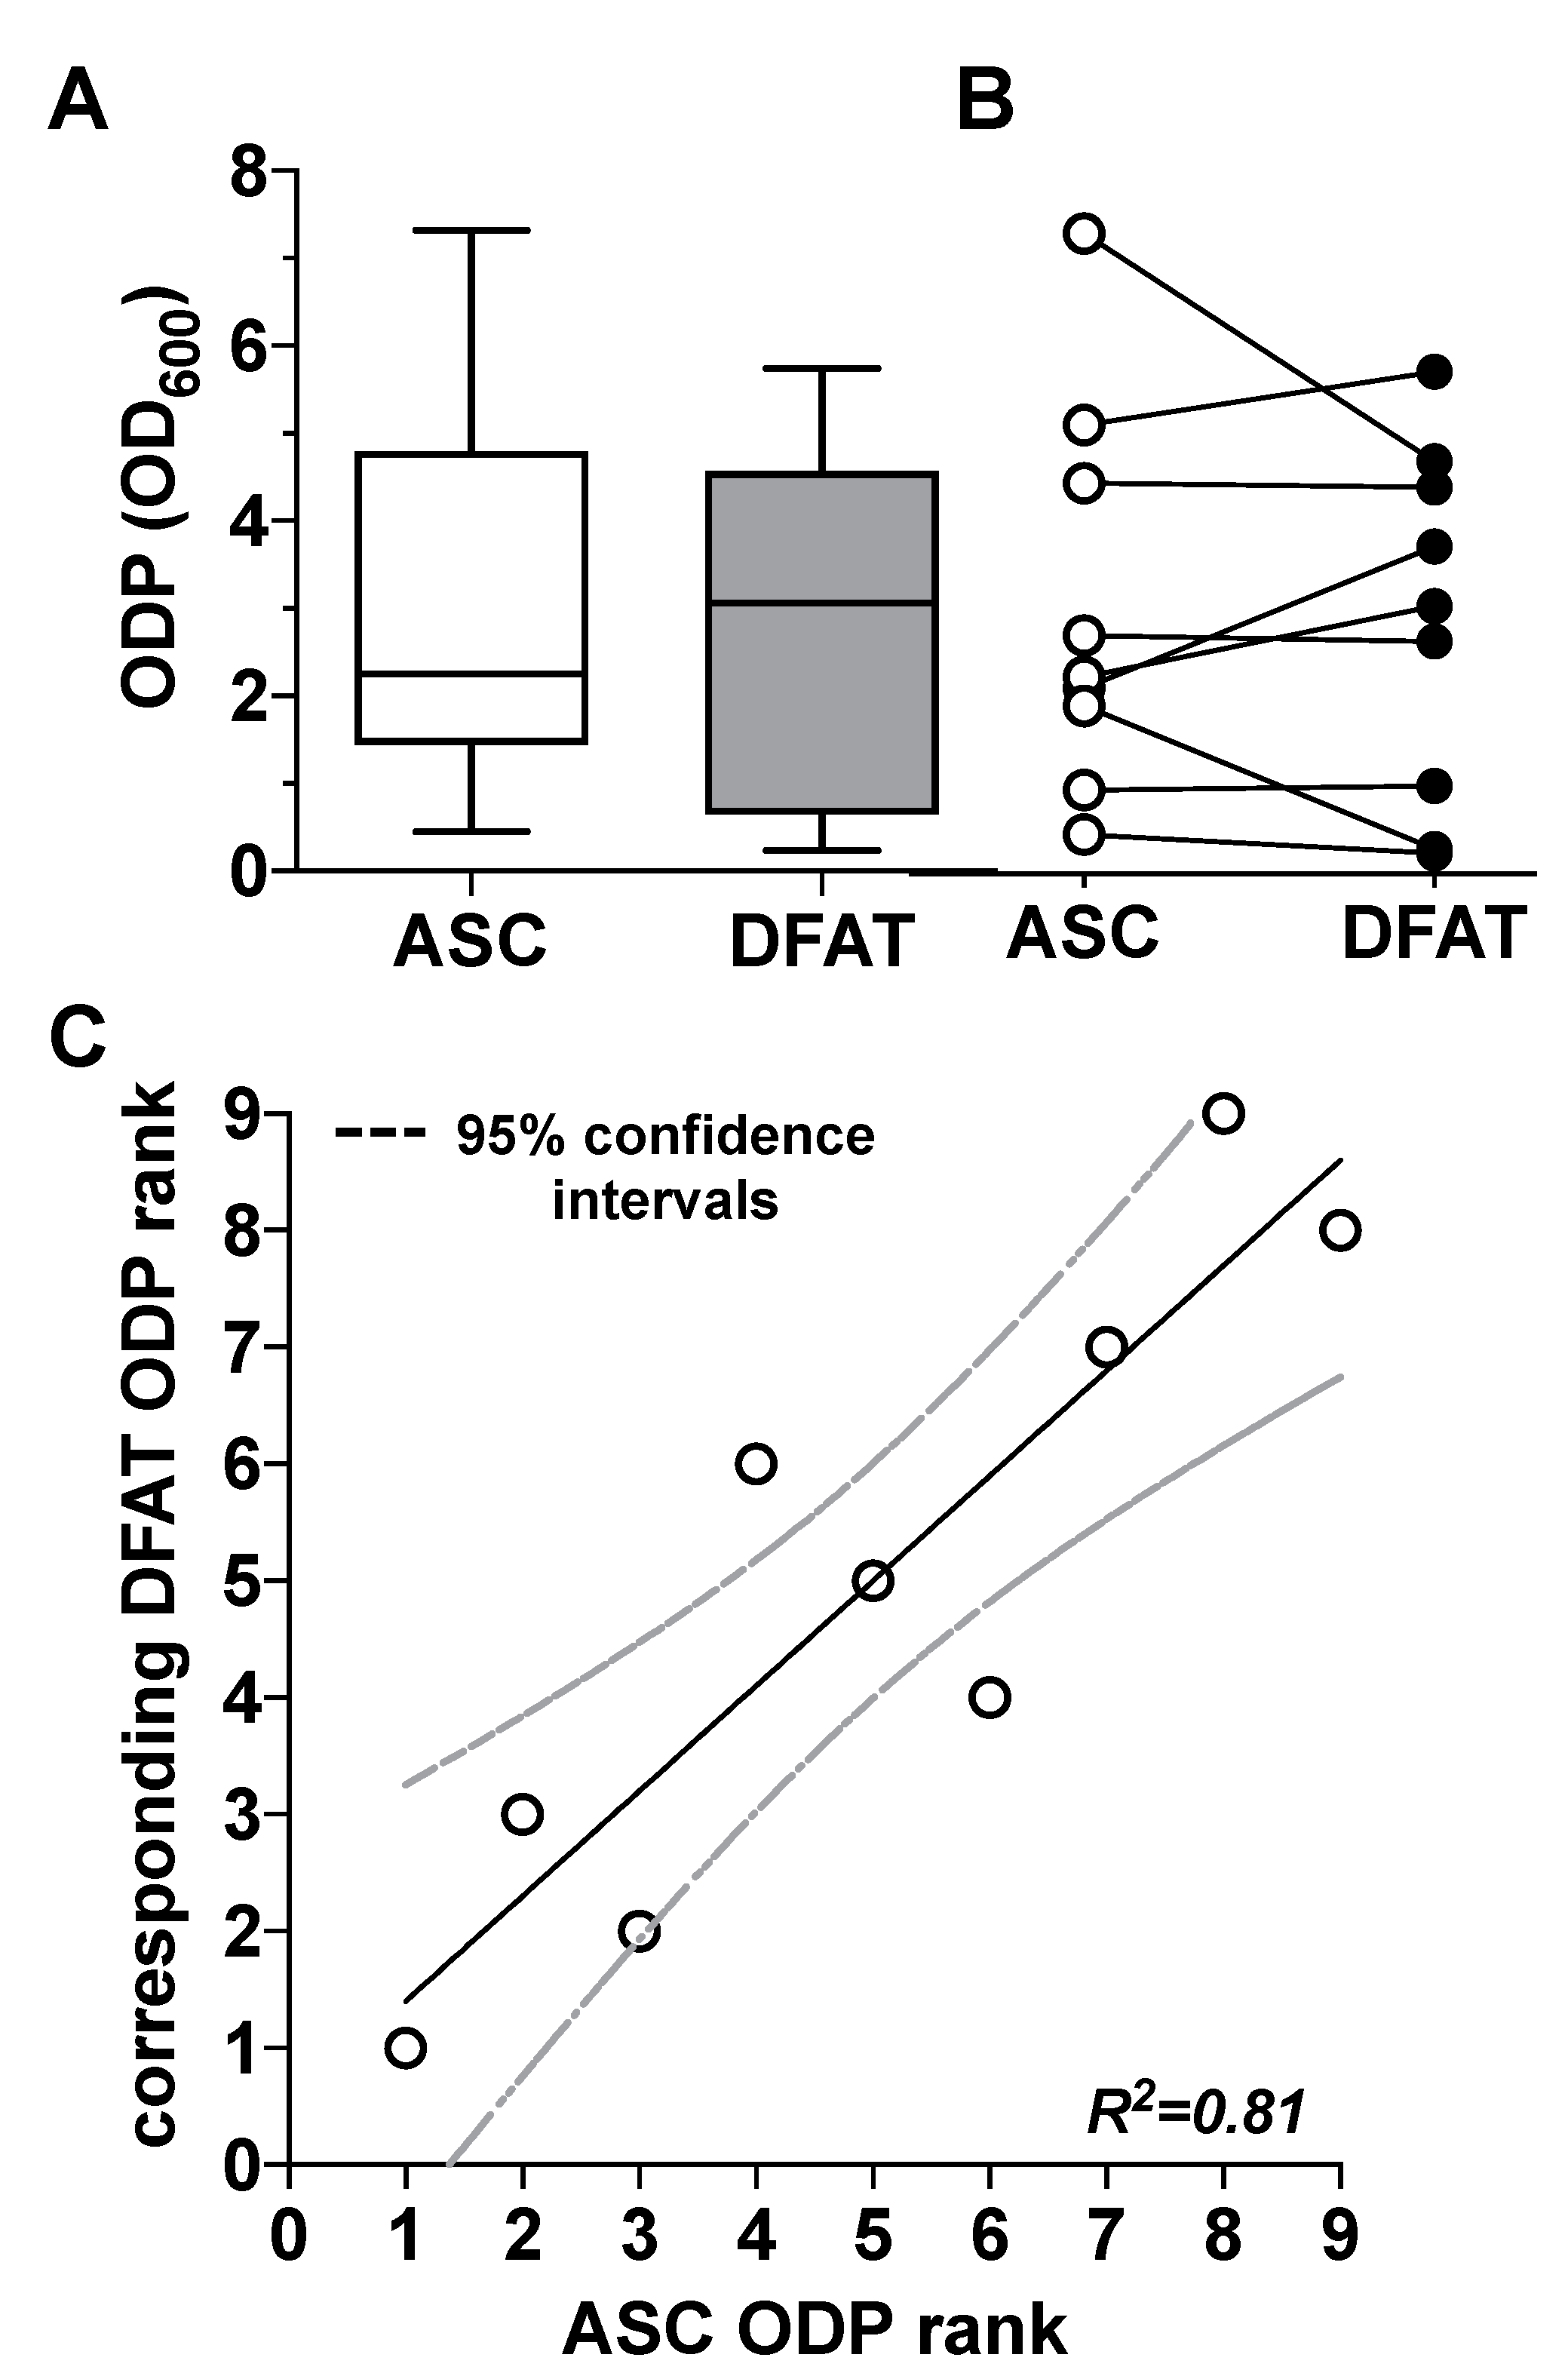
When looking at the ODP values on day 14 of osteogenic differentiation, we were able to observe a very strong inter-individual range of variation in the ODP values of the ASC cultures used and the corresponding DFAT cultures. Thus, the highest ODP values of individual cell cultures were up to 20 times higher than the lowest values (Figure 3A). Further analysis of these data did not provide any evidence for a correlation of the said large inter-individual range of variation with the age of the adipose tissue donors. There was also no evidence of gender-specific factors that could explain this large inter-individual range of variation (Supplementary Figure S4). At the level of the individual ODP values of the individual cultures (Figure 3B), it became visible that ODP values of the ASC cultures correlated statistically significantly with the ODP values of the corresponding DFAT cultures. This is particularly evident from the results of a rank analysis shown in Figure 3C.
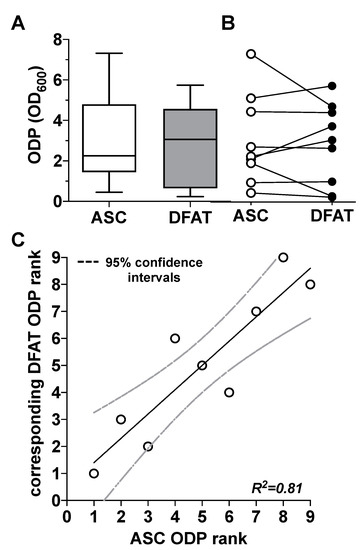
Figure 3.
Comparison of the osteogenic differentiation potential (ODP) of ASC and DFAT cultures obtained from the same adipose tissue sample. (A) Quantitative evaluation of the osteogenic differentiation potential (ODP) of osteogenically activated ASC (white box) and DFAT cultures (grey box). The ODP values at day 14 of differentiation of 9 individual (n = 9) ASC or DFAT cultures are shown as boxplot with median value and with whiskers with minimum and maximum. As measurement parameter of the respective ODP value we used of the optical density of the Alizarin Red redissolution at 600 nm (OD600) of the cultures indicated. (B) Representation of the individual ODP values used in A of the ASC cultures examined (white circles) and of the corresponding DFAT cultures (black circles) which were produced from the same adipose tissue. (C) Rank analysis of the ODP values of the ASC cultures examined (X axis) and the corresponding ODP values of the DFAT cultures established from the same tissue (Y axis). The solid line represents the regression line (R2 = 0.81), the dashed lines indicate the 95% confidence intervals. p < 0.0005, slope deviation from zero.
3.3. Impact of Oxidative Stress on Osteogenic Differentiation Potential of ASC and DFAT Cultures Obtained from the Same Adipose Tissue
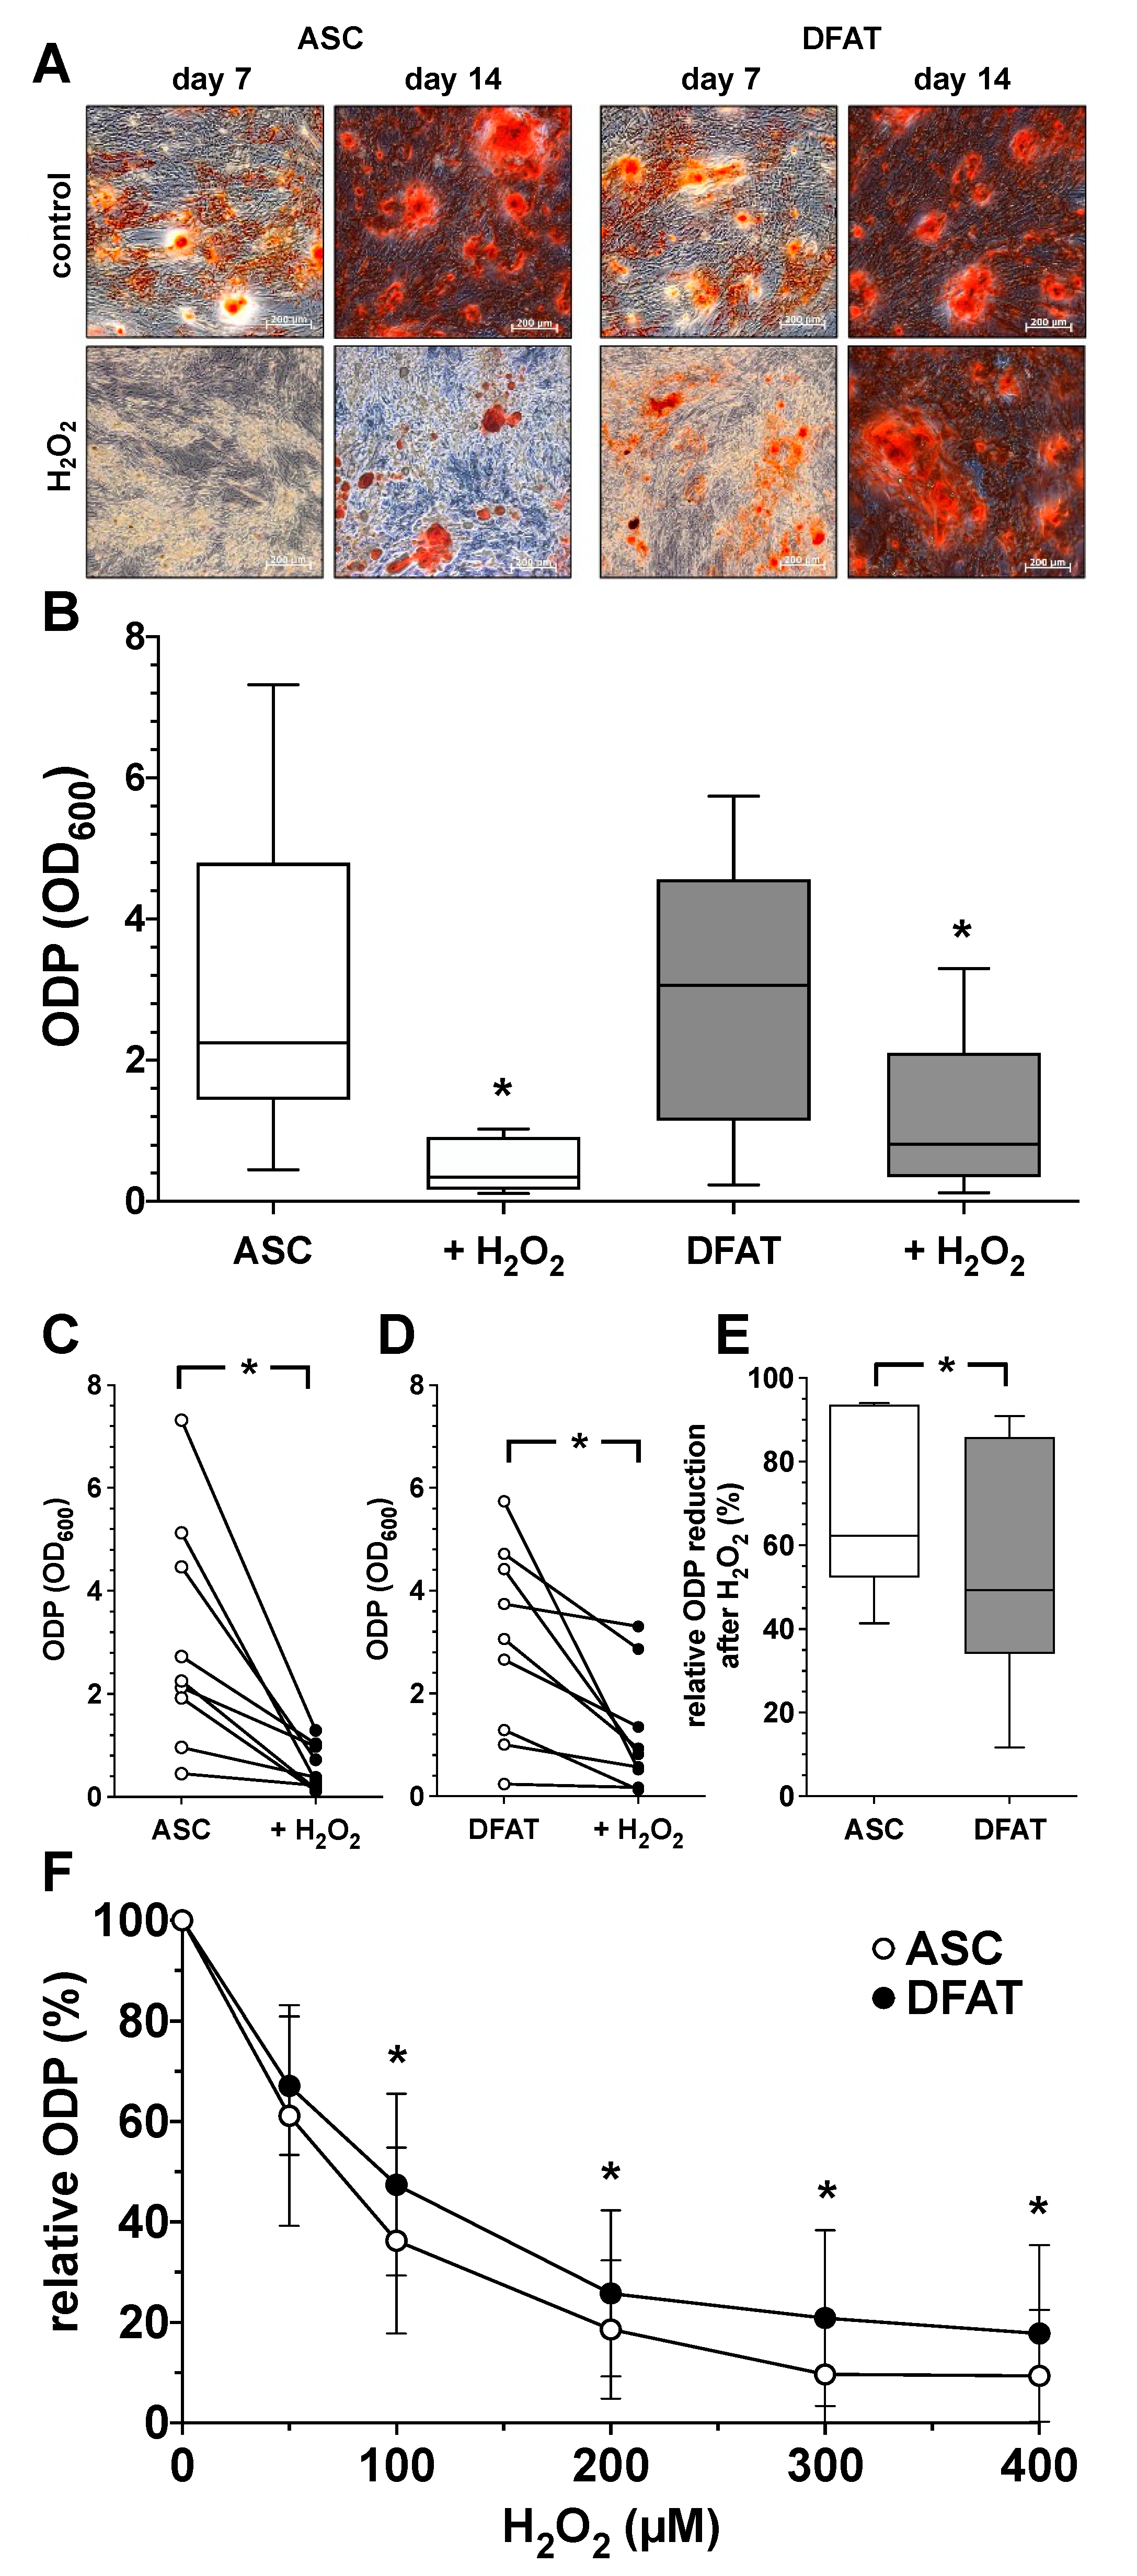
In order to understand the influence of oxidative stress on the ODP of ASC and DFAT cultures, osteogenic differentiation was induced over a period of 14 days with the addition of 100 µM H2O2. As shown in Figure 4, the presence of the oxidative agent H2O2 led to a clear and concentration-dependent decrease in the ODP of ASC and DFAT cultures. After staining the extracellular matrix, an obvious reduction in the osteogenic process in H2O2-treated cultures was already apparent on day 7 of differentiation (Figure 4A). On day 14 this effect was even more noticeable. Morphologically, the differentiation-inhibiting effect of H2O2 was less prominent in DFATs than in ASC cultures (Figure 4A). Quantitative evaluation, showed that the oxidative stimulus induced a significant reduction in ODP in both cell types (Figure 4B–D) but the H2O2-induced reduction in osteogenic differentiation was significantly less pronounced in DFATs than in ASCs (Figure 4E,F).
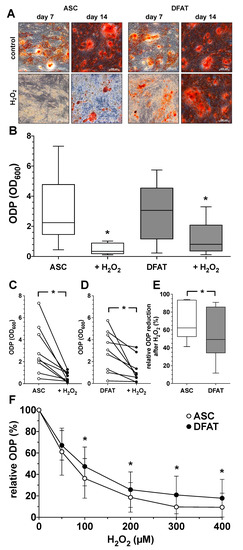
Figure 4.
Impact of oxidative stress on osteogenic differentiation potential of ASC and DFAT cultures obtained from the same adipose tissue. (A) Alizarin Red staining of osteogenically activated ASC and DFAT cultures at day 7 and day 14 of differentiation (control) and respective cell cultures additionally maintained in the presence of 100 µM H2O2 (H2O2), scale bars 200 µM. (B) Quantitative evaluation of the osteogenic differentiation potential (ODP) of osteogenically activated ASC (white box) and DFAT cultures (grey box) and respective cell cultures additionally maintained in the presence of 100 µM H2O2. (+H2O2). The ODP values at day 14 of differentiation of 9 individual (n = 9) ASC or DFAT cultures are shown as boxplot with median value and with whiskers with minimum and maximum. As measurement parameter of the respective ODP value we used of the optical density of the Alizarin Red redissolution at 600 nm (OD600) of the cultures indicated. *, p < 0.05 as compared to the respective control culture maintained in the absence of H2O2. (C) Individual ODP values of the ASC cultures examined in (B) (ASC control cultures, white circles; H2O2-treated ASC cultures, black circles). (D) Individual ODP values of the DFAT cultures examined in (B) (DFAT control cultures, white circles; H2O2-treated DFAT cultures, black circles). (E) Relative decrease in ODP reduction at day 14 of differentiation after 14 day treatment with 100 µM H2O2. ASC (white box), DFAT cultures (grey box). (C–E), * p < 0.05. n = 9. (F) Change in the ODP of ASC (white circles) and DFAT cultures (black circles) detected at day 14 of differentiation after 14 day treatment with H2O2 at concentration indicated. * p < 0.05 as compared to the respective ASC cultures. n = 9.
3.4. Impact of Catalase on Osteogenic Differentiation Potential of ASC and DFAT Cultures Obtained from the Same Adipose Tissue
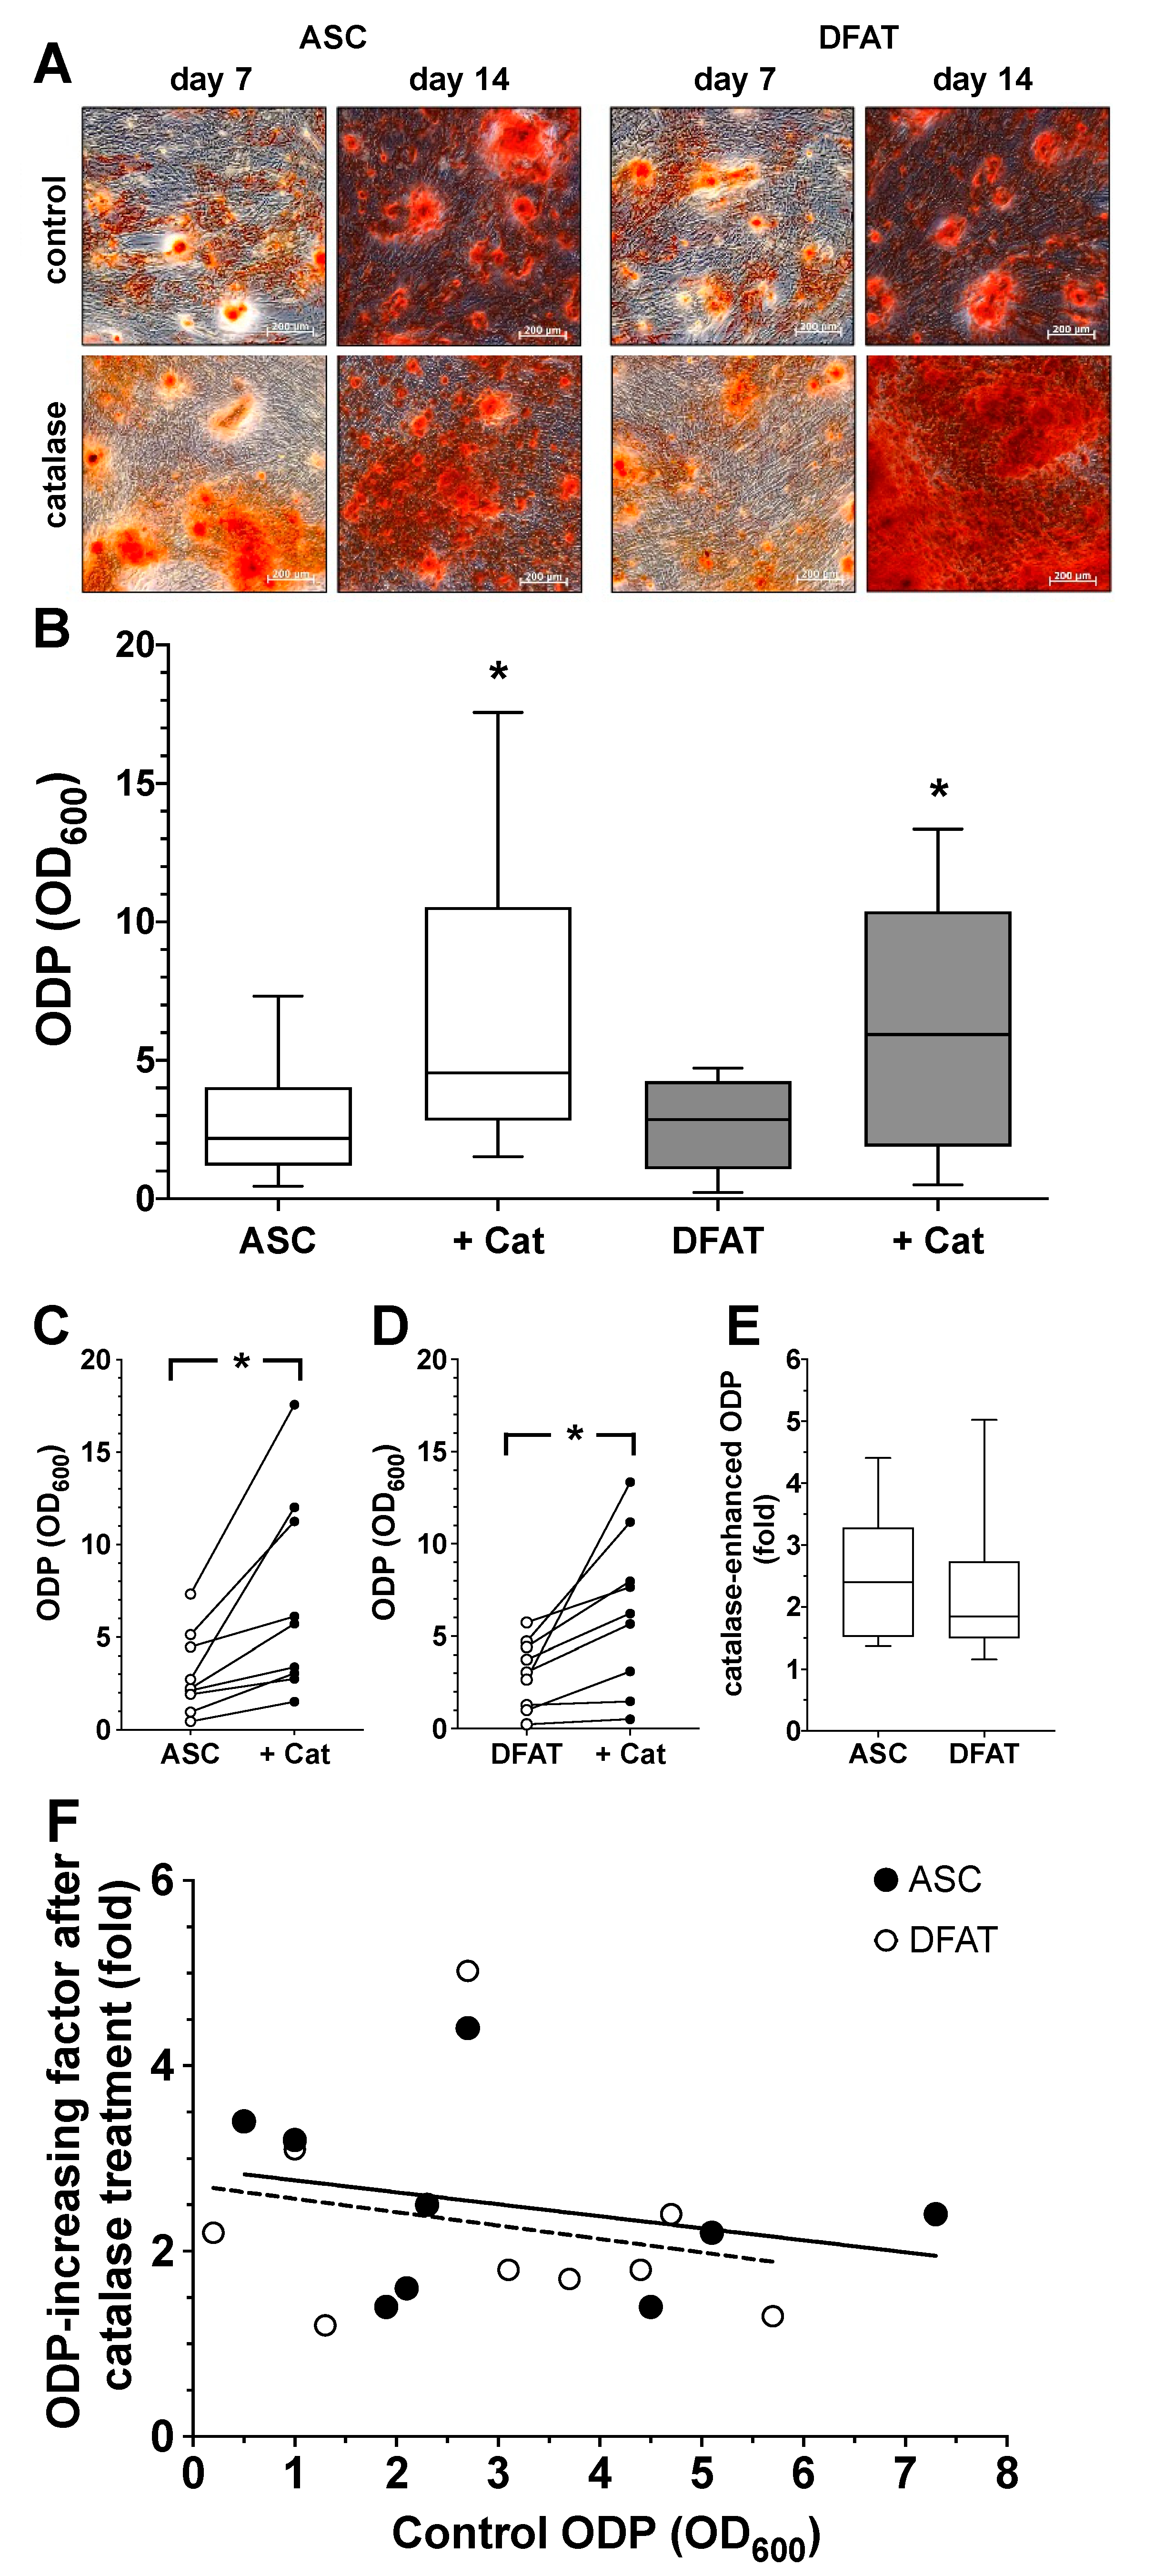
Based on the experiment described above, we also evaluated the effect of the enzyme catalase, a relevant factor in the cells defense against oxidative stress, on the ODP of ASC and DFAT cultures. We could already see at day 7 of differentiation that catalase visibly increased osteogenesis in both cell types (Figure 5A). The quantification of the results confirmed this observation. Catalase led to a significant increase in ODP in ASCs as well as in DFATs (Figure 5B–D). When looking at the individual values of the catalase-induced ODP of both cell types, it could be seen that the relative increase was very similar regardless of the starting value of the controls. The data from the individual values summarized in Figure 6E make it clear that the mean values of the catalase-elevated ODP were relatively constant, approximately 2- to 2.5-fold higher than the initial values, regardless of how large or small the original individual ODP of the respective cell cultures was (Figure 5F).
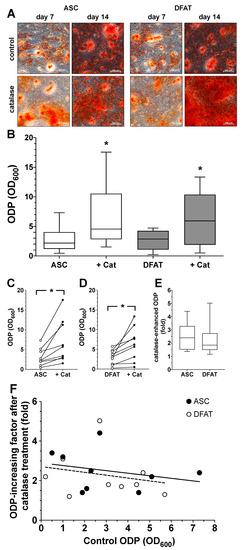
Figure 5.
Impact of catalase on osteogenic differentiation potential of ASC and DFAT cultures obtained from the same adipose tissue. (A) Alizarin Red stain of osteogenically activated ASC and DFAT cultures at day 7 and day 14 of differentiation (control) and respective cell cultures additionally maintained in the presence of 250 U/mL catalase, scale bars 200 µM. (B) Quantitative evaluation of the osteogenic differentiation potential (ODP) of osteogenically activated ASC (white box) and DFAT cultures (grey box) and respective cell cultures additionally maintained in the presence of 250 U/mL catalase (+Cat). The ODP values at day 14 of differentiation of 9 individual (n = 9) ASC or DFAT cultures are shown as boxplot with median value and with whiskers with minimum and maximum. As measurement parameter of the respective ODP value we used of the optical density of the Alizarin Red redissolution at 600 nm (OD600) of the cultures indicated. *, p < 0.05 as compared to the respective control culture maintained in the absence of catalase. The control ASC and DFAT values shown here in Panel B are identical to the control ASC and DFAT values we show in Figure 4B.(C) Individual ODP values of the ASC cultures examined in (B) (ASC control cultures, white circles; catalase-treated ASC cultures, black circles). p < 0.05; n = 9. (D) Individual ODP values of the DFAT cultures examined in (B) (DFAT control cultures, white circles; catalase-treated DFAT cultures, black circles). *, p < 0.05; n = 9. (E) Relative increase in ODP (fold increase) detected at day 14 of differentiation after 14 day treatment with 250 U/mL catalase. ASC (white box), DFAT cultures (grey box). n = 9. (F) Correlation between ODP values (x-axis; control ODP) of the individual nine ASC (black circles) and DFAT cultures (white cultures) and the factor the ODPs were enhanced by addition of catalase (y-axis). The lines represent the regression lines obtained with ASC cultures (solid line; R2 = 0.07685) and DFAT cultures (dashed line, R2 = 0.05155), respectively. p < 0.0005, slope deviation from zero.
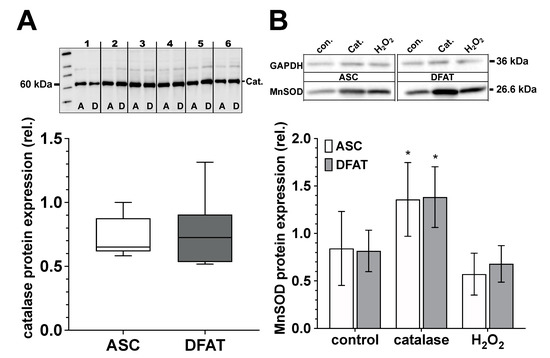
Figure 6.
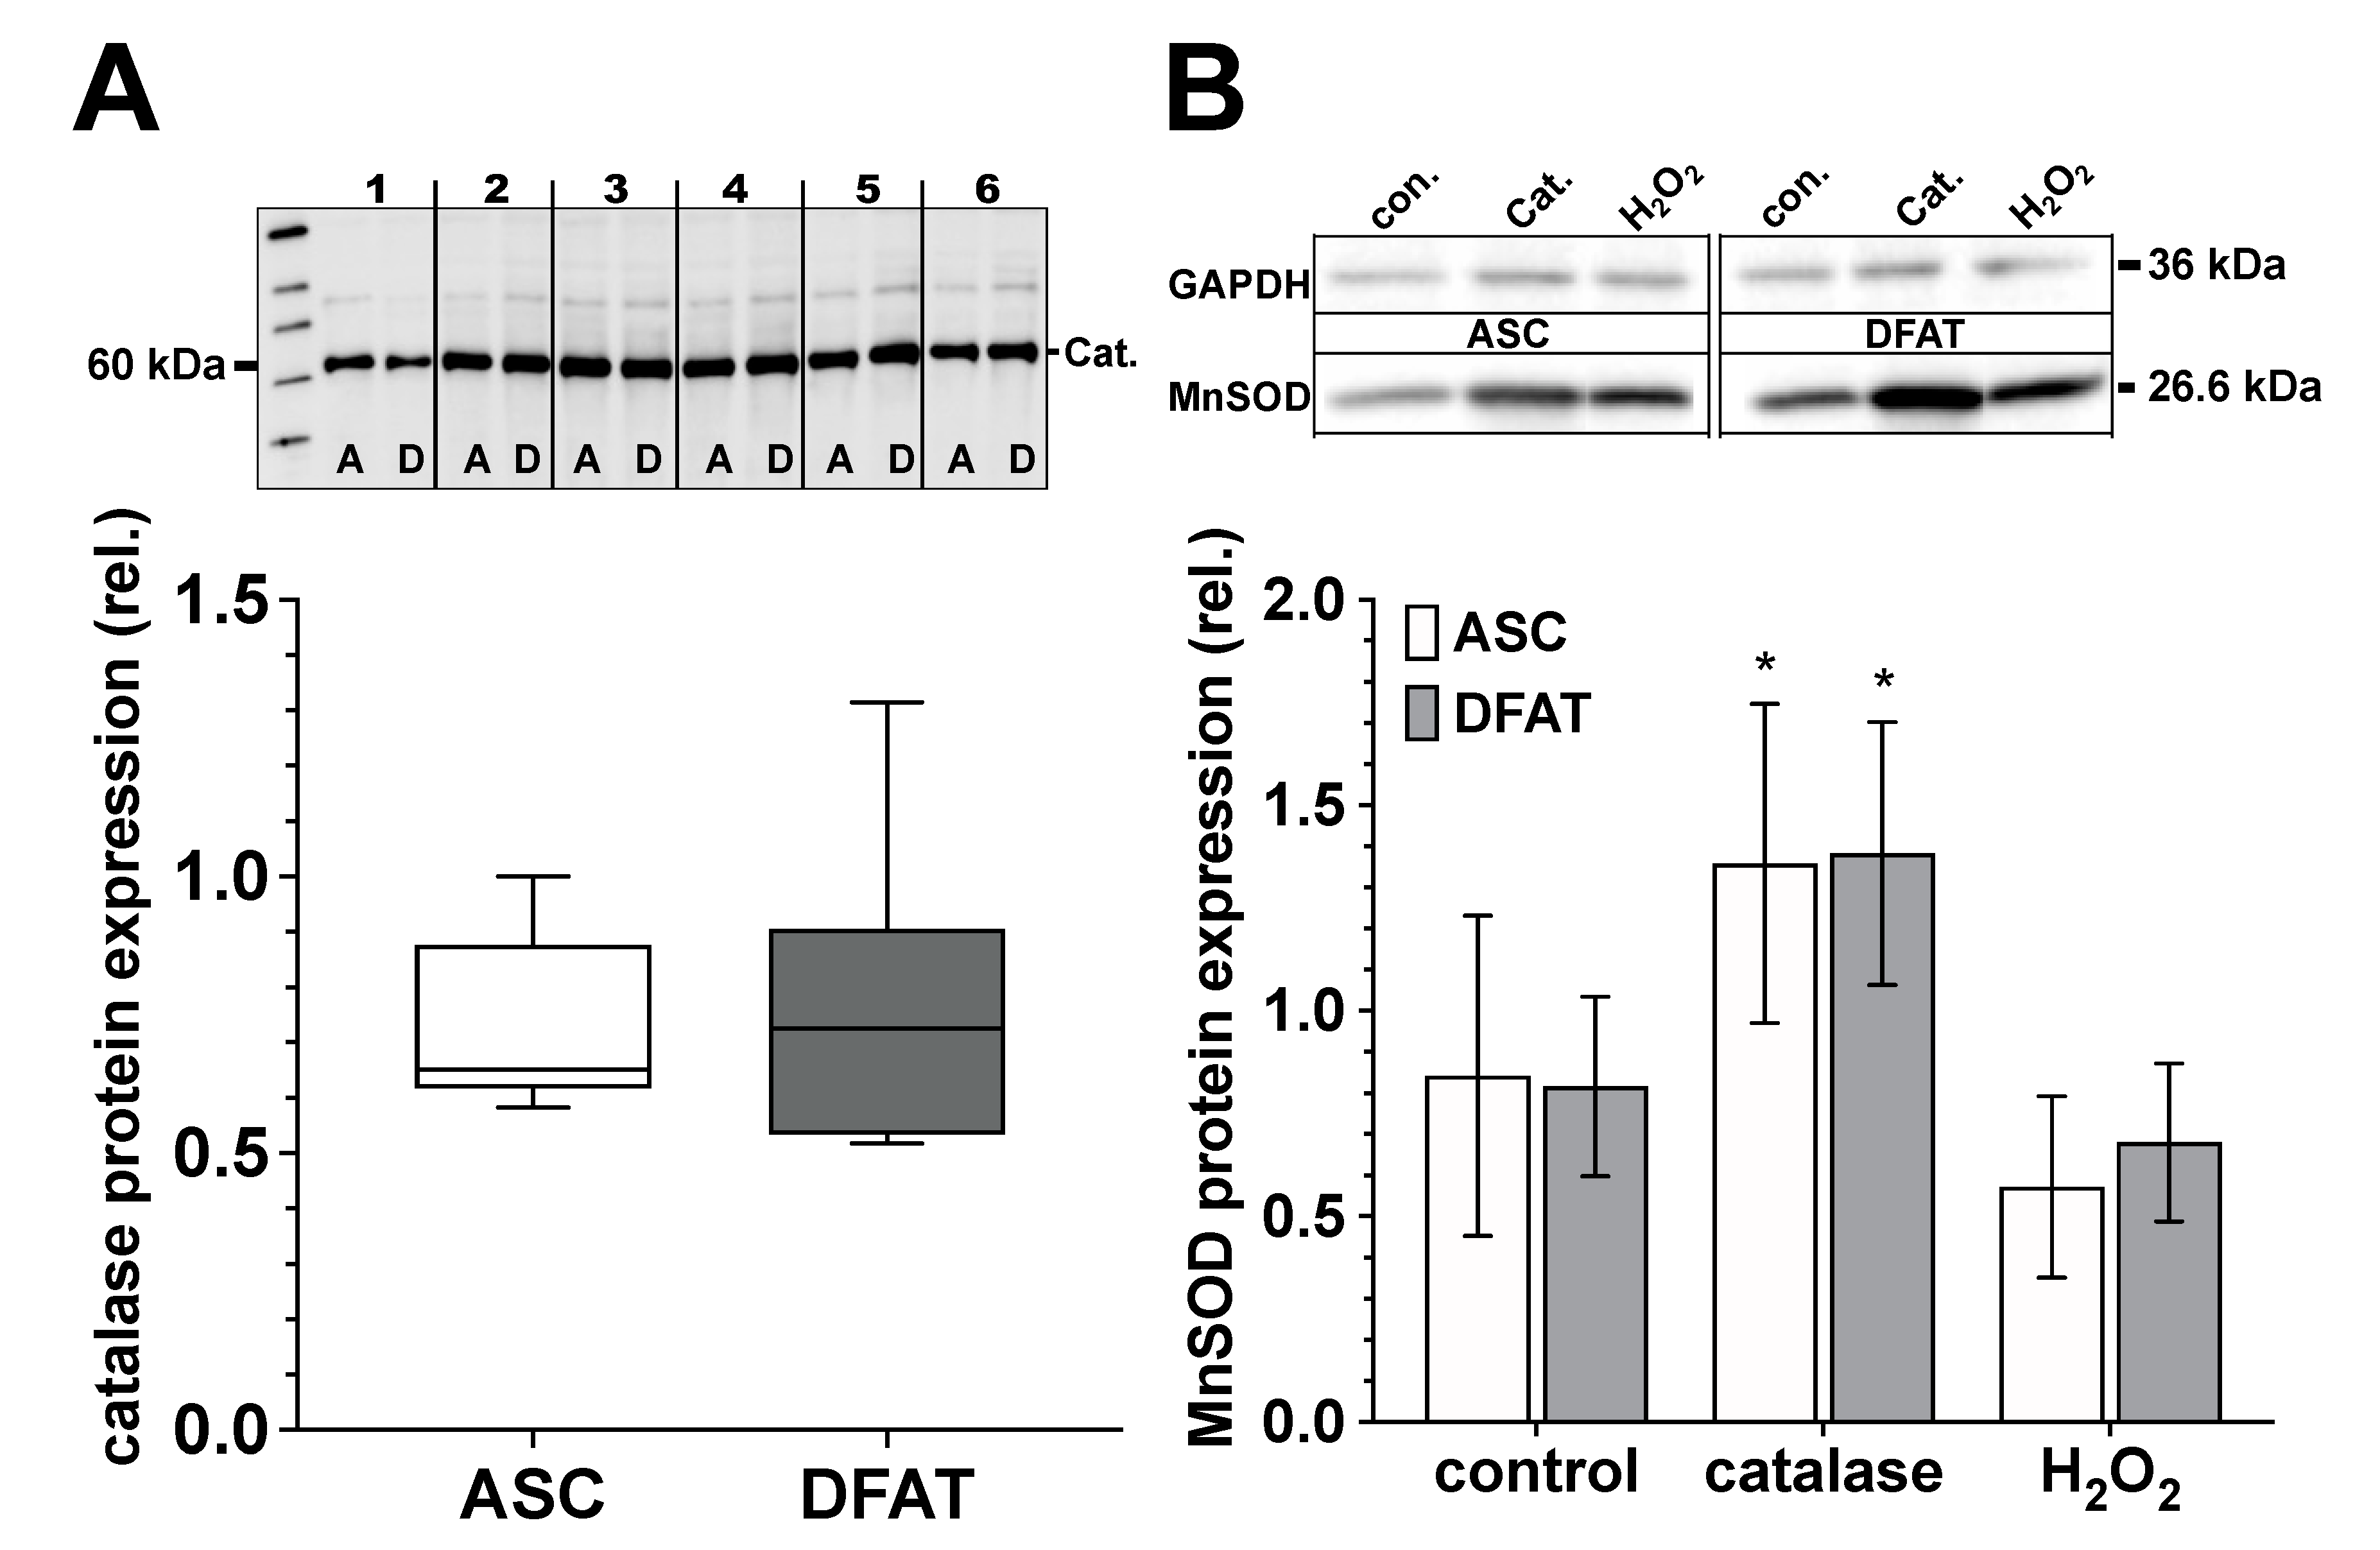
Catalase and MnSOD protein expression of ASC and DFAT cultures obtained from the same adipose tissue. (A) Relative catalase protein expression in ASC (white box) and DFAT cultures (gray box) of the same adipose tissue origin. Values are shown as boxplot with median value and with whiskers with minimum and maximum. The specific signal of the catalase expression was normalized to the signal of the protein content of the whole corresponding lane. The representative photograph of the blot shows the protein expression of catalase in ASC (A) and DFAT cultures (B), which were established from six individual adipose tissue samples. (B) Quantification of MnSOD protein expression in control, catalase-treated (250 U/mL) and H2O2-treated (100 µM) ASC (white bars) and DFAT cultures (gray bars) of the same origin of adipose tissue. The bars show the mean ± SD of four individual experiments. *, p < 0.05 as compared to the controls. The specific MnSOD signals were normalized in comparison to the corresponding GAPDH in the individual sample. The representative photograph of the blot shows the protein expression of MnSOD and GAPDH in ASC (A) and DFAT cultures (B) after the cultures have been treated accordingly.
3.5. Catalase and MnSOD Protein Expression of ASC and DFAT Cultures Obtained from the Same Adipose Tissue
ASC and DFAT cultures of the same adipose tissue origin show no significant differences in terms of their catalase and MnSOD protein expression (Figure 6). Regarding MnSOD, both cell types show a significant increase in protein expression after treatment with catalase (250 U/mL) and after treatment with H2O2 (100 µM) we did not observe any significant effect on MnSOD protein expression.
4. Discussion
Due to the constantly growing development of novel regenerative therapies, there is also an increasing need for suitable sources for MSCs. Human adipose tissue abundant in ASCs represents a very attractive source for cell therapeutic measures [45]. ASCs are relatively easy to isolate and have a low risk of side effects and health complications. A possible disadvantage in the therapeutic use of ASCs is the large cellular heterogeneity of this cell fraction. In addition to preadipocytes, the stromal fraction of adipose tissue also contains fibroblasts, endothelial cells and their precursor variants and possibly other cell types. In addition, the cells of the adipose tissue capable of differentiation occur in variable proportions in the obtained stromal fraction and also have various differentiation potentials, e.g., in regard to their osteogenic capacity. From our own experience as shown here, but also from numerous publications, we know that due to their intrinsic heterogeneity the tissue-specific differentiation potential of an individual ASC preparation cannot be reliably predicted [46,47,48]. It seems that a more uniform cell population with a multilineage differentiation potential would allow for a better and more reliable differentiation outcome.
One aim of the current study was to evaluate this assumption. To this end, we compared the osteogenic differentiation potential of ASC cultures with that of dedifferentiated adipocytes (DFAT) of the same adipose tissue sample origin. DFATs derived from mature adipocytes, unlike heterogenic ASCs represent a highly homogeneous cell population. Still DFATs show a nearly identical antigen phenotype like ASC cultures. Furthermore, they were able to grow adherently and, like ASCs, could be effectively differentiated into adipogenic, chondrogenic and osteogenic lineage. In a more differentiated analysis of the osteogenic differentiation potential (ODP), we were able to observe that the ODP of a DFAT culture correlated significantly with the ODP of the corresponding ASCs from the same donor. Thus, a donors ASC with low ODP had also a corresponding DFAT with a low ODP and vice versa. In the examined tissue samples the correlation of the ODP of the generated ASCs and the corresponding DFATs was highly significant. Therefore, it seems that the ODP of both was not primarily a function of the cell type or culture conditions but moreover appears to be a function of the adipose tissue from which the cultures were established. These very important results, contradict earlier findings, where a fundamentally higher ODP could be observed in the DFAT cultures compared to ASC cultures [49,50]. However, another study focusing ASCs and DFATs of 12 elderly osteoporotic donors confirmed the correlation of ODP quality observed by us [51].
Regardless of the clear correlation just discussed, we observed an enormous interindividual variation in the ODP of the isolated ASC and DFAT cultures, which in our case showed differences by a factor of up to 20. With such a large range of interindividual ODPs, it is almost impossible to define a threshold value or fixed point that distinguishes a “normal” from an unphysiological or even “pathophysiological” low ODP. Donor variation is a common issue in osteogenic differentiation of MSCs, and has been described by others for instance for BMSCs [47,48] but also for human ASC cultures [52]. What can be the molecular mechanism for such a strong interindividual fluctuation?
It has been shown, that obesity has a huge impact on ASCs osteogenic performance. Cells of obese donors drastically failed to accumulate calcium, indicated by Alizarin red staining, and also expressed less osteogenic proteins like RUNX2, ALP and osteocalcin compared to lean control groups [6,19,53]. Due to the largely anonymized transfer of the test material, we unfortunately have no information on the body mass index (BMI) of our donors. About 30% of the tissue material we used came entirely from aesthetically motivated liposuctions. Here, we can almost certainly assume that obesity patients were not recorded. However, 70% of the adipose tissue samples came from abdominoplasty samples that were obtained as part of surgical measures to tackle pre-existing obesity. Even if the absolute number of donors of 9 does not allow any reliable statistical statements, we did not observe any involvement of obesity-relevant factors that might give an explanation for the large fluctuation range of ODPs that we observed.
In addition, there was no obvious pattern between the age of donors and the wide spread of ODP values. In the past, some authors have found a clear correlation between increasing age of donors and a decrease in ODP of MSCs [54,55]. Like other authors before us, we could not find any statistically significant indications of age-related differences or an influence of gender on the osteogenic differentiation potential, which we recorded in Figure S5 in the Supplementary Materials. Nevertheless, a tendency towards higher inter-individual variation in ODP with increasing age could be observed by some [56].
A generally accepted view is that aging processes and senescence correlate with an increase in cellular oxidative stress [57,58]. This oxidative stress is also associated with the development of various degenerative and metabolic diseases [59,60,61]. Oxidative stress is also seen as a negative pathogenic factor in connection with osteoporosis [22,62,63,64,65] and can significantly inhibit stem cell osteogenesis in vitro as well as in vivo [20,22]. Therefore, in analogy to the comparison of the ODP of both ASC and DFAT, we also compared the influence of oxidative stress on the osteogenic behavior of both. To simulate oxidative stress, we used H2O2, a physiologically relevant reactive oxygen species (ROS) [60] that is often used as a prooxidant. In this experimental setup it became clear that DFAT cultures were significantly more resistant than ASC cultures in regard to the damage caused by oxidative impact. In the concentration range of the used H2O2, which was not directly toxic to the cells (100 µM), the oxidative stimulus caused a significant decrease in ODP in cultures of both cell types. However, this decrease was significantly less pronounced in DFATs than in ASCs. This finding suggests that DFATs‘ enzymes may have better antioxidant performance and therefore cells have higher antioxidant capacity. This was ruled out for catalase and MnSOD, since we could not observe any differences in their protein expression between the two cell types. We therefore believe that the molecular mechanism counteracting oxidative stress-suppressed osteogenic differentiation capacity in osteogenically activated DFAT cultures is not mediated by catalase or MnSOD, but by other potent antioxidant or hydrogen peroxide depleting systems of the cells, such as glutathione peroxidase/glutathione system or the glutathione/thioredoxin/peroxiredoxin system [66,67].
Based on the assumption that very low individual ODP might be due to increased intracellular ROS exposure, an antioxidant intervention should lead to improved and increased ODP values. In cell cultures with high ODP values, the influence of the antioxidant measures should be correspondingly lower. Our experimentally collected data only partially met these expectations. In cultures of both cell types, which we internally call osteogenic “low-responder” cultures due to the very low achievable ODP values, an antioxidant treatment with exogenously added catalase led to a significant increase in ODP by a mean factor of about 2.5. However, the factor of the catalase-induced increase in osteogenesis was approximately the same in all cultures, regardless of individual ODP of the respective culture without catalase. This means that the ODPs of low responding as well as the ODPs of highly (or assumed maximal) responding cells were increased by the same factor by catalase. These findings suggest that the strong interindividual variation of the observed ODP is idiopathic, but appears to neither depend on the age or BMI of donors nor does it seem to correlate with increased oxidative stress. Thus, the critical question remains unanswered as to whether the very low ODP of some individuals observed here in vitro would be a clue to an underlying disease in vivo.
Regardless of the (patho)-physiological question of a very low ODP in vivo, it seems to be undisputed that in most bone regenerative therapy approaches, including tissue engineering of bone tissue, rapid and strong osteogenesis would have an enormous advantage and the use of exogenous added catalase could be an effective tool. However, how could one imagine the molecular mechanism of the effect of catalase observed here? H2O2 is a rather complicated cell signaling factor that acts as a second messenger. The signaling mechanism is based on a continuous flow of H2O2 between the cytoplasm and mitochondria, but also between the cytoplasm and the extracellular space, due to the concentration gradient. The increase in the H2O2 concentration in one compartment leads to a concentration gradient and consequently to a modified H2O2 flow into the other compartments. Here, mitochondria serve as reservoir areas for H2O2. An increase in the local H2O2 concentration as a result of adding the substance to the cell medium therefore not only leads to an increase in the H2O2 concentration in the cytoplasm, but also to a correspondingly graduated increase in the mitochondria [68]. Conversely, the extracellular application of catalase to the cell culture media has a significant impact on the H2O2 balance between the extracellular space, cytoplasm and mitochondria. Due to the catalase-related depletion of extracellular H2O2, diffusion of H2O2 out of the cell via the cell membrane or aquaporins [69] follows the concentration gradient. As a result of these events, there is a further diffusion-related flow of H2O2 from the mitochondria in the direction of the cytoplasm and thus the H2O2 effects in the mitochondria are reduced or blocked. An indicator for this is the raised MnSOD expression in catalase treated cells, probably in an attempt to restore mitochondrial H2O2. How other SODs might be affected needs to be investigated. These assumptions are based on the “steady-state H2O2 concentration” model proposed by Starkov and Treberg [68,70]. In this model, it is postulated that mitochondria have the ability to absorb excess H2O2 in the sense of a reservoir and that this excess H2O2 can be made available to the cell again even in the case of unphysiologically low extramitochondrial H2O2 concentrations [64,66]. However, it is not possible to say at this point whether depletion of H2O2 by catalase in the cytoplasm or mitochondria is the mechanism leading to increased osteogenesis, or whether catalase-induced disruption of intracellular H2O2 signaling pathways is the key factor.
In conclusion, we found that ASCs and DFATs of the same adipose tissue had very similar osteogenic capacity. Furthermore, variation in ODPs between donors was very apparent. Even with the underlying mechanism unknown, we want to highlight catalase as a beneficial addition to osteogenic induction medium or osteogenic biomaterial scaffolds for the tissue engineering of bone tissue. Catalase was able to improve osteogenesis about 2–2.5 fold in ASCs and DFATs in all donors despite donor variation.
Supplementary Materials
The following supporting information can be downloaded at: https://www.mdpi.com/article/10.3390/biomedicines10123071/s1, Figure S1: Generation of DFAT by ceiling culture; Figure S2: Exemplary histogram plots for cell-surface antigens; Figure S3: Correlation between the osteogenic differentiation potential of ASC and DFAT cultures; Table S1: Table of donor data.
Author Contributions
Conceptualization, A.B. and C.V.S.; Validation, H.C.S.; Investigation, A.B., H.C.S. and C.V.S.; Resources, J.L.S., P.C.F. and J.W.; Data curation, C.V.S.; Writing—original draft, A.B. and C.V.S.; Writing—review and editing, A.B., J.L.S., P.C.F., J.W. and C.V.S.; Funding acquisition, P.C.F. and J.W. All authors have read and agreed to the published version of the manuscript.
Funding
This work was supported by the Faculty of Medicine of the Heinrich-Heine-University Düsseldorf.
Institutional Review Board Statements
The experimental protocol and the use of human material have been approved by the local ethics committee of the Medical Faculty of the Heinrich-Heine-University Düsseldorf (study number: 3634) and the local ethics committee of the University of Witten Herdecke (study number: 78/2017) and conducted in compliance with the Declaration of Helsinki Principles.
Informed Consent Statement
The present manuscript does not contain any kind of individual person’s data in any form.
Data Availability Statement
The datasets used and/or analyzed during the current study are available from the corresponding author on reasonable request.
Acknowledgments
We thank Christa Maria Wilkens, Samira Seghrouchni, and Jutta Schneider for technical assistance.
Conflicts of Interest
The authors whose names are listed above certify that they neither actually nor potentially have any kind of affiliations with or involvement in any organization or entity with any financial interest (such as honoraria; educational grants; participation in speakers’ bureaus; membership, employment, consultancies, stock ownership, or other equity interest; and expert testimony or patent-licensing arrangements), or non-financial interest (such as personal or professional relationships, affiliations, knowledge or beliefs) in the subject matter or materials discussed in this manuscript.
References
- Rodriguez-Merchan, E.C. A Review of Recent Developments in the Molecular Mechanisms of Bone Healing. Int. J. Mol. Sci. 2021, 22, 767. [Google Scholar] [CrossRef] [PubMed]
- Fillingham, Y.; Jacobs, J. Bone grafts and their substitutes. Bone Jt. J. 2016, 98, 6–9. [Google Scholar] [CrossRef] [PubMed]
- Nauth, A.; Mckee, M.D.; Einhorn, T.A.; Watson, J.T.; Li, R.; Schemitsch, E.H. Managing Bone Defects. J. Orthop Trauma 2011, 25, 462–466. [Google Scholar] [CrossRef] [PubMed]
- Barba, M.; Di Taranto, G.; Lattanzi, W. Adipose-derived stem cell therapies for bone regeneration. Expert Opin. Biol. Ther. 2017, 17, 677–689. [Google Scholar] [CrossRef]
- Arthur, A.; Gronthos, S. Clinical Application of Bone Marrow Mesenchymal Stem/Stromal Cells to Repair Skeletal Tissue. Int. J. Mol. Sci. 2020, 21, 9759. [Google Scholar] [CrossRef]
- Chen, Q.; Shou, P.; Zheng, C.; Jiang, M.; Cao, G.; Yang, Q.; Cao, J.; Xie, N.; Velletri, T.; Zhang, X.; et al. Fate decision of mesenchymal stem cells: Adipocytes or osteoblasts? Cell Death Differ. 2016, 23, 1128–1139. [Google Scholar] [CrossRef]
- Yoshimura, K.; Coleman, S.R. Complications of Fat Grafting: How They Occur and How to Find, Avoid, and Treat Them. Clin. Plast. Surg. 2015, 42, 383–388. [Google Scholar] [CrossRef]
- Bacakova, L.; Zarubova, J.; Travnickova, M.; Musilkova, J.; Pajorova, J.; Slepicka, P.; Kasalkova, N.S.; Svorcik, V.; Kolska, Z.; Motarjemi, H.; et al. Stem cells: Their source, potency and use in regenerative therapies with focus on adipose-derived stem cells– A review. Biotechnol. Adv. 2018, 36, 1111–1126. [Google Scholar] [CrossRef]
- Si, Z.; Wang, X.; Sun, C.; Kang, Y.; Xu, J.; Wang, X.; Hui, Y. Adipose-derived stem cells: Sources, potency, and implications for regenerative therapies. Biomed. Pharmacother. 2019, 114, 108765. [Google Scholar] [CrossRef]
- Matsumoto, T.; Kano, K.; Kondo, D.; Fukuda, N.; Iribe, Y.; Tanaka, N.; Matsubara, Y.; Sakuma, T.; Satomi, A.; Otaki, M.; et al. Mature adipocyte-derived dedifferentiated fat cells exhibit multilineage potential. J. Cell Physiol. 2008, 215, 210–222. [Google Scholar] [CrossRef]
- Sugihara, H.; Yonemitsu, N.; Miyabara, S.; Yun, K. Primary cultures of unilocular fat cells: Characteristics of growth in vitro and changes in differentiation properties. Differentiation 1986, 31, 42–49. [Google Scholar] [CrossRef] [PubMed]
- Sameri, S.; Samadi, P.; Dehghan, R.; Salem, E.; Fayazi, N.; Amini, R. Stem Cell Aging in Lifespan and Disease: A State-of-the-Art Review. Curr. Stem. Cell Res. Ther. 2020, 15, 362–378. [Google Scholar] [CrossRef] [PubMed]
- Yamakawa, H.; Kusumoto, D.; Hashimoto, H.; Yuasa, S. Stem Cell Aging in Skeletal Muscle Regeneration and Disease. Int. J. Mol. Sci. 2020, 21, 1830. [Google Scholar] [CrossRef] [PubMed]
- Kahn, A.; Gibbons, R.; Perkins, S.; Gazit, D. Age-related bone loss. A hypothesis and initial assessment in mice. Clin. Orthop. Relat. Res. 1995, 313, 69–75. [Google Scholar]
- Moerman, E.J.; Teng, K.; Lipschitz, D.A.; Lecka-Czernik, B. Aging activates adipogenic and suppresses osteogenic programs in mesenchymal marrow stroma/stem cells: The role of PPAR-gamma2 transcription factor and TGF-beta/BMP signaling pathways. Aging Cell 2004, 3, 379–389. [Google Scholar] [CrossRef]
- Mueller, S.M.; Glowacki, J. Age-related decline in the osteogenic potential of human bone marrow cells cultured in three-dimensional collagen sponges. J. Cell. Biochem. 2001, 82, 583–590. [Google Scholar] [CrossRef]
- Zhou, S.; Greenberger, J.S.; Epperly, M.W.; Goff, J.P.; Adler, C.; Leboff, M.S.; Glowacki, J. Age-related intrinsic changes in human bone-marrow-derived mesenchymal stem cells and their differentiation to osteoblasts. Aging Cell 2008, 7, 335–343. [Google Scholar] [CrossRef]
- Liu, H.J.; Xia, X.C.; Li, B.J. Mesenchymal stem cell aging: Mechanisms and influences on skeletal and non-skeletal tissues. Exp. Biol. Med. 2015, 240, 1099–1106. [Google Scholar] [CrossRef]
- Strong, A.L.; Hunter, R.S.; Jones, R.B.; Bowles, A.C.; Dutreil, M.F.; Gaupp, D.; Hayes, D.J.; Gimble, J.M.; Levi, B.; McNulty, M.A.; et al. Obesity inhibits the osteogenic differentiation of human adipose-derived stem cells. J. Transl. Med. 2016, 14, 27. [Google Scholar] [CrossRef]
- Atashi, F.; Modarressi, A.; Pepper, M.S. The Role of Reactive Oxygen Species in Mesenchymal Stem Cell Adipogenic and Osteogenic Differentiation: A Review. Stem Cells Dev. 2015, 24, 1150–1163. [Google Scholar] [CrossRef]
- Kasper, G.; Mao, L.; Geissler, S.; Draycheva, A.; Trippens, J.; Kuhnisch, J.; Tschirschmann, M.; Kaspar, K.; Perka, C.; Duda, G.N.; et al. Insights into Mesenchymal Stem Cell Aging: Involvement of Antioxidant Defense and Actin Cytoskeleton. Stem Cells 2009, 27, 1288–1297. [Google Scholar] [CrossRef]
- Sun, Y.; Li, W.P.; Lu, Z.D.; Chen, R.; Ling, J.; Ran, Q.T.; Jilka, R.L.; Chen, X.D. Rescuing replication and osteogenesis of aged mesenchymal stem cells by exposure to a young extracellular matrix. FASEB J. 2011, 25, 1474–1485. [Google Scholar] [CrossRef]
- Huang, M.F.; Lin, W.L.; Ma, Y.C. A study of reactive oxygen species in mainstream of cigarette. Indoor Air. 2005, 15, 135–140. [Google Scholar] [CrossRef]
- Nakayama, T.; Church, D.F.; Pryor, W.A. Quantitative-Analysis of the Hydrogen-Peroxide Formed in Aqueous Cigarette Tar Extracts. Free. Radic. Biol. Med. 1989, 7, 9–15. [Google Scholar] [CrossRef]
- Masaki, H.; Atsumi, T.; Sakurai, H. Detection of Hydrogen-Peroxide and Hydroxyl Radicals in Murine Skin Fibroblasts under Uvb Irradiation. Biochem. Biophys. Res. Commun. 1995, 206, 474–479. [Google Scholar] [CrossRef]
- Peus, D.; Vasa, R.A.; Beyerle, A.; Meves, A.; Krautmacher, C.; Pittelkow, M.R. UVB activates ERK1/2 and p38 signaling pathways via reactive oxygen species in cultured keratinocytes. J. Investig. Dermatol. 1999, 112, 751–756. [Google Scholar] [CrossRef]
- Han, D.; Williams, E.; Cadenas, E. Mitochondrial respiratory chain-dependent generation of superoxide anion and its release into the intermembrane space. Biochem. J. 2001, 353, 411–416. [Google Scholar] [CrossRef]
- Selivanov, V.A.; Votyakova, T.V.; Pivtoraiko, V.N.; Zeak, J.; Sukhomlin, T.; Trucco, M.; Roca, J.; Cascante, M. Reactive oxygen species production by forward and reverse electron fluxes in the mitochondrial respiratory chain. PLoS Comput. Biol. 2011, 7, e1001115. [Google Scholar] [CrossRef]
- Birben, E.; Sahiner, U.M.; Sackesen, C.; Erzurum, S.; Kalayci, O. Oxidative stress and antioxidant defense. World Allergy Organ. J. 2012, 5, 9–19. [Google Scholar] [CrossRef]
- Chen, C.T.; Shih, Y.R.; Kuo, T.K.; Lee, O.K.; Wei, Y.H. Coordinated changes of mitochondrial biogenesis and antioxidant enzymes during osteogenic differentiation of human mesenchymal stem cells. Stem Cells 2008, 26, 960–968. [Google Scholar] [CrossRef]
- Mody, N.; Parhami, F.; Sarafian, T.A.; Demer, L.L. Oxidative stress modulates osteoblastic differentiation of vascular and bone cells. Free Radic. Biol. Med. 2001, 31, 509–519. [Google Scholar] [CrossRef]
- Pittenger, M.F.; Mackay, A.M.; Beck, S.C.; Jaiswal, R.K.; Douglas, R.; Mosca, J.D.; Moorman, M.A.; Simonetti, D.W.; Craig, S.; Marshak, D.R. Multilineage potential of adult human mesenchymal stem cells. Science 1999, 284, 143–147. [Google Scholar] [CrossRef]
- Gregory, C.A.; Gunn, W.G.; Peister, A.; Prockop, D.J. An Alizarin red-based assay of mineralization by adherent cells in culture: Comparison with cetylpyridinium chloride extraction. Anal. Biochem. 2004, 329, 77–84. [Google Scholar] [CrossRef]
- Bayraktar, S.; Jungbluth, P.; Deenen, R.; Grassmann, J.; Schneppendahl, J.; Eschbach, D.; Scholz, A.; Windolf, J.; Suschek, C.V.; Grotheer, V. Molecular- and microarray-based analysis of diversity among resting and osteogenically induced porcine mesenchymal stromal cells of several tissue origin. J. Tissue Eng. Regen. Med. 2018, 12, 114–128. [Google Scholar] [CrossRef]
- Sahlender, B.; Windolf, J.; Suschek, C.V. Superoxide dismutase and catalase significantly improve the osteogenic differentiation potential of osteogenetically compromised human adipose tissue-derived stromal cells in vitro. Stem Cell Res. 2022, 60, 102708. [Google Scholar] [CrossRef]
- Zuk, P.A.; Zhu, M.; Mizuno, H.; Huang, J.; Futrell, J.W.; Katz, A.J.; Benhaim, P.; Lorenz, H.P.; Hedrick, M.H. Multilineage cells from human adipose tissue: Implications for cell-based therapies. Tissue Eng. 2001, 7, 211–228. [Google Scholar] [CrossRef]
- Denker, A.E.; Haas, A.R.; Nicoll, S.B.; Tuan, R.S. Chondrogenic differentiation of murine C3H10T1/2 multipotential mesenchymal cells: I. Stimulation by bone morphogenetic protein-2 in high-density micromass cultures. Differentiation 1999, 64, 67–76. [Google Scholar] [CrossRef]
- van Osch, G.J.; van den Berg, W.B.; Hunziker, E.B.; Hauselmann, H.J. Differential effects of IGF-1 and TGF beta-2 on the assembly of proteoglycans in pericellular and territorial matrix by cultured bovine articular chondrocytes. Osteoarthr. Cartil. 1998, 6, 187–195. [Google Scholar] [CrossRef]
- Wosnitza, M.; Hemmrich, K.; Groger, A.; Pallua, N. Capacity of human adipose tissue derived precursor cells to perform adipogenic as well as endothelial differentiation. Cytotherapy 2006, 8, 1249. [Google Scholar]
- von Heimburg, D.; Hemmrich, K.; Zachariah, S.; Staiger, H.; Pallua, N. Oxygen consumption in undifferentiated versus differentiated adipogenic mesenchymal precursor cells. Respir. Physiol. Neurobiol. 2005, 146, 107–116. [Google Scholar] [CrossRef]
- Hemmrich, K.; von Heimburg, D.; Cierpka, K.; Haydarlioglu, S.; Pallua, N. Optimization of the differentiation of human preadipocytes in vitro. Differentiation 2005, 73, 28–35. [Google Scholar] [CrossRef]
- Dominici, M.; Le Blanc, K.; Mueller, I.; Slaper-Cortenbach, I.; Marini, F.; Krause, D.; Deans, R.; Keating, A.; Prockop, D.; Horwitz, E. Minimal criteria for defining multipotent mesenchymal stromal cells. The International Society for Cellular Therapy position statement. Cytotherapy 2006, 8, 315–317. [Google Scholar] [CrossRef] [PubMed]
- Petrenko, Y.; Vackova, I.; Kekulova, K.; Chudickova, M.; Koci, Z.; Turnovcova, K.; Kupcova Skalnikova, H.; Vodicka, P.; Kubinova, S. A Comparative Analysis of Multipotent Mesenchymal Stromal Cells derived from Different Sources, with a Focus on Neuroregenerative Potential. Sci. Rep. 2020, 10, 4290. [Google Scholar] [CrossRef] [PubMed]
- Albers, I.; Zernickel, E.; Stern, M.; Broja, M.; Busch, H.L.; Heiss, C.; Grotheer, V.; Windolf, J.; Suschek, C.V. Blue light (lambda = 453 nm) nitric oxide dependently induces beta-endorphin production of human skin keratinocytes in-vitro and increases systemic beta-endorphin levels in humans in-vivo. Free Radic. Biol. Med. 2019, 145, 78–86. [Google Scholar] [CrossRef]
- Gentile, P.; Sterodimas, A.; Calabrese, C.; Garcovich, S. Systematic review: Advances of fat tissue engineering as bioactive scaffold, bioactive material, and source for adipose-derived mesenchymal stem cells in wound and scar treatment. Stem Cell Res. Ther. 2021, 12, 318. [Google Scholar] [CrossRef]
- O’Connor, K.C. Molecular Profiles of Cell-to-Cell Variation in the Regenerative Potential of Mesenchymal Stromal Cells. Stem Cells Int. 2019, 2019, 5924878. [Google Scholar] [CrossRef]
- Phinney, D.G.; Kopen, G.; Righter, W.; Webster, S.; Tremain, N.; Prockop, D.J. Donor variation in the growth properties and osteogenic potential of human marrow stromal cells. J. Cell. Biochem. 1999, 75, 424–436. [Google Scholar] [CrossRef]
- Siddappa, R.; Licht, R.; van Blitterswijk, C.; de Boer, J. Donor variation and loss of multipotency during in vitro expansion of human mesenchymal stem cells for bone tissue engineering. J. Orthop. Res. 2007, 25, 1029–1041. [Google Scholar] [CrossRef]
- Kishimoto, N.; Momota, Y.; Hashimoto, Y.; Tatsumi, S.; Ando, K.; Omasa, T.; Kotani, J. The osteoblastic differentiation ability of human dedifferentiated fat cells is higher than that of adipose stem cells from the buccal fat pad. Clin. Oral Investig. 2014, 18, 1893–1901. [Google Scholar] [CrossRef]
- Watson, J.E.; Patel, N.A.; Carter, G.; Moor, A.; Patel, R.; Ghansah, T.; Mathur, A.; Murr, M.M.; Bickford, P.; Gould, L.J.; et al. Comparison of Markers and Functional Attributes of Human Adipose-Derived Stem Cells and Dedifferentiated Adipocyte Cells from Subcutaneous Fat of an Obese Diabetic Donor. Adv. Wound Care 2014, 3, 219–228. [Google Scholar] [CrossRef]
- Hao, W.; Jiang, C.Q.; Jiang, M.; Wang, T.; Wang, X. Osteogenic potency of dedifferentiated fat cells isolated from elderly people with osteoporosis. Exp. Ther. Med. 2017, 14, 43–50. [Google Scholar] [CrossRef] [PubMed]
- Mohamed-Ahmed, S.; Fristad, I.; Lie, S.A.; Suliman, S.; Mustafa, K.; Vindenes, H.; Idris, S.B. Adipose-derived and bone marrow mesenchymal stem cells: A donor-matched comparison. Stem Cell Res. Ther. 2018, 9, 168. [Google Scholar] [CrossRef] [PubMed]
- Roldan, M.; Macias-Gonzalez, M.; Garcia, R.; Tinahones, F.J.; Martin, M. Obesity short-circuits stemness gene network in human adipose multipotent stem cells. FASEB J. 2011, 25, 4111–4126. [Google Scholar] [CrossRef] [PubMed]
- Choudhery, M.S.; Badowski, M.; Muise, A.; Pierce, J.; Harris, D.T. Donor age negatively impacts adipose tissue-derived mesenchymal stem cell expansion and differentiation. J. Transl. Med. 2014, 12, 8. [Google Scholar] [CrossRef]
- Wu, W.; Niklason, L.; Steinbacher, D.M. The effect of age on human adipose-derived stem cells. Plast. Reconstr. Surg. 2013, 131, 27–37. [Google Scholar] [CrossRef]
- Kawagishi-Hotta, M.; Hasegawa, S.; Igarashi, T.; Yamada, T.; Takahashi, M.; Numata, S.; Kobayashi, T.; Iwata, Y.; Arima, M.; Yamamoto, N.; et al. Enhancement of individual differences in proliferation and differentiation potentials of aged human adipose-derived stem cells. Regen. Ther. 2017, 6, 29–40. [Google Scholar] [CrossRef]
- Stolzing, A.; Jones, E.; McGonagle, D.; Scutt, A. Age-related changes in human bone marrow-derived mesenchymal stem cells: Consequences for cell therapies. Mech. Ageing Dev. 2008, 129, 163–173. [Google Scholar] [CrossRef]
- Luo, J.; Mills, K.; le Cessie, S.; Noordam, R.; van Heemst, D. Ageing, age-related diseases and oxidative stress: What to do next? Ageing Res. Rev. 2020, 57, 100982. [Google Scholar] [CrossRef]
- Rani, V.; Deep, G.; Singh, R.K.; Palle, K.; Yadav, U.C.S. Oxidative stress and metabolic disorders: Pathogenesis and therapeutic strategies. Life Sci. 2016, 148, 183–193. [Google Scholar] [CrossRef]
- Aruoma, O.I. Free radicals, oxidative stress, and antioxidants in human health and disease. J. Am. Oil Chem. Soc. 1998, 75, 199–212. [Google Scholar] [CrossRef]
- Liu, Z.W.; Ren, Z.P.; Zhang, J.; Chuang, C.C.; Kandaswamy, E.; Zhou, T.Y.; Zuo, L. Role of ROS and Nutritional Antioxidants in Human Diseases. Front. Physiol. 2018, 9, 477. [Google Scholar] [CrossRef] [PubMed]
- Domazetovic, V.; Marcucci, G.; Iantomasi, T.; Brandi, M.L.; Vincenzini, M.T. Oxidative stress in bone remodeling: Role of antioxidants. Clin. Cases Miner. Bone Metab. 2017, 14, 209–216. [Google Scholar] [CrossRef] [PubMed]
- Manolagas, S.C. From Estrogen-Centric to Aging and Oxidative Stress: A Revised Perspective of the Pathogenesis of Osteoporosis. Endocr. Rev. 2010, 31, 266–300. [Google Scholar] [CrossRef] [PubMed]
- Wimalawansa, S.J. Vitamin D Deficiency: Effects on Oxidative Stress, Epigenetics, Gene Regulation, and Aging. Biology 2019, 8, 30. [Google Scholar] [CrossRef]
- Zhou, Q.Z.; Zhu, L.; Zhang, D.F.; Li, N.; Li, Q.; Dai, P.P.; Mao, Y.X.; Li, X.M.; Ma, J.F.; Huang, S.B. Oxidative Stress-Related Biomarkers in Postmenopausal Osteoporosis: A Systematic Review and Meta-Analyses. Dis. Markers 2016, 2016, 7067984. [Google Scholar] [CrossRef]
- Bindoli, A.; Fukuto, J.M.; Forman, H.J. Thiol chemistry in peroxidase catalysis and redox signaling. Antioxid. Redox. Signal 2008, 10, 1549–1564. [Google Scholar] [CrossRef]
- Sies, H. Hydrogen peroxide as a central redox signaling molecule in physiological oxidative stress: Oxidative eustress. Redox. Biol. 2017, 11, 613–619. [Google Scholar] [CrossRef]
- Treberg, J.R.; Munro, D.; Banh, S.; Zacharias, P.; Sotiri, E. Differentiating between apparent and actual rates of H2O2 metabolism by isolated rat muscle mitochondria to test a simple model of mitochondria as regulators of H2O2 concentration. Redox. Biol. 2015, 5, 216–224. [Google Scholar] [CrossRef]
- Bienert, G.P.; Schjoerring, J.K.; Jahn, T.P. Membrane transport of hydrogen peroxide. Biochim. Biophys. Acta 2006, 1758, 994–1003. [Google Scholar] [CrossRef]
- Starkov, A.A.; Andreyev, A.Y.; Zhang, S.F.; Starkova, N.N.; Korneeva, M.; Syromyatnikov, M.; Popov, V.N. Scavenging of H2O2 by mouse brain mitochondria. J. Bioenerg. Biomembr. 2014, 46, 471–477. [Google Scholar] [CrossRef]
Publisher’s Note: MDPI stays neutral with regard to jurisdictional claims in published maps and institutional affiliations. |
© 2022 by the authors. Licensee MDPI, Basel, Switzerland. This article is an open access article distributed under the terms and conditions of the Creative Commons Attribution (CC BY) license (https://creativecommons.org/licenses/by/4.0/).

