
Size Distribution of Inactivated Tick-Borne Encephalitis Virus Particles Revealed by a Comprehensive Physicochemical Approach

 , , , , and
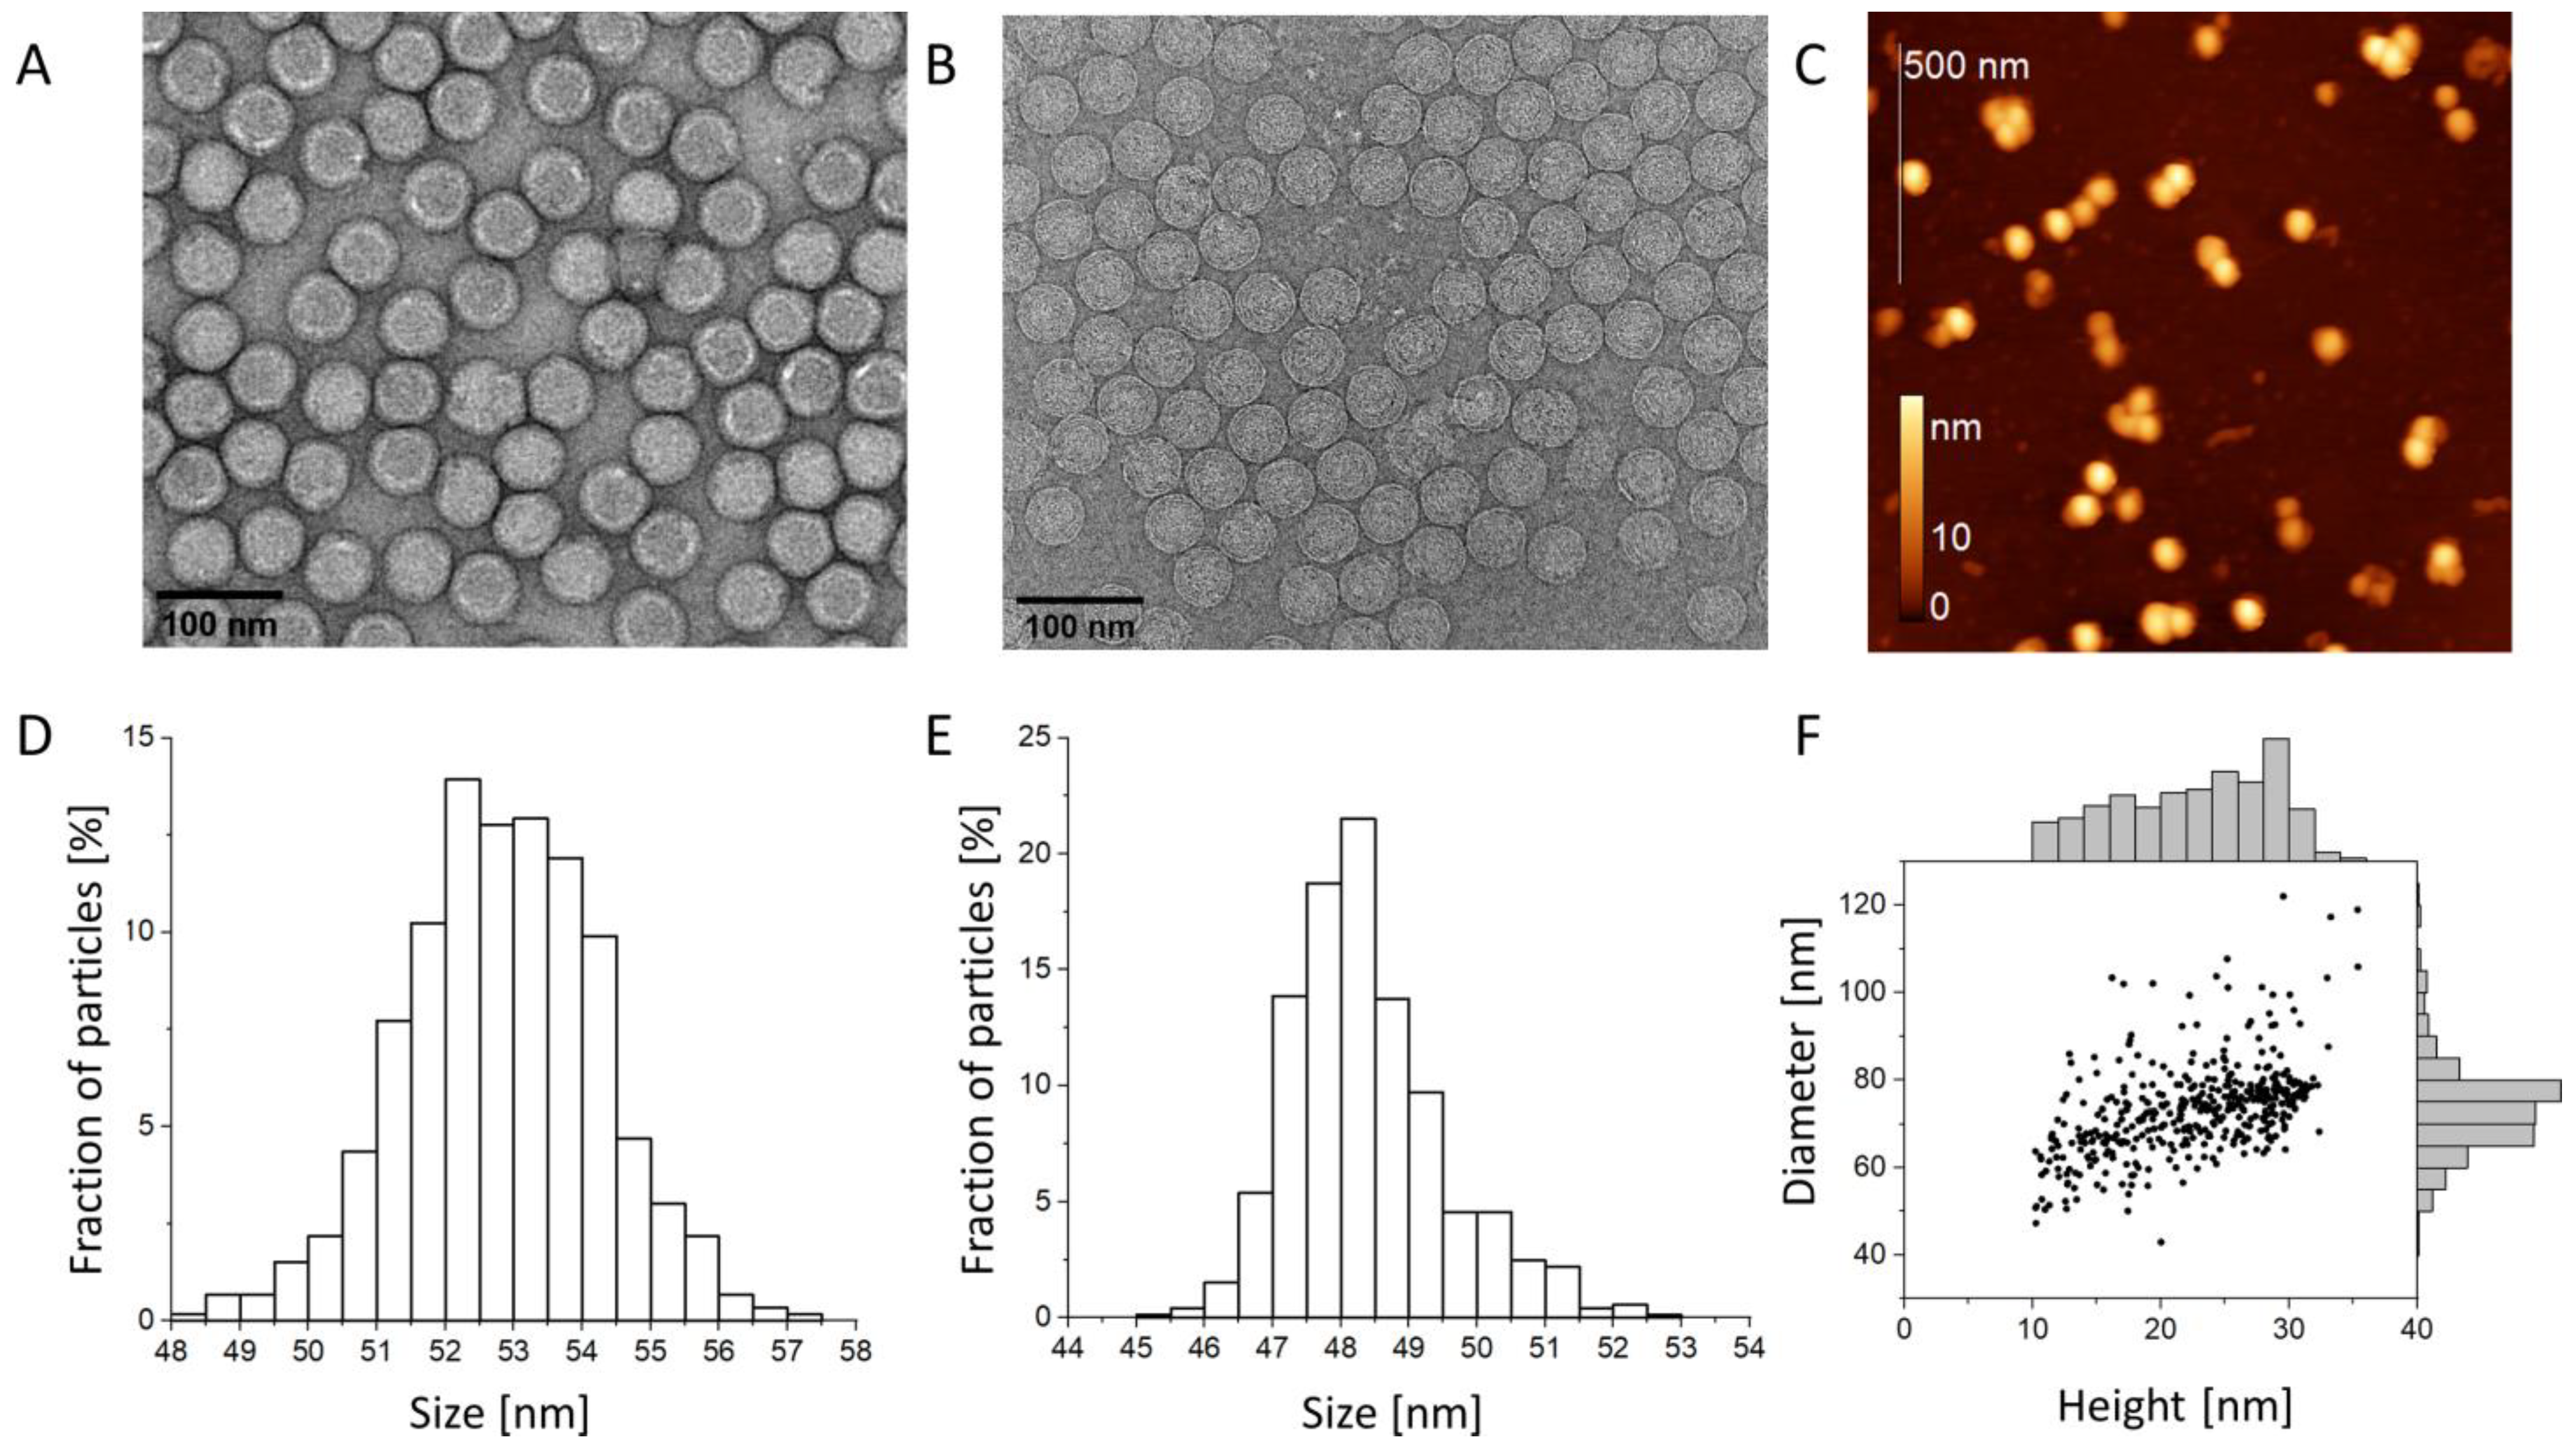
Abstract
1. Introduction
2. Materials and Methods
2.1. Obtaining Inactivated Virions of the TBEV
2.2. Determination of the Hydrodynamic Size of Virions
2.3. Electron Microscopy
2.4. Spectroscopy of Characteristic Electron Energy Loss (EELS)
2.5. Cryo-Electron Microscopy
2.6. Atomic Force Microscopy
2.7. Image Processing
2.8. Cryo-EM Reconstruction of the Tick-Borne Encephalitis Virus
3. Results and Discussion
3.1. Virion Size
3.2. Analysis of TBEV Structure
3.3. Phosphorus Mapping via STEM-EELS
4. Conclusions
Author Contributions
Funding
Data Availability Statement
Acknowledgments
Conflicts of Interest
References
- Füzik, T.; Formanová, P.; Růžek, D.; Yoshii, K.; Niedrig, M.; Plevka, P. Structure of tick-borne encephalitis virus and its neutralization by a monoclonal antibody. Nat. Commun. 2018, 9, 1–11. [Google Scholar] [CrossRef] [PubMed]
- Pulkkinen, L.I.A.; Barrass, S.V.; Domanska, A.; Överby, A.K.; Anastasina, M.; Butcher, S.J. Molecular Organisation of Tick-Borne Encephalitis Virus. Viruses 2022, 14, 792. [Google Scholar] [CrossRef] [PubMed]
- Lindenbach, B.D. Flaviviridae. Fields Virology, 6th ed.; Lippincott Williams & Wilkins (LWW): Philadelphia, PA, USA, 2013. [Google Scholar]
- Barrows, N.J.; Campos, R.K.; Liao, K.-C.; Prasanth, K.R.; Soto-Acosta, R.; Yeh, S.-C.; Schott-Lerner, G.; Pompon, J.; Sessions, O.M.; Bradrick, S.S.; et al. Biochemistry and Molecular Biology of Flaviviruses. Chem. Rev. 2018, 118, 4448–4482. [Google Scholar] [CrossRef] [PubMed]
- Hasan, S.S.; Sevvana, M.; Kuhn, R.J.; Rossmann, M.G. Structural biology of Zika virus and other flaviviruses. Nat. Struct. Mol. Biol. 2018, 25, 13–20. [Google Scholar] [CrossRef]
- Ruzek, D.; Avšič Županc, T.; Borde, J.; Chrdle, A.; Eyer, L.; Karganova, G.; Kholodilov, I.; Knap, N.; Kozlovskaya, L.; Matveev, A.; et al. Tick-Borne Encephalitis in Europe and Russia: Review of Pathogeesis, Clinical Features, Therapy, and Vaccines. Antiviral Res. 2019, 164, 23–51. [Google Scholar] [CrossRef]
- Chernokhaeva, L.L.; Kholodilov, I.S.; Pakskina, N.D. Current Distribution Area Of Tick-Borne Encephalitis In The Russian Federation. Proceedings Of The, M.P. Chumakov Institute of Polio And Viral Encephalitis of The Russian Academy Of Medical Sciences. Med Virol. 2016, 30, 6–22. [Google Scholar]
- Vratskikh, O.; Stiasny, K.; Zlatkovic, J.; Tsouchnikas, G.; Jarmer, J.; Karrer, U.; Roggendorf, M.; Roggendorf, H.; Allwinn, R.; Heinz, F.X. Dissection of Antibody Specificities Induced by Yellow Fever Vaccination. PLoS Pathog. 2013, 9, e1003458. [Google Scholar] [CrossRef]
- Bagrov, D.V.; Glukhov, G.S.; Moiseenko, A.V.; Karlova, M.G.; Litvinov, D.S.; Zaitsev, P.; Kozlovskaya, L.I.; Shishova, A.A.; Kovpak, A.A.; Ivin, Y.Y.; et al. Structural characterization of β-propiolactone inactivated severe acute respiratory syndrome coronavirus 2 ( SARS-CoV -2) particles. Microsc. Res. Tech. 2021, 85, 562–569. [Google Scholar] [CrossRef]
- Sokolova, O.; Shaburova, O.; Pechnikova, E.; Shaytan, A.; Krylov, S.; Kiselev, N.; Krylov, V. Genome packaging in EL and Lin68, two giant phiKZ-like bacteriophages of P. aeruginosa. Virology 2014, 468, 472–478. [Google Scholar] [CrossRef]
- Vorovitch, M.F.; Kozlovskaya, L.I.; Romanova, L.I.; Chernokhaeva, L.L.; Ishmukhametov, A.A.; Karganova, G.G. Genetic description of a tick-borne encephalitis virus strain Sofjin with the longest history as a vaccine strain. SpringerPlus 2015, 4, 1–5. [Google Scholar] [CrossRef]
- Fedotov, A.; Vorovitch, M.; Tuchinskaya, K.; Grishin, K.; Konyushko, O.; Osolodkin, D.; Ishmukhametov, A.; Egorov, A. Abstract P-28: Protocol of Tick-Borne Encephalitis Virus Sample Preparation for Structural Studies. Int. J. Biomed. 2019, 9, S29. [Google Scholar] [CrossRef]
- Dueva, E.V.; Tuchynskaya, K.K.; Kozlovskaya, L.; Osolodkin, D.; Sedenkova, K.N.; Averina, E.B.; Palyulin, V.; Karganova, G.G. Spectrum of antiviral activity of 4-aminopyrimidine N-oxides against a broad panel of tick-borne encephalitis virus strains. Antivir. Chem. Chemother. 2020, 28, 2040206620943462. [Google Scholar] [CrossRef] [PubMed]
- Mastronarde, D.N. Advanced Data Acquisition From Electron Microscopes with SerialEM. Microsc. Microanal. 2018, 24, 864–865. [Google Scholar] [CrossRef]
- Nikishin, I.; Dulimov, R.; Skryabin, G.; Galetsky, S.; Tchevkina, E.; Bagrov, D. ScanEV—A neural network-based tool for the automated detection of extracellular vesicles in TEM images. Micron 2021, 145, 103044. [Google Scholar] [CrossRef] [PubMed]
- Yaminsky, I.; Akhmetova, A.; Meshkov, G. FemtoScan Online Software and Visualization of Nano-Objects in High-Resolution Microscopy. Nanoindustry 2018, 11, 414–416. [Google Scholar] [CrossRef]
- Scheres, S.H. RELION: Implementation of a Bayesian approach to cryo-EM structure determination. J. Struct. Biol. 2012, 180, 519–530. [Google Scholar] [CrossRef]
- Pettersen, E.F.; Goddard, T.D.; Huang, C.C.; Couch, G.S.; Greenblatt, D.M.; Meng, E.C.; Ferrin, T.E. UCSF Chimera-a visualization system for exploratory research and analysis. J. Comput. Chem. 2004, 25, 1605–1612. [Google Scholar] [CrossRef]
- Božič, A.L.; Šiber, A.; Podgornik, R. Statistical analysis of sizes and shapes of virus capsids and their resulting elastic properties. J. Biol. Phys. 2013, 39, 215–228. [Google Scholar] [CrossRef]
- González-Domínguez, I.; Puente-Massaguer, E.; Cervera, L.; Gòdia, F. Quality Assessment of Virus-Like Particles at Single Particle Level: A Comparative Study. Viruses 2020, 12, 223. [Google Scholar] [CrossRef]
- Fritz, R.; Stiasny, K.; Heinz, F.X. Identification of specific histidines as pH sensors in flavivirus membrane fusion. J. Cell Biol. 2008, 183, 353–361. [Google Scholar] [CrossRef]
- Havlik, M.; Marchetti-Deschmann, M.; Friedbacher, G.; Winkler, W.; Messner, P.; Perez-Burgos, L.; Tauer, C.; Allmaier, G. Comprehensive Size-Determination of Whole Virus Vaccine Particles Using Gas-Phase Electrophoretic Mobility Macromolecular Analyzer, Atomic Force Microscopy, and Transmission Electron Microscopy. Anal. Chem. 2015, 87, 8657–8664. [Google Scholar] [CrossRef] [PubMed][Green Version]
- Havlik, M.; Marchetti-Deschmann, M.; Friedbacher, G.; Messner, P.; Winkler, W.; Perez-Burgos, L.; Tauer, C.; Allmaier, G. Development of a bio-analytical strategy for characterization of vaccine particles combining SEC and nanoES GEMMA. Analyst 2014, 139, 1412–1419. [Google Scholar] [CrossRef] [PubMed][Green Version]
- Van Der Pol, E.; Coumans, F.A.W.; Grootemaat, A.E.; Gardiner, C.; Sargent, I.L.; Harrison, P.; Sturk, A.; van Leeuwen, T.G.; Nieuwland, R. Particle size distribution of exosomes and microvesicles determined by transmission electron microscopy, flow cytometry, nanoparticle tracking analysis, and resistive pulse sensing. J. Thromb. Haemost. 2014, 12, 1182–1192. [Google Scholar] [CrossRef] [PubMed]
- Dubach, V.R.A.; Guskov, A. The Resolution in X-ray Crystallography and Single-Particle Cryogenic Electron Microscopy. Crystals 2020, 10, 580. [Google Scholar] [CrossRef]
- Lindqvist, R.; Rosendal, E.; Weber, E.; Asghar, N.; Schreier, S.; Lenman, A.; Johansson, M.; Dobler, G.; Bestehorn, M.; Kröger, A.; et al. The envelope protein of tick-borne encephalitis virus influences neuron entry, pathogenicity, and vaccine protection. J. Neuroinflammation 2020, 17, 1–15. [Google Scholar] [CrossRef]
- Kozlovskaya, L.; Osolodkin, D.; Shevtsova, A.; Romanova, L.; Rogova, Y.; Dzhivanian, T.; Lyapustin, V.; Pivanova, G.; Gmyl, A.; Palyulin, V.; et al. GAG-binding variants of tick-borne encephalitis virus. Virology 2010, 398, 262–272. [Google Scholar] [CrossRef]
- Trifonova, T.S.; Moiseenko, A.V.; Bourkaltseva, M.V.; Shaburova, O.V.; Shaytan, A.K.; Krylov, V.N.; Sokolova, O.S. DNA mapping in the capsid of giant bacteriophage phiEL (Caudovirales: Myoviridae: Elvirus) by analytical electron microscopy. Probl. Virol. 2022, 66, 434–441. [Google Scholar] [CrossRef]
- Gritsun, T.S.; Lisak, V.M.; Liapustin, V.N.; Korolev, M.B.; Lashkevich, V. Slowly-sedimenting hemagglutinin of the tick-borne encephalitis virus. Probl. Virol. 1989, 34, 449–454. [Google Scholar]
- Hashemi, P.; Luckau, L.; Mischnick, P.; Schmidt, S.; Stosch, R.; Wünsch, B. Biomacromolecules as tools and objects in nanometrology—current challenges and perspectives. Anal. Bioanal. Chem. 2017, 409, 5901–5909. [Google Scholar] [CrossRef]


Publisher’s Note: MDPI stays neutral with regard to jurisdictional claims in published maps and institutional affiliations. |
© 2022 by the authors. Licensee MDPI, Basel, Switzerland. This article is an open access article distributed under the terms and conditions of the Creative Commons Attribution (CC BY) license (https://creativecommons.org/licenses/by/4.0/).
Share and Cite
Moiseenko, A.V.; Bagrov, D.V.; Vorovitch, M.F.; Uvarova, V.I.; Veselov, M.M.; Kashchenko, A.V.; Ivanova, A.L.; Osolodkin, D.I.; Egorov, A.M.; Ishmukhametov, A.A.; et al. Size Distribution of Inactivated Tick-Borne Encephalitis Virus Particles Revealed by a Comprehensive Physicochemical Approach. Biomedicines 2022, 10, 2478. https://doi.org/10.3390/biomedicines10102478
Moiseenko AV, Bagrov DV, Vorovitch MF, Uvarova VI, Veselov MM, Kashchenko AV, Ivanova AL, Osolodkin DI, Egorov AM, Ishmukhametov AA, et al. Size Distribution of Inactivated Tick-Borne Encephalitis Virus Particles Revealed by a Comprehensive Physicochemical Approach. Biomedicines. 2022; 10(10):2478. https://doi.org/10.3390/biomedicines10102478
Chicago/Turabian StyleMoiseenko, Andrey V., Dmitry V. Bagrov, Mikhail F. Vorovitch, Victoria I. Uvarova, Maxim M. Veselov, Anastasia V. Kashchenko, Alla L. Ivanova, Dmitry I. Osolodkin, Alexey M. Egorov, Aydar A. Ishmukhametov, and et al. 2022. "Size Distribution of Inactivated Tick-Borne Encephalitis Virus Particles Revealed by a Comprehensive Physicochemical Approach" Biomedicines 10, no. 10: 2478. https://doi.org/10.3390/biomedicines10102478
APA StyleMoiseenko, A. V., Bagrov, D. V., Vorovitch, M. F., Uvarova, V. I., Veselov, M. M., Kashchenko, A. V., Ivanova, A. L., Osolodkin, D. I., Egorov, A. M., Ishmukhametov, A. A., Shaitan, K. V., & Sokolova, O. S. (2022). Size Distribution of Inactivated Tick-Borne Encephalitis Virus Particles Revealed by a Comprehensive Physicochemical Approach. Biomedicines, 10(10), 2478. https://doi.org/10.3390/biomedicines10102478