1. Introduction
Proteins belonging to the aegerolysin protein family, synthesized by oyster mushrooms (
Pleurotus spp.), are small (~15 kD) acidic proteins with a high affinity for membrane lipids and lipid domains. Several aegerolysin genes have been shown to be highly expressed in
Pleurotus mushrooms, and six of their protein products have been studied [
1]). Among these six aegerolysins, ostreolysin A6 (OlyA6) and its homologue recombinant OlyA (rOlyA) [
2], both produced by
P. ostreatus and differing in only one conservative amino acid substitution at position 51 (valine in OlyA6 vs. isoleucine in rOlyA), have been shown to interact specifically with lipid rafts—membrane domains that are enriched in both cholesterol and sphingomyelin (SM) [
3,
4,
5]. Lipid rafts are involved in numerous cellular functions, including signaling, trafficking, adhesion, migration and growth, all of which may involve interactions between rafts and myriad cytoskeletal proteins. A considerable amount of data has shown that microtubules and the actin cytoskeleton are intimately associated with lipid rafts [
6]. Interactions of caveolae with cytoskeletal components regulate endothelial trafficking and endocytosis [
6,
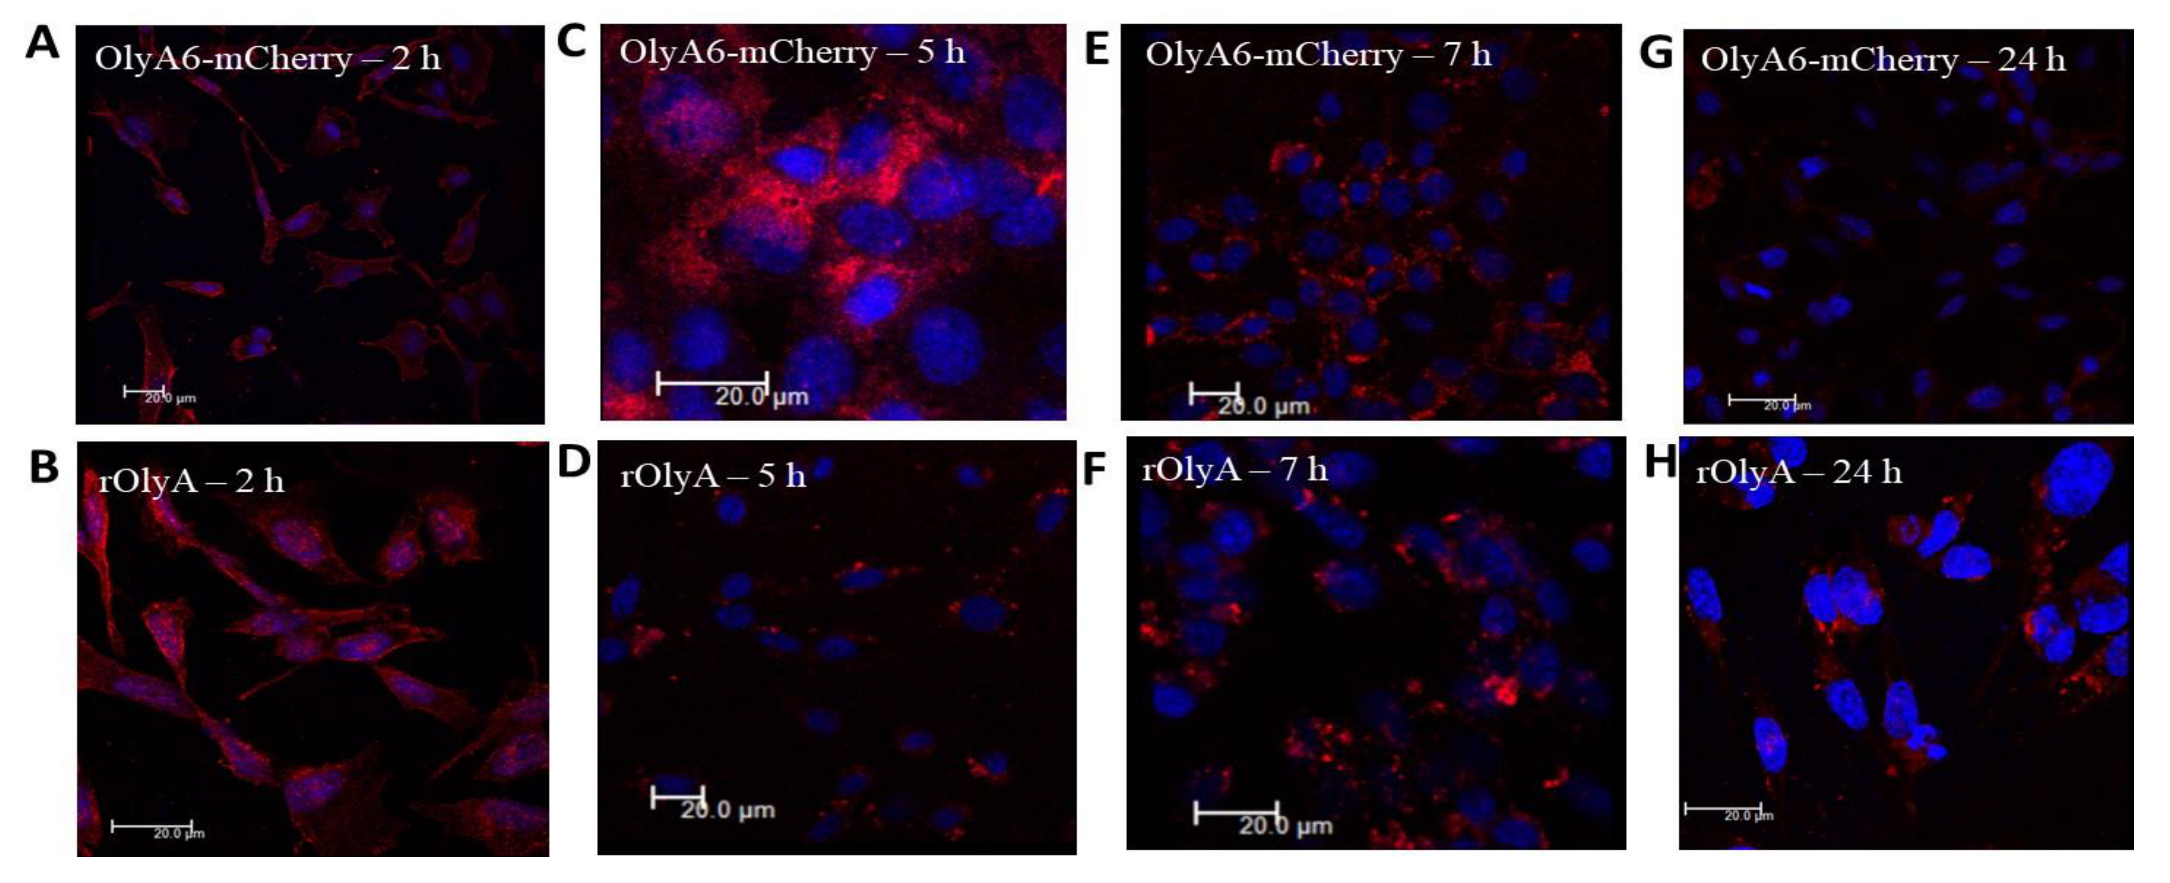
7]. Both rOlyA and OlyA6 are internalized via the caveolin-1-dependent endocytic pathway into the cytosol of HCT116 and MDCK cells, respectively [
5,
8]. Caveolins act as scaffolding proteins to cluster and regulate various signaling molecules targeted to the caveolae and activate cellular events [
9]. A fluorescent recombinant OlyA6 tagged at the C-terminus with mCherry (OlyA6-mCherry) was further shown to be a potential marker for visualization of cholesterol/SM-rich membrane domains, such as lipid rafts, in live mammalian cells [
5]. The same ability was shown for the C-terminal-tagged variant of pleurotolysin A2 (PlyA2), a protein derived from
Pleurotus eryngii (PlyA2-EGFP) [
10].
Tryptophan-rich regions have been reported to be responsible for the initial attachment to the membrane of several pore-forming proteins [
11,
12,
13]. Tryptophan plays a key role in promoting interfacial binding to anionic interfaces, such as bacterial membranes [
14]. Point mutations of tryptophan (W) to alanine (A) in PlyA2 also demonstrated the importance of C-terminal tryptophan residues for SM/cholesterol binding [
10].
We previously demonstrated that rOlyA has the unique ability to induce cell differentiation in HIB-1B preadipocytes associated with the typical formation of small lipid droplets within 24 h, a process that usually takes at least 8 days in differentiation media containing several drugs and hormones [
2]. Exposure of HIB-1B brown preadipocytes to rOlyA allowed us to measure changes in expression of genes associated with brown adipocyte differentiation and related to cellular metabolic activities, and even included modifications in cytoskeletal proteins. In that previous study, it was concluded that rOlyA interacts with the cytoskeleton, particularly with β-tubulin, and that this interaction is critical for the biological activity that induces the process of adipocyte differentiation [
2]. In addition, we reported analyses of the secondary structure of rOlyA using biophysical and bioinformatics tools [
2], results which were recently confirmed by the resolved crystal structure of OlyA6 [
15]. However, the functional sites and domains involved in rOlyA’s biological activity and the domains associated with the tubulin interaction still need to be characterized.
The present study aimed to examine the contribution of individual tryptophan residues to the structure of rOlyA, investigate their role in interactions with cytoskeleton-associated proteins and assess their contribution to the biological function of rOlyA in brown preadipocytes. As a tool, we also used OlyA6-mCherry, which is a marker for SM/cholesterol-rich membrane domains [
5]. OlyA6-mCherry can bind to the membrane and be internalized into the cell, enabling us to use the fluorescent tag as a tool to understand the functional region of OlyA6. Here, for the first time, we evaluated the biological activity of OlyA6-mCherry in HIB-1B preadipocytes and tested OlyA6-mCherry’s binding ability to α/β-tubulin. Results from these experiments, in combination with rOlyA–tubulin docking simulations, pinpoint the rOlyA region responsible for its bioactivity.
2. Materials and Methods
2.1. Construction of Expression Vector
Point-mutated genes were designed according to the coding and protein sequences of rOlyA from ostreolysin derived from
P. ostreatus cDNA that was originally obtained by PCR as previously reported [
8]. Single amino acid mutations were introduced according to this sequence. The plasmid containing rOly (pTRC99) was sequenced and aligned with KC012711.1 from NCBI GenBank. For each mutant, lyophilized pUC57-Amp plasmid was produced containing a sequence with a synthetic construct, the cloning prokaryotic expression vector pTRC99a. Plasmid pTRC99a:ECD [
16] was extracted, digested with
NcoI and
XbaI restriction enzymes and purified in an agarose gel. The digested and purified
Oly mutant gene products (417 bp) were cloned into linearized empty pTRC99a vector. This construct was transfected into
E. coli strain DH5α and isolated colonies expressed the mutant proteins. The resulting plasmids were confirmed by digestion with
XbaI and
NcoI.
2.2. Expression and Purification of Recombinant Mutant Proteins and OlyA6-mCherry
Mutant protein expression and purification procedures were performed as previously described [
2]. Protein concentration was determined by absorbance at 280 nm using a microvolume spectrophotometer (GeneQuant100, Biochrom, Cambridge, UK). Protein sizes and purities were determined by SDS-PAGE on homogeneous 10% acrylamide gels stained with Coomassie blue. OlyA6-mCherry was produced as described in Skočaj et al., 2014 [
5].
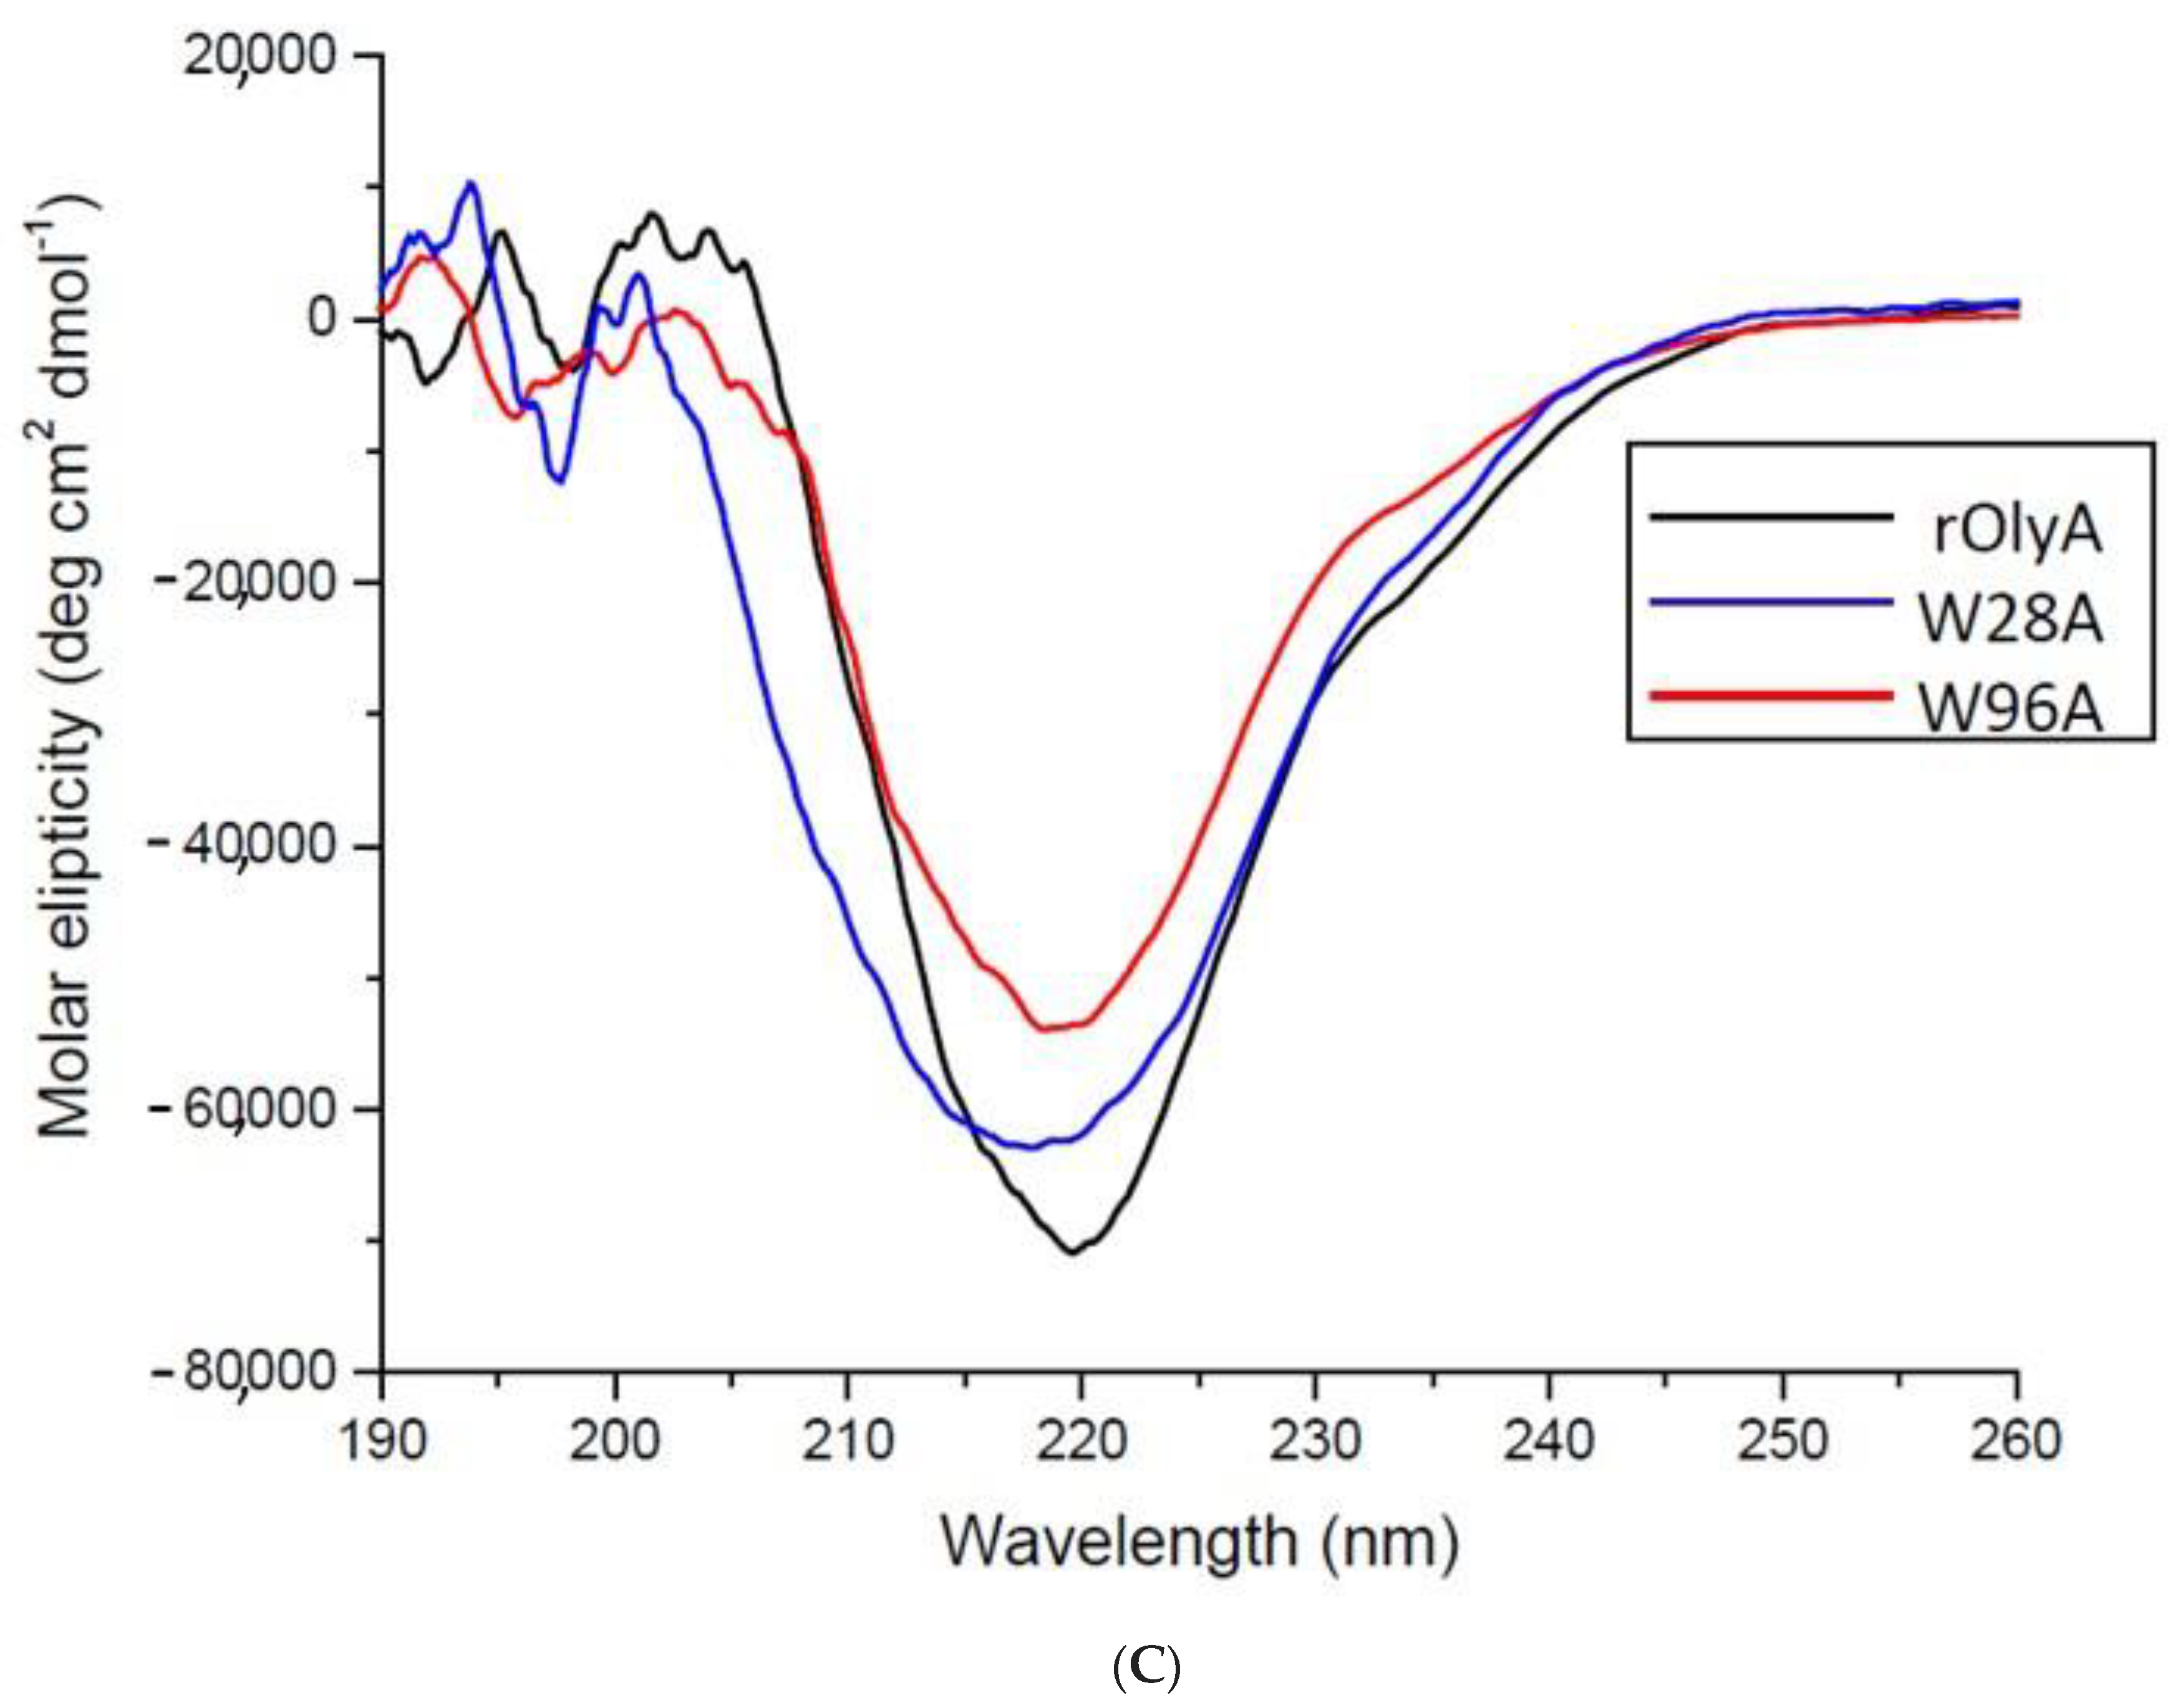
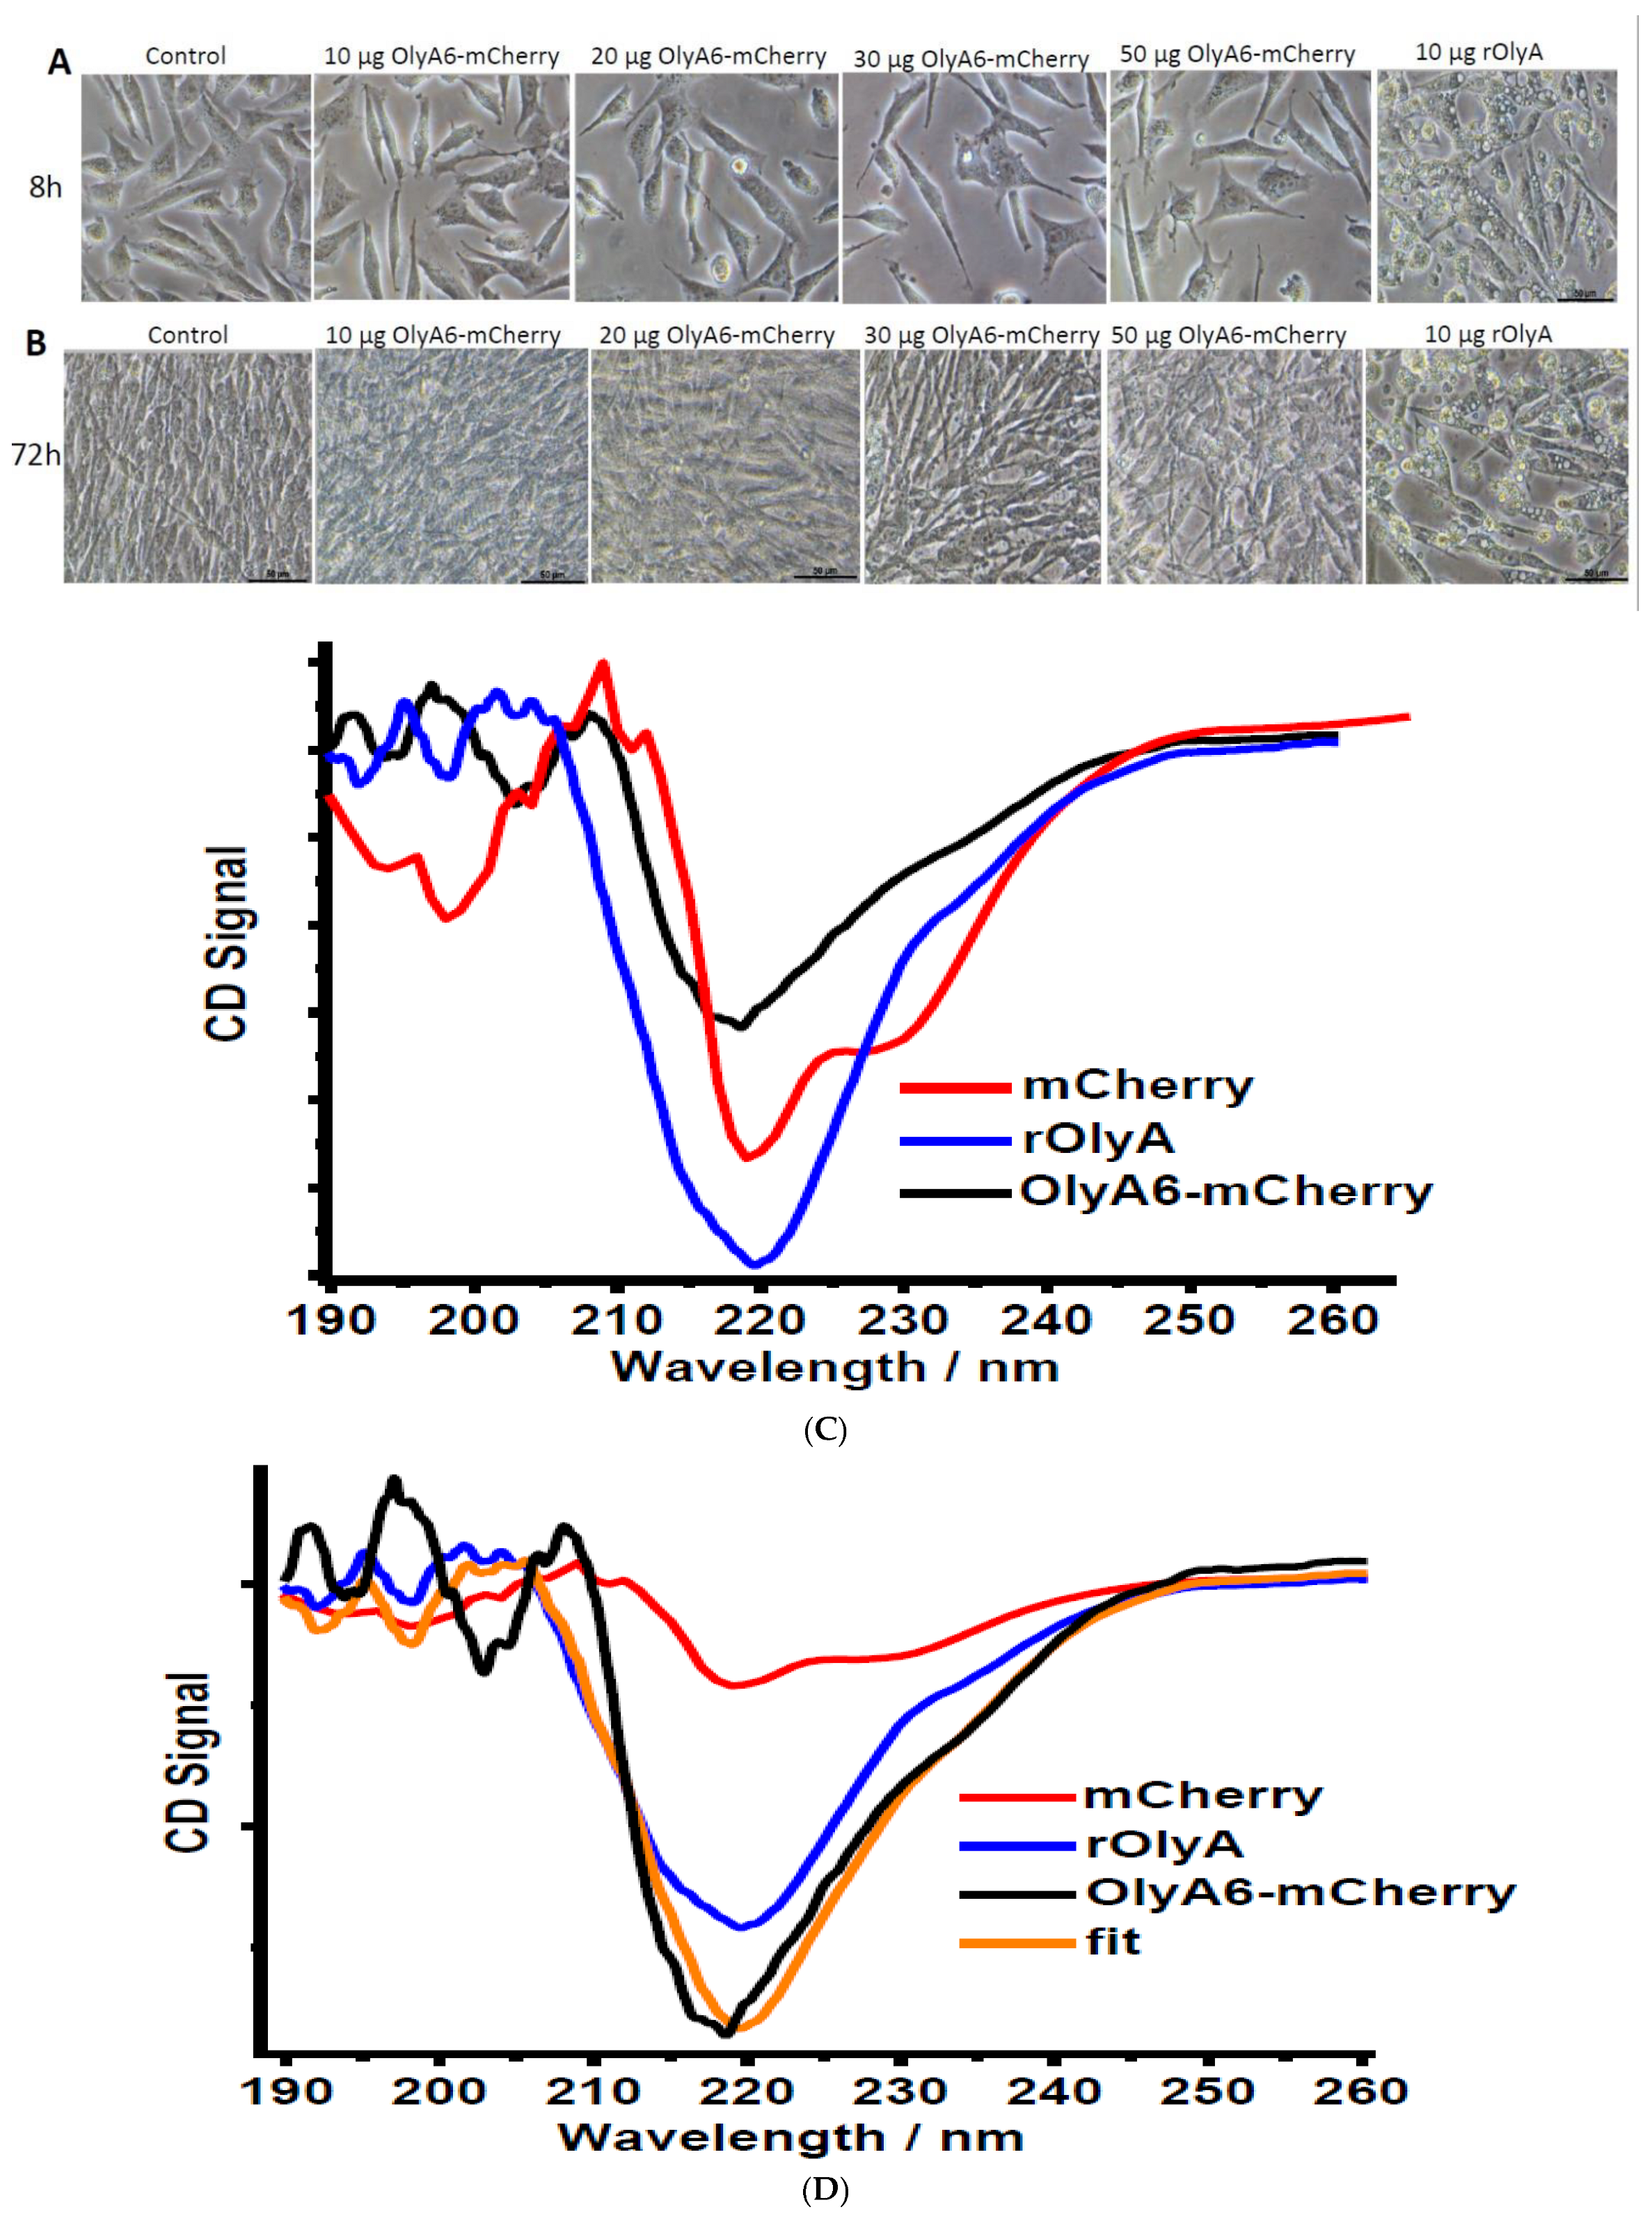
2.3. Determination of CD Spectra
CD spectra were recorded using a J-810 spectropolarimeter (Jasco, Easton, MD, USA) in a 0.1-cm quartz cuvette for far-ultraviolet CD spectroscopy. Spectra were collected over 190–260 nm at 25 °C. Lyophilized rOlyA, OlyA6-mCherry, and mutant proteins W28A and W96A were dissolved in water to 20 μM concentrations. The CD spectra were measured in five repetitions to obtain an average spectrum for each protein.
2.4. Cell Lines and Culture Conditions
HIB-1B cells were obtained from ATCC and maintained in DMEM (Sigma, St. Louis, MO, USA, Cat#D5796) supplemented with 10% (v/v) fetal bovine serum (Biological Industries, HaEmek, Israel, Cat#04-007-1A) and 0.2% (v/v) penicillin–streptomycin–nystatin (Bio-Lab, Jerusalem, Israel, Cat#943130203800) (growth medium). Cells were cultured in 5% CO2 in a humidified atmosphere at 37 °C. When cells reached 80–90% confluence, they were trypsinized using trypsin solution for approximately 3 min at 37 °C. Detached cells were resuspended in growth medium and seeded in plates. HIB1B cells were routinely tested for mycoplasma contamination.
2.5. Treatment of HIB-1B Cells
HIB-1B cells were plated in 6-well plates (Thermo Fisher Scientific, Carlsbad, CA, USA, Cat#140675) (2.0 × 10⁵ cells) and allowed to adhere overnight. Cells were treated with growth medium alone or supplemented with rOlyA or rOlyA mutants at a concentration of 10 μg mL−1. On day 2, HIB-1B cells were preincubated with rOlyA or rOlyA mutants at a concentration of 10 μg mL−1 or higher for the dose–response experiment. Tris-NaCl pH 8.0, the elution buffer for the mutants, was tested on cells in the same volume as the mutant proteins. For inhibition of internalization of rOlyA into HIB-1B cells, we used methyl-β-cyclodextrin (MβCD, Cat# 128446-36-6), which was obtained from Sigma Aldrich Fine Chemicals, Israel. Cells were seeded in 6-well plates at a density of (2.0 × 10⁵ cells) and allowed to adhere overnight. Then, the media were aspirated and replaced with the test solution containing only media or media containing MβCD dissolved in HEPES 20 mM. The endocytic pathway inhibitor MβCD was tested at 1.25 mM for 4.5 h. Then, the cells were harvested, seeded in coverslips, treated with rOlyA for 2 h and then underwent microscopic visualization. Three independent experiments were carried out.
2.6. Sandwich Solid-Phase Binding Assay and Tubulin Polymerization Assay
To analyze the direct binding of the proteins of interest to α/β-tubulin and polymerized α/β-tubulin, solid-phase binding assays were performed as described previously [
2]. Briefly, ELISA plates (Thermo Fisher Scientific, Cat#158348) were coated with 50 ng human β-tubulin 20 µg (0.1 mg mL
−1), Abcam ab70187 or human α-tubulin 2 µg (0.06 µg µL
−1 H00007846-P01) in 100 μL carbonate-bicarbonate buffer (pH 9.5) for 1 h at 37 °C. After washing, blocking was performed with 3% (
w/
v) bovine serum albumin (BSA) (Sigma, Cat#A9647) in 200 μL Tris-buffered saline (TBS) at 37 °C for 1 h. Wells were then washed with TBSTx1 (TBS and 0.1% Tween-20). Proteins of interest were added at 1:2 dilutions in 100 μL TBS, with rOlyA added at 10 ng well
−1 up to 50 ng well
−1; mutants W28A and W96A at 50 ng well
−1, 75 ng well
−1 and 100 ng well
−1; and OlyA6-mCherry at 50 ng well
−1 and 150 ng well
−1, then incubated for 1 h at 37 °C and washed three times with TBSTx1. Except in the case of OlyA6-mCherry, each well was treated with 100 μL rabbit anti-rOlyA diluted 1:2500 in TBS and incubated. The wells were washed with TBSTx1. The primary antibodies, rabbit anti-rOlyA in TBSx1, were incubated for 1 h at 37 °C, followed by three washes in TBSTx1. The secondary antibodies, goat anti-rabbit IgG-HRP in TBSx1, were incubated for 1 h at 37 °C, followed by three washes in TBSTx1. Then, 100 μL substrate (TMB, SouthernBiotech, Birmingham, AL, USA, Cat#0410-1) was added. After formation of a color reaction, TMB stop solution (2 M H
2SO
4) was added. Absorbance at 450 nm was measured using an ELX 808 ultra-microplate reader (BioTek Instruments, London, UK) with KCJunior software (York, UK). Affinity was evaluated by column plot.
The tubulin polymerization assay was based on the original method published by Lee et al. (1977) [
17]. The standard polymerization reaction contained 100 μL volume of 3 mg/mL α/β-tubulin in 80 mM PIPES pH 6.9, 0.5 mM EGTA, 2 mM MgCl
2, 1 mM GTP and 10% glycerol. Polymerization was started with incubation at 37 °C and followed by absorbance readings at 340 nm. Under these conditions, polymerization reached a maximal OD340 between 0.18–0.28 nm within 30 min and, at this time, polymerized α/β-tubulin was harvested. ELISA plates were then coated with aliquots of 50 ng polymerized tubulin and the sandwich solid-phase binding assay performed as described above.
2.7. Microscopy—Visualization of Colocalization of Tubulin Filaments and the Proteins of Interest in HIB-1B Cells
HIB-1B preadipocytes were seeded on coverslips and allowed to adhere overnight. They were then incubated with rOlyA or mutant proteins (10 μg mL−1) or without treatment (control) for 90 min, 7 h or 25 h and then washed with prewarmed PBS (Bio-Lab, Cat#001623237500), fixed with 4% paraformaldehyde [Electron Microscopy Sciences (EMS), Hatfield, PA, USA, Cat#15710] in PBS for 20 min, washed three times with ice-cold PBS, permeabilized with 0.2% (w/v) Tween 20–PBS solution for 10 min on ice, then washed three times for 5 min. Cells were covered with blocking solution, 10% (w/v) goat serum (Biological Industries, Cat#04-009-1A), in PBST (phosphate-buffered saline with Tween® detergent) buffer for 30 min; the blocking buffer was removed, and the diluted primary antibodies (in blocking buffer) were layered on the cover slips. First incubation was with antibodies against rOlyA (1:500) (designed and produced in our laboratory) diluted in blocking solution at 4 °C overnight. Anti-α tubulin (1:200; ab7291) and anti-β-tubulin (1:200, ab6046) were diluted in the blocking solution. Cells were incubated with primary antibody solution for 1 h at room temperature and then washed. Alexa Fluor secondary antibodies were added (1:500) in fresh blocking solution for 60 min at room temperature, followed by PBS washes. Cells were stained with DAPI, mounted in Fluoro-Gel (EMS, Cat#17985-10) and visualized by fluorescence laser scanning confocal microscopy with a Leica SP8 according to the following parameters: magnification—60X water; tubulin—Alexa Fluor 488, excitation 490 nm, emission 525 nm; caveolin-1—Alexa Fluor 488, excitation 490 nm, emission 525 nm; rOlyA—Alexa Fluor 594, excitation 590 nm, emission 617 nm; OlyA6-mCherry—excitation 587 nm, emission 610 nm; actin iFluor (phalloidin) 647—excitation 650 nm, emission 665 nm; DAPI—excitation 350 nm, emission 470 nm.
2.8. Image Analysis
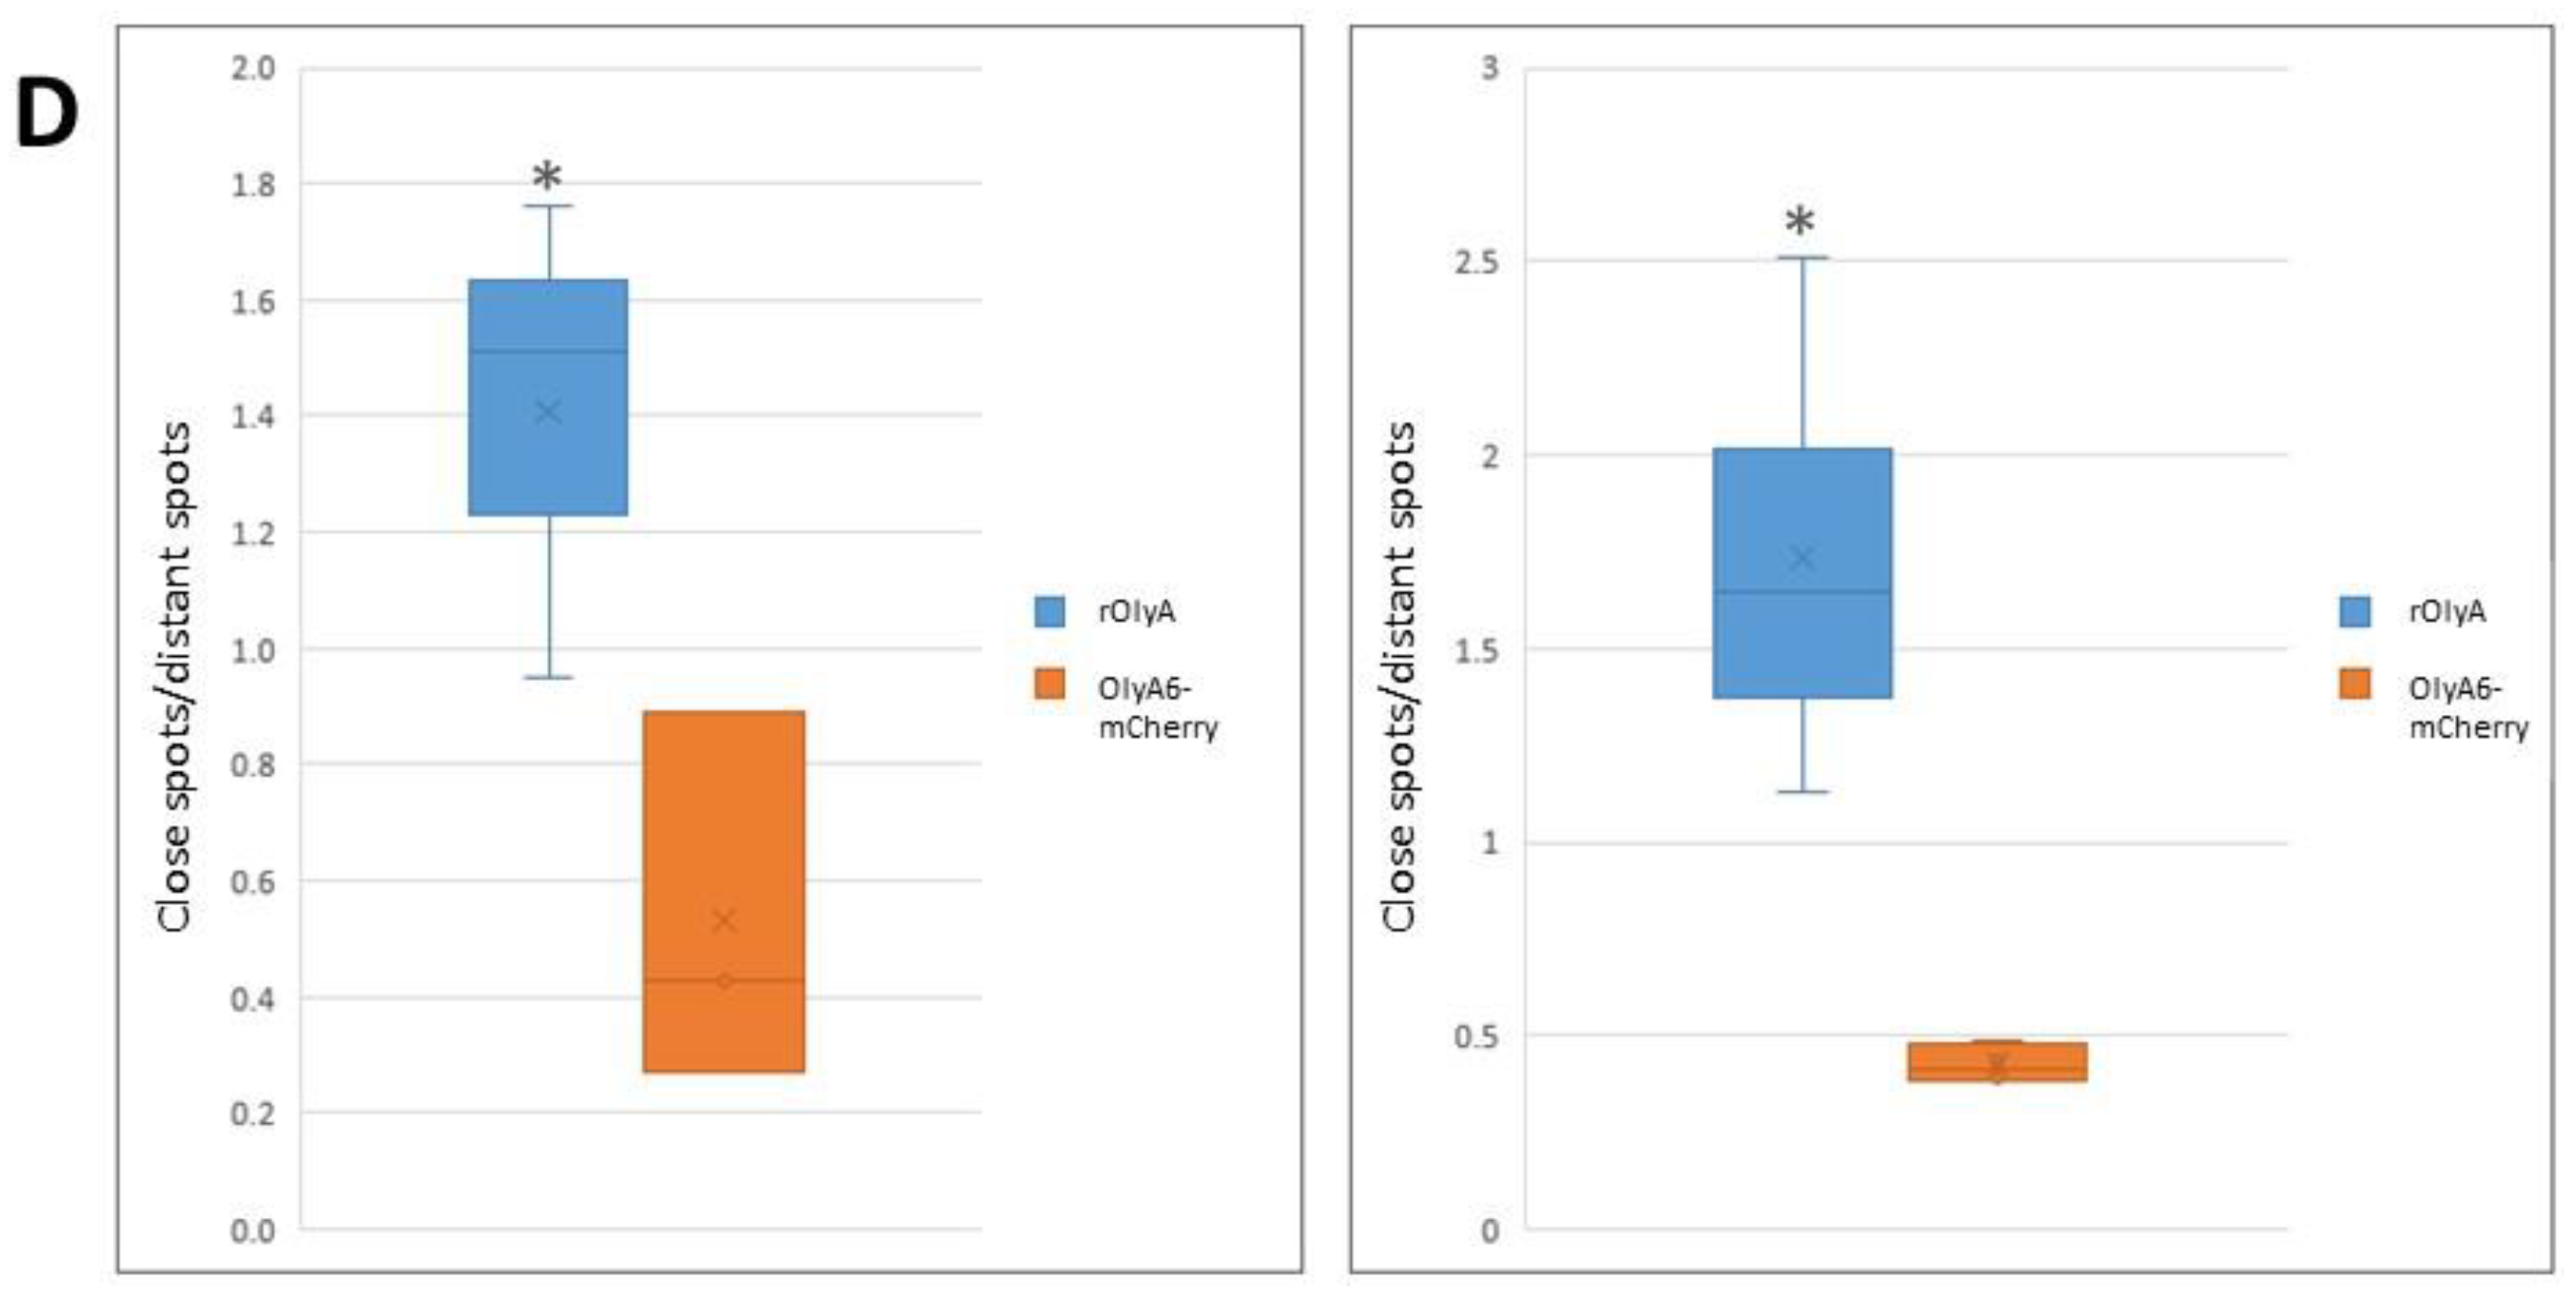
All imaging experiments were repeated at least three times, and a minimum of seven cells were analyzed per replicate. Three-dimensional (3D) confocal stacks of immunofluorescence were background-subtracted. Representative cells were selected from a random field of view on the coverslip. In addition, we automated our image analysis pipeline to ensure uniformity among all imaging processes. The resulting images were analyzed with Imaris software (version 8.4.1; Bitplane AG, Oxford Instruments, UK). Imaris was used to generate spots for the OlyA-containing proteins and tubulin filaments. Analysis flow was as follows: as tubulin is filamentous, we used the Imaris Filament module to create a filament object for the α- or β-tubulin stain (autopath algorithm, no loops). Next, we created a surface object for the nuclei using DAPI staining to get the total cell count in the image. Finally, we used the spot tool to identify OlyA6-mCherry. Once all objects were identified, we used the Find Spots Close to Filaments extension to identify the spots that colocolize with the tubulin filaments. All objects were segmented using the same parameters. The colocalized spots were defined as having a distance ≤0.2 µm, which included all protein spots that were closely attached to the tubulin filaments. Finally, the ratio between close protein spots and distant protein spots was calculated to produce the rate of rOlyA and tubulin colocalization.
2.9. Single-Molecule Localization Microscopy
dSTORM data were acquired on a Nanoimager S from Oxford Nanoimaging (ONI, Oxford, UK) equipped with an Olympus 100X, 1.4 NA oil-immersion objective, an XYZ closed-loop piezo stage and laser lines: 488 nm and 640 nm (Edmund Optics Inc., Barrington, NJ, USA). Fluorescence emission was detected using an sCMOS camera (ORCA Flash 4, Hamamatsu, Shizuoka, Japan) with 488–551 nm and 576–620 nm bandpass filters in channel 1 and a 666–705 nm bandpass filter in channel 2. Samples were imaged in ONI’s BCubed imaging buffer. Data were processed with NimOS software from ONI.
2.10. RNA Extraction and Reverse Transcription
Cells were treated as described in the Cell lines and culture conditions section. After 24 and 48 h incubation with rOlyA or mutants, 0.6 mL TRI-reagent (Sigma) was added to each sample and cells were collected into Eppendorf tubes. Then, 0.2 mL chloroform was added per 1 mL of TRI-reagent and vortexed vigorously. Samples were incubated for 2–3 min on ice, then centrifuged for 15 min at 12,500× g at 4 °C (Eppendorf 5430R centrifuge, Hamburg, Germany). The aqueous phase containing the RNA, ca. 250 μL, was collected in a new tube. RNA was further purified using the PureLink RNA mini kit according to the manufacturer’s instructions (Thermo Fisher Scientific, Cat#12183018A). RNA concentration was determined using a NanoDrop 2000 spectrophotometer (NanoDrop Technologies, Montchanin, DE, USA). Total RNA was treated with DNase I using TURBO DNase (Thermo Fisher Scientific, Cat#AM1907) for 30 min at 37 °C, followed by RNase inhibitor (Thermo Fisher Scientific, Cat#EO0381). RNA (1 μg) was used for cDNA synthesis with the qScript cDNA Synthesis kit, according to the manufacturer’s protocol (Quantabio, Beverly, MA, USA).
2.11. Real-Time PCR
Real-time PCR relative quantification analysis using the ΔΔCT method was performed on a QuantStudio 1 instrument (Applied Biosystems, Waltham, MA, USA) with the Fast SYBR Green Master Mix (Applied Biosystems). Each sample was analyzed in triplicate with cDNA corresponding to 25 ng template RNA and a final 0.4 μm of each primer set. Cycling conditions were set at 95 °C for 10 min, followed by 40 cycles at 95 °C for 15 s and 60 °C for 1 min. All real-time PCR data were normalized to the housekeeping gene
RPL 41 [
18] using a standard curve.
2.12. Protein Purification from Cells
Cells were treated as described in the Cell lines and culture conditions section. After incubation with rOlyA or its mutants (10 μg mL−1) for 7 or 25 h, plates were washed twice in ice-cold PBS and 100 μL lysis buffer added to each well. After 10 min incubation, cells were collected by scraping into cold Eppendorf tubes. After lysing, insoluble material was spun down at 4 °C at maximum speed for 10 min (Eppendorf 5430R centrifuge, Merck & Co. Herzliya Pituach, Israel). Supernatant containing the soluble protein lysates from the cells was collected and used for protein quantification.
2.13. Protein Quantification
Protein concentration was determined by microbicinchoninic acid-based protein assay (Thermo Fisher Scientific, Cat#23225) using BSA as the standard. Protein concentrations were assessed at 550 nm in the ELX 808 ultra-microplate reader using KCJunior software (BioTek Instruments, Santa Clara, CA, USA).
2.14. Western Blot Analysis
HIB-1B lysates were electrophoresed on 10–15% SDS-polyacrylamide gels and transferred to nitrocellulose membranes (Whatman, Schleicher & Schuell, Dassel, Germany). The membranes were blocked for 1 h at room temperature in TBST containing 5% (w/v) skim milk powder and incubated with primary antibodies (at different dilutions) overnight at 4 °C. Membranes were then incubated with secondary anti-rabbit antibodies for 1 h at room temperature. Proteins were visualized using Western blotting luminol reagent with a ChemiDocTM MP Imaging System (Bio-Rad Laboratories, Berkeley, CA, USA). To assess the quality and content of the loaded samples, the target proteins were normalized to β-actin.
2.15. Statistical Analyses
Results are expressed as mean ± s.e.m. Comparison between groups was performed by ANOVA and all-pairs Tukey-HSD. All statistical analyses were conducted with JMP (SAS Institute Inc, Cary, NC, USA), and differences were considered significant at p < 0.05.
2.16. OlyA6-mCherry Structure Modeling
mCherry homology modeling was modeled from 2H5Q.pdb (mCherry structure, res 9-228) and 3NED.pdb (mRouge structure, res 6-237). mRouge has more residues and was used as a model for regions that were not solved in the mCherry structure.
To build the model of OlyA6-mCherry, we used protein–protein docking simulations (Piper as implemented in ClusPro 2.0) [
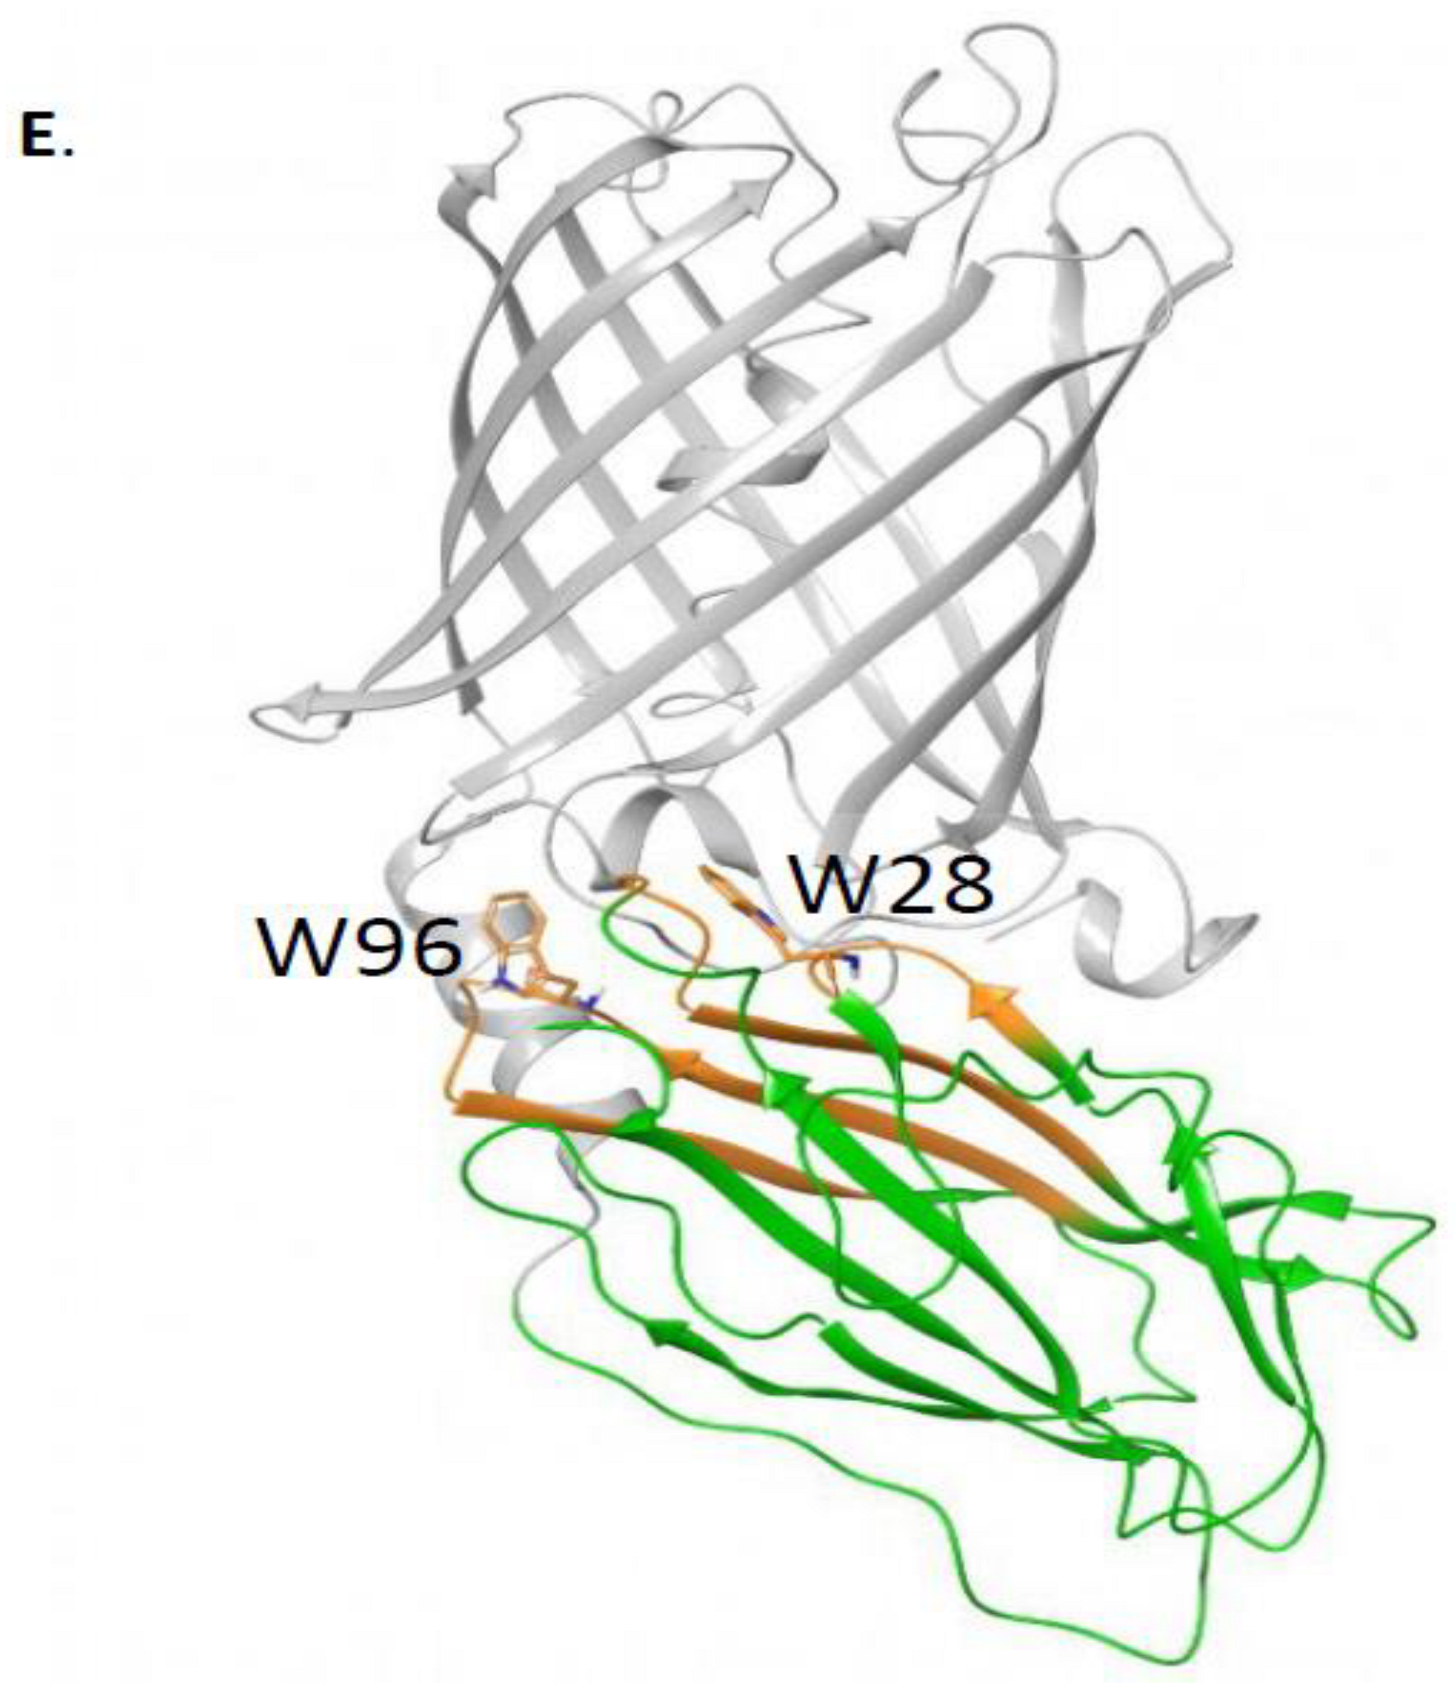
19] to sample the possible interacting modes of OlyA6 and mCherry, and loop modeling and minimization tools (Prime and Macromodel, Schrödinger) to connect the two structures. The OlyA6-mCherry complex has a linker of 12 amino acids (GSEGKGSSSGSG); we modeled OlyA6-GSE (from PDB ID: 6MYK) and GSG-mCherry (PDB ID: 2H5Q, missing residues in this structure were modeled using the mRouge structure 3NED.pdb as template) as input structures for the docking. The OlyA6 structure ends with a non-structured loop and, therefore, several conformations of this loop were used as input structures for the docking analysis. We generated 577 docking poses and, by visual inspection, we selected 71 poses that place the C-terminus of OlyA6 in close proximity to the N-terminus of mCherry to allow the link and protein binding. These 71 poses were then clustered by structural similarity into 12 poses. The representative structures of the clusters were analyzed. The final model was selected based on the involvement of W28 and W96 in the interaction and the population of the cluster. Using Prime (Schrödinger), we modeled the linker that connects the two proteins in the complex and refined the 3D model.
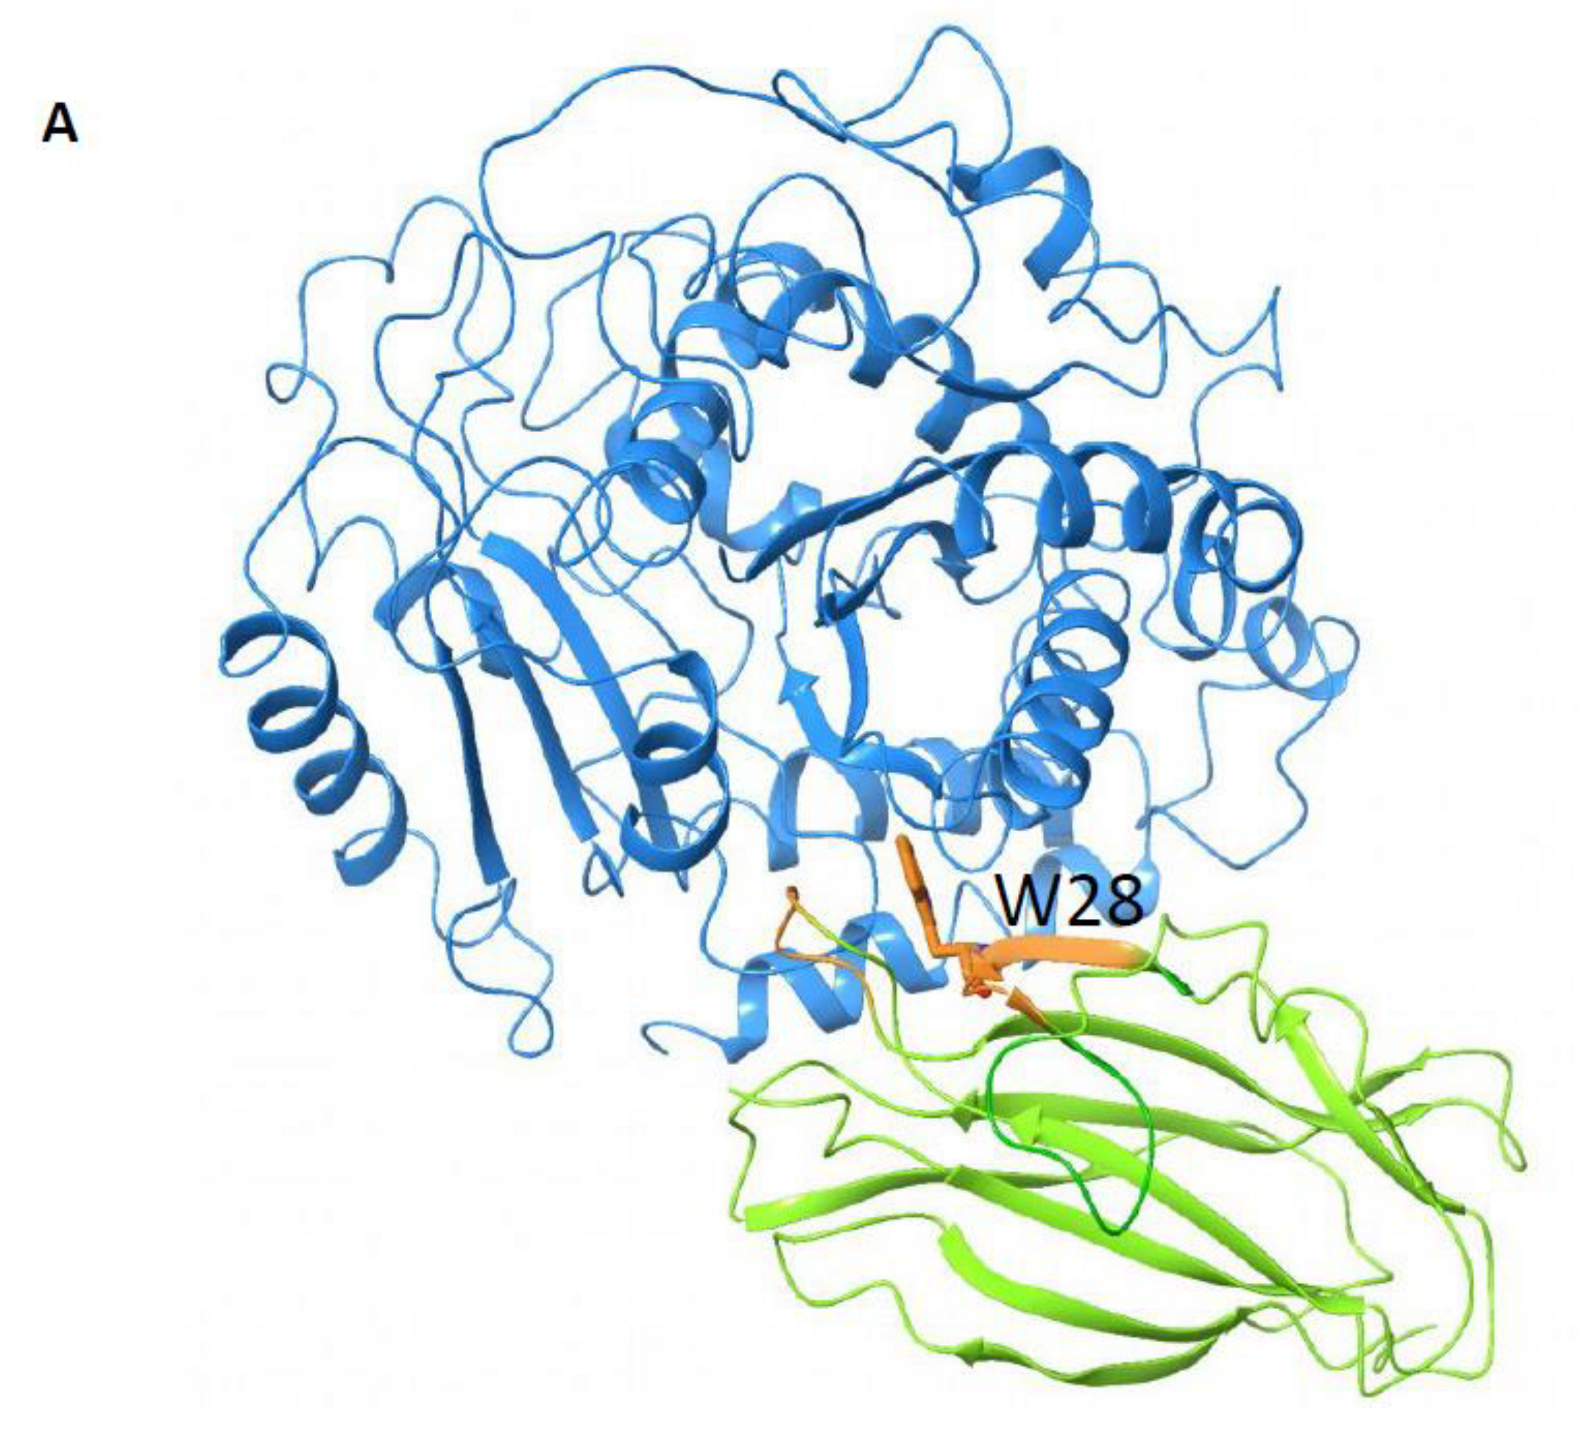
2.17. β-Tubulin–Olya6 Docking
Docking calculations were performed with β-tubulin (PDB ID: 1TUB) as the target and OlyA6 (PDB ID: 6MYI) as the ligand using ClusPro 2.0 [
20], Boston University, Boston, USA. We set 30 poses as output because it has been shown that the 30 largest clusters contain at least one near-native structure [
20]. These 30 poses were then minimized to a derivative convergence of 0.05 kJ mol
−1 Å
−1 using the Polak–Ribiere–Polyak (PRP) conjugate gradient minimization algorithm, the OPLS2005 force field and the GB/SA water-solvation model implemented in MacroModel (Schrödinger 2018). The best pose among the 30 generated docking poses was selected considering the ranking order (cluster population) and taking into consideration the fact that if OlyA6 is supposed to bind to microtubules, it cannot bind to regions of β-tubulin that are involved in heterodimerization with α-tubulin.
4. Discussion
Our previous research demonstrated that the oyster mushroom-derived recombinant aegerolysin protein rOlyA binds to adipocyte lipid rafts, is internalized into the cell via caveolin-1-dependent endocytosis and induces brown adipocyte differentiation through activation of PGC-1α and stimulation of mitochondrial biogenesis [
2]. The goal of the present study was to identify the rOlyA residues involved in these activities. Moreover, our interest was to assess the main cellular components involved in rOlyA cell internalization and its associated biological activity.
Microtubules play a major role in the intracellular trafficking of vesicles in cells. We previously demonstrated the interaction of rOlyA with β-tubulin and its association with preadipocytes’ differentiation process [
2]. Here, we explored the role of microtubules in rOlyA cell internalization and cellular activity.
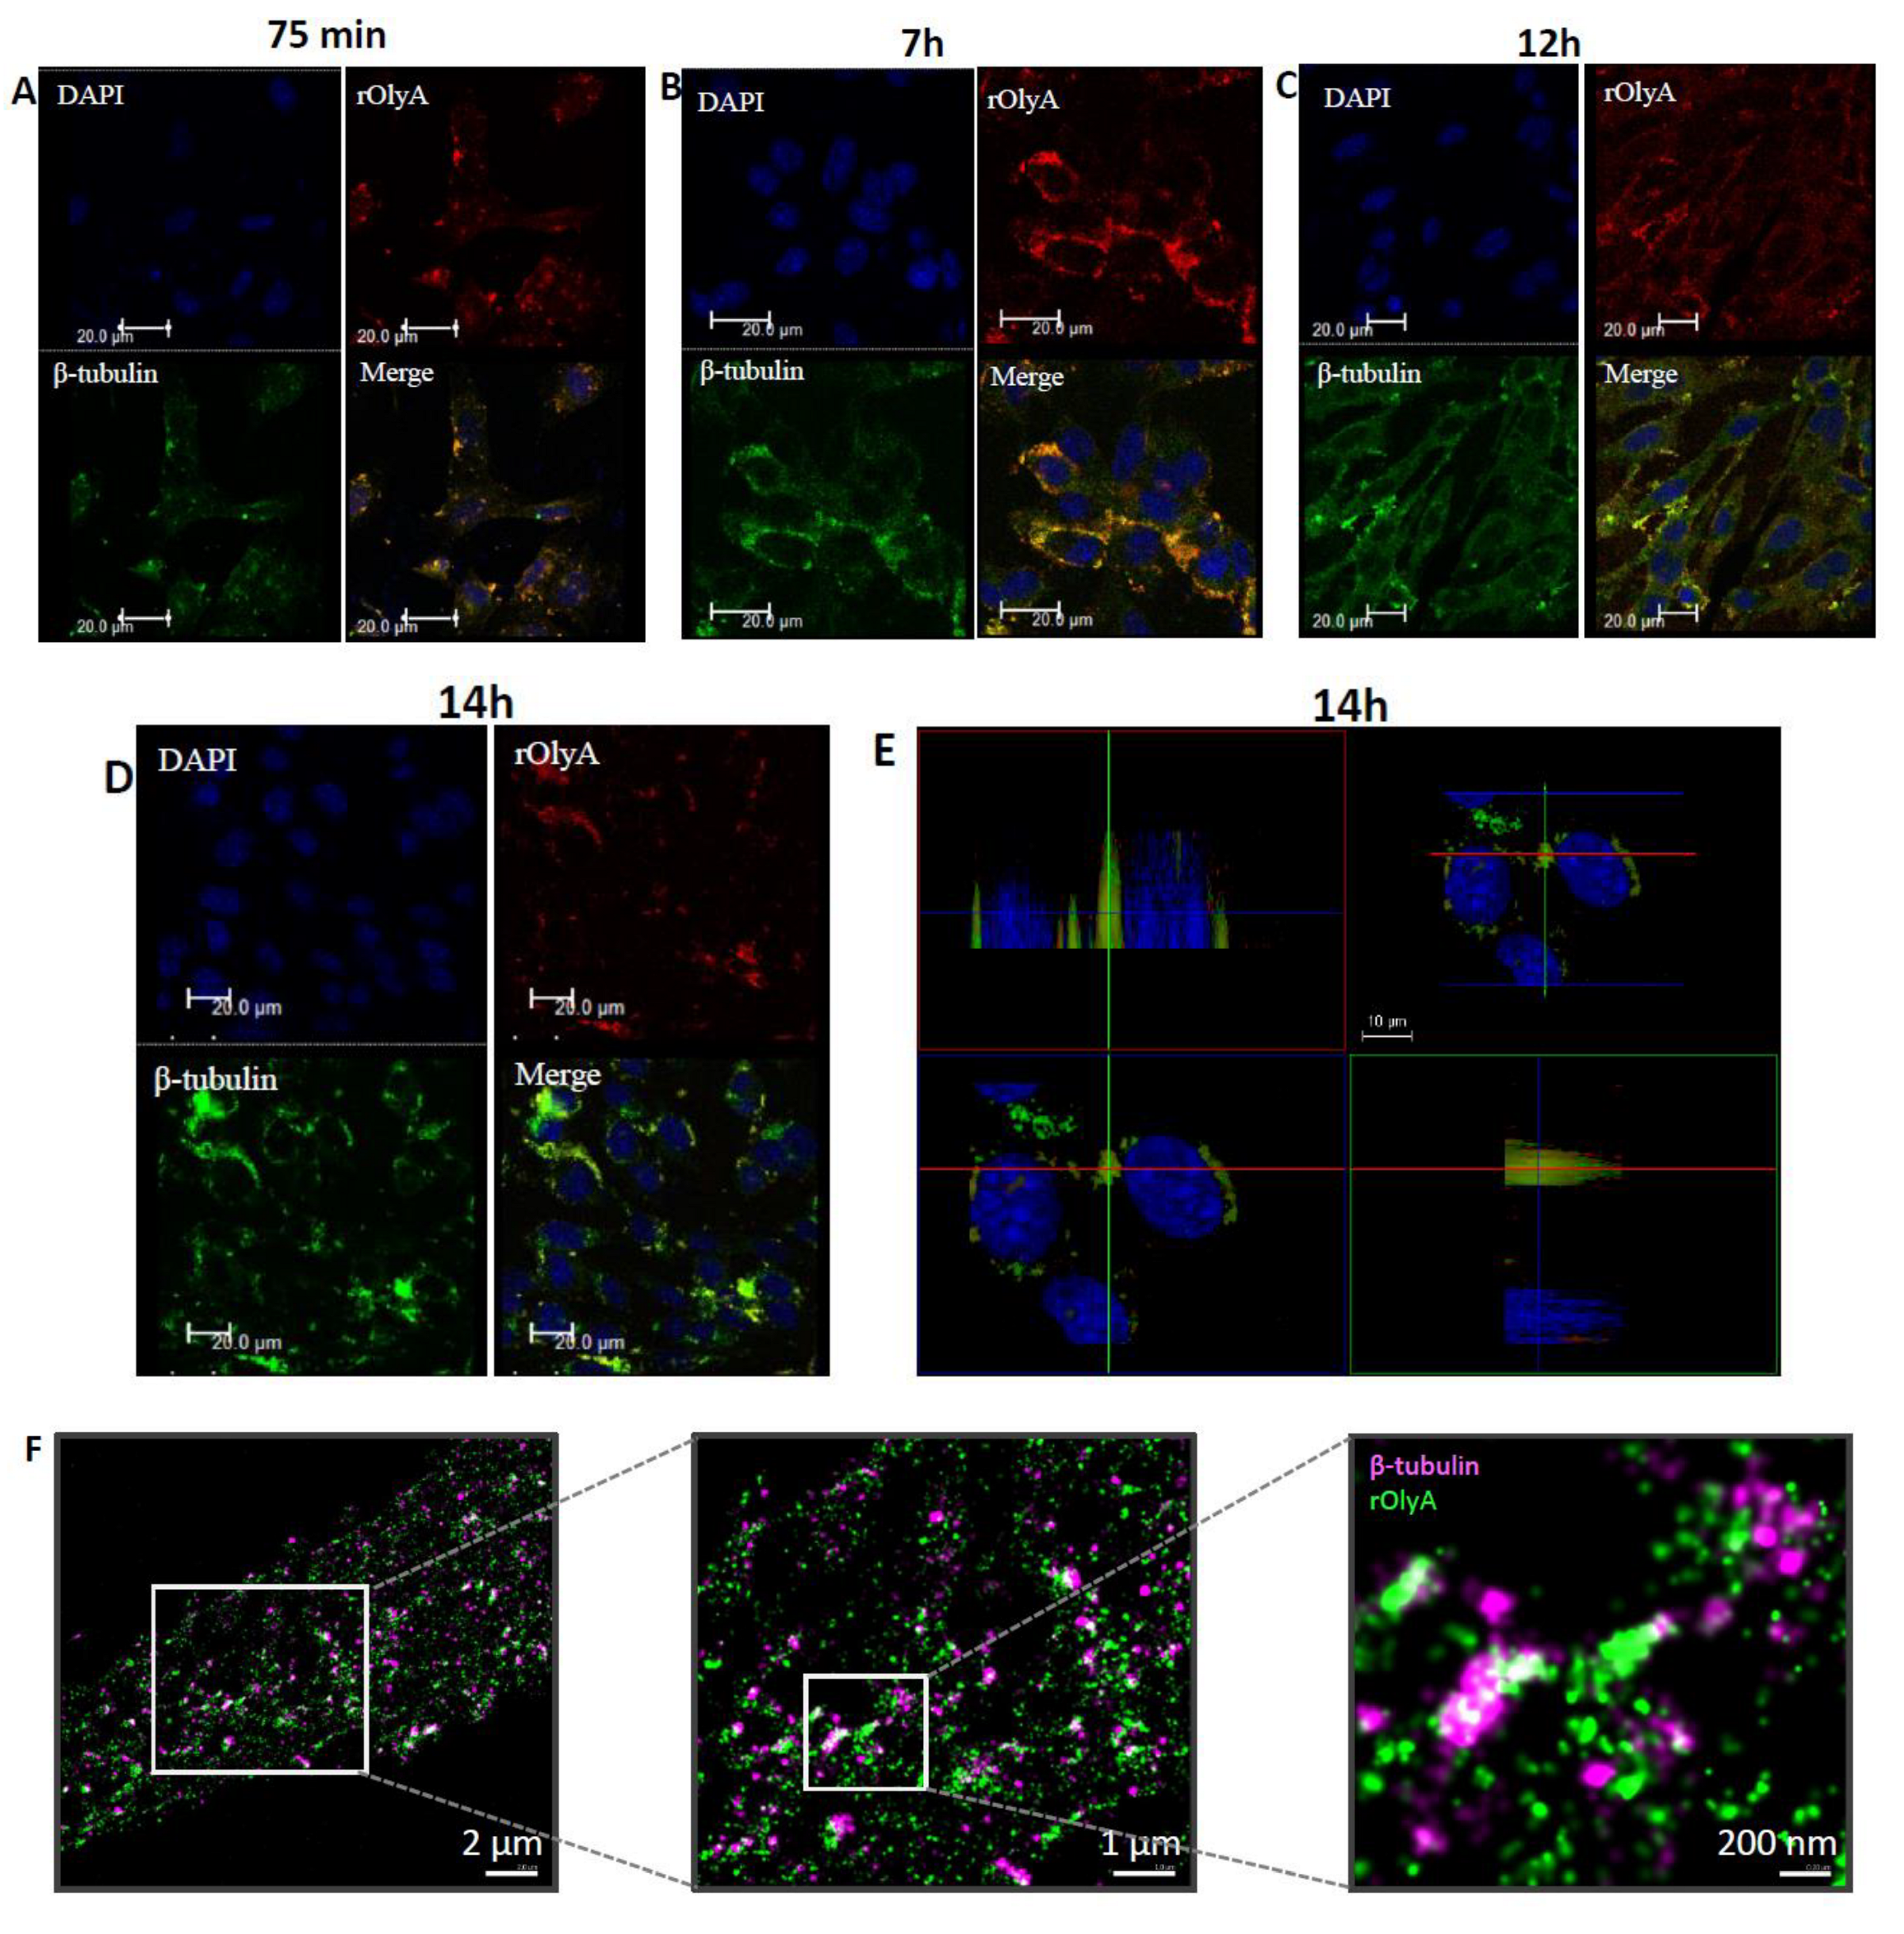
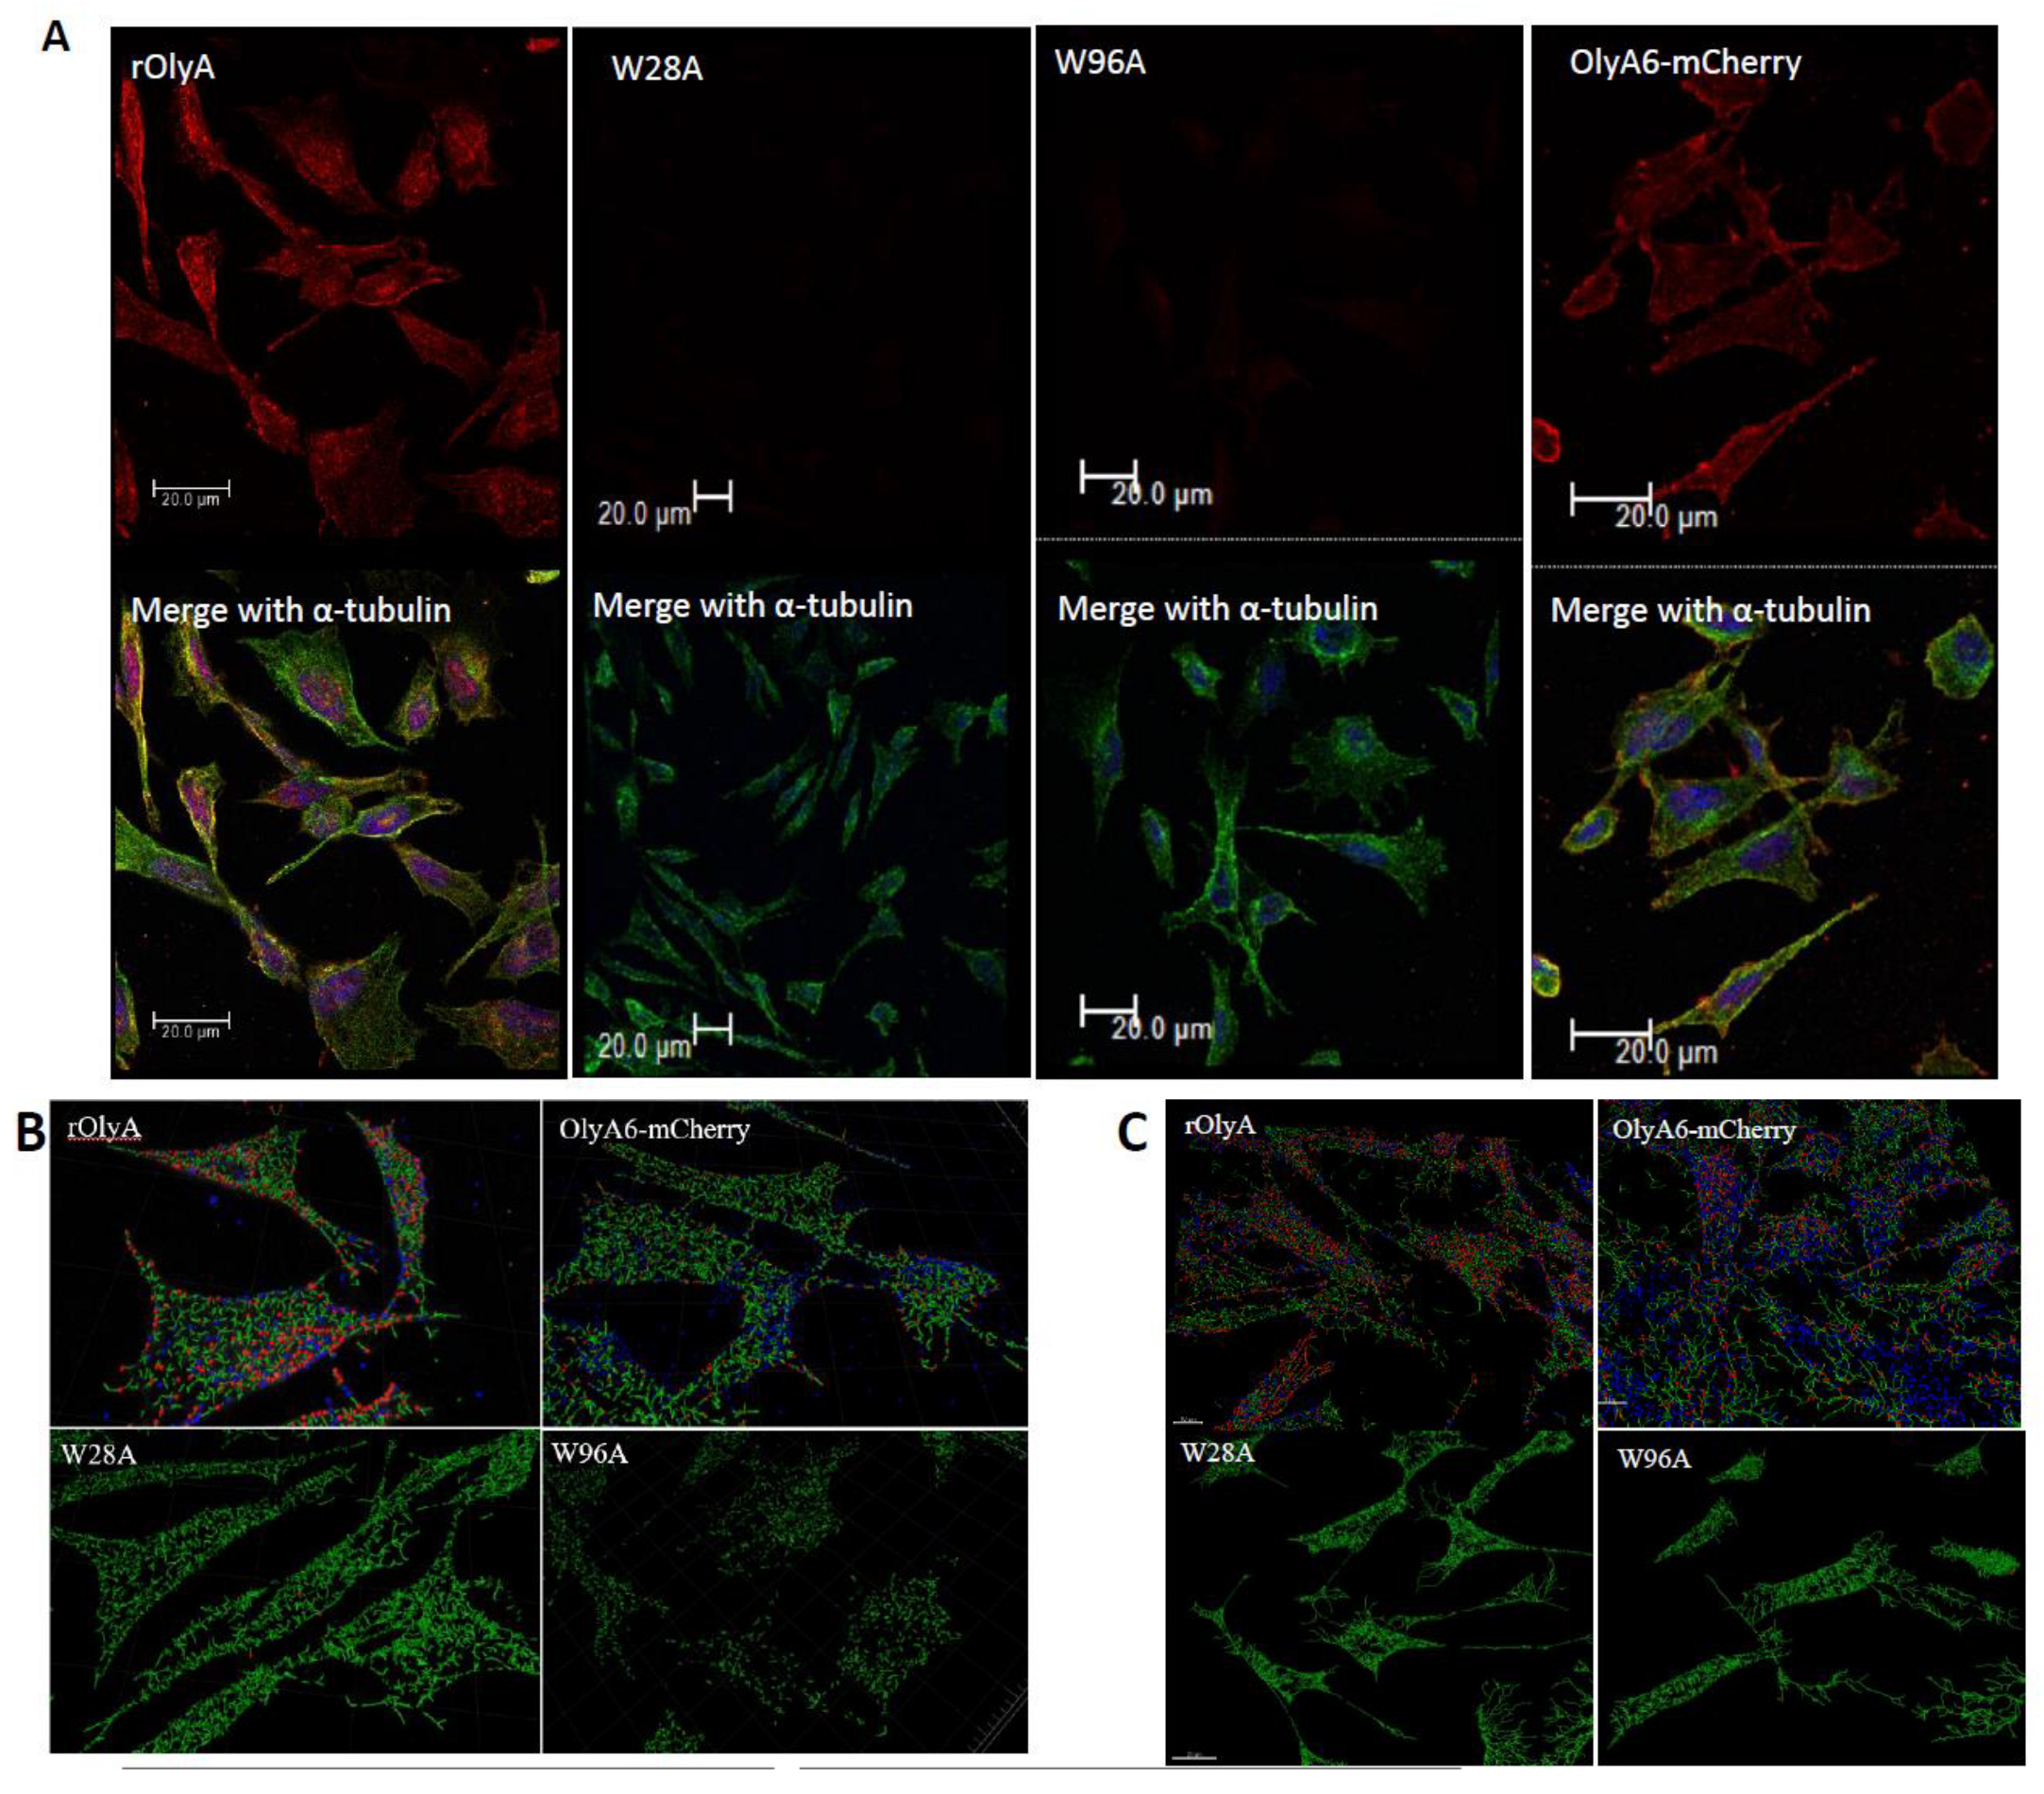
Our results showed that rOlyA and β-tubulin colocalization require conservation of specific residues and no allosteric disturbance of rOlyA. rOlyA progresses toward the nucleus and, after 24 h, is mostly localized proximally to it. Detailed observation of rOlyA and β-tubulin intracellular colocalization at different time points indicated the putative involvement of β-tubulin in protein shuttling from the membrane to the nucleus.
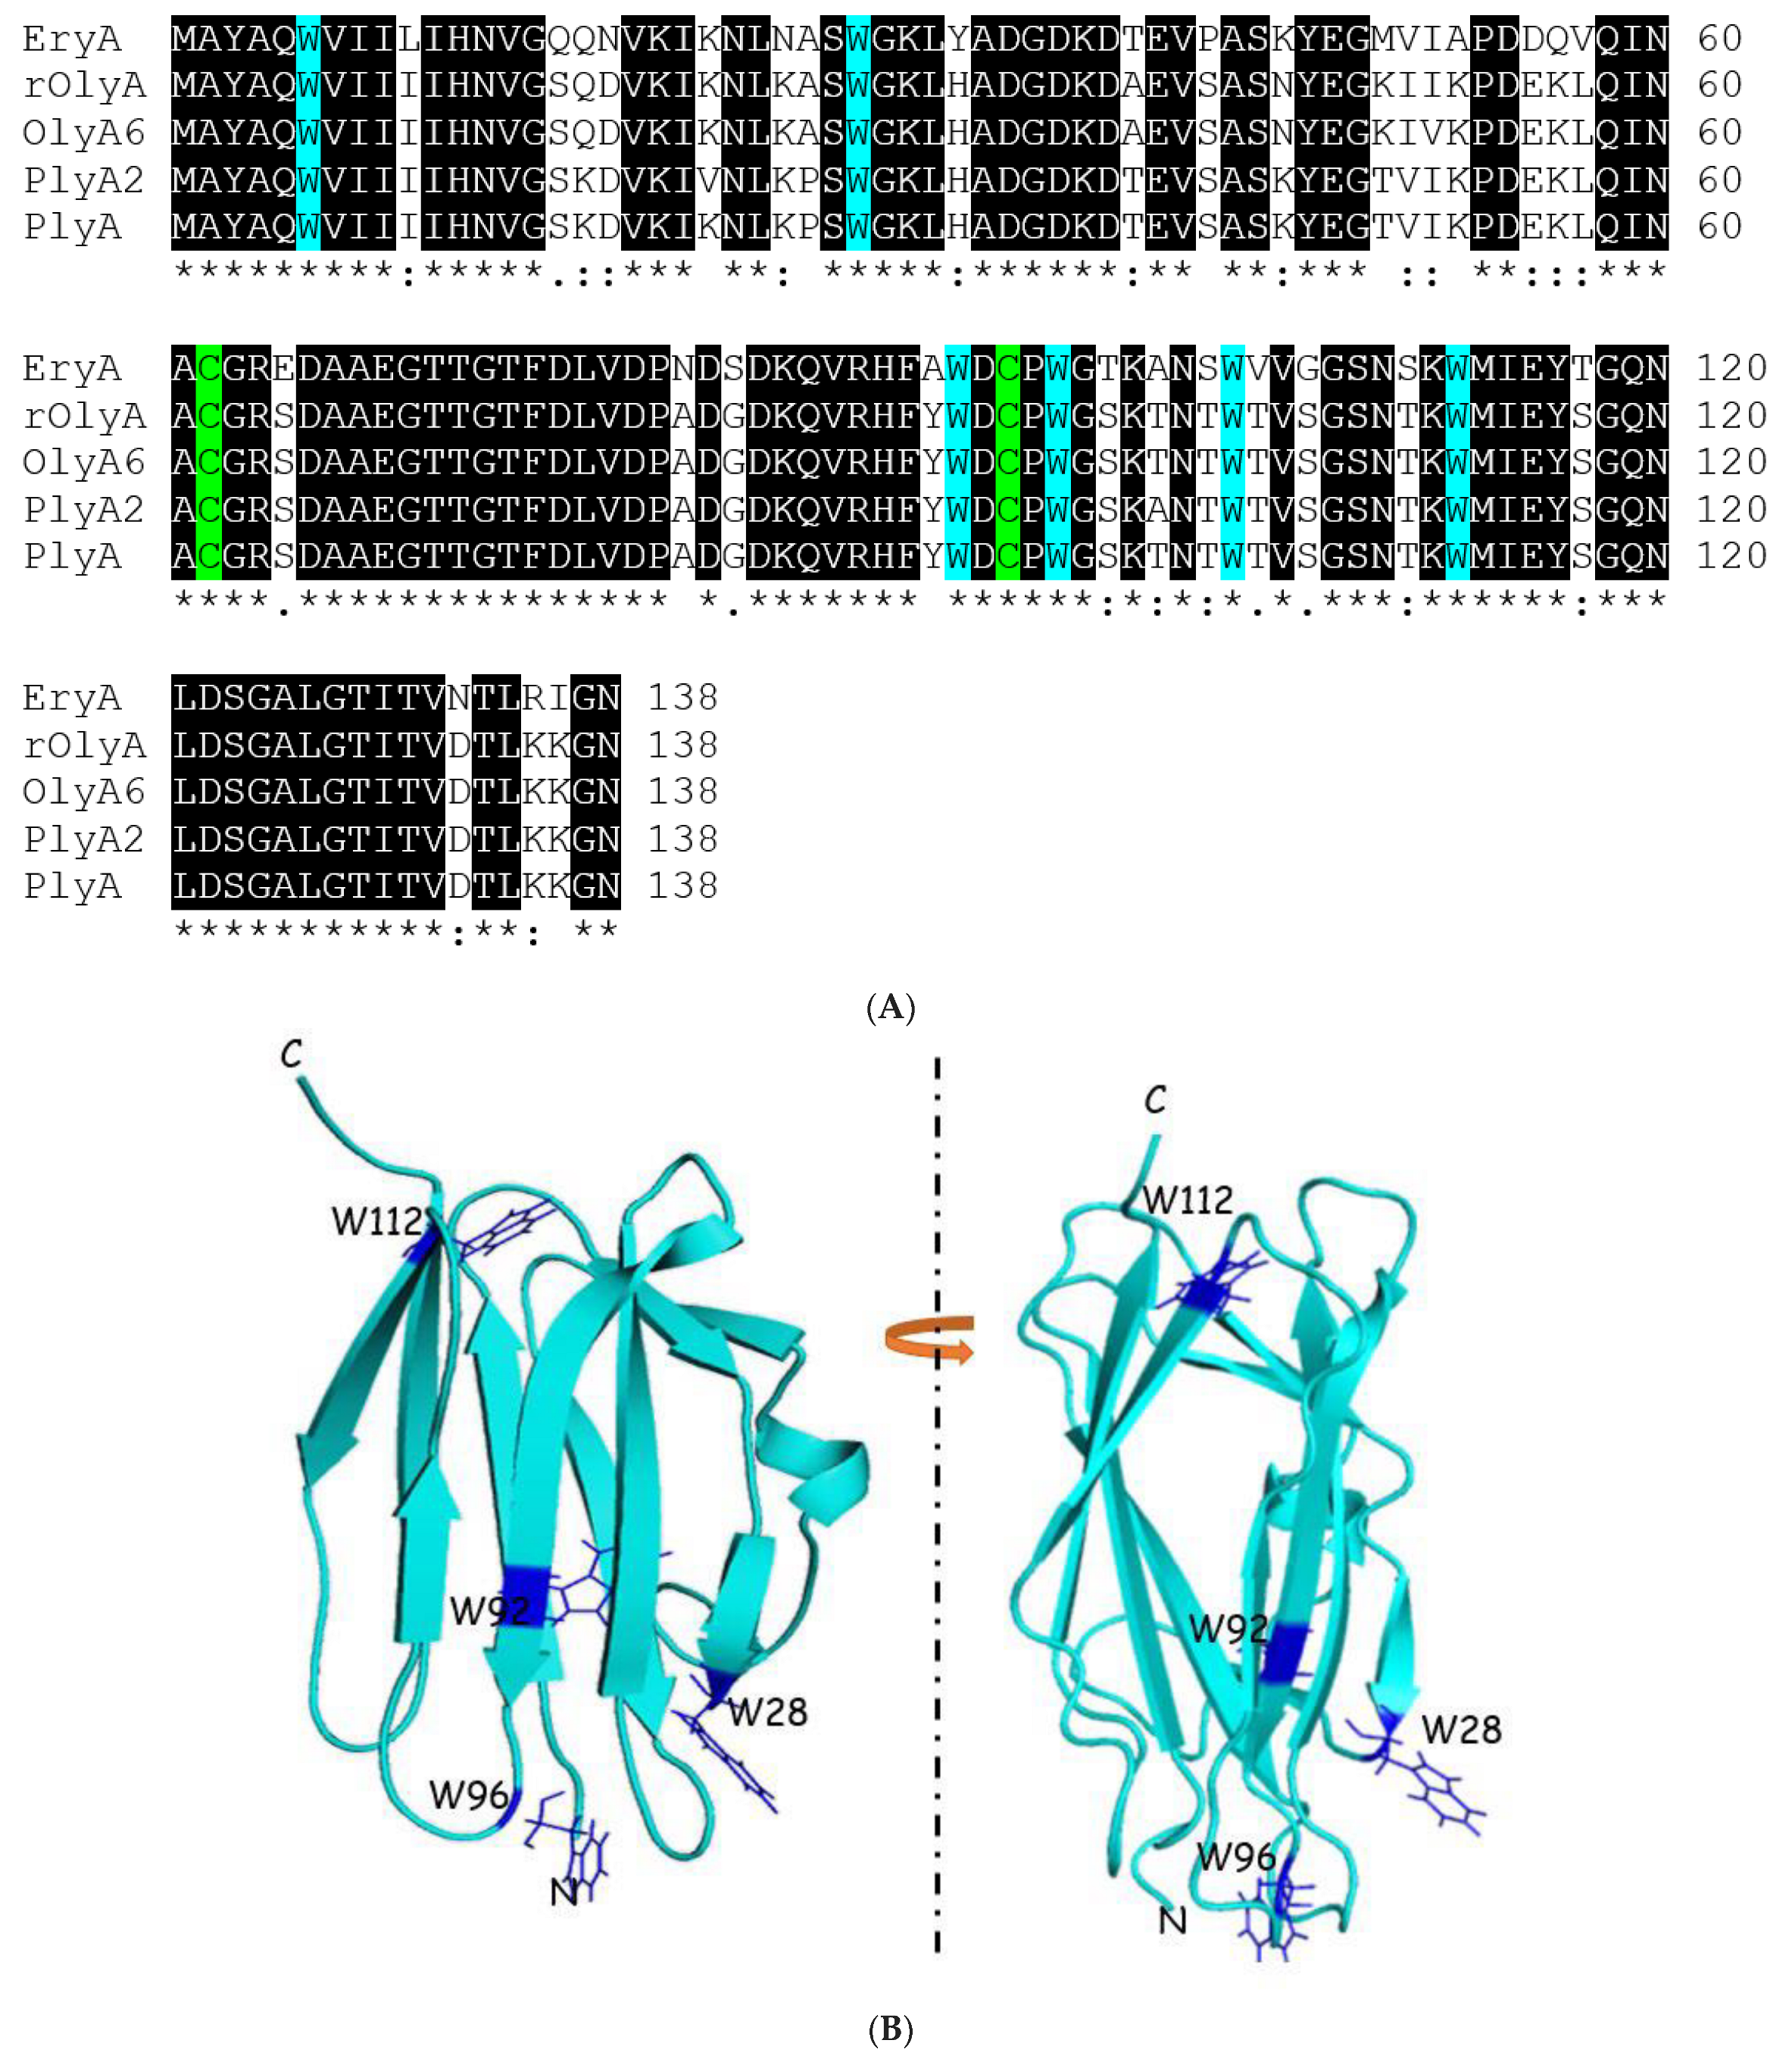
To further explore OlyA’s interaction with β-tubulin, we designed and analyzed the function of rOlyA mutants and the OlyA6-mCherry construct. Several tryptophan residues are involved in membrane–protein interactions and SM/cholesterol binding in the highly homologous aegerolysin protein PlyA2 [
9]. Therefore, we designed rOlyA mutants by introducing tryptophan-to-alanine point mutations in rOlyA at positions 28, 92, 96 and 112. These residues are highly conserved in the aegerolysin proteins produced by
Pleurotus mushrooms (PlyA2, PlyA, EryA, OlyA, OlyA6). The mutant W96A completely lost its ability to be internalized into the cell, whereas internalization of the mutant W28A was reduced (
Supplementary Materials Figure S3). Furthermore, W96A retained its ability to bind β-tubulin, although it was slightly lower compared to rOlyA. The position at which W96 was involved in the membrane interaction and cell penetration is reported in
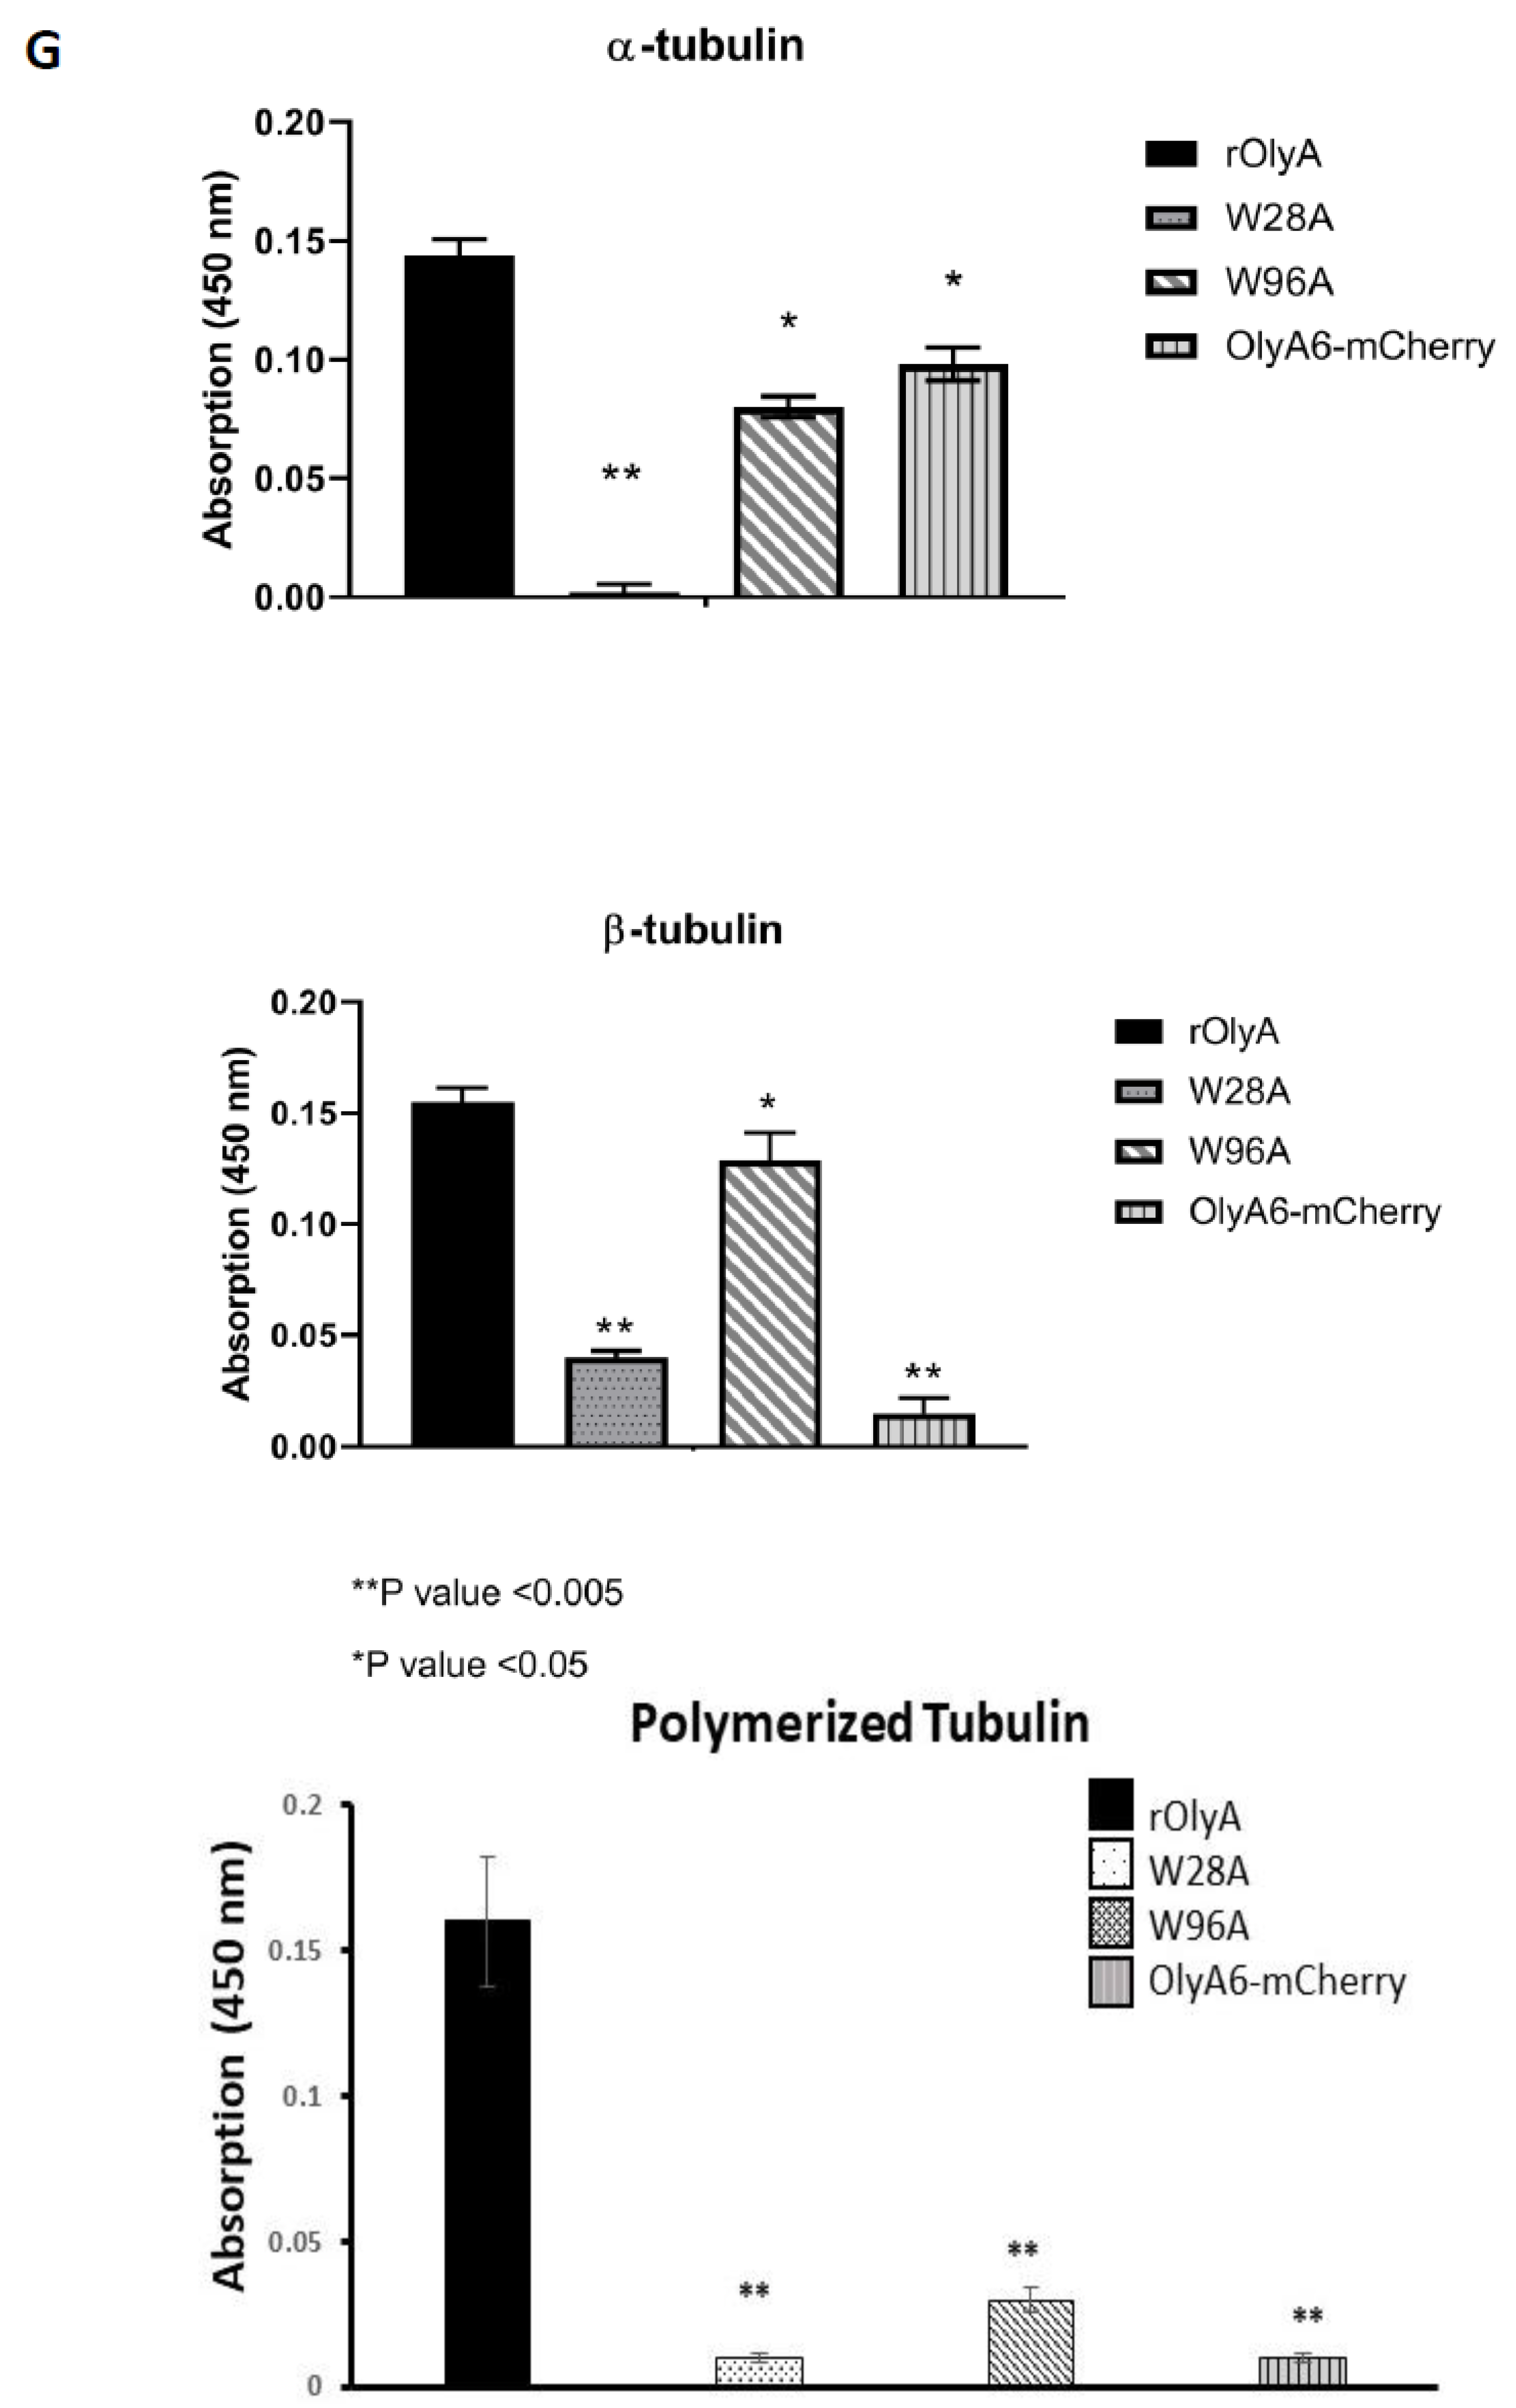
Supplementary Materials Figure S3. Importantly, sandwich ELISAs showed that β-tubulin binding was abolished in the W28A mutant (
Figure 6G).
The fluorescent recombinant protein OlyA6-mCherry is a potential marker for membrane microdomains enriched in SM and cholesterol that fulfill the structural requirements for lipid rafts [
5]. Impaired ability of OlyA6-mCherry to interact with microtubular filaments did not completely disrupt its full biological function, but it did markedly reduce it. We evaluated the biological activity of OlyA6-mCherry in HIB-1B adipocytes and tested OlyA6-mCherry binding to β-tubulin by ELISA. OlyA6-mCherry was capable of inducing some of the differentiation markers but could not bind to β-tubulin. Differences between rOlyA and rOlyA6-mCherry binding to β-tubulin were also observed by co-immunostaining and analysis with Imaris software. We found no binding of OlyA6-mCherry to β-tubulin in the solid phase, but we detected colocalization with the aid of confocal imaging. However, OlyA6-mCherry showed specific binding to α-tubulin in a solid-phase ELISA. In cells, α/β-tubulins form integrated filaments [
25], and this could explain the observed colocalization of OlyA6-mCherry with microtubules in vitro. Our results suggest that progressive cellular activity may be ”masked” by the mCherry tag in OlyA6-mCherry, as evidenced by the reduced expression of the genes involved in the differentiation process and progressive cell proliferation. All of these lost activities are associated with reduced interaction with β-tubulin. We concluded that the OlyA6 region covered by mCherry is the region involved in β-tubulin-binding specificity. To complement the experimental results and determine the region of OlyA6 covered by mCherry, we further performed a structural prediction of the OlyA6-mCherry complex.
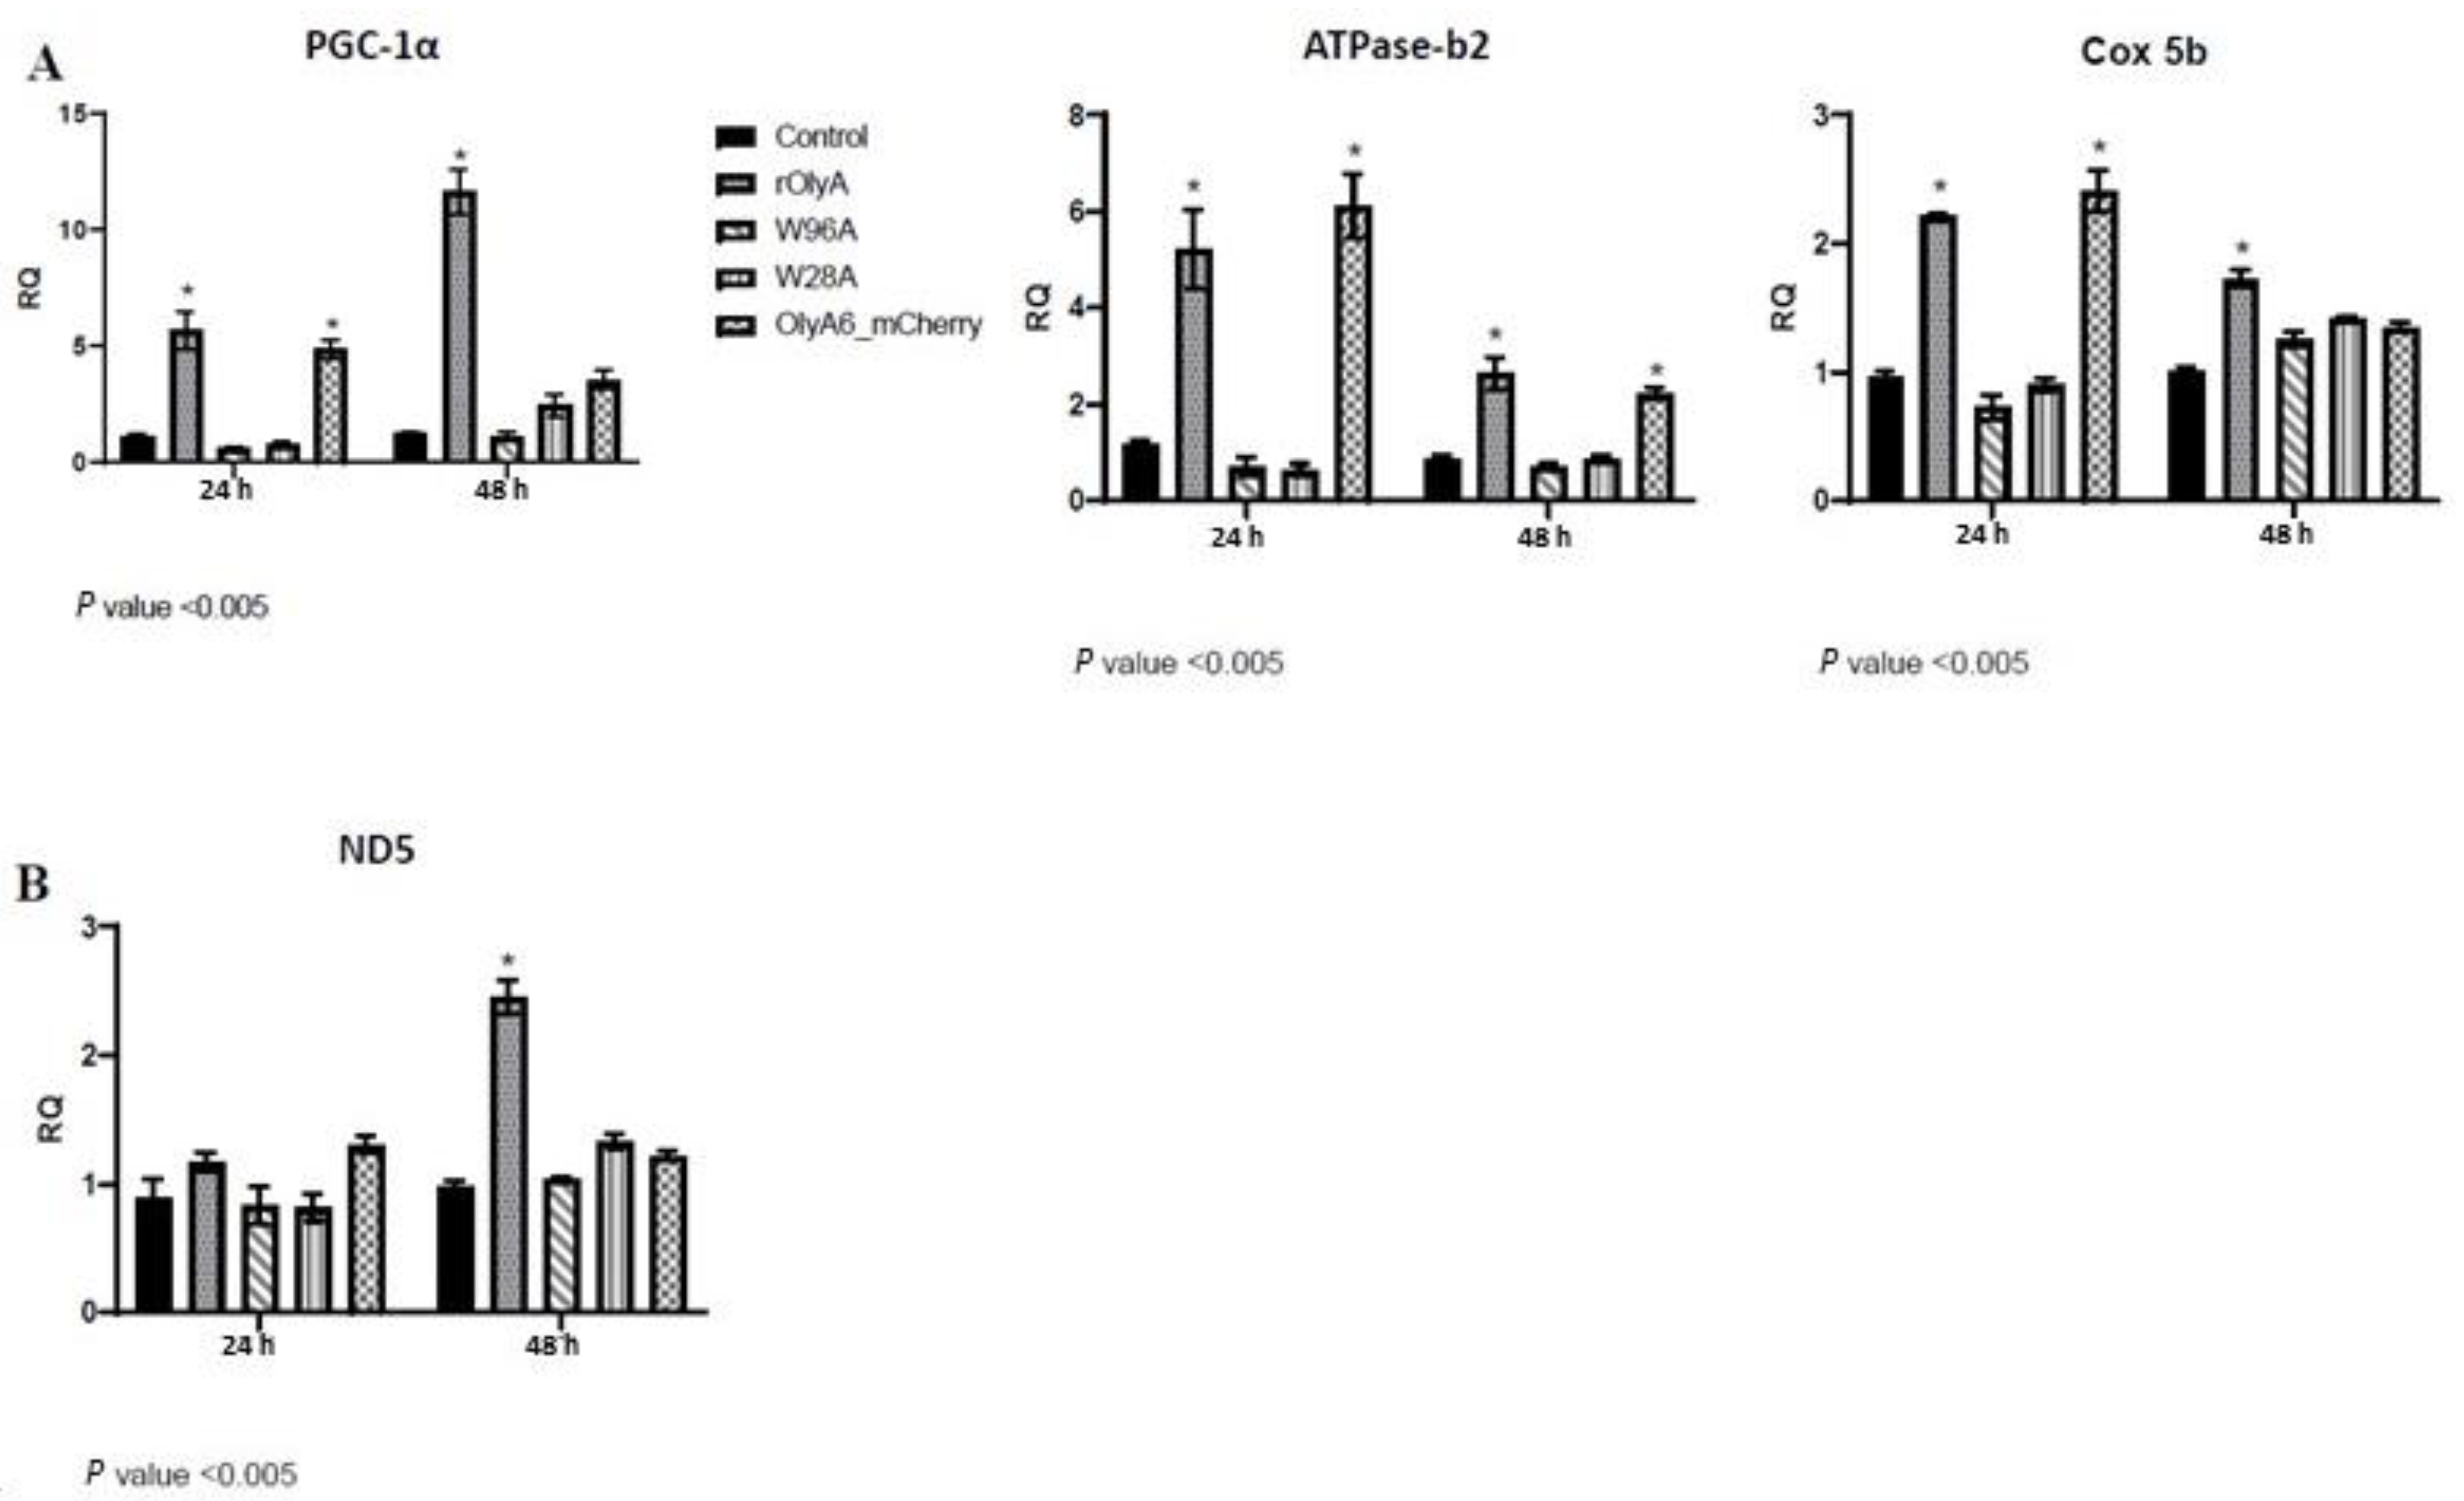
PGC-1α plays key roles in the stimulation of oxidative capacity, regulation of mitochondrial biogenesis and expression of mitochondrial oxidative enzymes [
23]. PGC-1α exhibits its highest expression in brown adipose tissue, where it exerts some of its most well-established roles [
26]. Initially discovered for its ability to induce mitochondrial biogenesis and adaptive thermogenesis in brown adipocytes, PGC-1α has been shown to coordinate the expression of thermogenic genes [
26]. Humans with diabetes have reduced PGC-1α levels in their adipose tissue, which may contribute to the pathogenesis of the disease [
27,
28,
29]. For these reasons, promising therapeutic strategies have been developed based on novel pathways associated with PGC-1α activation and its target genes. Here, we found that rOlyA upregulates
PGC-1α expression, whereas the W96A and W28A mutants did not.
PGC-1α gene expression is highly inducible by rOlyA and, accordingly, we demonstrated enhanced mitochondrial biogenesis and activity in these treated cells. We analyzed genes coding for mitochondrial activity:
Cox5b (a component of cytochrome c oxidase, the last enzyme in the mitochondrial electron transport chain that drives oxidative phosphorylation),
ATPase_B2 (the mitochondrial ATPase_B2 that plays a pivotal role in maintaining cellular ATP levels in eukaryotic organisms) and
ND5 (mitochondrial gene
ND5 is an essential subunit of the mouse respiratory NADH dehydrogenase (complex I)). In both rOlyA- and Oly6-mCherry-treated HIB-1B preadipocytes, the levels of
PGC-1α gene expression were elevated 24 h post-treatment; however, they only remained significantly elevated in rOlyA-treated cells for 48 h post-treatment.
The present results, added to our previous studies [
2,
8,
30], further contribute to our understanding of rOlyA activity and the role of cytoskeletal proteins in this important process. Here, we clearly demonstrate that cellular microtubules play a key role in rOlyA-mediated effects in HIB-1B preadipocyte cells; i.e., induction of lipid droplets formation and increased cellular respiration. rOlyA-mediated effects directly affect metabolic diseases [
2,
8,
30] and cancer-associated processes [
8]. In addition, we present novel data on the role of certain residues of rOlyA that are essential for the interaction of this protein with α/β-tubulin filaments.


 ,
, 


