Article

Nitrogen and Sulfur Co-Doped Graphene as Efficient Electrode Material for L-Cysteine Detection

by
Codruța Varodi
1,
Florina Pogăcean
1,
Alexandra Cioriță
1,
Ovidiu Pană
1,
Cristian Leoștean
1,
Bogdan Cozar
1,
Teodora Radu
1,
Maria Coroș
1,*,
Raluca Ioana Ștefan-van Staden
2,3 and
Stela-Maria Pruneanu
1,*
1
National Institute for Research and Development of Isotopic and Molecular Technologies, 67-103 Donat Street, 400293 Cluj-Napoca, Romania
2
Laboratory of Electrochemistry and PATLAB, National Institute of Research for Electrochemistry and Condensed Matter, 202 Splaiul Independentei Street, 060021 Bucharest, Romania
3
Faculty of Applied Chemistry and Material Science, Politehnica University of Bucharest, 060042 Bucharest, Romania
*
Authors to whom correspondence should be addressed.
Chemosensors 2021, 9(6), 146; https://doi.org/10.3390/chemosensors9060146
Submission received: 12 May 2021 / Revised: 4 June 2021 / Accepted: 11 June 2021 / Published: 16 June 2021

Abstract

:
Two graphene samples co-doped with nitrogen and sulfur were synthesized by the hydrothermal method using thiourea as doping and reducing agent for graphene oxide (GO). An appropriate amount of thiourea was added to the aqueous dispersion of GO, previously sonicated for 30 min. The mixture was poured into an autoclave and placed in the oven for 3 h, at 120 and 200 °C. The samples were denoted NSGr-120 and NSGr-200, respectively, in agreement with the reaction temperatures. They were next morphologically and structurally characterized by advanced techniques, such as SEM/TEM, XPS, XRD, and FTIR. According to XPS analysis, the NSGr-120 sample has higher amounts of heteroatoms in comparison with NSGr-200, indicating that the reaction temperature is a crucial factor that affects the doping degree. In order to reveal the influence of the doping degree on the electrochemical performances of graphene-modified electrodes, they were tested in solutions containing L-cysteine molecules. The electrode with the best electrocatalytic performances, GC/NSGr-120, was tested to detect L-cysteine in a pharmaceutical drug, proving its applicability in real sample analysis.

1. Introduction

L-cysteine (Cys), a thiol-containing amino acid existent in proteins, cells, and biological tissues, possesses essential physiological functions in neuronal tissues, metabolism, and detoxification [1]. Abnormal levels of Cys are implicated in a series of human diseases such as growth retardation, neurotoxic effect, Alzheimer’s disease, and coronary heart disease [2,3]; thus, Cys has been acknowledged as one of the most important biomarkers in early diagnosis and treatment as well as the monitoring of the stage of diseases [4]. Various methods such as high-performance liquid chromatography [5], capillary electrophoresis [6], and gas chromatography–mass spectrometry [7] have been used to detect L-cysteine. Among various detection techniques, the electrochemical sensors offer many advantages, such as high sensitivity, low cost, easy operation, and miniaturization [8].
Because the direct oxidation of Cys at ordinary electrodes is usually slow and requires high over-potential, an appropriate electron transfer mediator for fast and low-potential electrochemical determination is very important and still challenging. A variety of materials, including polymers [9], metal nanomaterials [10], 2D transition metal carbides [11], and carbon-based materials [12], have been investigated for the electrochemical detection of Cys. Even if these modifiers improve the performance in Cys determination, there are still disadvantages, such as poor detection limit and sensitivity, limited detection range, or high over-potential [13]. For these reasons, finding new materials for electrochemical detection of Cys has been a permanent effort, which has recently turned to graphene because of its good chemical and thermal stability [14]. Moreover, doping of graphene with heteroatoms (such as B, N, P, S, I, Br, Cl, and F) modifies its electronic and chemical properties which are adapted for the construction of cost-effective sensors with practical utility [15]. Furthermore, co-doping of nitrogen and sulfur into graphene has been confirmed to be an effective approach to substantially promote the electrocatalytic activity due to the unique electronic structures of S and N atoms that can induce the redistribution of spin and charge densities [16]. For example, NSGr provides a better electrocatalytic performance for oxygen reduction reaction [17,18], dye-sensitized solar cells [19,20], and lithium-ion batteries [21]. Nitrogen and sulfur co-doped graphene has been less studied for electrochemical sensing. However, the few sensors based on nitrogen and sulfur co-doped graphene displayed good sensing performances for hydrogen peroxide and glucose [22], europium ions [23], toxic organic pollutants (aniline, p-phenylenediamine, and nitrobenzene) [24], or hydroquinone and catechol [25] detection. To the best of our knowledge, no paper has been published about L-cysteine determination using nitrogen and sulfur co-doped graphene.
In this paper, a rapid, one-step, and low-cost solvothermal approach was employed to synthesize nitrogen and sulfur co-doped graphene (NSGr). The morphology and structure of the samples prepared at different temperatures (120 or 200 °C) were characterized in detail. They were then evaluated as electrode materials for the sensitive detection of L-cysteine in laboratory solutions and in real samples.

2. Materials and Methods

2.1. Materials

All reagents were of analytical grade and used without further purification. Thiourea was purchased from Roth (Karlsruhe, Germany), K4[Fe(CN)6] was purchased from Sigma-Aldrich (Darmstadt, Germany), KCl and L-cysteine were purchased from Alfa-Aesar (Kandel, Germany). N,N-Dimethylformamide (DMF) was purchased from Sigma-Aldrich (Darmstadt, Germany) and was used for the dispersion of each graphene sample.

2.2. Synthesis and Characterization of N and S Co-doped Graphene Samples

Graphene oxide (GO) was prepared using a modified Hummers method as previously reported [26]. Nitrogen and sulfur co-doped graphene samples were synthesized by the hydrothermal method using thiourea as doping and reducing agent for GO. Typically, an appropriate amount of thiourea (700 mg) was added to 150 mL aqueous dispersion of GO (700 mg), previously sonicated for 30 min. The mixture was poured into a 250 mL autoclave and placed in the oven at different temperatures (120 and 200 °C, respectively) for 3 h. After cooling to room temperature, each sample was filtered, washed with distilled water, and dried by lyophilization. The samples were denoted NSGr-120 and NSGr-200, in agreement with the reaction temperature.

2.3. Characterization Methods

The morphological characteristics of the prepared samples were examined through scanning and transmission electron microscopy (SEM/TEM), using the SEM Hitachi SU8230, operated at 30 kV (Hitachi, Tokyo, Japan). To establish the thickness and distribution of the graphene layers, the samples were dispersed in pure ethanol, sonicated for 1 min, dispersed on the surface of 200 mesh Ni grids, and examined through TEM.
NSGr-120 and NSGr-200 samples were further characterized by XPS (SPECS spectrometer, equipped with a dual-anode X-ray source Al/Mg, a PHOIBOS 150 2DCCD hemispherical energy analyzer and a multi-channeltron detector, Berlin, Germany), XRD (Bruker D8 Advance diffractometer, Karlsruhe, Germany), and Raman spectroscopy (using the NTEGRA Spectra platform, placed on a NEWPORT RS4000 optical table with a vibration isolation system and equipped with a SOLAR TII confocal Raman spectrometer coupled with an Olympus IX71 microscope in two different configurations). Detection was achieved with a CCD camera (NT-MDT; Moscow, Russia). FTIR measurements were recorded with a Bruker Tensor II spectrometer (Ettlingen, Germany).

2.4. Electrochemical Studies

Electrochemical measurements (cyclic voltammetry (CV), electrochemical impedance spectroscopy (EIS), and amperometric measurements were recorded with an Autolab PGSTAT-302N (Metrohm Autolab B.V., Utrecht, the Netherlands) potentiostat/galvanostat instrument. All measurements were conducted in an electrochemical cell containing three electrodes: the working electrode, a glassy carbon (GC) electrode modified with the prepared graphene samples; the counter electrode, a large-area platinum foil (2 cm2); and the reference electrode, an Ag/AgCl electrode (3M KCl). The bare working electrode had a diameter of 3 mm. A volume of 10 µL from each graphene sample previously dispersed in DMF (2 mg/mL) was drop-casted on GC electrodes. After modification, the electrodes were left to dry at room temperature for 24 h. After that, they were ready to be used in electrochemical studies.

3. Results and Discussions

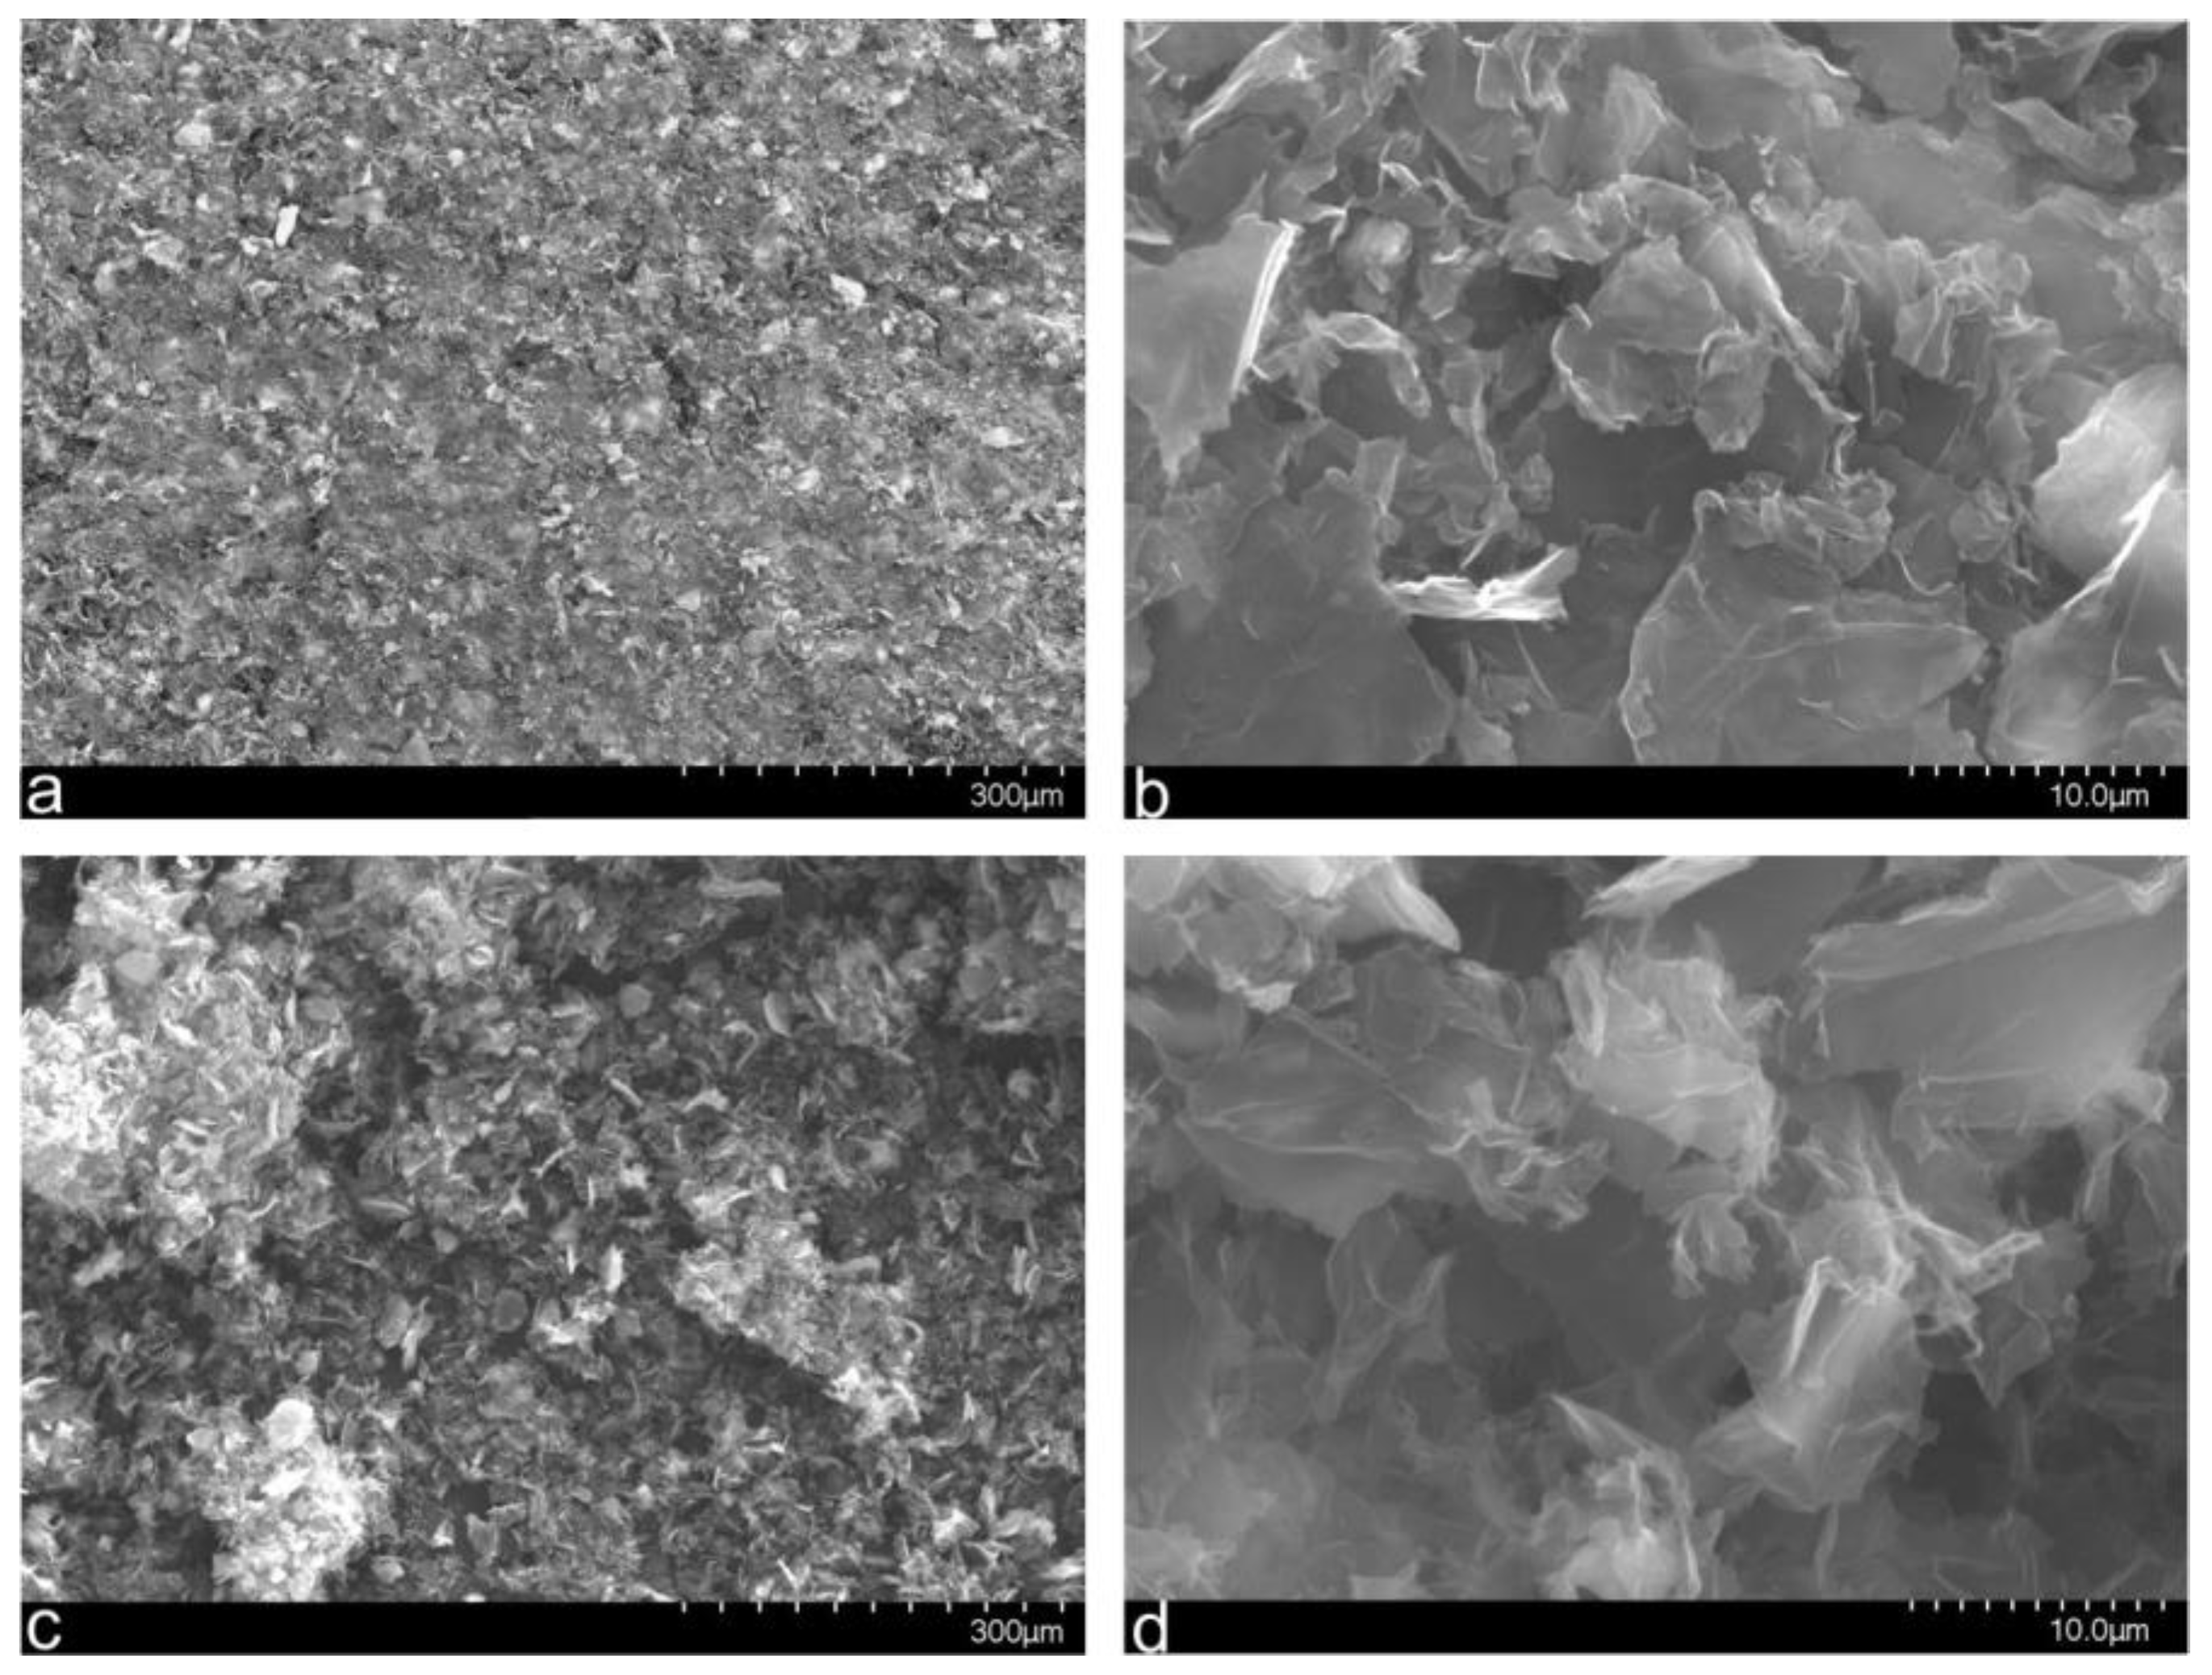
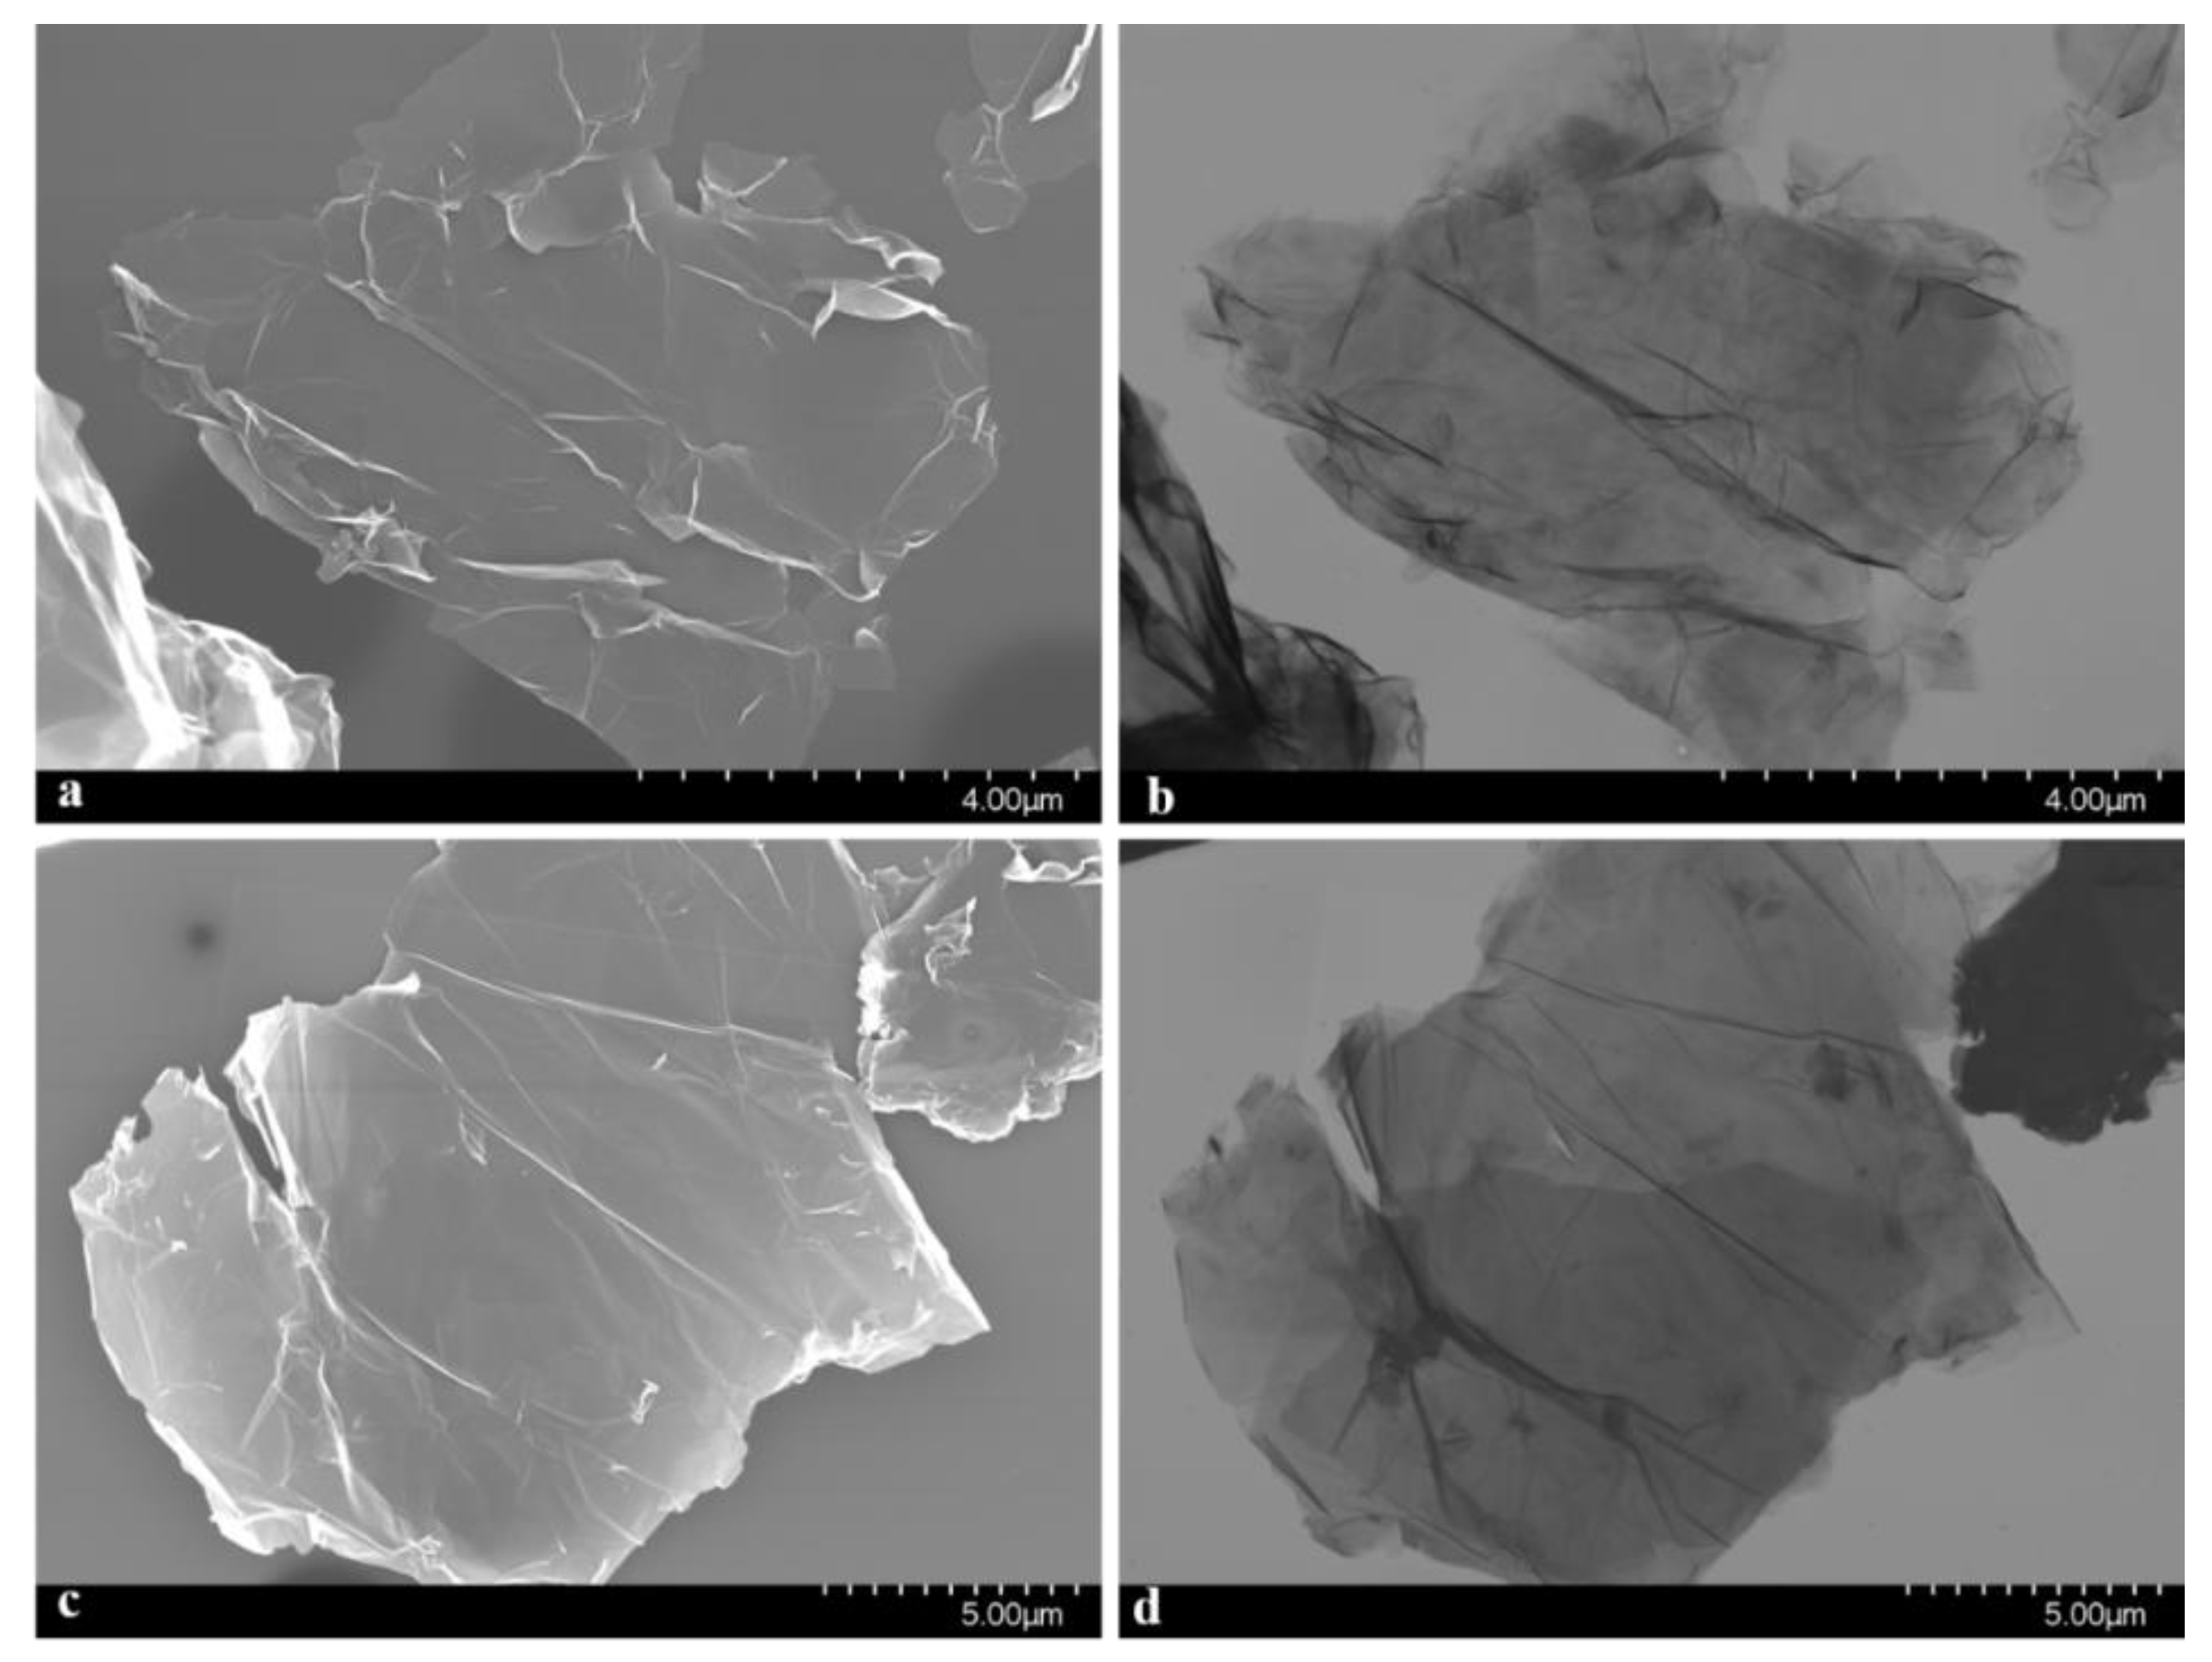
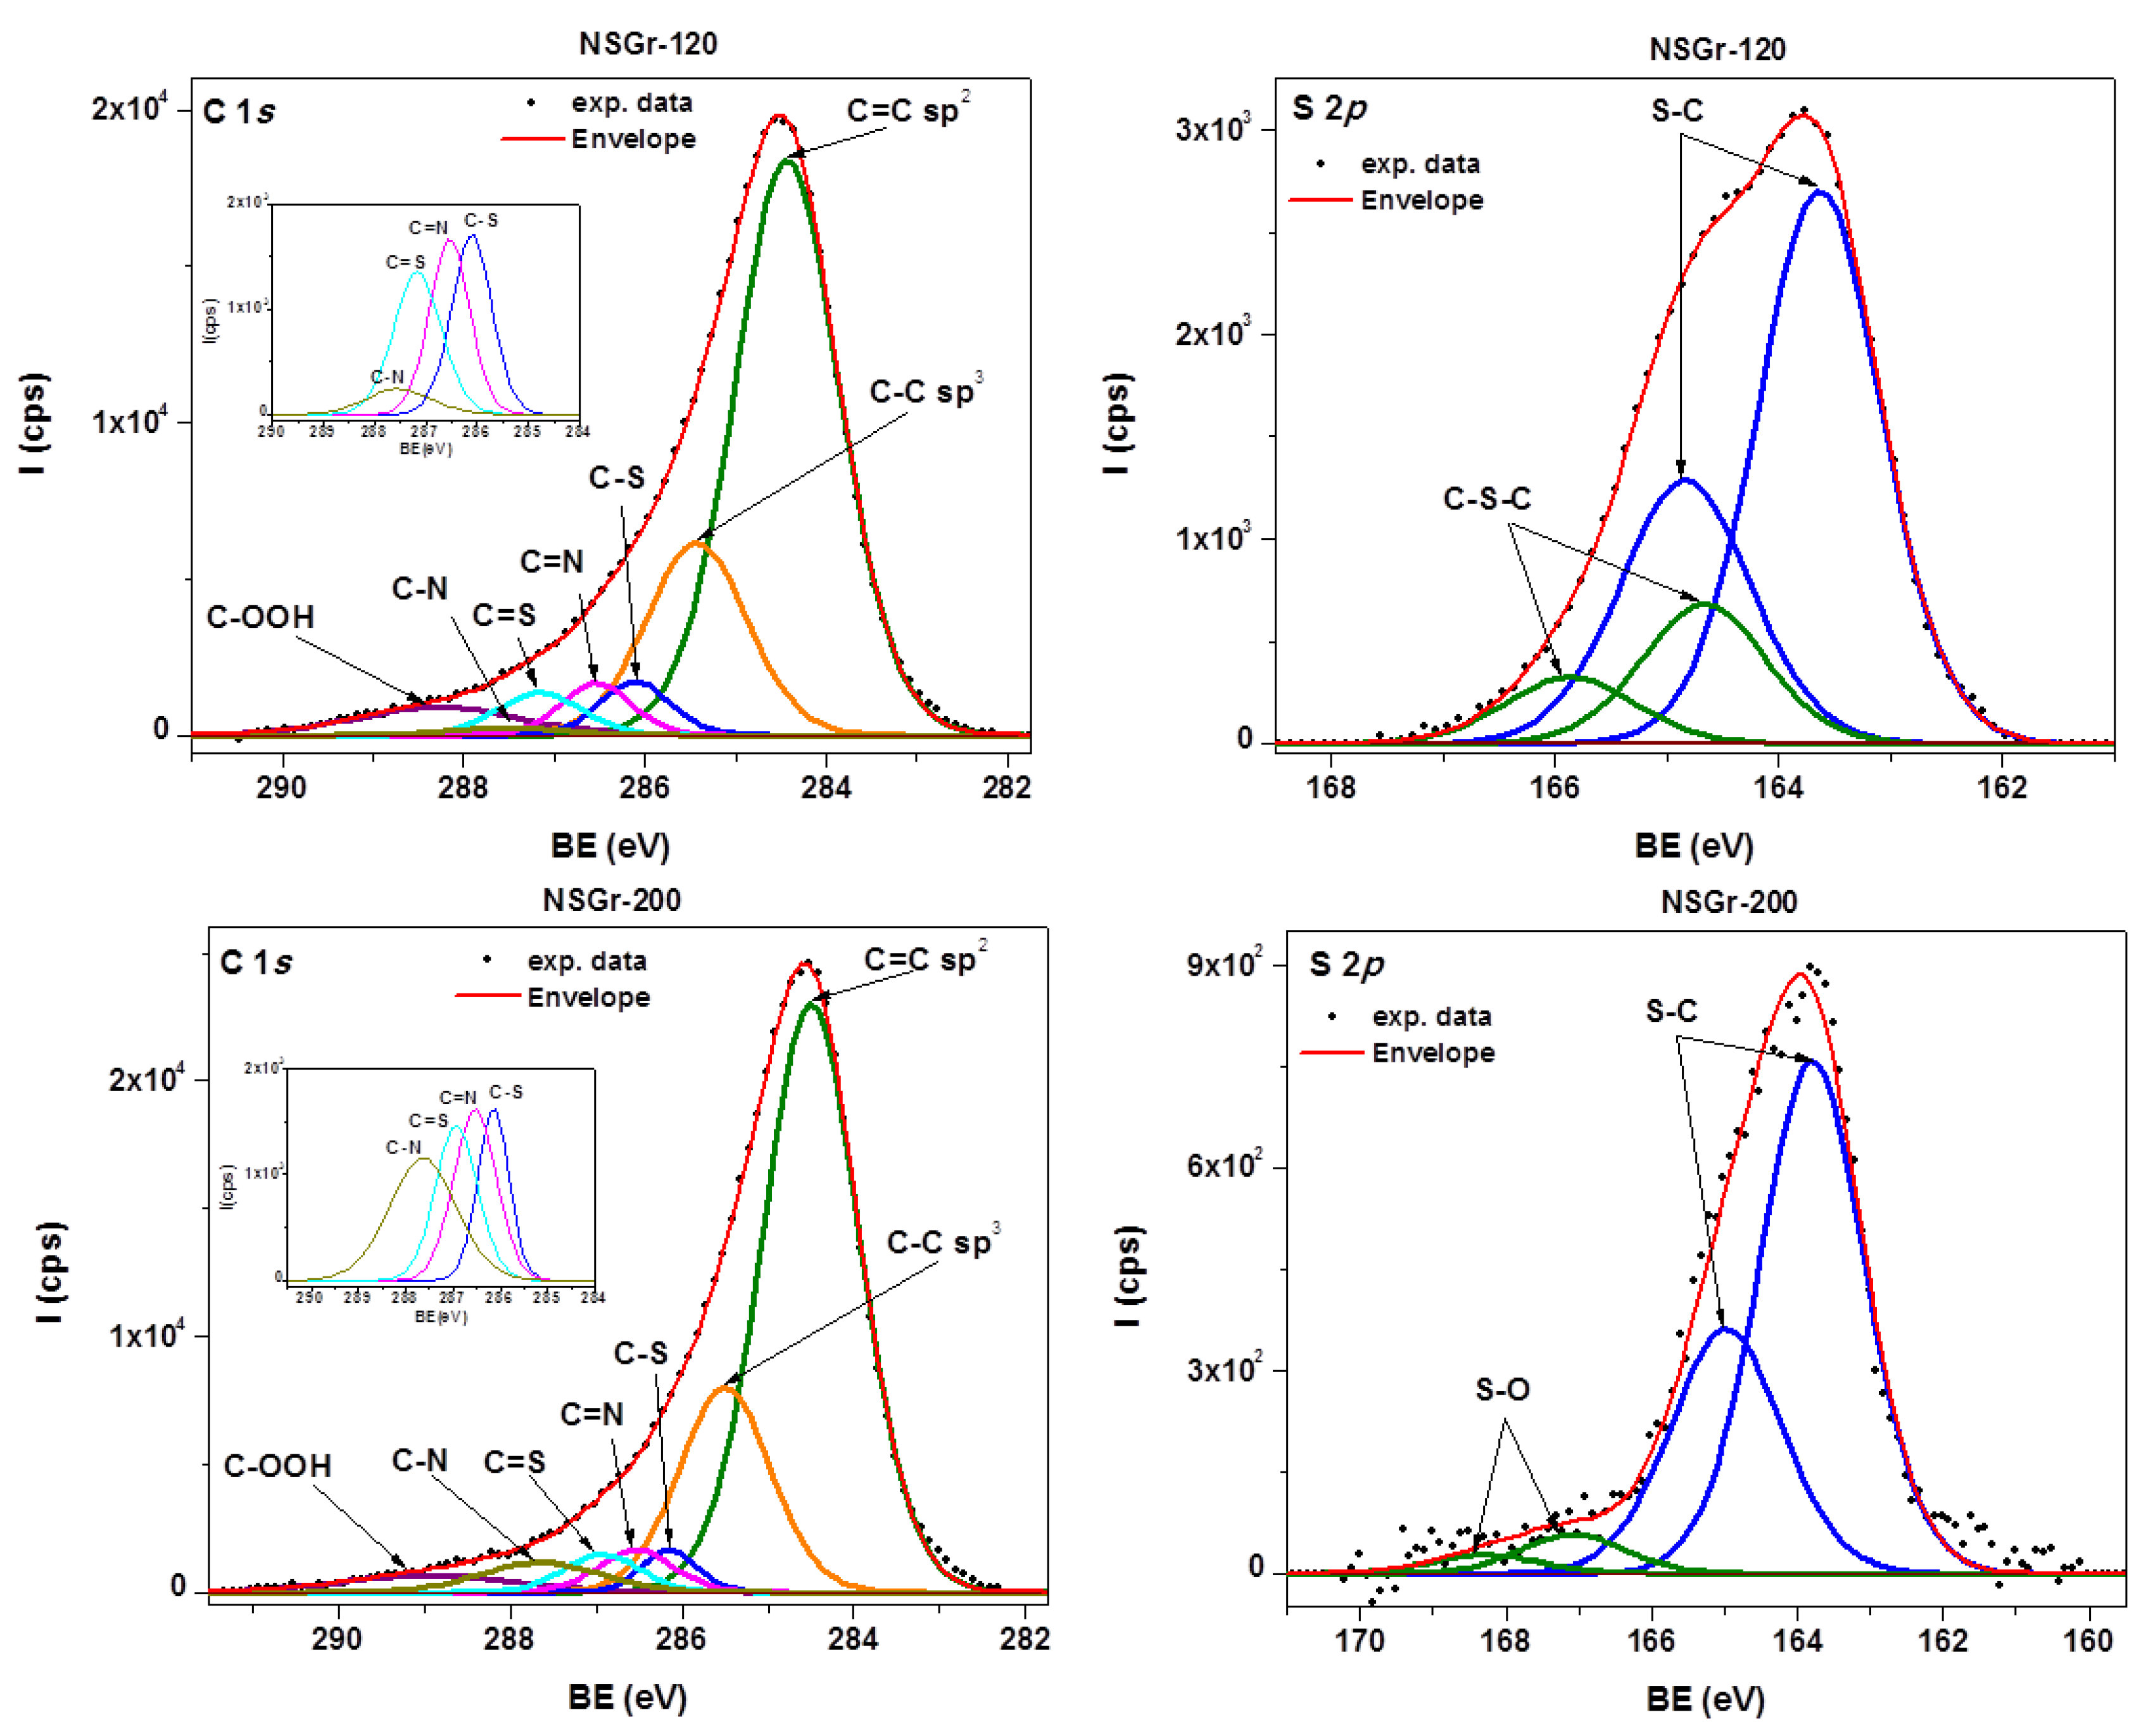
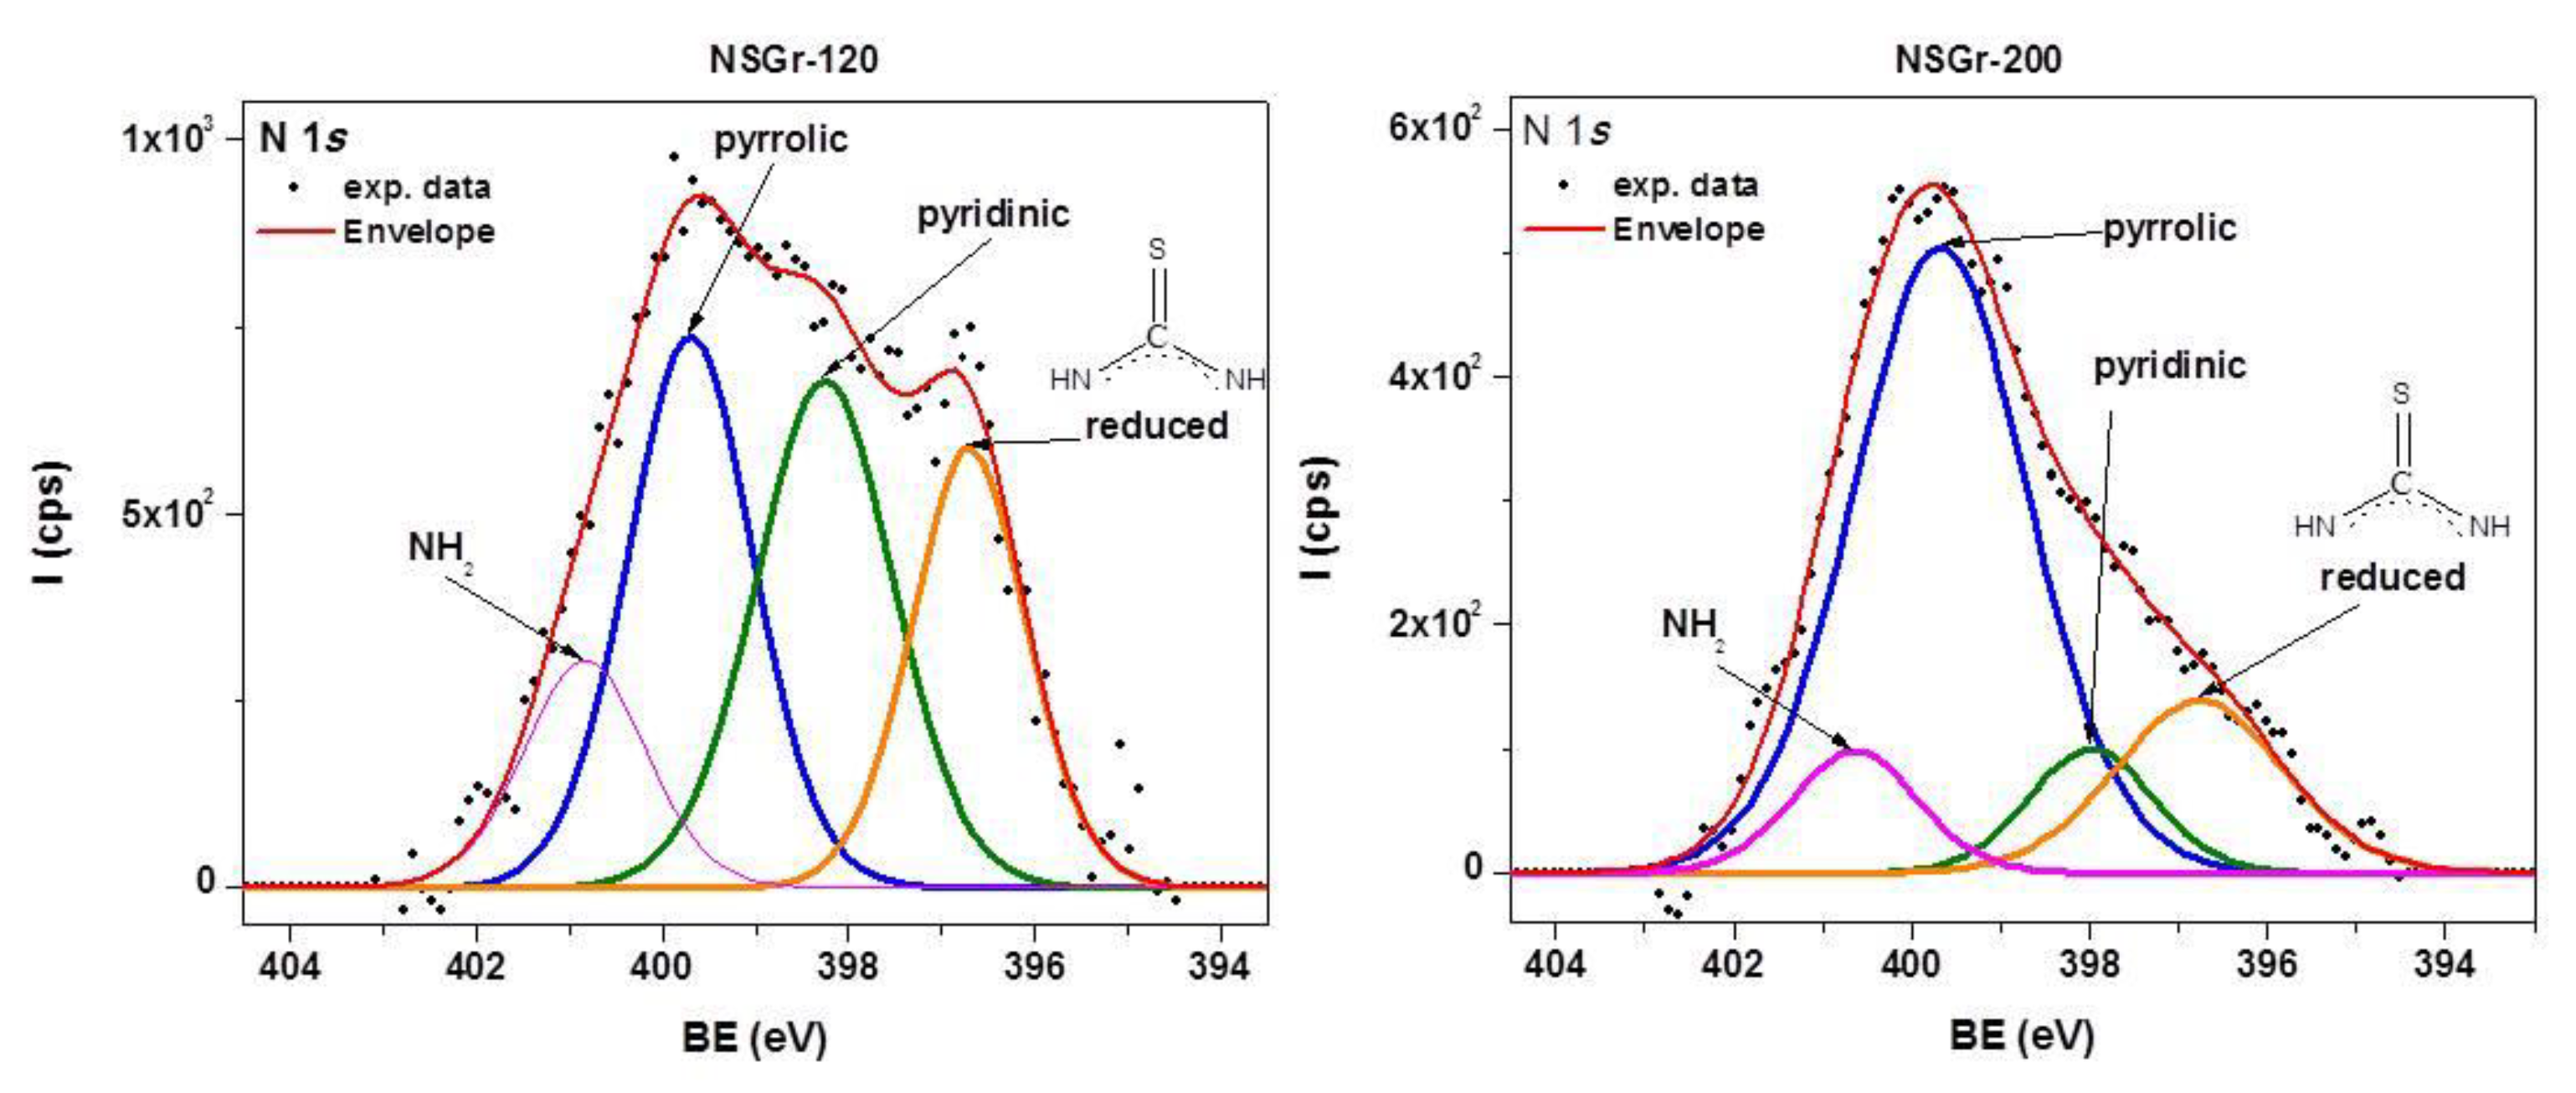
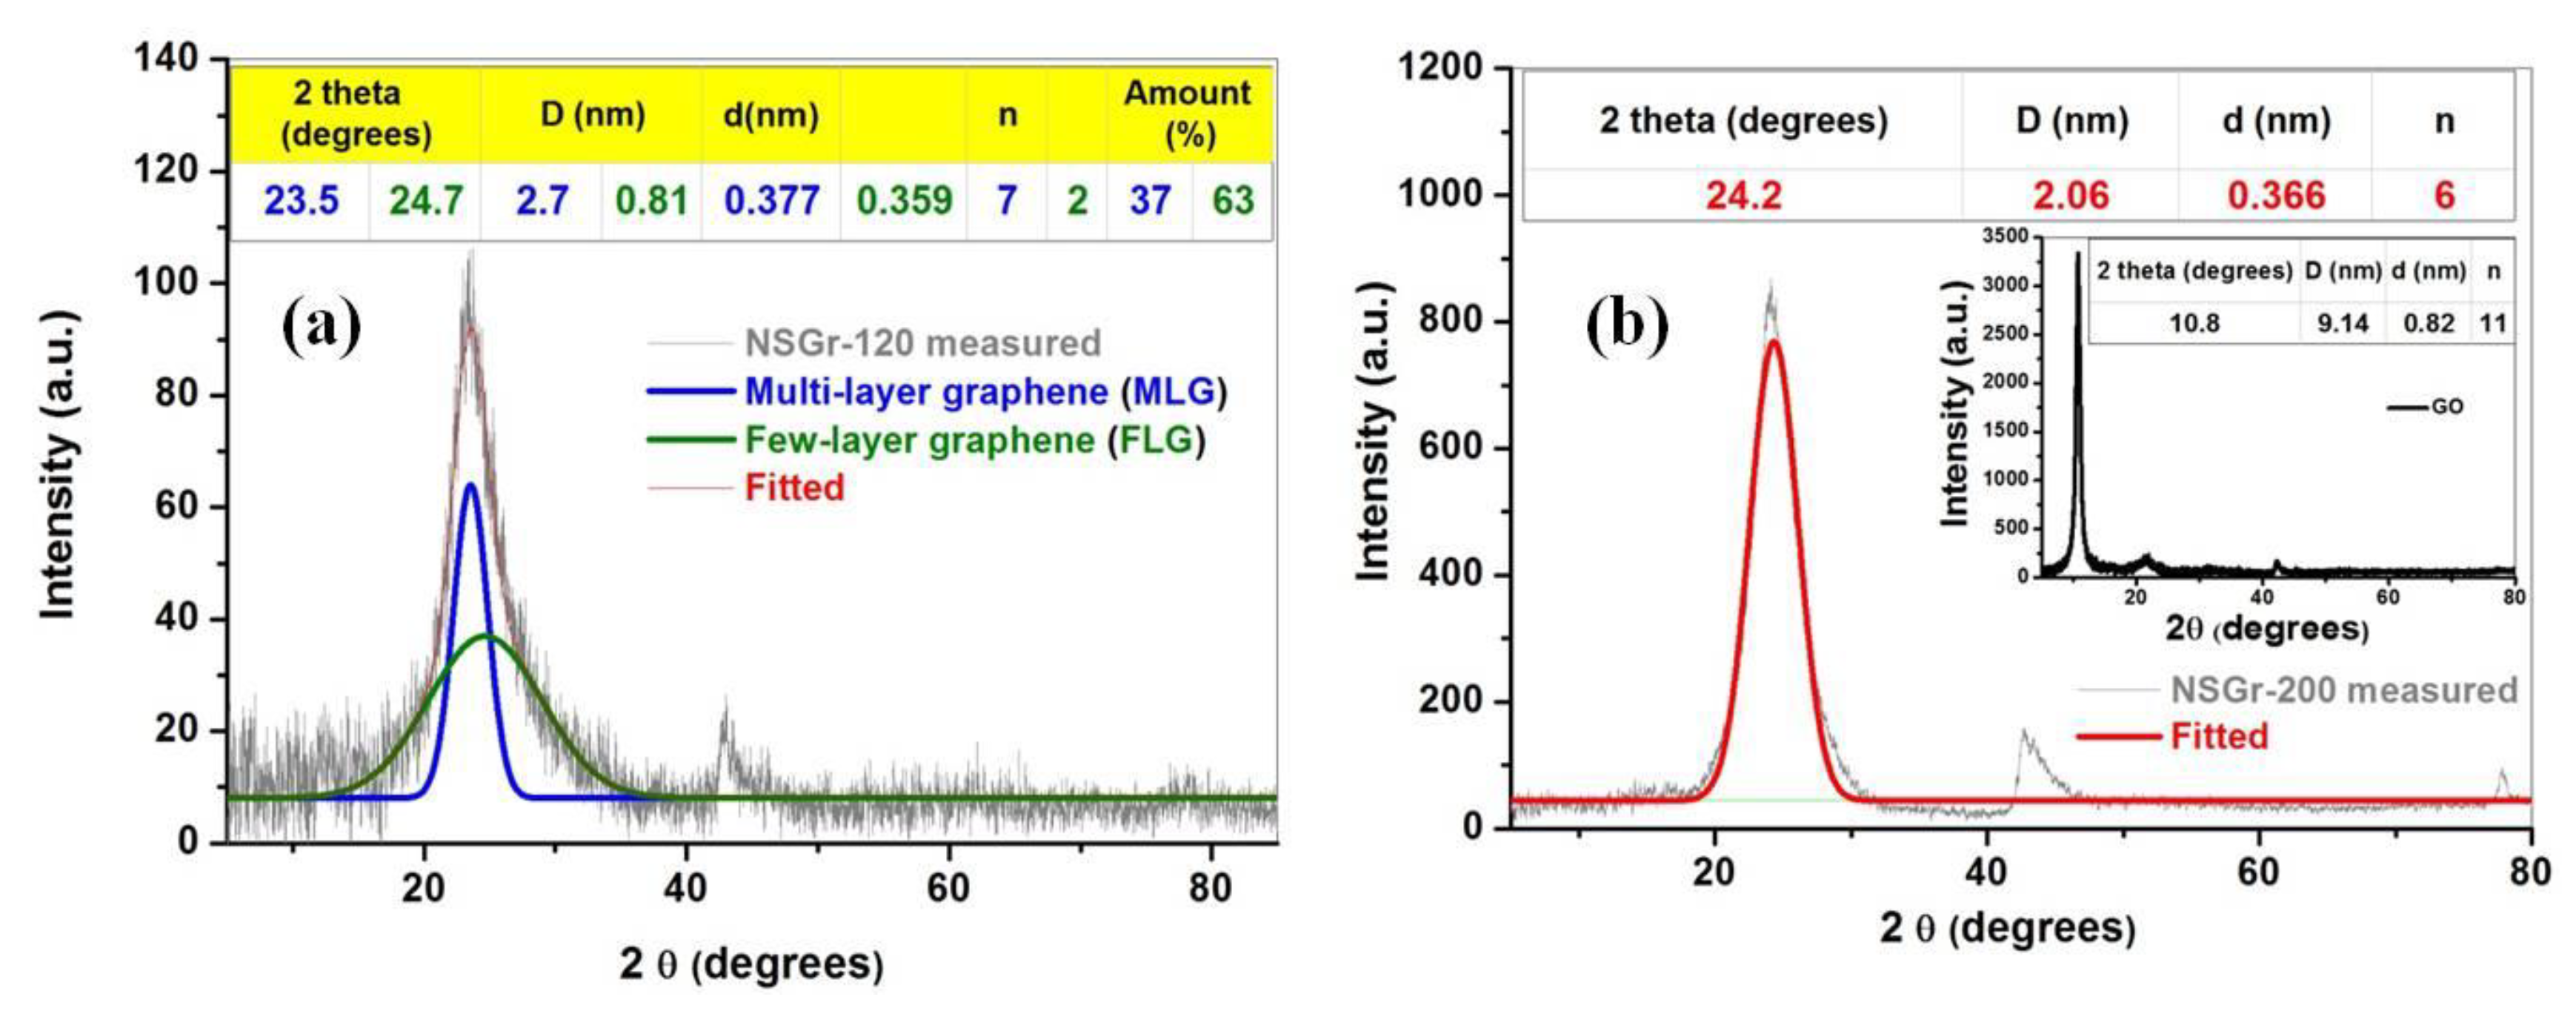
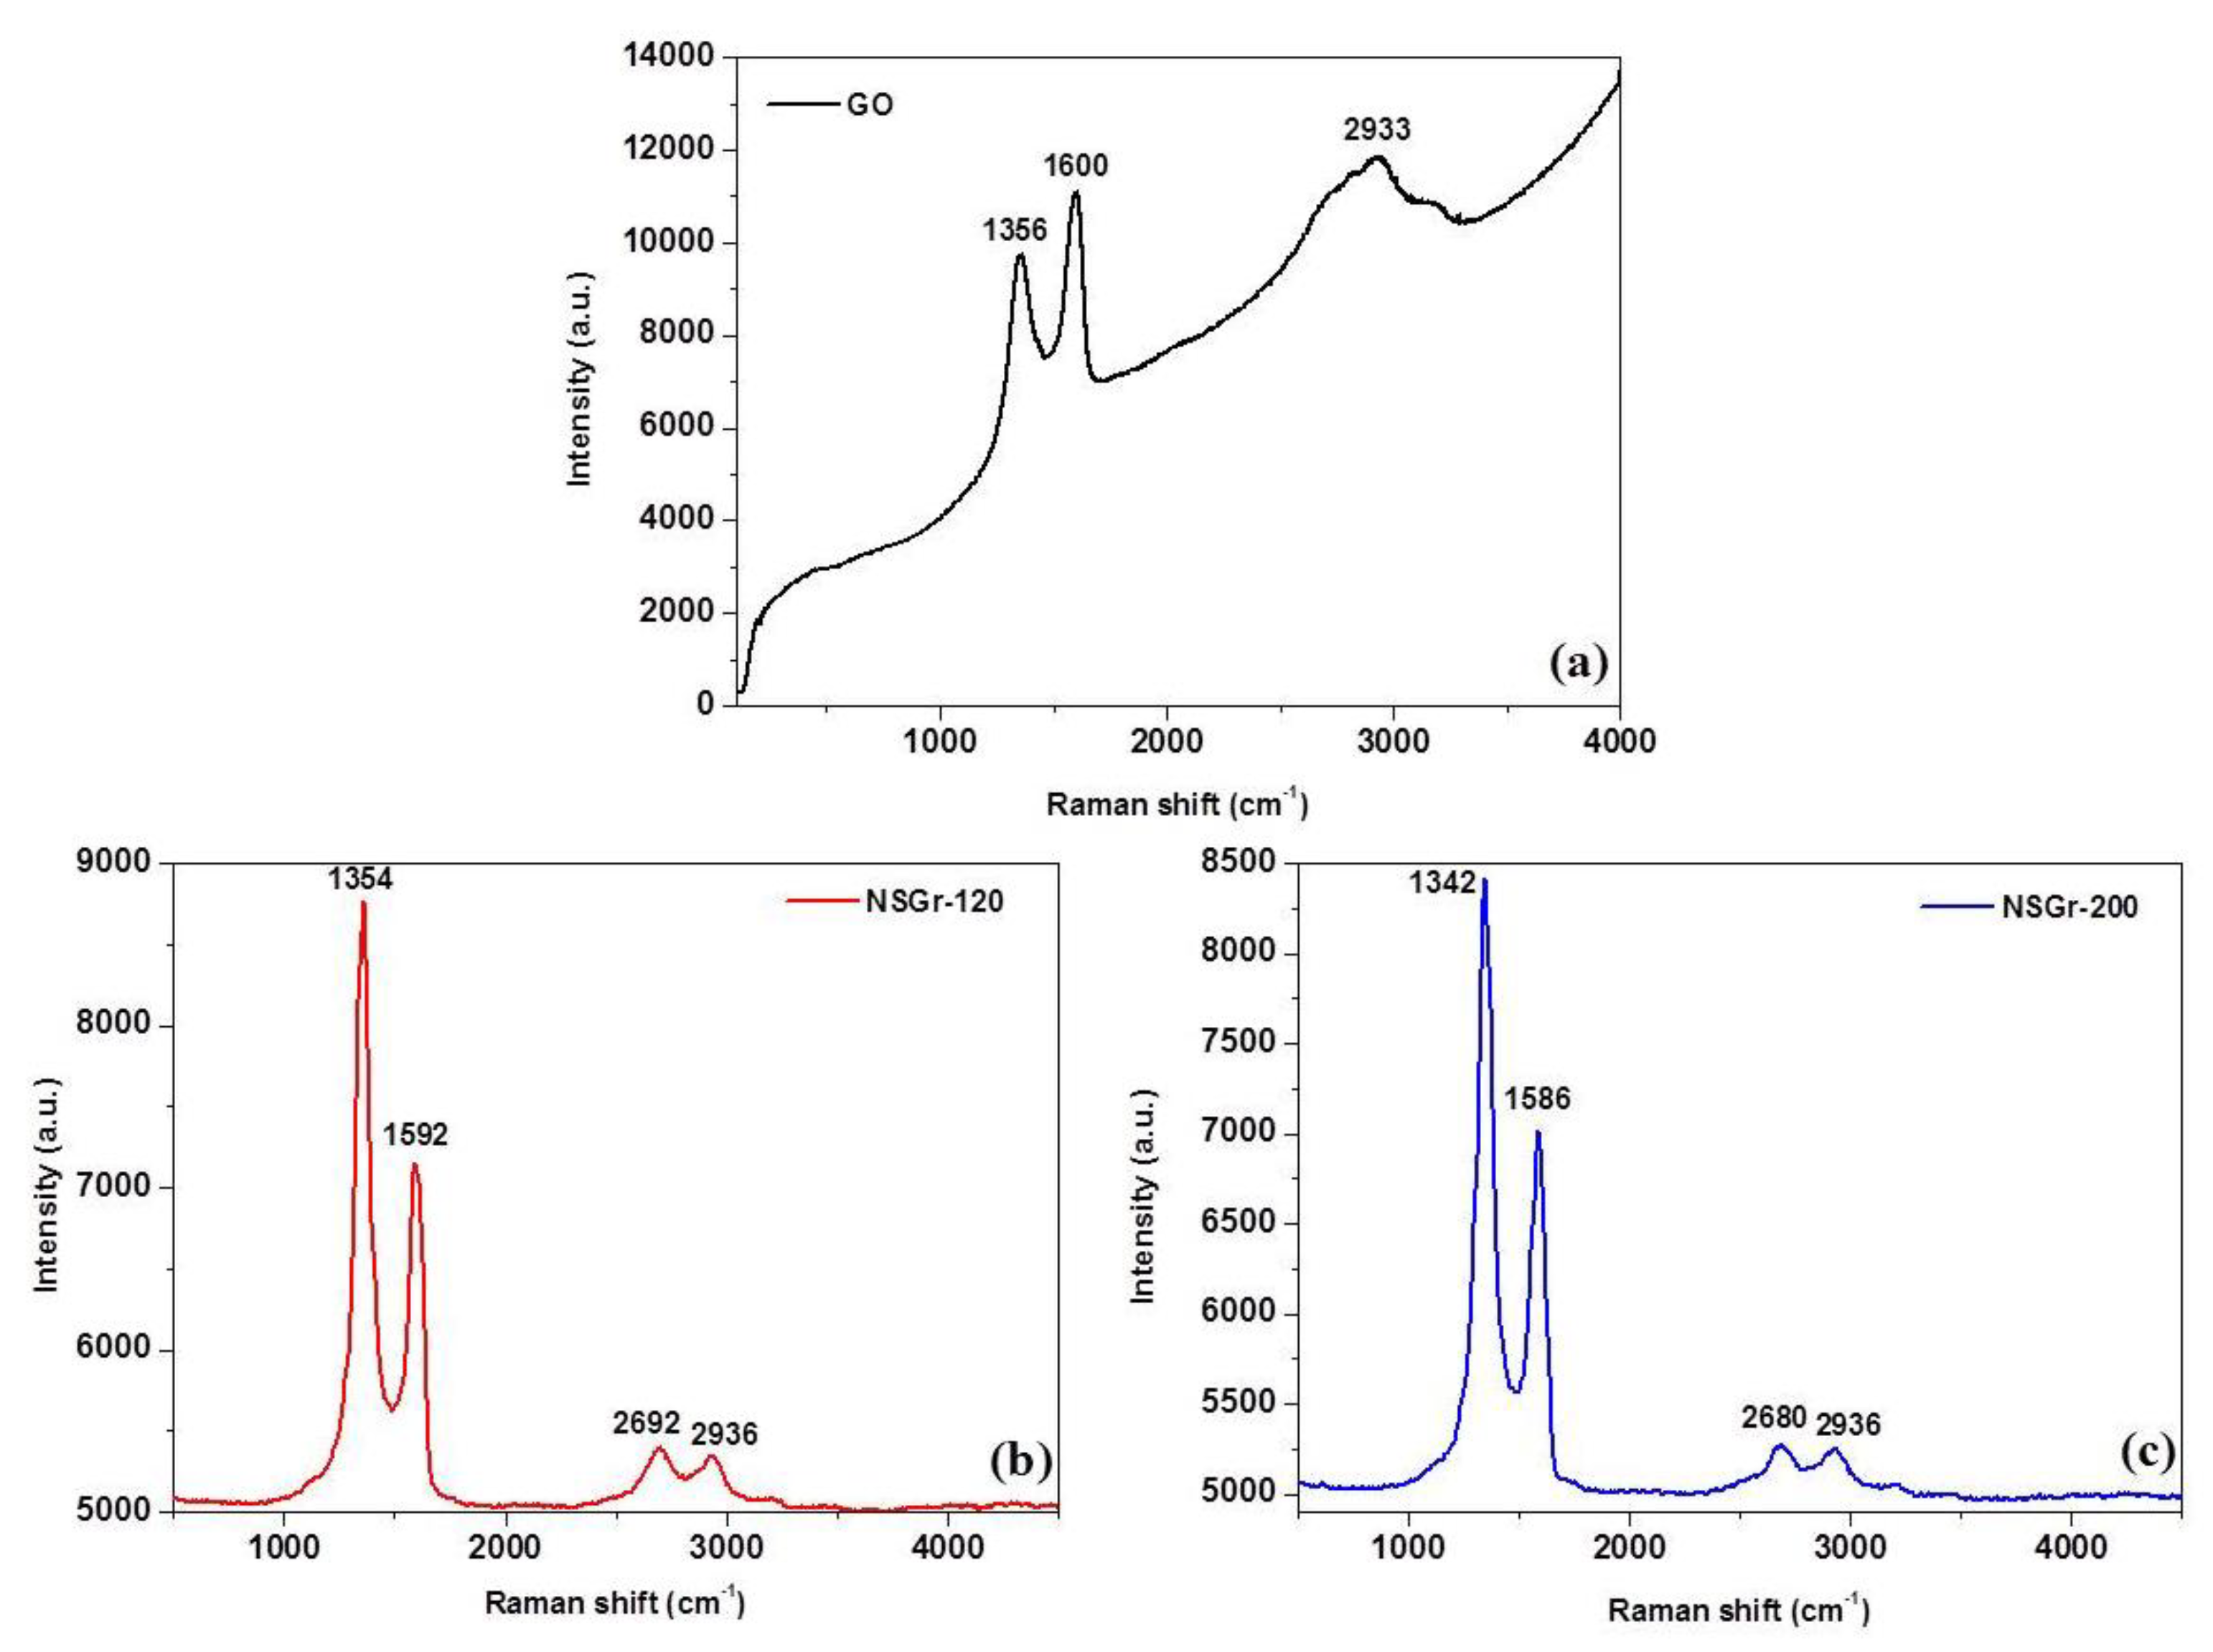
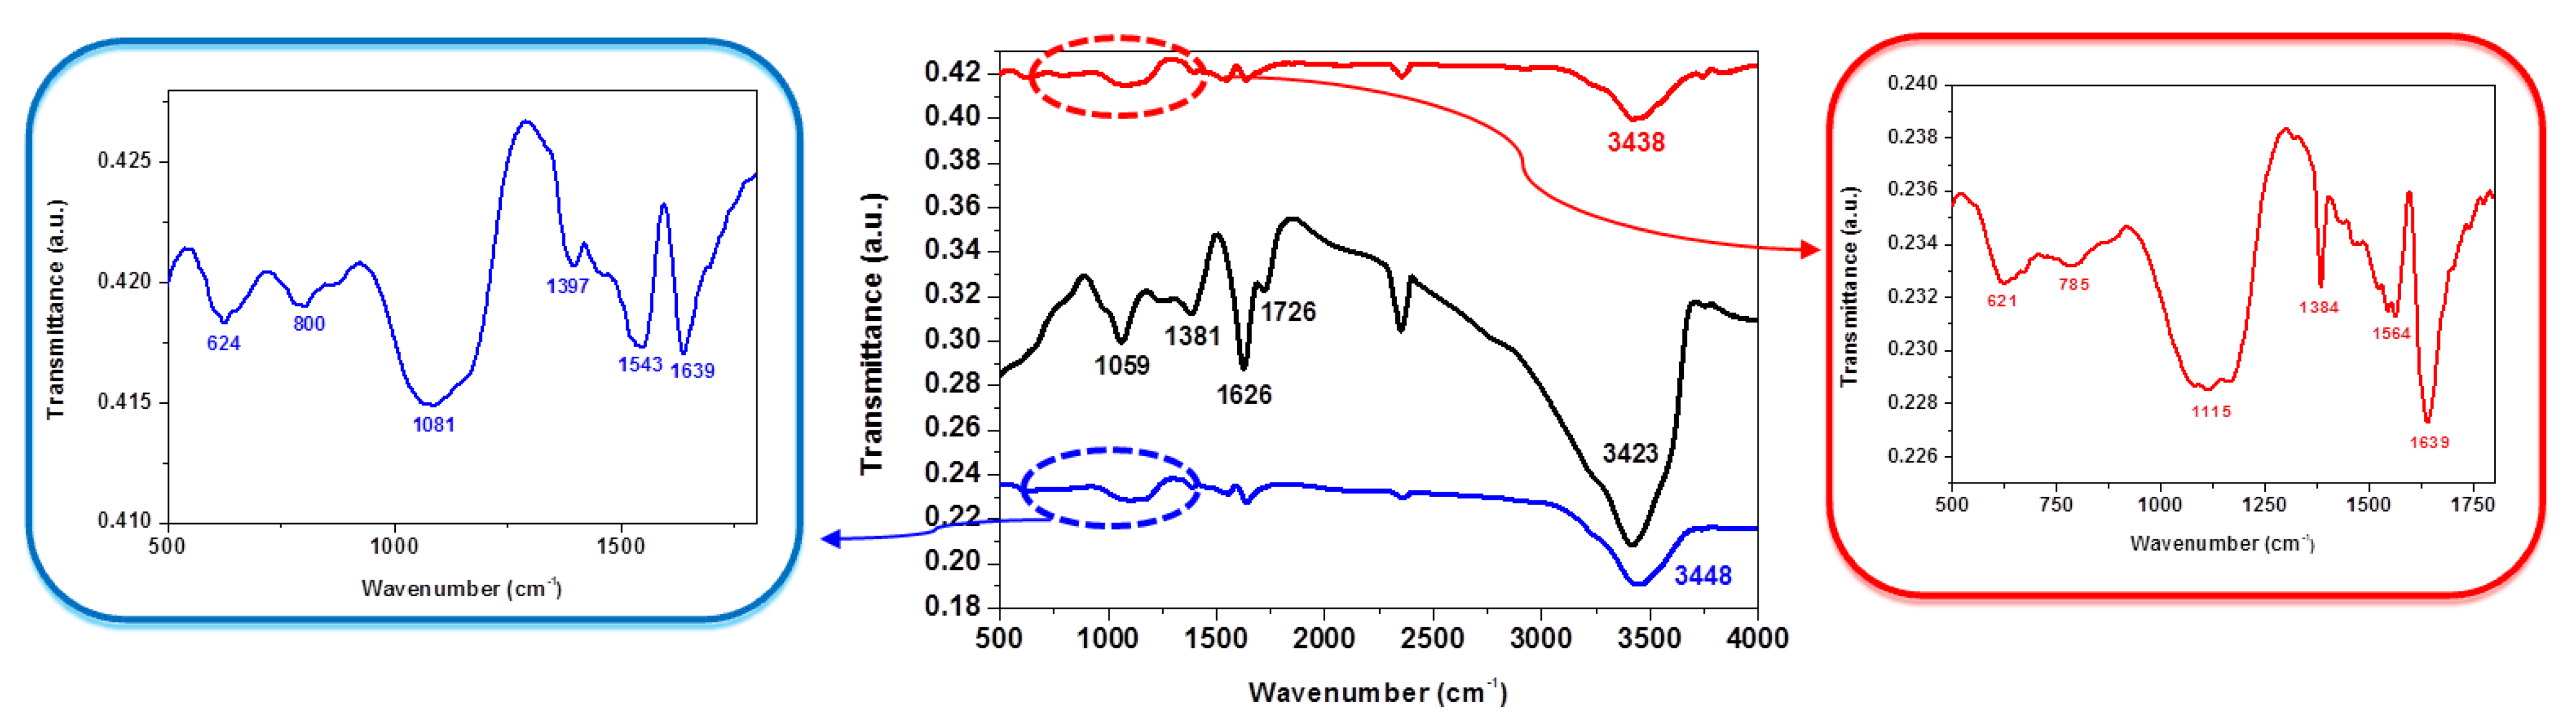
3.1. Synthesis and Characterization of the NSGr Samples

The morphology of NSGr-120 and NSGr-200 samples was examined by SEM and TEM techniques. In the case of the NSGr-120 sample, the graphene flakes are relatively compact and uniformly distributed over the support (Figure 1a,b). In contrast, the NSGr-200 sample has a laxer distribution and larger flaxes, but these flakes also have a uniform distribution. Few isolated graphene flakes can be observed in Figure 2a–d, revealing their thin and wrinkled surfaces.
X-ray photoelectron spectroscopy was next used for quantitative and qualitative analysis of the prepared samples. It is a surface-sensitive analysis technique that measures the elemental composition and chemical state of a material from ~10 nm depth of the sample. The elements present on each sample surface were identified and quantified by acquiring survey spectra on each sample.
As shown in Figure 3, the high-energy resolution carbon spectrum was acquired and quantified for NSGr-120 and NSGr-200 samples as follows: The core-level line at 284.4 eV was attributed to the graphite-like sp2 hybridized carbon, while the line positioned at 285.4 eV belongs to the sp3 hybridized carbon of the oxidized area of graphene. The C–S and C=S lines were identified at 286.1 and 287.16 eV, respectively. Carbon 1s core-level lines attributed to C=N and C-N bindings are positioned at 286.53 and 287.52 eV, respectively while carboxyl –C(=O)OH group is positioned at 288.3 eV.
Through the deconvolution of the S 2p core-level spectrum of NSGr-120, two components were identified, indicating the presence of two types of bonding: S–C– (polysulfide with terminal S) at 163.6 eV and –C–S–C– (polysulfide with central S) at 164.6 eV [27,28]. The situation changed in the case of the NSGr-200 sample where the total amount of sulfur is much lower than in NSGr-120 sample. Two lines are also seen here, namely the polysulfide with terminal S at 163.8 eV and a sulfate position at 167.0 eV.
In both samples, the N1s core-level line was quantified in four positions: pyrrolic N at 399.7 eV, pyridinic N at 398.26 eV, –NH2 group at 400.82 eV, and deprotonated nitrogen from the remained thiourea moieties at 296.7 eV. The results are seen in Figure 4. The inset shows the deprotonated thiourea. An important observation is related to the absence of quaternary “graphitic” nitrogen. This absence indicates that nitrogen doping is done only on the edges or inside the defects of graphene sheets [29].
The elemental composition determined for the NSGr-120 and NSGr-200 sample surfaces is shown in Table 1. The most important difference between the two samples is related to the fact that in the NSGr-120 sample the amount of sulfur is three times higher than in the NSGr-200 sample (see Table 1).
Next, the XRD patterns of the NSGr samples were recorded (Figure 5). Both display a broad peak centered at about 24°, corresponding to (002) reflections of graphene planes. Since the peak around 24° in the NSGr-120 sample is asymmetric, it was fitted by two theoretical Gaussian peaks. Sample NSGr-200 displayed only one peak at 2θ = 24.2°. The spacing between the graphene layers was calculated with the Bragg equation [30]:
λ = 2 d s i n ( θ )
where λ is the wavelength of the X-ray beam (0.154 nm), d is the distance between two layers, and θ is the diffraction angle. As can be seen in Figure 5b, the diffraction peak of NSGr-200 is at 2θ = 24.26°, representing the (002) planes. The spacing between the co-doped graphene sheets was found to be 0.366 nm.
The mean crystallite size (D) for each sample was calculated using the Debye–Scherrer equation:
D = K λ β cos θ
where D is the crystallite size, K is a numerical factor commonly referred to as the crystallite-shape factor (0.9), λ is the wavelength of the X-rays, β is the full-width at half-maximum of the X-ray diffraction peak in radians, and θ is the Bragg angle. For NSGr-200, the D value was found to be 2.06 nm.
The average number of graphene layers (n) was obtained using Equation (3); in the case of NSGr-200, n was found to equal 6 layers.
n = D d
The structural parameters for all samples, calculated from XRD data, are presented in Figure 5. The calculations show that there is a significant reduction in graphene layers upon doping and reduction, from n = 11 for GO to n = 2 and 7 for NSGr-120 and n = 6 for NSGr-200. The decrease in the number of layers as a consequence of the doping/reduction process can be associated with the removal of functional groups and the addition of heteroatoms, which diminish the interactions between graphene layers. The amount (%) of each type of graphene, few-layer graphene (FLG) and multilayer graphene (MLG), for each sample was determined from XRD, calculated as the ratio of the fitted peak area to the total area of the diffractogram [31] (see the tables inside Figure 5).
The degree of structural disorder within graphene oxide and nitrogen and sulfur co-doped graphene samples was evaluated using Raman spectroscopy (Figure 6). The high fluorescence signal of GO supports the fact that the material is highly oxidized, being in accordance with the XRD pattern. In the nitrogen and sulfur co-doped graphene samples, three important bands are evidenced: the defect (D) band at ~1350 cm−1, the graphite (G) band located at ~1590 cm−1, and the 2D band at ~2690 cm−1.
The D + D’ band, present around 2930–2940 cm−1, appears in graphene-like materials with structural defects and is visible in all samples [32]. The ID/IG intensity ratio gives an indication of the defect-free domains and is related to the in-plane crystallite size (La) as shown by Equation (2) [33]:
L a ( nm ) = 560 E l 4 ( I D I G ) 1
where El represents the laser excitation energy (2.33 eV).
The largest La value was obtained for GO (21.66 nm), followed by NSGr-200 (15.88 nm). For the NSGr-120 sample, the La value is slightly lower (15.48 nm), being in good agreement with the higher doping level (Table 2). The higher intensity ratio (ID/IG) of NSGr samples in comparison with that of GO may be ascribed to more defects generated by nitrogen and sulfur co-doping resulting in highly disordered graphene nanosheets. These defects can provide considerable active sites for cysteine electrochemical detection, as shown in the next paragraphs.
FTIR spectroscopy was then used to investigate the nature of the surface groups of the prepared samples. The corresponding spectra of GO and of the nitrogen and sulfur co-doped samples NSGr-120 and NSGr-200 are presented in Figure 7.
Table 3 presents the infrared bands of GO, NSGr-120, and NSGr-200 samples. The spectrum of GO (Figure 7 black) gave the absorption peaks of O-H at 3423 cm−1, C=C at 1626 cm−1, C=O at 1726 cm−1, C-OH at 1381 cm−1, and C-O at 1059 cm−1. In the spectrum of NSGr-120 (blue) and NSGr-200 (red), these peaks decreased or even disappeared. The peak at ~621 cm–1 is due to C–S stretching vibration. Another important feature is the shifting of the peak at 1626 cm−1, attributed to the in-plane vibration of C=C, to 1639 cm−1 in the nitrogen and sulfur co-doped samples. This is due to the superposition of the C=C and C=N vibrations.
A comparison with other graphene samples obtained by hydrothermal synthesis using thiourea as reducing/doping agent is presented in Table 4. It can be seen that our samples present a higher doping percentage in milder reaction conditions, thus reducing energy and reagent consumption.

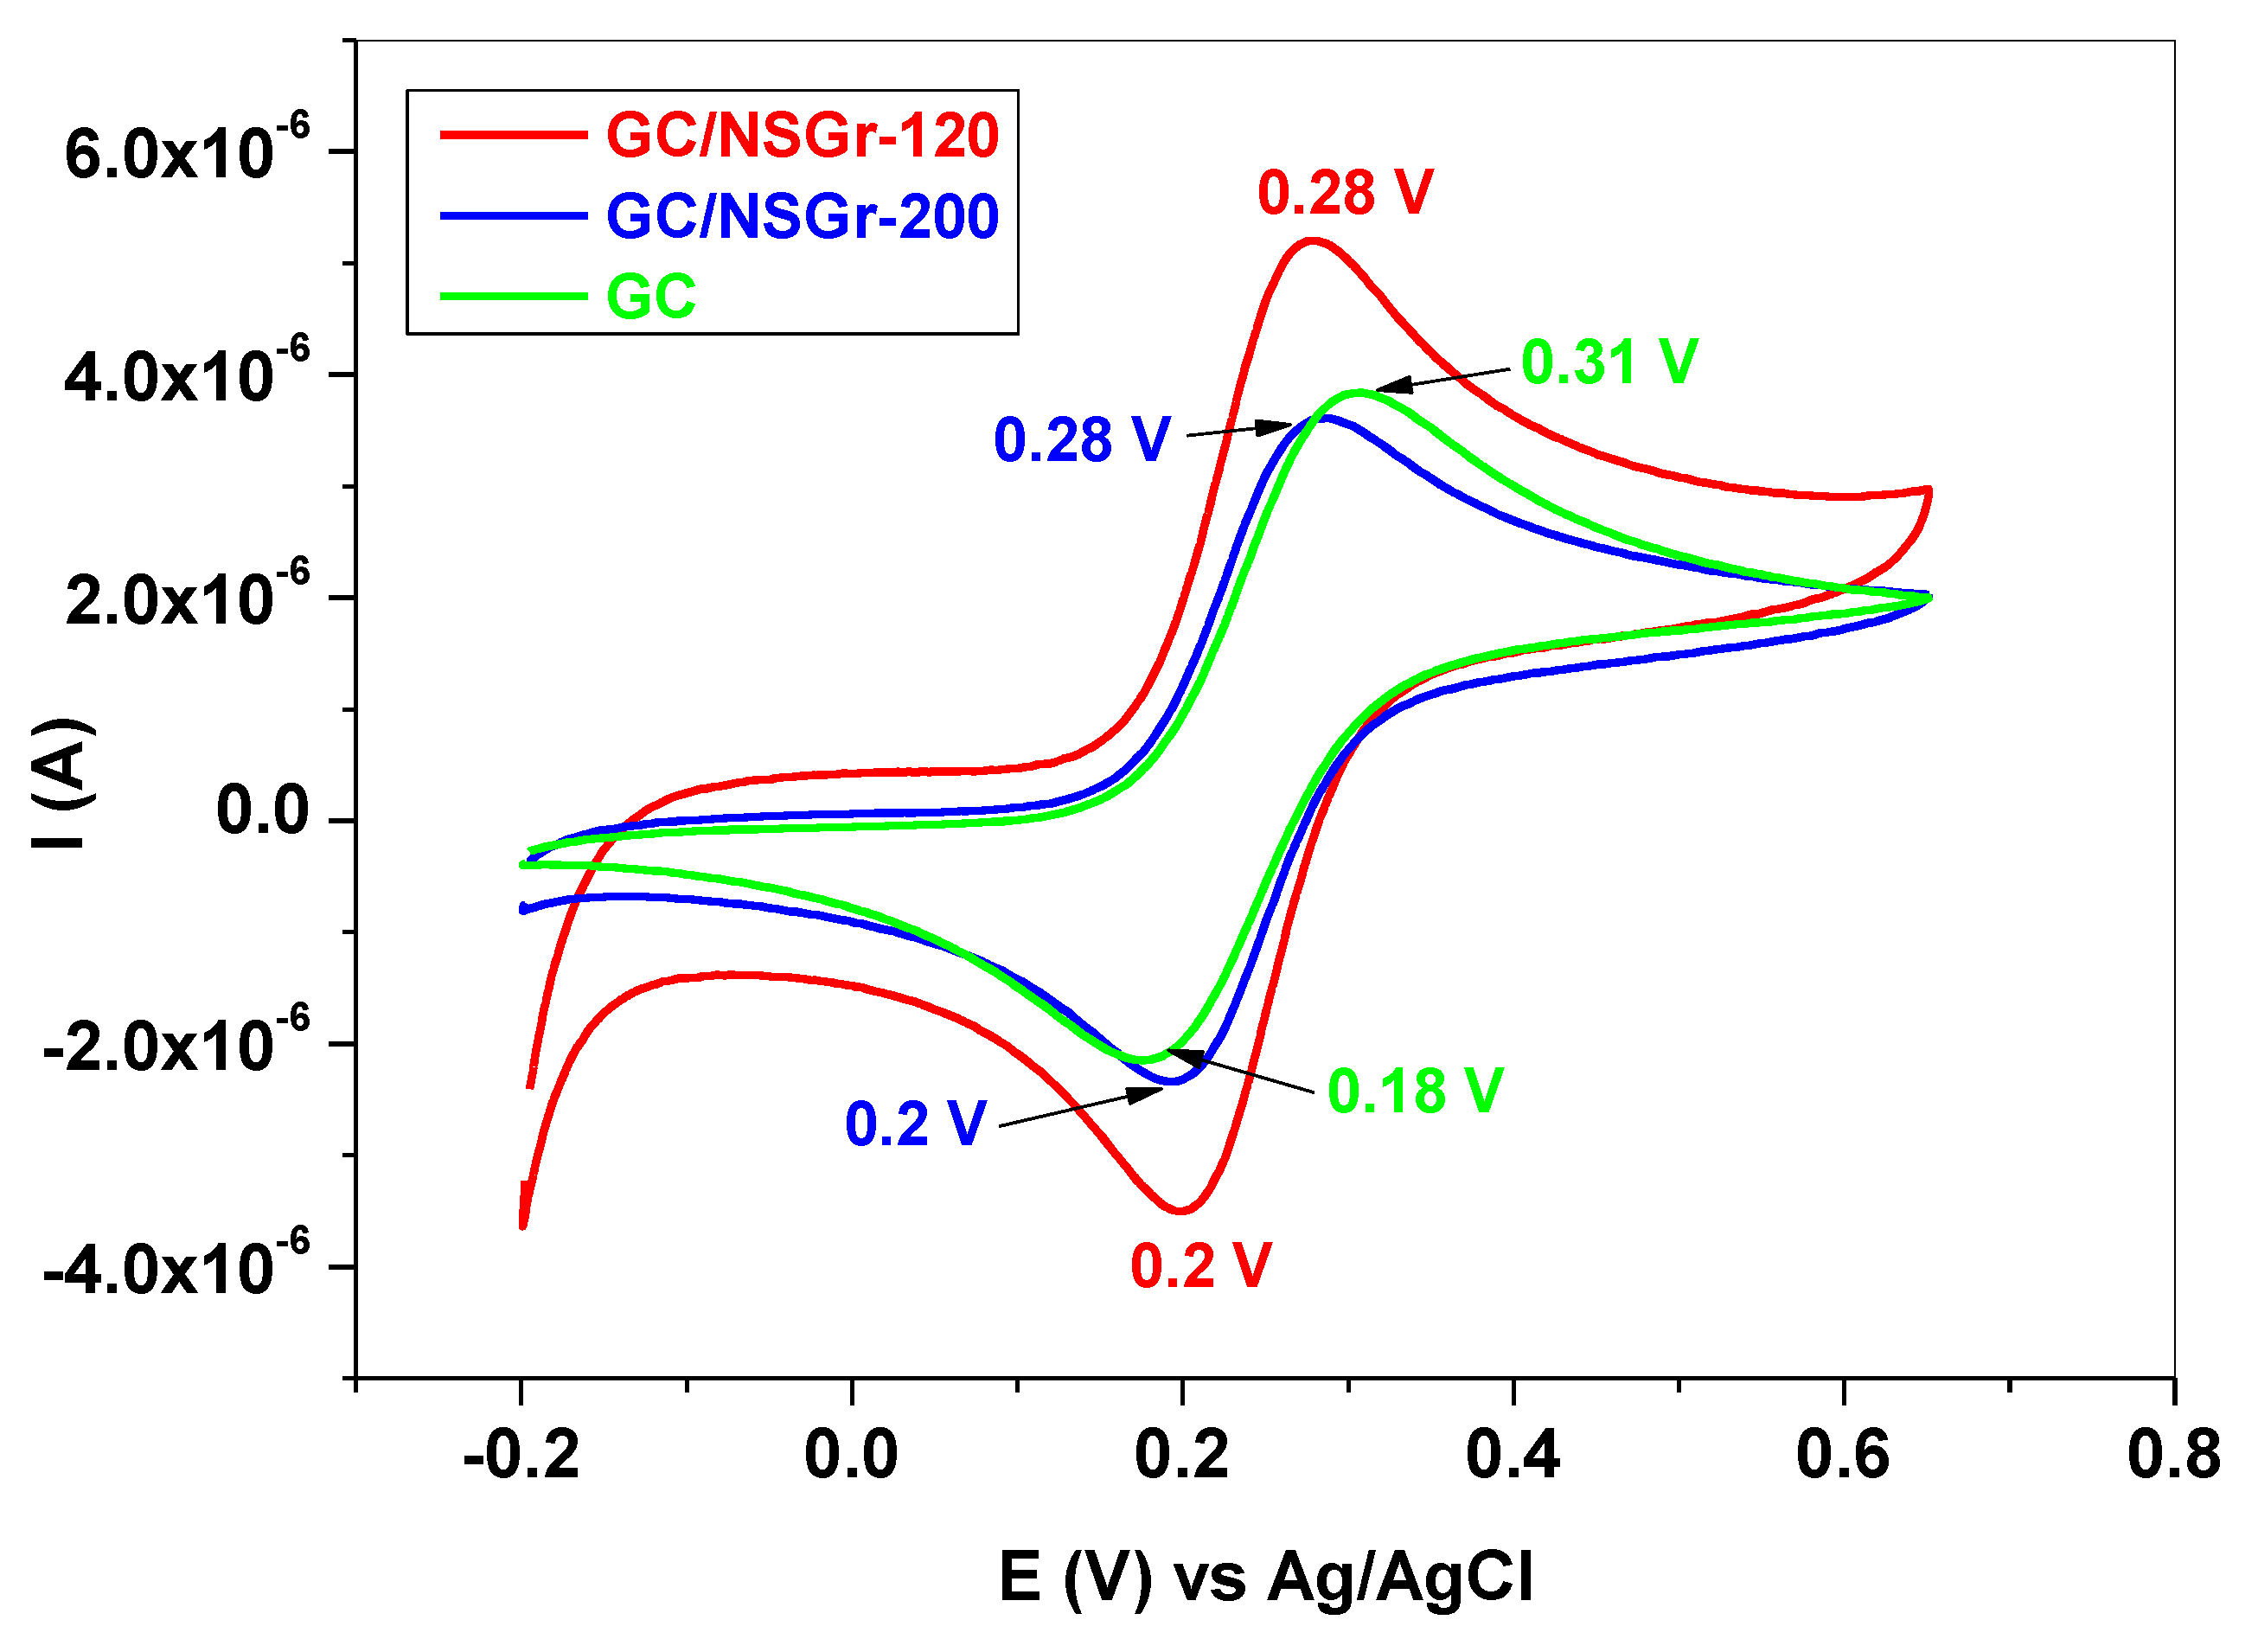
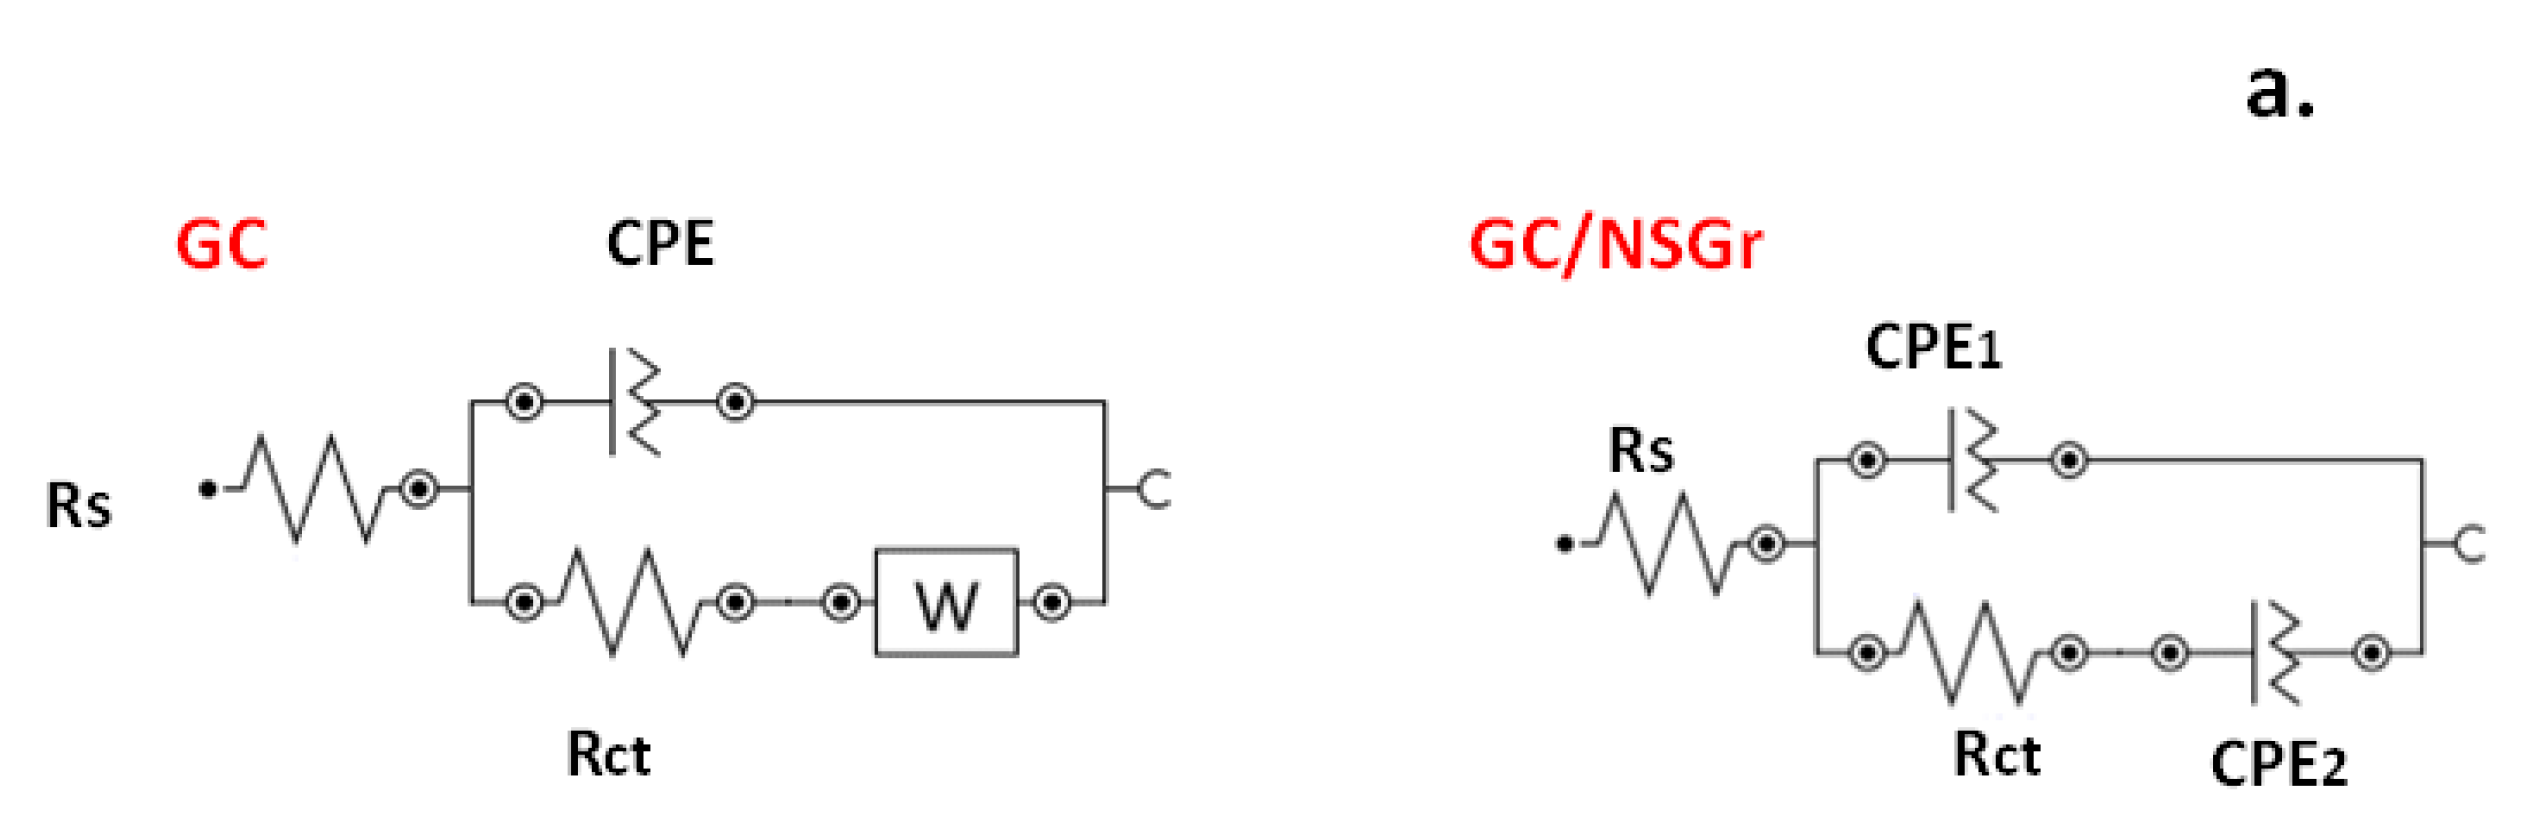
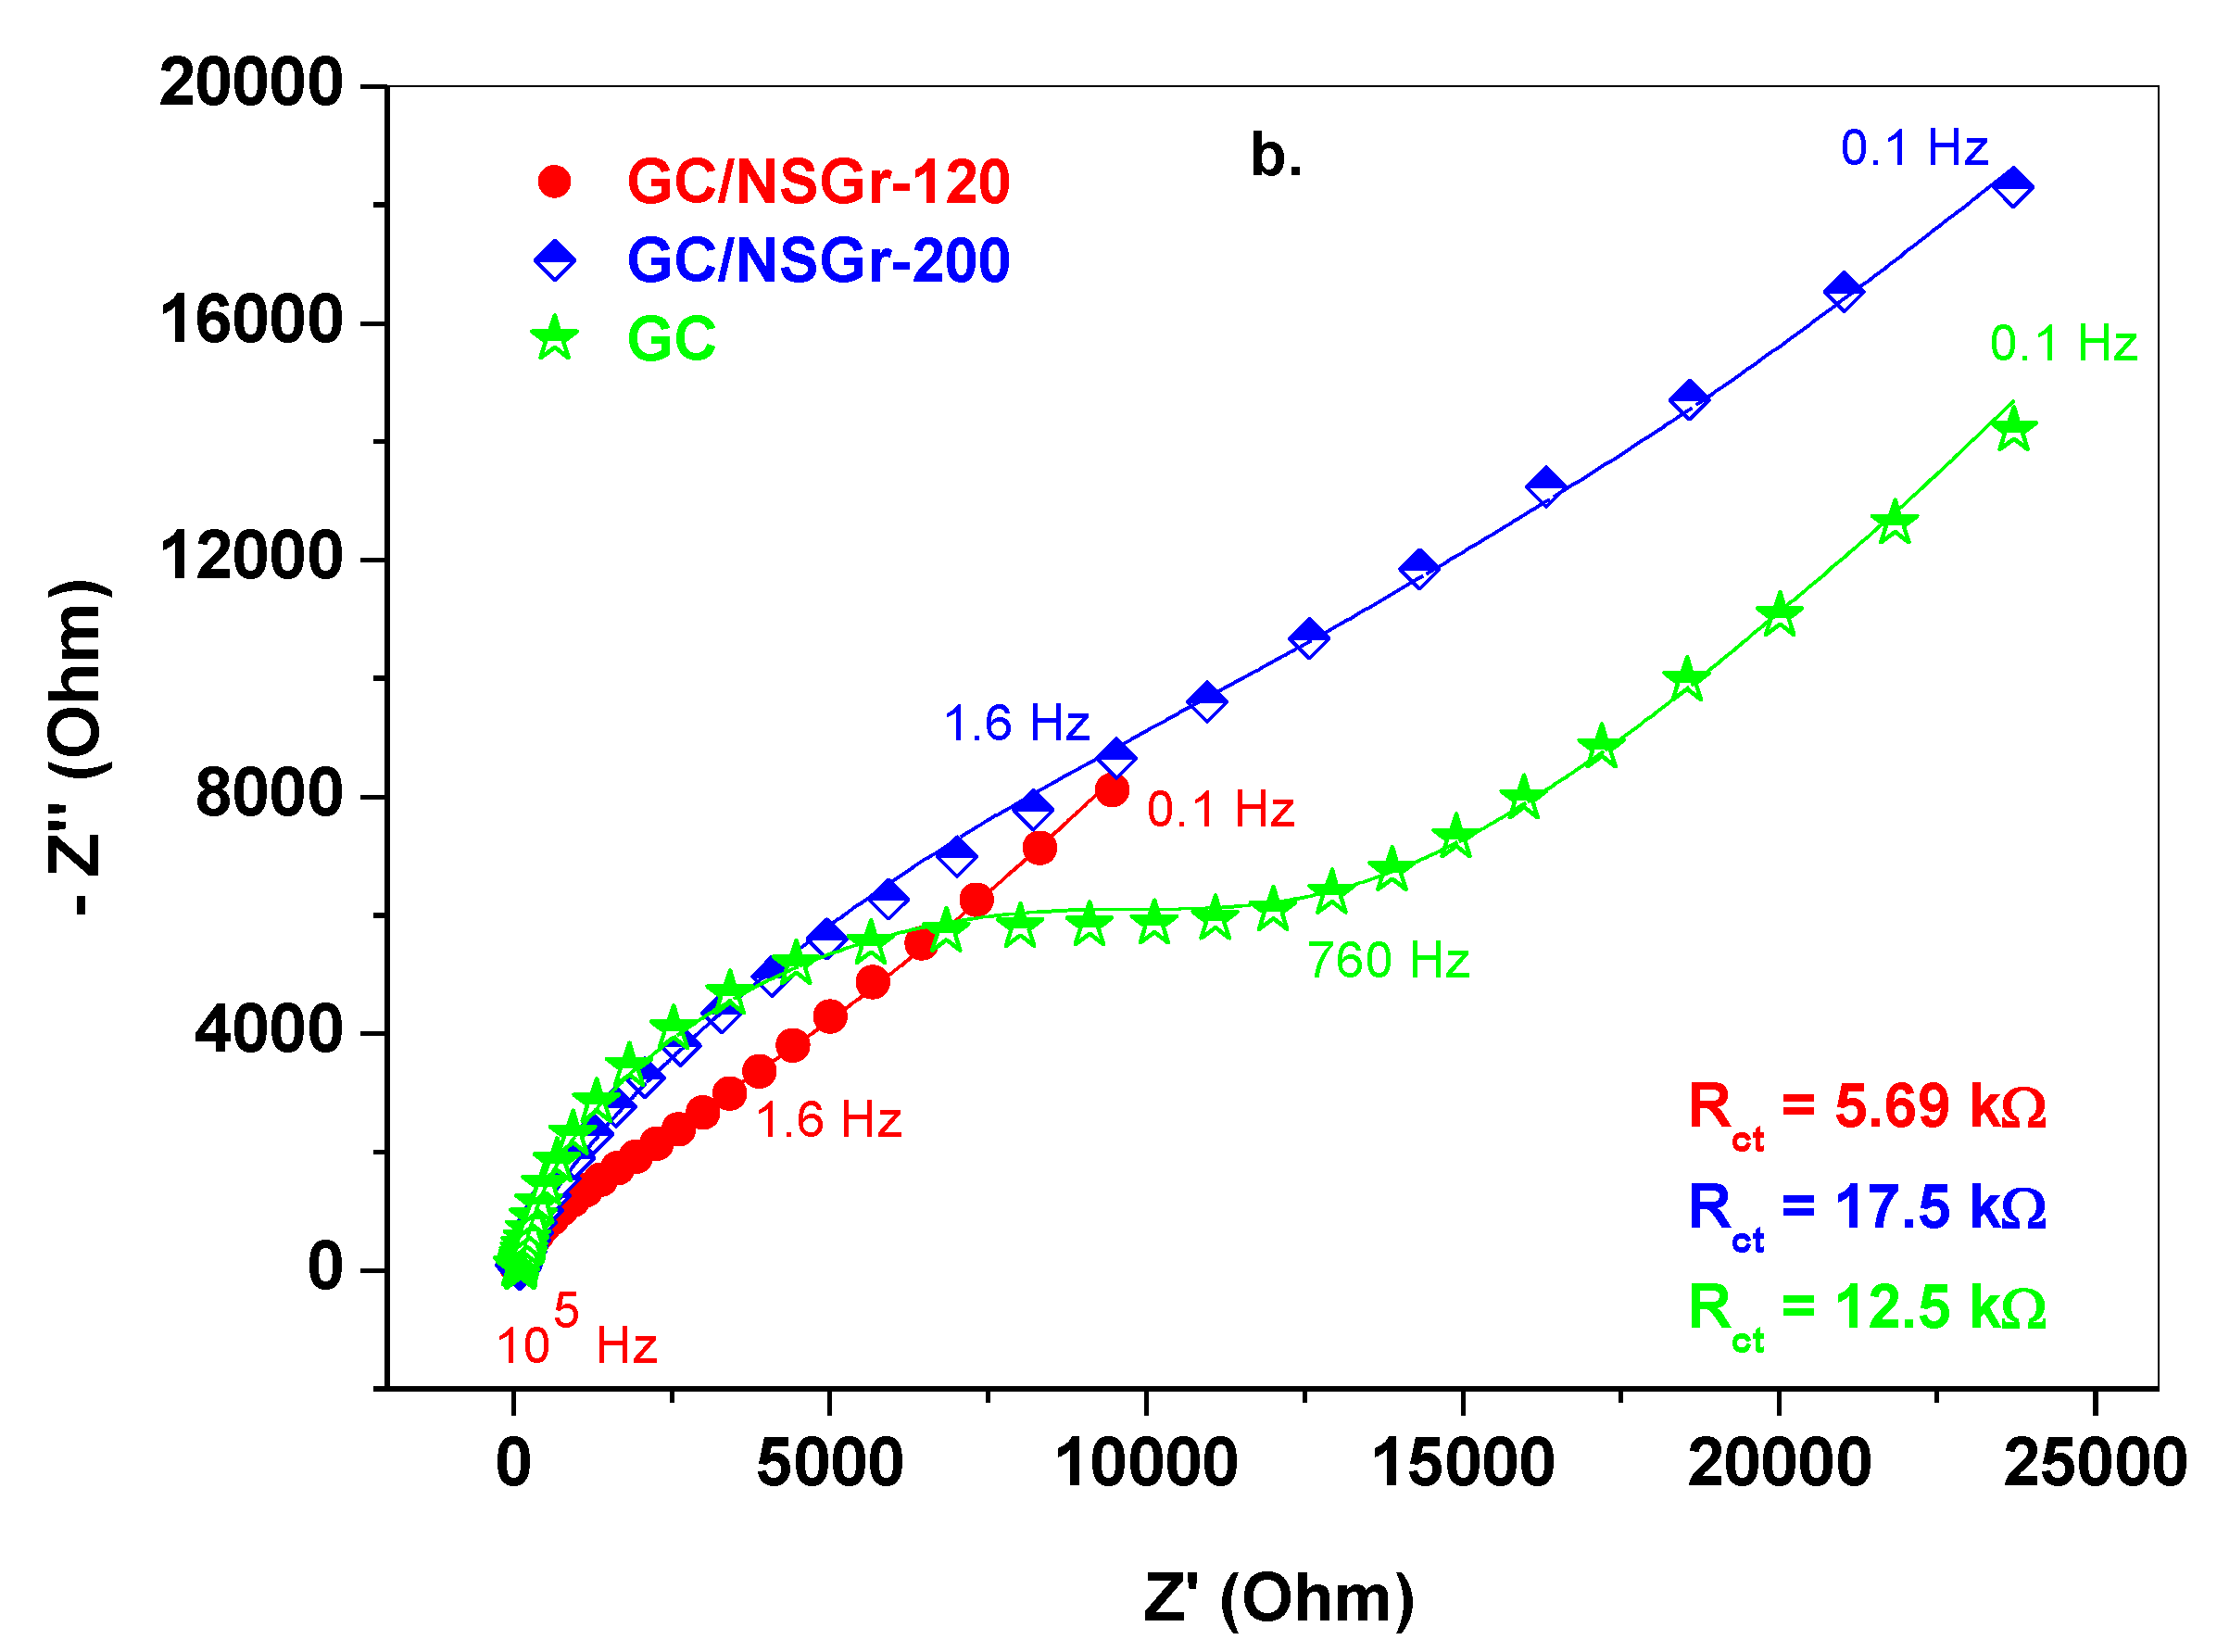
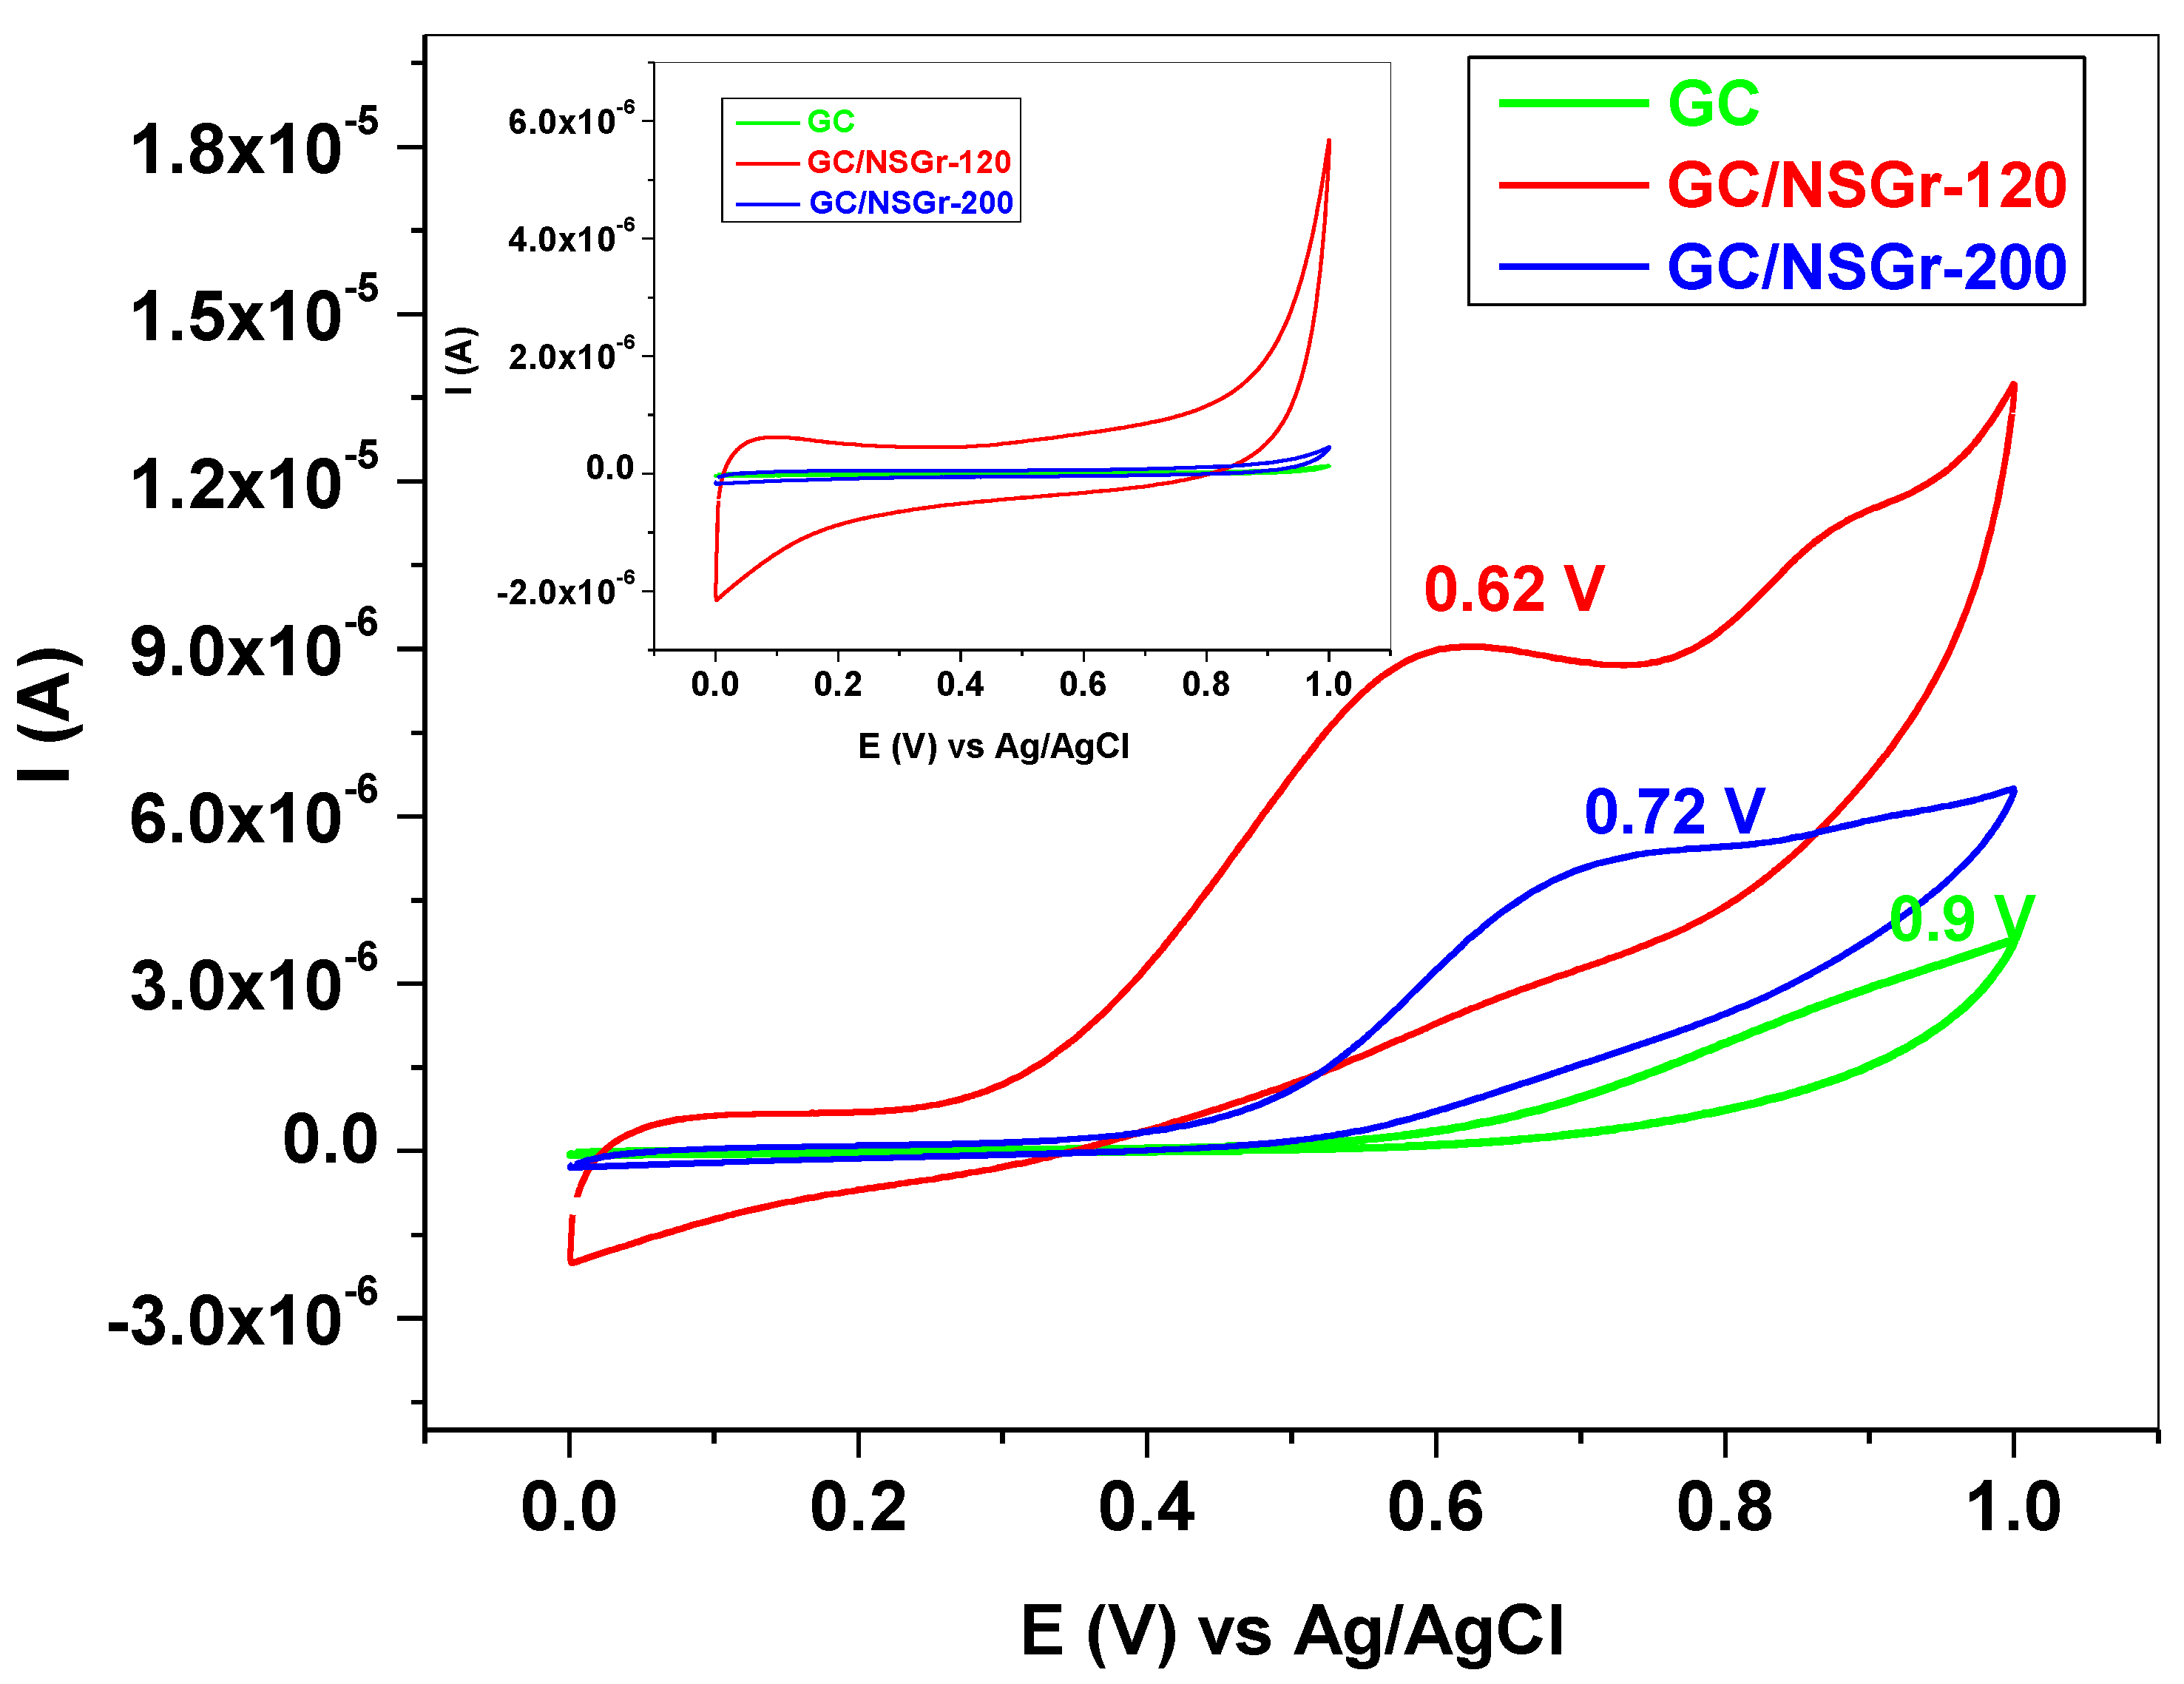
3.2. Electrochemical Characterization of Bare and Graphene-Modified Electrodes

The bare and graphene-modified electrodes were first electrochemically characterized by cyclic voltammetry in a redox couple solution containing 1 mM K4[Fe(CN)6] + 0.2 M KCl. The potential was scanned between −0.2 and +0.65 V with a scan rate of 10 mVs−1, and the results can be seen in Figure 8. In the case of bare GC electrode (green), the peak potential separation (ΔEp) is large (~130 mV), indicating a quasi-reversible redox process. In contrast, the GC/NSGr-120 electrode (red) exhibits well-defined anodic and cathodic peak currents of higher intensities and smaller ΔEp (80 mV). Based on the fact that it also has the peak current ratio (Ipa/Ipc) equal to 1, one can say that this material has considerably improved the redox characteristics of the bare GC electrode (see also Table 5). The electrode modified with NSGr-200 graphene sample has a small ΔEp (80 mV) but also the lowest anodic peak current, which may be attributed to the high charge-transfer resistance (see the next paragraph).
Next, other important parameters such as the charge-transfer resistance (Rct) and the apparent heterogeneous electron transfer rate constant (Kapp) were determined from the EIS spectra. The values were obtained after fitting the Nyquist plots (Figure 9) with the appropriate equivalent electrical circuit. In the case of bare GC, the circuit contains the following elements: the solution resistance (Rs), the Warburg impedance (ZW), the charge-transfer resistance (Rct), and a constant phase element (CPE) that replaces the double-layer capacitance (Cdl). In the case of the two graphene-modified electrodes, the Warburg impedance was replaced with another CPE due to the increased roughness of their surfaces [39]. After fitting, the charge-transfer resistances of the three electrodes were determined to be: 5.2 kΩ (GC/NSGr-120), 17.5 kΩ (GC/NSGr-200), and 12.5 kΩ (GC), indicating that the NSGr-120 graphene sample favored the transfer of electrons when attached to the electrode surface.
This correlates well with the values of the apparent heterogeneous electron transfer rate constant (Kapp) determined from Equation (5) [40] and listed in Table 5:
K app = RT n 2 F 2 AR ct C
where R is the ideal gas constant (8.314 J/(mol·K)), T is the temperature (298 K), F is the Faraday constant (96,485 C/mol), n is the number of electrons transferred during the redox reaction (n = 1), A is the active area of the electrode (cm2), Rct is the charge-transfer resistance obtained from the fitted Nyquist plots (Ω), and C is the concentration of the redox species (mol/cm3).

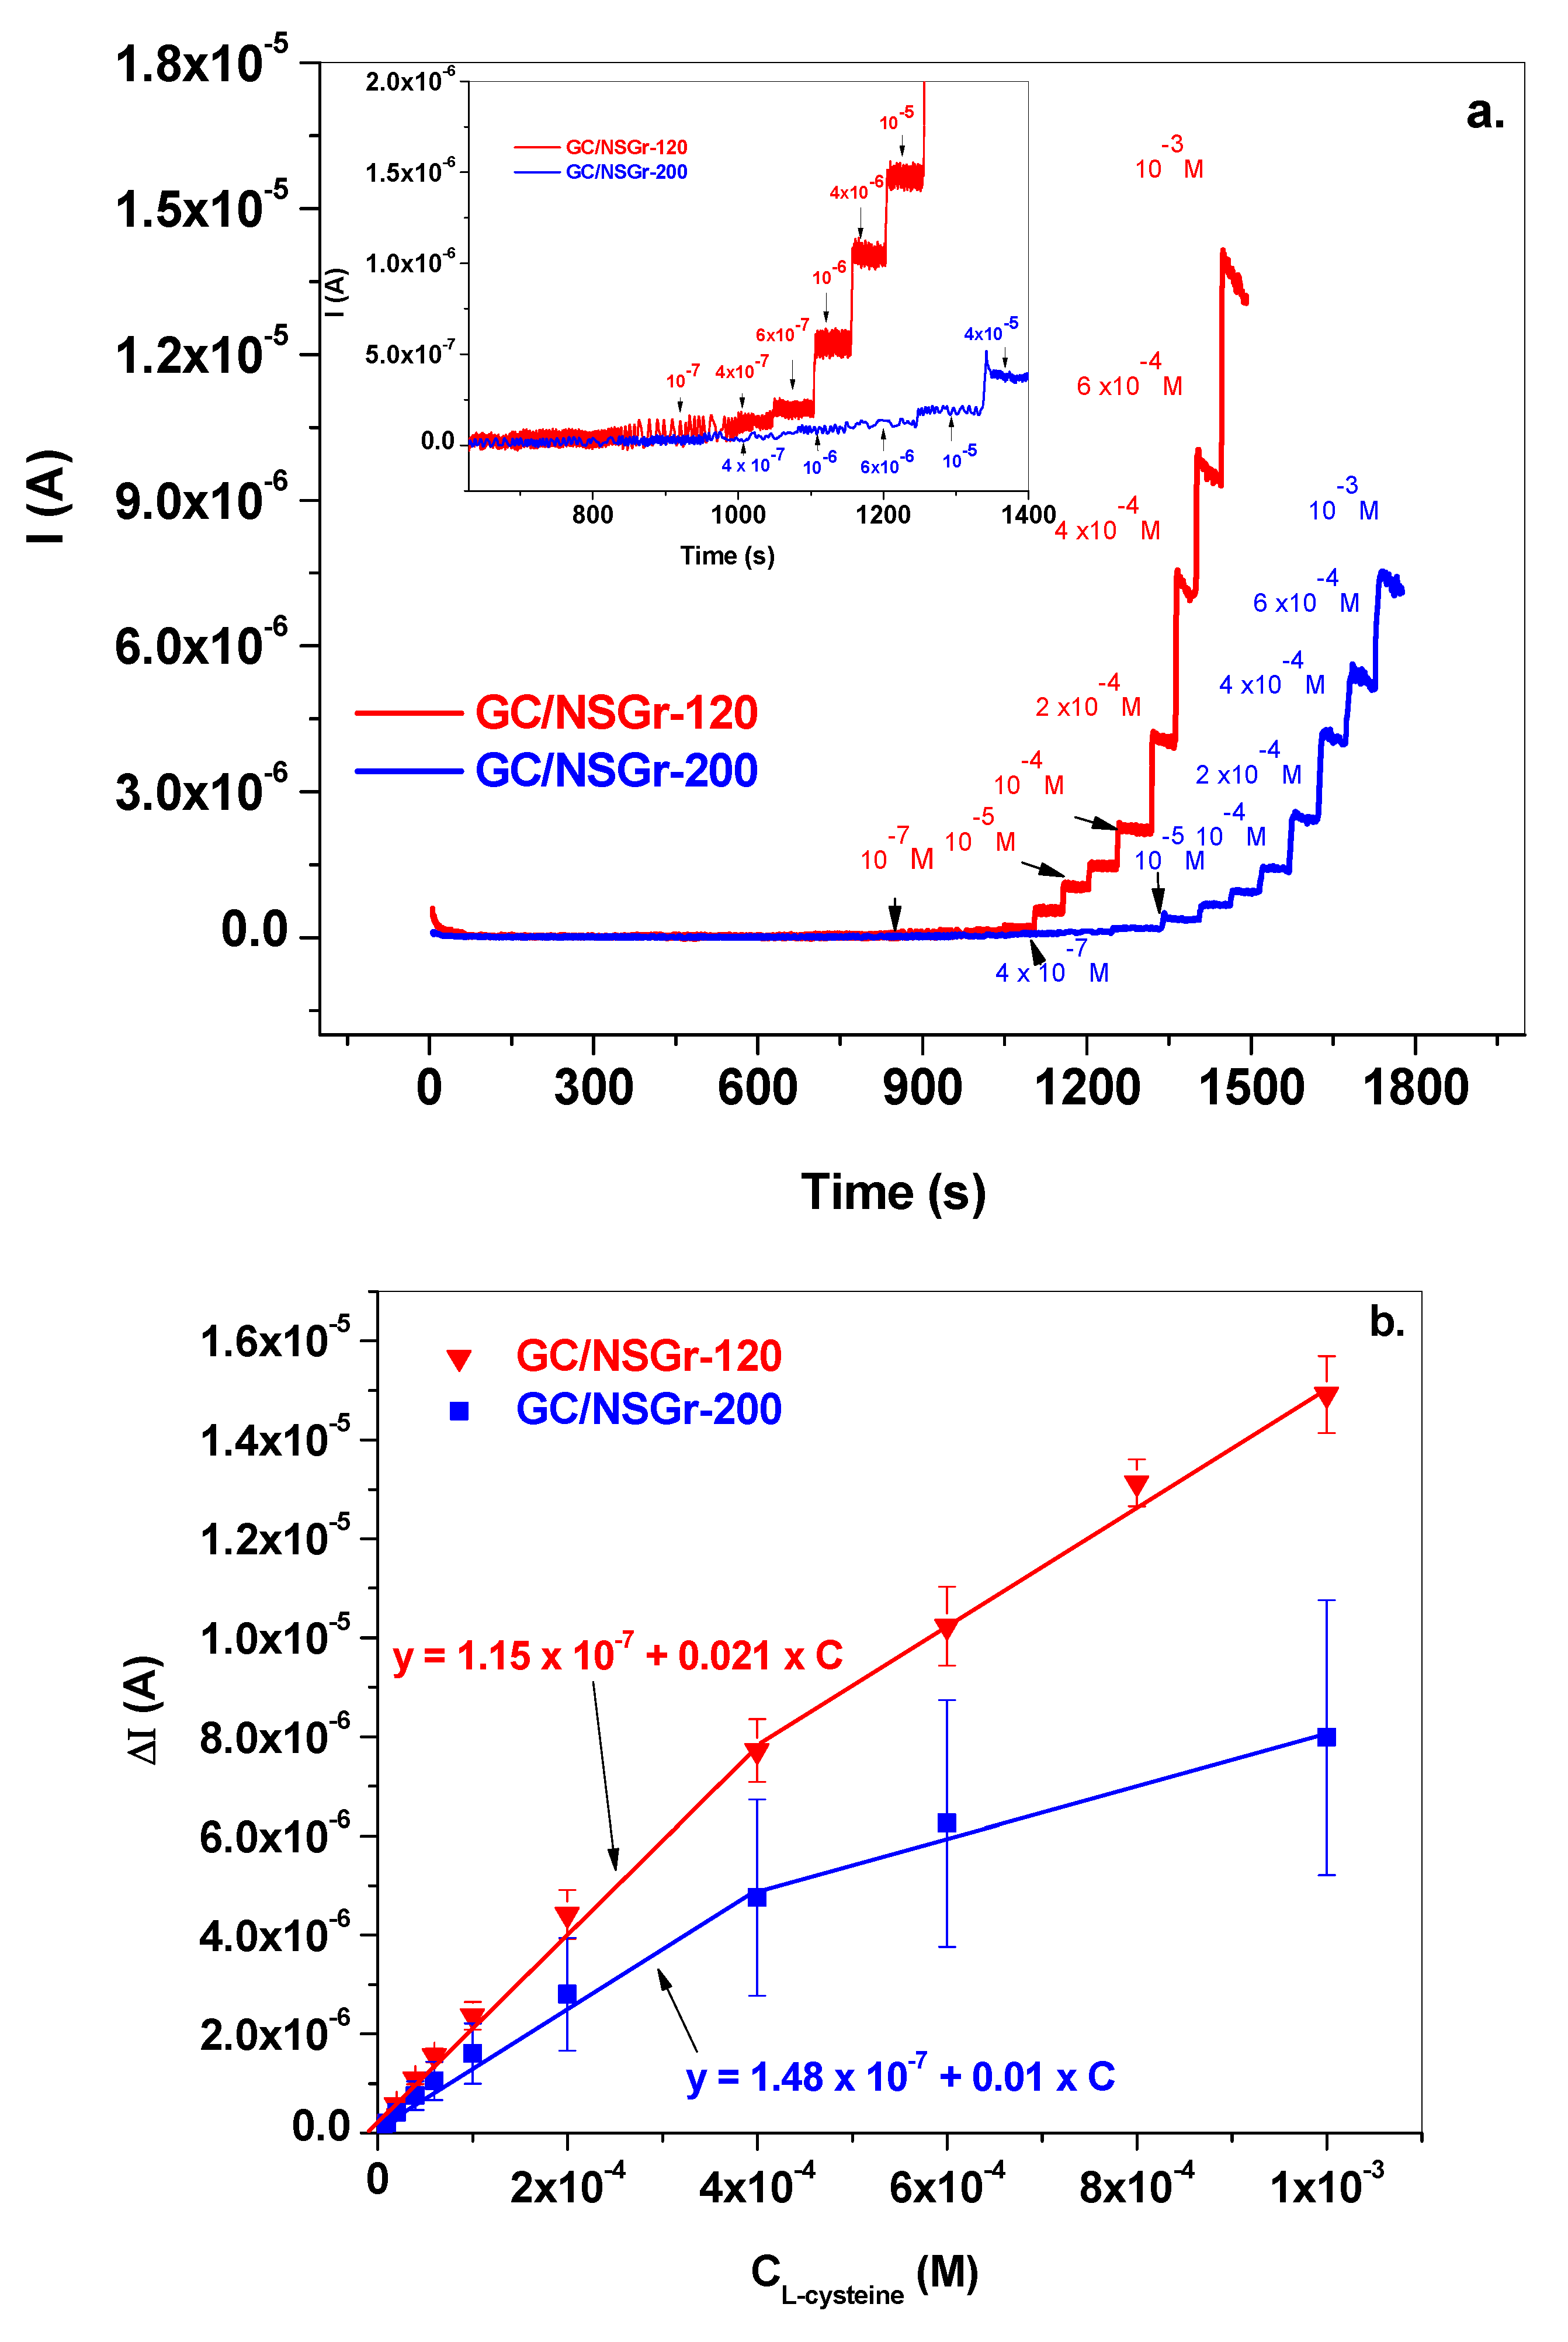
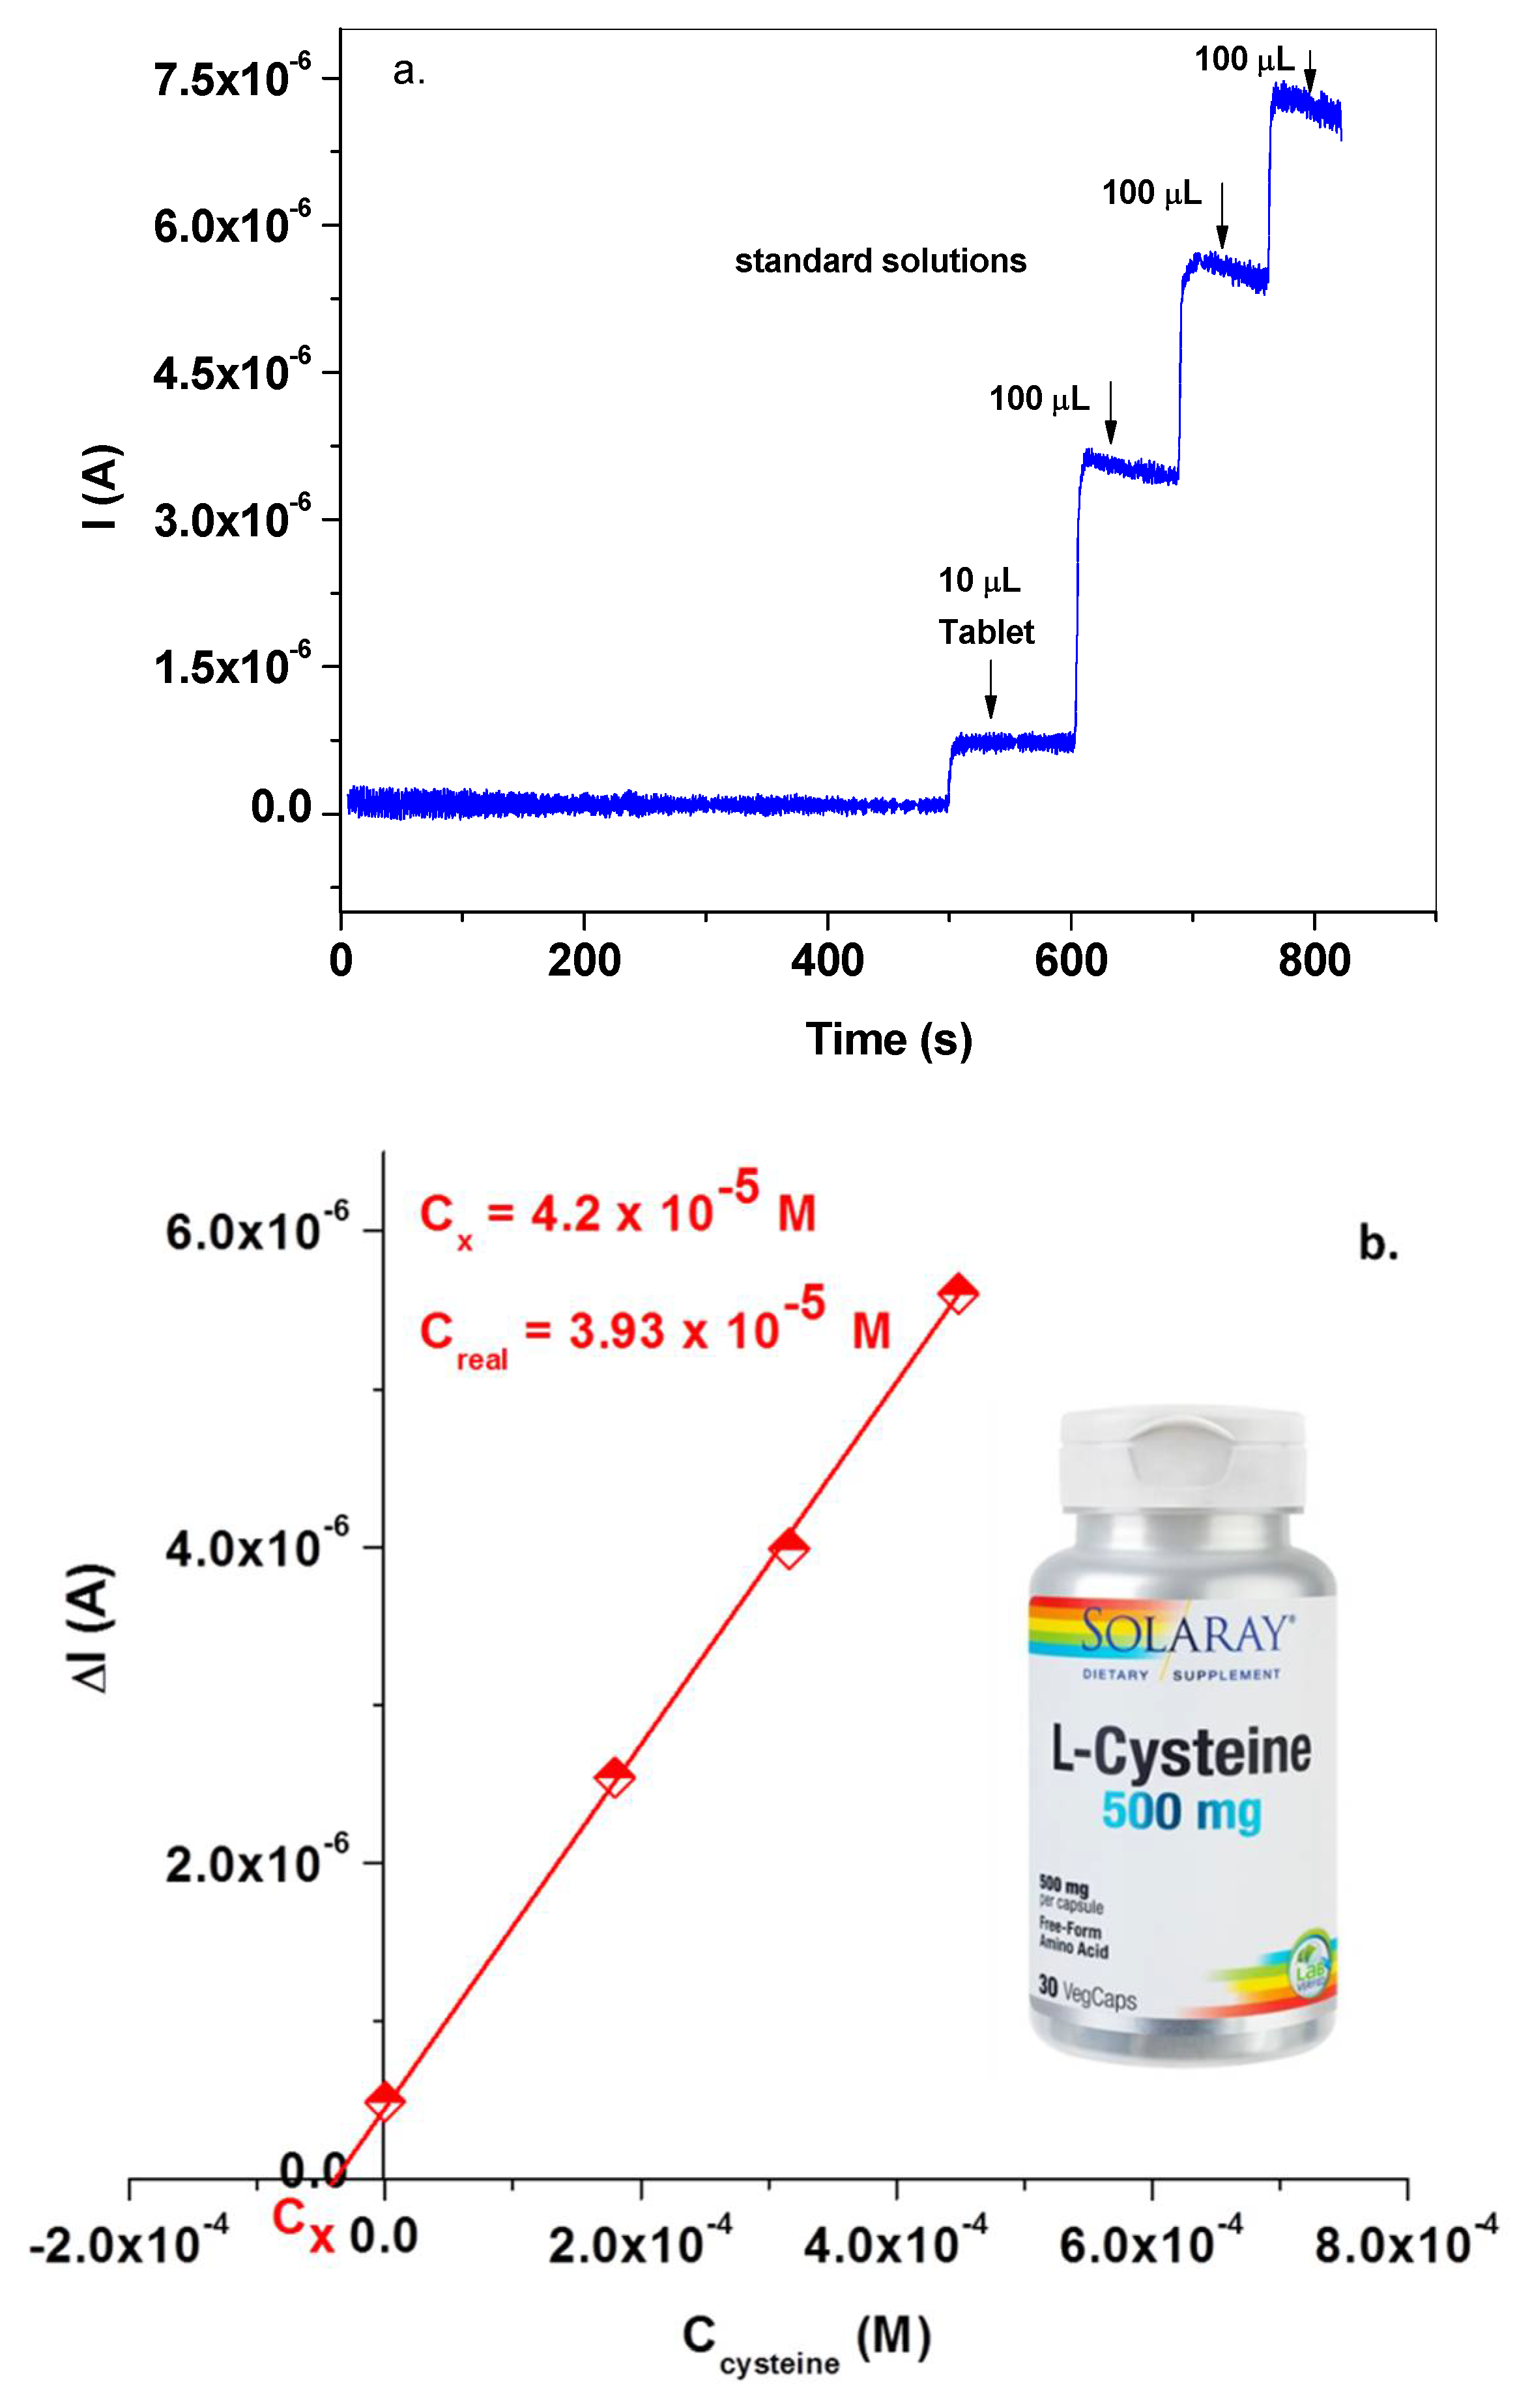
3.3. Electrochemical Detection of L-Cysteine

The electrochemical performances of bare and graphene-modified electrodes in L-cysteine detection were next tested. Figure 10 presents the CVs recorded with bare GC (green), GC/NSGr-120 (red), and GC/NSGr-200 (blue) electrodes in a solution containing 10−3 M L-cysteine (pH 6 PBS supporting electrolyte). There are marked differences between the three electrodes, in terms of both peak potential and peak current. In the case of the bare GC electrode, no oxidation peak was recorded, indicating that L-cysteine molecules cannot be easily oxidized on its surface. For GC/NSGr-120 (red) and GC/NSGr-200 (blue) electrodes, the corresponding CVs exhibit broad oxidation peaks at around +0.62 and +0.72 V, respectively, proving the electrocatalytic effect of NS-doped graphene. As expected, the effect is better in the case of NSGr-120 sample, which may be related to the considerably lower charge-transfer resistance. The inset shows the CVs recorded with each electrode in pH 6 PBS electrolyte.
Next, the amperometric technique was employed to further test the L-cysteine detection performance of the electrodes. Figure 11a shows the amperometric curves recorded with graphene-modified electrodes in pH 6 PBS after the addition of known concentrations of L-cysteine. The corresponding calibration plots obtained after the subtraction of the background signal are presented in Figure 11b (the mean value from three measurements). Between the measurements, each electrode was immersed in double-distilled water for 20 min and then cycled in pH 6 PBS (50 cycles; 50 mVs−1). It is interesting to mention that in the case of the GC/NSGr-200 electrode (blue), the plot significantly deviates from linearity above 4 × 10⁻⁴ M, and it exhibits the largest standard error. This proves a stronger interaction between the oxidized molecules and the graphene surface [41].
Based on the XPS results, the relative contents of the pyrrolic and pyridinic N components were equal in the NSGr-120 sample, while in NSGr-200, pyrrolic N was predominant (1.64 at% NPyrr. and only 0.23 at% Npyrid.) (see Table 1). Taking into account that GC/NSGr-120 is the electrode with the best electro-catalytic performance, we can conclude that the proper ratio between nitrogen atom types is necessary for obtaining high electrochemical performance for L-cysteine detection. Moreover, the deconvolution of S2p XPS high-resolution spectra of the analyzed samples shows that the chemical bonding identified for the NSGr-120 sample is C–S and C–S–C, while the chemical bonds of type C–S–C are no longer present for the NSGr-200 sample. For the NSGr-200 sample, chemical bonds of type S-O appear at the sample surface. Despite that, the synergistic effect between N and S in the samples needs to be further examined in order to obtain a deeper insight into the applicability of NSGr as active material in L-cysteine electrochemical detection.
The lowest limit of detection (LOD) was obtained for the GC/NSGr-120 electrode (3.03 × 10⁻⁸ M), followed by the GC/NSGr-200 electrode (1.2 × 10⁻⁷ M). The sensitivity and the linear range followed the same trend: for the GC/NSGr-120 electrode, y = 1.15 × 10⁻⁷ + 0.021 × C for the linear range of 1 × 10⁻⁷ to 4 × 10⁻⁴ M; for the GC/NSGr-200 electrode, y = 1.48 × 10⁻⁷ + 0.01 × C for the linear range of 4 × 10⁻⁷ to 4 × 10⁻⁴ M.
The electrode with the best electrocatalytic performances, GC/NSGr-120, was next tested for its ability to detect L-cysteine in a commercially available drug (500 mg L-cysteine/tablet; SOLARAY). The tablet also contained vegetal cellulose and organic extract from rice. To 6.99 mL of pH 6 PBS, a volume of 10 µL from the commercial tablet (1.82 × 10⁻⁴ M) was added, and then known concentrations of L-cysteine were added (three additions of 100 µL of 10−2 M L-cysteine; Figure 12a). The generated signals were recorded for each concentration by chronoamperometry, at a potential of +0.62 V. From the obtained calibration curve (Figure 12b), the L-cysteine concentration from the commercial tablet was found to be 4.2 × 10⁻⁵ M, giving a recovery of 106.8%.

4. Conclusions

In conclusion, the solvothermal approach was employed to synthesize nitrogen and sulfur co-doped graphene samples (NSGr). The morphology and structure of the samples prepared at different temperatures (120 or 200 °C) were characterized in detail. After that, two glassy carbon electrodes modified with the synthesized materials were electrochemically tested, and some important parameters such as the charge-transfer resistance (Rct) and the apparent heterogeneous electron transfer rate constant (Kapp) were determined from the EIS spectra. The values were calculated after fitting the Nyquist plots with the appropriate equivalent electrical circuit. The charge-transfer resistances of the bare and graphene-modified electrodes were determined to be 5.2 kΩ (GC/NSGr-120), 17.5 kΩ (GC/NSGr-200), and 12.5 kΩ (GC), indicating that the NSGr-120 graphene sample favored the transfer of electrons when attached to the electrode surface. Based on such information, the performance of the modified electrodes in the sensitive detection of L-cysteine was tested in laboratory solutions and in real samples.

Author Contributions

C.V. and F.P. recorded the electrochemical measurements and interpreted the results, A.C. investigated the morphological characteristics of the samples (SEM/TEM), C.L. recorded the XPS measurements, O.P. and T.R. recorded and interpreted the XPS results, B.C. recorded the Raman measurements, M.C. conducted the chemical synthesis of graphene sample and wrote the original draft, and R.I.S.-v.S. and S.-M.P. wrote and reviewed the final manuscript. All authors have read and agreed to the published version of the manuscript.

Funding

This work was supported by a grant from the Ministry of Research, Innovation and Digitization, CNCS/CCCDI—UEFISCDI, project number PN-III-P4-ID-PCCF-2016-0006, within PNCDI III.

Institutional Review Board Statement

Not applicable.

Informed Consent Statement

Not applicable.

Data Availability Statement

Data will be provided upon reasonable request to the corresponding authors.

Acknowledgments

The authors are grateful to Alexandru Turza for recording the XRD patterns of graphene samples.

Conflicts of Interest

The authors declare no conflict of interest.

References

  1. Bonifácio, V.D.B.; Pereira, S.A.; Serpa, J.; Vicente, J.B. Cysteine metabolic circuitries: Druggable targets in cancer. Br. J. Cancer 2021, 124, 862–879. [Google Scholar] [CrossRef]
  2. Paul, B.D.; Sbodio, J.I.; Snyder, S.H. Cysteine Metabolism in Neuronal Redox Homeostasis. Trends Pharmacol. Sci. 2018, 39, 513–524. [Google Scholar] [CrossRef]
  3. Cieslak, S.G.; Hutchinson, B.; Adhikari, R.; Steed, K.S.; Staudte, R.S.; Cox, P.; Rasch, A.; Black, E.; Araujo, A.; Wisco, J.J. The effects of L-Cysteine on Alzheimer’s disease pathology in APOE2, APOE3, and APOE4 homozygous mice. Brain Nerves 2020, 5, 1–9. [Google Scholar] [CrossRef]
  4. Rehman, T.; Asim, M.; Muhammad, S.; Faisal, M.; Nazir, M.; Liu, A.Z.; Ahmad, H.; Siddeeg, A.; Abid, M.; Muhammad, R. Cysteine and homocysteine as biomarker of various diseases. Food Sci. Nutr. 2020, 8, 4696–4707. [Google Scholar] [CrossRef]
  5. Głowacki, R.; Piechocka, J.; Borowczyk, K.; Information, R. A simple HPLC—UV method for simultaneous determination of cysteine and cysteinylglycine in biological fluids. Acta Chromatogr. 2016, 28, 333–346. [Google Scholar] [CrossRef] [Green Version]
  6. Tůma, P. Determination of amino acids by capillary and microchip electrophoresis with contactless conductivity detection—Theory, instrumentation and applications. Talanta 2021, 224, 121922. [Google Scholar] [CrossRef]
  7. Piechocka, J.; Wieczorek, M.; Głowacki, R. Gas Chromatography–Mass Spectrometry Based Approach for the Determination of Methionine-Related Sulfur-Containing Compounds in Human Saliva. Int. J. Mol. Sci. 2020, 21, 9252. [Google Scholar] [CrossRef]
  8. Zhou, M.; Ding, J.; Guo, L.P.; Shang, Q.K. Electrochemical behavior of L-cysteine and its detection at ordered mesoporous carbon-modified glassy carbon electrode. Anal. Chem. 2007, 79, 5328–5335. [Google Scholar] [CrossRef]
  9. Hsiao, Y.P.; Su, W.Y.; Cheng, J.R.; Cheng, S.H. Electrochemical determination of cysteine based on conducting polymers/gold nanoparticles hybrid nanocomposites. Electrochim. Acta 2011, 56, 6887–6895. [Google Scholar] [CrossRef]
  10. Heidari, M.; Ghaffarinejad, A. Electrochemical sensor for L-cysteine by using a cobalt(II)/aluminum(III) layered double hydroxide as a nanocatalyst. Microchim. Acta 2019, 186, 365. [Google Scholar] [CrossRef]
  11. Rasheed, P.A.; Pandey, R.P.; Jabbar, K.A.; Ponraj, J.; Mahmoud, K.A. Sensitive electrochemical detection of l-cysteine based on a highly stable Pd@Ti3C2T:X(MXene) nanocomposite modified glassy carbon electrode. Anal. Methods 2019, 11, 3851–3856. [Google Scholar] [CrossRef]
  12. Mazloum-Ardakani, M.; Alizadeh, Z. A certain electrochemical nanosensor based on functionalized multi-walled carbon nanotube for determination of cysteine in the presence of paracetamo. J. Nanostruct. 2020, 10, 258–267. [Google Scholar]
  13. Tajik, S.; Dourandish, Z.; Jahani, P.M.; Sheikhshoaie, I.; Beitollahi, H.; Asl, M.S.; Jang, H.W.; Shokouhimehr, M. Recent developments in voltammetric and amperometric sensors for cysteine detection. RSC Adv. 2021, 11, 5411–5425. [Google Scholar] [CrossRef]
  14. Zhang, Y.; Wan, Q.; Yang, N. Recent Advances of Porous Graphene: Synthesis, Functionalization, and Electrochemical Applications. Small 2019, 15, e1903780. [Google Scholar] [CrossRef]
  15. Kaushal, S.; Kaur, M.; Kaur, N.; Kumari, V.; Singh, P.P. Heteroatom-doped graphene as sensing materials: A mini review. RSC Adv. 2020, 10, 28608–28629. [Google Scholar] [CrossRef]
  16. Xi, J.; Zhang, Y.; Wang, Q.; Xiao, J.; Chi, K.; Duan, X.; Chen, J.; Tang, C.; Sun, Y.; Xiao, F.; et al. Multi-element doping design of high-efficient carbocatalyst for electrochemical sensing of cancer cells. Sens. Actuators B Chem. 2018, 273, 108–117. [Google Scholar] [CrossRef]
  17. Wang, X.; Wang, J.; Wang, D.; Dou, S.; Ma, Z.; Wu, J.; Tao, L.; Shen, A.; Ouyang, C.; Liu, Q.; et al. One-pot synthesis of nitrogen and sulfur co-doped graphene as efficient metal-free electrocatalysts for the oxygen reduction reaction. Chem. Commun. 2014, 50, 4839–4842. [Google Scholar] [CrossRef]
  18. Sibul, R.; Kibena-põldsepp, E.; Mäeorg, U.; Merisalu, M.; Kikas, A. Electrochemistry Communications Sulphur and nitrogen co-doped graphene-based electrocatalysts for oxygen reduction reaction in alkaline medium. Electrochem. Commun. 2019, 109, 106603. [Google Scholar] [CrossRef]
  19. Liu, Y.; Wang, Y.; Zheng, X.; Wang, Y. Synergistic effect of nitrogen and sulfur co-doped graphene as efficient metal-free counter electrode for dye-sensitized solar cells: A first-principle study. Comput. Mater. Sci. 2017, 136, 44–51. [Google Scholar] [CrossRef]
  20. Luo, Q.; Hao, F.; Wang, S.; Shen, H.; Zhao, L.; Li, J.; Grätzel, M.; Lin, H. Highly Efficient Metal-Free Sulfur-Doped and Nitrogen and Sulfur Dual-Doped Reduced Graphene Oxide Counter Electrodes for Dye-Sensitized Solar Cells. J. Phys. Chem. C 2014, 118, 17010–17018. [Google Scholar] [CrossRef]
  21. Wei, J.; Wang, Z.; Sun, Y.; Zhang, G.; Guan, D.; Nan, J. Electrochimica Acta The kinetics investigation of nitrogen/sulfur co-doped reduced anode for lithium-ion batteries and its application in full cells. Electrochim. Acta 2021, 375, 138026. [Google Scholar] [CrossRef]
  22. Tian, Y.; Ma, Y.; Liu, H.; Zhang, X.; Peng, W. One-step and rapid synthesis of nitrogen and sulfur co-doped graphene for hydrogen peroxide and glucose sensing. J. Electroanal. Chem. 2015, 742, 8–14. [Google Scholar] [CrossRef]
  23. Kumar, S.; Patra, S.; Madhuri, R.; Sharma, P.K. Dual doped graphene oxide for electrochemical sensing of europium ion. AIP Conf. Proc. 2017, 1832, 50068. [Google Scholar] [CrossRef]
  24. Zhu, W.; Gao, J.; Song, H.; Lin, X.; Zhang, S. Nature of the Synergistic Effect of N and S Co-Doped Graphene for the Enhanced Simultaneous Determination of Toxic Pollutants. ACS Appl. Mater. Interfaces 2019, 11, 44545–44555. [Google Scholar] [CrossRef]
  25. Xiao, L.; Yin, J.; Li, Y.; Yuan, Q.; Shen, H.; Hu, G.; Gan, W. Facile one-pot synthesis and application of nitrogen and sulfur-doped activated graphene in simultaneous electrochemical determination of hydroquinone and catechol. Analyst 2016, 141, 5555–5562. [Google Scholar] [CrossRef]
  26. Pogacean, F.; Socaci, C.; Pruneanu, S.M.; Biris, A.R.; Coros, M.; Magerusan, L.; Katona, G.; Turcu, R.; Borodi, G. Graphene based nanomaterials as chemical sensors for hydrogen peroxide—A comparison study of their intrinsic peroxidase catalytic behavior. Sensors Actuators B Chem. 2015, 213, 474–483. [Google Scholar] [CrossRef]
  27. Gu, W.; Sevilla, M.; Magasinski, A.; Fuertes, A.B.; Yushin, G. Sulfur-containing activated carbons with greatly reduced content of bottle neck pores for double-layer capacitors: A case study for pseudocapacitance detection. Energy Environ. Sci. 2013, 6, 2465–2476. [Google Scholar] [CrossRef] [Green Version]
  28. Fantauzzi, M.; Elsener, B.; Atzei, D.; Rigoldi, A.; Rossi, A. Exploiting XPS for the identification of sulfides and polysulfides. RSC Adv. 2015, 5, 75953–75963. [Google Scholar] [CrossRef]
  29. Luo, Z.; Lim, S.; Tian, Z.; Shang, J.; Lai, L.; Macdonald, B.J.; Fu, C.; Shen, Z.; Yu, T.; Lin, J. Pyridinic N doped graphene: Synthesis, electronic structure, and electrocatalytic property. J. Mater. Chem. 2011, 21, 8038–8044. [Google Scholar] [CrossRef]
  30. Sharma, R.; Chadha, N.; Saini, P. Determination of defect density, crystallite size and number of graphene layers in graphene analogues using X-ray diffraction and Raman spectroscopy. Indian J. Pure Appl. Phys. 2017, 55, 625–629. [Google Scholar]
  31. Coroş, M.; Pogăcean, F.; Roşu, M.-C.; Socaci, C.; Borodi, G.; Mageruşan, L.; Biriş, A.R.; Pruneanu, S. Simple and cost-effective synthesis of graphene by electrochemical exfoliation of graphite rods. RSC Adv. 2015, 6, 2651–2661. [Google Scholar] [CrossRef]
  32. Ferrari, A.C.; Basko, D.M. Raman spectroscopy as a versatile tool for studying the properties of graphene. Nat. Nanotechnol. 2013, 8, 235–246. [Google Scholar] [CrossRef] [Green Version]
  33. Cançado, L.G.; Takai, K.; Enoki, T.; Endo, M.; Kim, Y.A.; Mizusaki, H.; Jorio, A.; Coelho, L.N.; Magalhães-Paniago, R.; Pimenta, M.A. General equation for the determination of the crystallite size La of nanographite by Raman spectroscopy. Appl. Phys. Lett. 2006, 88, 163106. [Google Scholar] [CrossRef]
  34. Zhang, R.; Zhang, C.; Zheng, F.; Li, X.; Sun, C. Nitrogen and sulfur co-doped graphene nanoribbons: A novel metal- free catalyst for high performance electrochemical detection of 2, 4, 6-trinitrotoluene (TNT). Carbon 2018, 126, 328–337. [Google Scholar] [CrossRef]
  35. Chen, F.; Ma, L.; Ren, J.; Luo, X.; Liu, B.; Zhou, X. Sandwich-Type Nitrogen and Sulfur Co-doped Graphene-Backboned Porous Carbon Coated Separator for High Performance Lithium-Sulfur Batteries. Nanomaterials 2018, 8, 191. [Google Scholar] [CrossRef] [Green Version]
  36. Mannan, A.; Hirano, Y.; Quitain, A.T.; Koinuma, M.; Kida, T. Nitrogen, Sulfur Co-Doped Reduced Graphene Oxide: Synthesis and Characterization. Micro Nanosyst. 2020, 12, 129–134. [Google Scholar] [CrossRef]
  37. Deng, H.; Zhu, M.; Jin, T.; Cheng, C.; Zheng, J.; Qian, Y. One-step synthesis of nitrogen, sulphur-codoped graphene as electrode material for supercapacitor with excellent cycling stability. Int. J. Electrochem. Sci. 2020, 15, 16–25. [Google Scholar] [CrossRef]
  38. Liang, S.; Han, C.; Meng, Q.; Tian, G. Nitrogen and sulfur co-doped NaTi2(PO4)3/hole graphene composite as high-performance electrosorption electrodes for hybrid capacitive deionization. J. Mater. Sci. 2020, 55, 6017–6029. [Google Scholar] [CrossRef]
  39. Prathish, K.P.; Barsan, M.M.; Geng, D.; Sun, X.; Brett, C.M. Chemically modified graphene and nitrogen-doped graphene: Electrochemical characterisation and sensing applications. Electrochim. Acta 2013, 114, 533–542. [Google Scholar] [CrossRef]
  40. Nkosi, D.; Pillay, J.; Ozoemena, K.I.; Nouneh, K.; Oyama, M. Heterogeneous electron transfer kinetics and electrocatalytic behaviour of mixed self-assembled ferrocenes and SWCNT layers. Phys. Chem. Chem. Phys. 2010, 12, 604–613. [Google Scholar] [CrossRef] [Green Version]
  41. Chen, G.; Liu, Y.; Liu, Y.; Tian, Y.; Zhang, X. Nitrogen and sulfur dual-doped graphene for glucose biosensor application. J. Electroanal. Chem. 2015, 738, 100–107. [Google Scholar] [CrossRef]
Figure 1. SEM micrographs showing the morphological aspects of the two graphene samples: overview and detailed view of the NSGr-120 sample, indicating a more compact and a relatively uniform distribution of the graphene flakes (a,b); overview and detailed view of the NSGr-200 sample, indicating a laxer distribution, and larger flakes compared to the first sample (c,d).
Chemosensors 09 00146 g001
Figure 2. SEM/TEM micrographs showing the morphological aspects of isolated graphene flakes: NSGr-120 (a,b); NSGr-200 (c,d).
Chemosensors 09 00146 g002
Figure 3. High-resolution XPS spectra of C1s and S2p with the corresponding deconvolution components for the investigated samples.
Chemosensors 09 00146 g003
Figure 4. High-resolution XPS spectra of N1s lines of the investigated samples.
Chemosensors 09 00146 g004
Figure 5. XRD pattern and structural parameters of NSGr-120 sample (a) and NSGr-200 sample (b); Inset in (b): the diffraction pattern of GO.
Chemosensors 09 00146 g005
Figure 6. Raman spectrum of GO (a) and nitrogen and sulfur co-doped graphene samples: NSGr-120 (b); NSGr-200 (c).
Chemosensors 09 00146 g006
Figure 7. FTIR spectra of GO (black), NSGr-120 (blue), and NSGr-200 (red).
Chemosensors 09 00146 g007
Figure 8. Cyclic voltammograms recorded with bare GC (green), GC/NSGr-200 (blue), and GC/NSGr-120 (red) electrodes. Electrolyte: 1 mM K4[Fe(CN)6] + 0.2 M KCl; scan rate: 10 mVs−1.
Chemosensors 09 00146 g008
Figure 9. Equivalent electrical circuits employed to fit the EIS data (a); Nyquist plots obtained for bare GC (green), GC/NSGr-200 (blue), and GC/NSGr-120 (red) electrodes in solution containing 1.0 mM K4[Fe(CN)6] + 0.2 M KCl; applied potential: +0.3 V (b).
Chemosensors 09 00146 g009aChemosensors 09 00146 g009b
Figure 10. Cyclic voltammograms recorded with bare GC (green), GC/NSGr-120 (red), and GC/NSGr-200 (blue) in solution containing 10−3 M L-cysteine (pH 6 PBS supporting electrolyte). The inset shows the CVs recorded with each electrode in pH 6 PBS electrolyte.
Chemosensors 09 00146 g010
Figure 11. Amperometric curves recorded with GC/NSGr-120 (red) and GC/NSGr-200 (blue) electrodes in pH 6 PBS supporting electrolyte, after the addition of known concentrations of L-cysteine (a). The corresponding calibration plots showing mean value from 3 measurements: GC/NSGr-120 (red); GC/NSGr-200 (blue) (b).
Chemosensors 09 00146 g011
Figure 12. The amperogram recorded during standard addition experiment at a potential of +0.62 V (a); standard addition plot obtained from the amperogram (b).
Chemosensors 09 00146 g012
Table 1. The sample compositions as determined by XPS.
SampleCsp2/C(sp2 + sp3)
(at. %)
Npyrr.
(at.%)
Npyrid.
(at.%)
–N–H2 (at.%)Reduced –N–H2
(at. %)
S–C
(at.%)
S–O
(at.%)
C–S–C
(at.%)
NSGr-12075.91220.81.479.35-2.35
NSGr-20075.491.640.230.430.222.80.2-
Table 2. Structural parameters obtained from the Raman bands of GO, NSGr-120, and NSGr-200 samples.
SampleG (cm−1)D (cm−1)2D (cm−1)D + D’ (cm−1)ID/IGLa (nm)
GO16001356-29330.87721.66
NSGr-12015921354269229361.22715.48
NSGr-20015861342268029361.19615.88
Table 3. The infrared bands of GO, NSGr-120, and NSGr-200 samples.
Group Frequency (cm−1)Peak Position (cm−1)
GO
Peak Position (cm−1)
NSGr-120
Peak Position (cm−1)
NSGr-200
O–H stretching, 3550–3200 (broad, s)342334483438
C=O stretching, 1750–1680 (s)1726--
C–O stretching, 1150–1085 (s)105910811115
C=N, 1690–1640 (m), or
C=C stretching, 1680–1600 (m)
162616391639
C–S stretching, 710–570 (w)-624621
Table 4. Comparison with other graphene samples obtained by hydrothermal synthesis.
GO: Dopant (Weight)Temperature (°C)Reaction Time (h)N, S at%Ref.
1:4180121.99 N
0.48 S
[34]
1:1.75180121.86 N
5.26 S
[35]
1:125023.52 N
7.59 S
[36]
1:10150overnight-[37]
1:1, 1:3, 1:518012-[38]
1:112034.8 N
9.35 S
This work
2002.3 N
2.8 S
Table 5. The electrochemical parameters of GC, GC/NSGr-200, and GC/NSGr-120 electrodes determined from cyclic voltammetry (10 mVs−1 scan rate). Electrolyte: 1 mM K4[Fe(CN)6] + 0.2 M KCl.
ElectrodeΔEp
(mV)
Ipa/IpcA
(cm2)
E0′
(V)
Rct
(kΩ)
Kapp
(cm/s)
GC1301.060.0250.24512.57.6 × 10−4
GC/NSGr-120801.00.0550.245.29.3 × 10−4
GC/NSGr-200800.970.0370.2417.54.1 × 10−4
Publisher’s Note: MDPI stays neutral with regard to jurisdictional claims in published maps and institutional affiliations.

