Review

Plasmonic Biosensors for the Detection of Lung Cancer Biomarkers: A Review

1
Department of Physics, Al-Qalam University Katsina, Katsina PMB 2137, Nigeria
2
Department of Fundamental and Applied Sciences, Universiti Teknologi PETRONAS, Seri Iskandar 32610, Perak, Malaysia
3
Department of Physics, College of Science, Imam Mohammad Ibn Saud Islamic University (IMSIU), Riyadh 13318, Saudi Arabia
4
Department of Chemistry, Al-Qalam University Katsina, Katsina PMB 2137, Nigeria
5
Material Processing and Technology Laboratory, Institute of Advanced Technology, Universiti Putra Malaysia, Seri Kembangan 43400, Selangor, Malaysia
6
PhD School in Nanotechnology, University of Trieste, Piazzale Europa, 1, 34127 Trieste, Italy
7
ImViA EA 7535, Team IFTIM, Université de Bourgogne, 21000 Dijon, France
*
Authors to whom correspondence should be addressed.
Chemosensors 2021, 9(11), 326; https://doi.org/10.3390/chemosensors9110326
Submission received: 5 October 2021 / Revised: 5 November 2021 / Accepted: 15 November 2021 / Published: 21 November 2021

Abstract

:
Lung cancer is the most common and deadliest cancer type globally. Its early diagnosis can guarantee a five-year survival rate. Unfortunately, application of the available diagnosis methods such as computed tomography, chest radiograph, magnetic resonance imaging (MRI), ultrasound, low-dose CT scan, bone scans, positron emission tomography (PET), and biopsy is hindered due to one or more problems, such as phenotypic properties of tumours that prevent early detection, invasiveness, expensiveness, and time consumption. Detection of lung cancer biomarkers using a biosensor is reported to solve the problems. Among biosensors, optical biosensors attract greater attention due to being ultra-sensitive, free from electromagnetic interference, capable of wide dynamic range detection, free from the requirement of a reference electrode, free from electrical hazards, highly stable, capable of multiplexing detection, and having the potential for more information content than electrical transducers. Inspired by promising features of plasmonic sensors, including surface plasmon resonance (SPR), localised surface plasmon resonance (LSPR), and surface enhanced Raman scattering (SERS) such as ultra-sensitivity, single particle/molecular level detection capability, multiplexing capability, photostability, real-time measurement, label-free measurement, room temperature operation, naked-eye readability, and the ease of miniaturisation without sophisticated sensor chip fabrication and instrumentation, numerous plasmonic sensors for the detection of lung cancer biomarkers have been investigated. In this review, the principle plasmonic sensor is explained. In addition, novel strategies and modifications adopted for the detection of lung cancer biomarkers such as miRNA, carcinoembryonic antigen (CEA), cytokeratins, and volatile organic compounds (VOCs) using plasmonic sensors are also reported. Furthermore, the challenges and prospects of the plasmonic biosensors for the detection of lung cancer biomarkers are highlighted.

1. Introduction

Lung cancer is the major cause of death among all cancer types globally [1,2]. The American College of Chest Physicians has described lung cancer as the most frequently diagnosed cancer globally. The second is breast cancer, and colorectal cancer is the third. It has been projected that global incidence of lung cancer will reach 2.89 million by 2030, about a 38% increase compared to 2018 [1].
Smoking tobacco products is considered the main cause of cancer [3,4]. Other causes of cancer are exposure to environmental and chemical pollutants and other carcinogenic substances from industries [4].
Lung cancer can either be a small-cell lung carcinoma (SCLC) or a non-small-cell lung carcinoma (NSCLC); the later accounts for more than 80% of cases [5]. Normally, NSCLC progresses from stage I to stage IV. The stage of the NSCLC at the time of diagnosis plays a vital role in its prognosis. For example, lung cancer tumours at stage I can be removed by surgery and thereby guarantee a five-year survival rate in about 75% of cases [5,6]. Therefore, sensitive and reliable tools are required for confirming the presence of lung cancer in its early stage.
Conventionally, lung cancer is detected/diagnosed using imaging techniques such as computed tomography, chest radiography, magnetic resonance imaging (MRI), ultrasound, low-dose CT scan, bone scans, positron emission tomography (PET), or through another method called biopsy [5,7]. However, the reliance of these methods on the phenotypic properties of tumours prevents them from detecting cancer at early stages [5]. This is in addition to being expensive and the radiation effects associated with most of these techniques [7,8]. Table 1 summarises the main disadvantages of the conventional methods for lung cancer screening, monitoring, and diagnosis.
Fortunately, different cancer biomarkers are present in cancerous cells and by extension in the body fluid at the initial stages of the cancer [5]. The levels of these biomarkers associated with certain cancers can reflect cancer occurrence. As such, biomarkers in body fluids such as plasma, urine, saliva, sputum, and tears can provide a convenient, noninvasive, and inexpensive method for lung cancer screening and diagnosis [5]. The WHO has defined biomarkers as any substance, structure, or process that can be measured in the body or its products and influences or predicts the incidence of outcome or disease [10].
Due to the limitations of the conventional methods, the biomarker-based detection of lung cancer has attracted significant attention. This is reliably achieved using biosensors in a non-invasive, real-time, sensitive, specific, stable, and cheap manner [5]. Biosensors are chemical sensors that utilise biochemical mechanisms in their recognition system. The IUPAC defines chemical sensors as devices that transform chemical information, ranging from the concentration of a specific sample component to total composition analysis, into an analytically useful signal [5,11].
Table 2 depicts a summary of the important lung cancer biomarkers based on DNA/genetic and protein-based classifications. On the other hand, another set of lung cancer biomarkers based on the volatile organic compound (VOC) present in human exhaled breath have also been explored and reviewed recently. Lung cancer VOC biomarkers provide an avenue for simpler and faster screening of lung cancer in a non-invasive and real-time manner [7,10]. A summary of the potential lung cancer VOC biomarkers is shown in Table 3.
Recently, progress and advances in electrochemical biosensors for the detection of lung cancer biomarkers have been reviewed extensively [16]. In addition, other types of biosensors such as piezoelectric and optical biosensors have been reported [8,17]. Unfortunately, specific reviews on any of these two types of biosensors for the detection of lung cancer biomarkers are lacking.
Generally, optical biosensors are given preference owing to their superior features, such as greater sensitivity, electrical passiveness, freedom from electromagnetic interference, possession of a wide dynamic range, needlessness of reference electrodes, freedom from electrical hazards, high stability, potential for more information content than electrical transducers, and multiplexing capabilities [18,19,20,21,22,23,24,25]. The development of conventional optics is hindered due to their inability to resolve nanometre-scale structures because of the diffraction limit. This is because of the evanescent waves carrying the sub-wavelength information decay before image formation when passed through a medium of different permittivity [26,27]. The development in the field of plasmonics has enabled the detection of sub-wavelength features by balancing the evanescent loss and restoring the image below the diffraction limit [26]. Plasmonic biosensors, including surface plasmon resonance (SPR), localised surface plasmon resonance (LSPR), and surface enhanced Raman scattering (SERS) biosensors, are becoming powerful bio-sensing techniques due to their multiplexing capability, photostability, naked-eye reading, and the ease of miniaturisation without complex sensor-chip fabrication and instrumentation [28]. The SPR technique is based on the interaction of electromagnetic waves with a planar metallic substrate (thin film), whereas LSPR arose due to the interaction of electromagnetic waves with discrete metallic nanoparticles with dimensions smaller than the incident wavelength [17,29]. Another nanoparticle-based technique, SERS, employs the huge production of an electric field at the resonance condition for its sensing application [34]. These techniques feature label-free measurement capability, which, in addition to its better resolution, allows for rapid and ultra-sensitive detection of lung cancer biomarkers using simpler detection processes and cheaper designs compared to labelled measurements [31,32,33]. Recently, plasmonic sensors have demonstrated excellent performance for the detection of COVID-19 and other viruses [34,35,36].
In this review, the basic principles and types of plasmonic biosensors are discussed, and the recent contributions in the field of plasmonic biosensors for the detection of various lung cancer biomarkers are presented. Finally, recent challenges and additional opportunities for developing effective plasmonic biosensors for early screening, monitoring, and diagnosis of lung cancer are discussed.

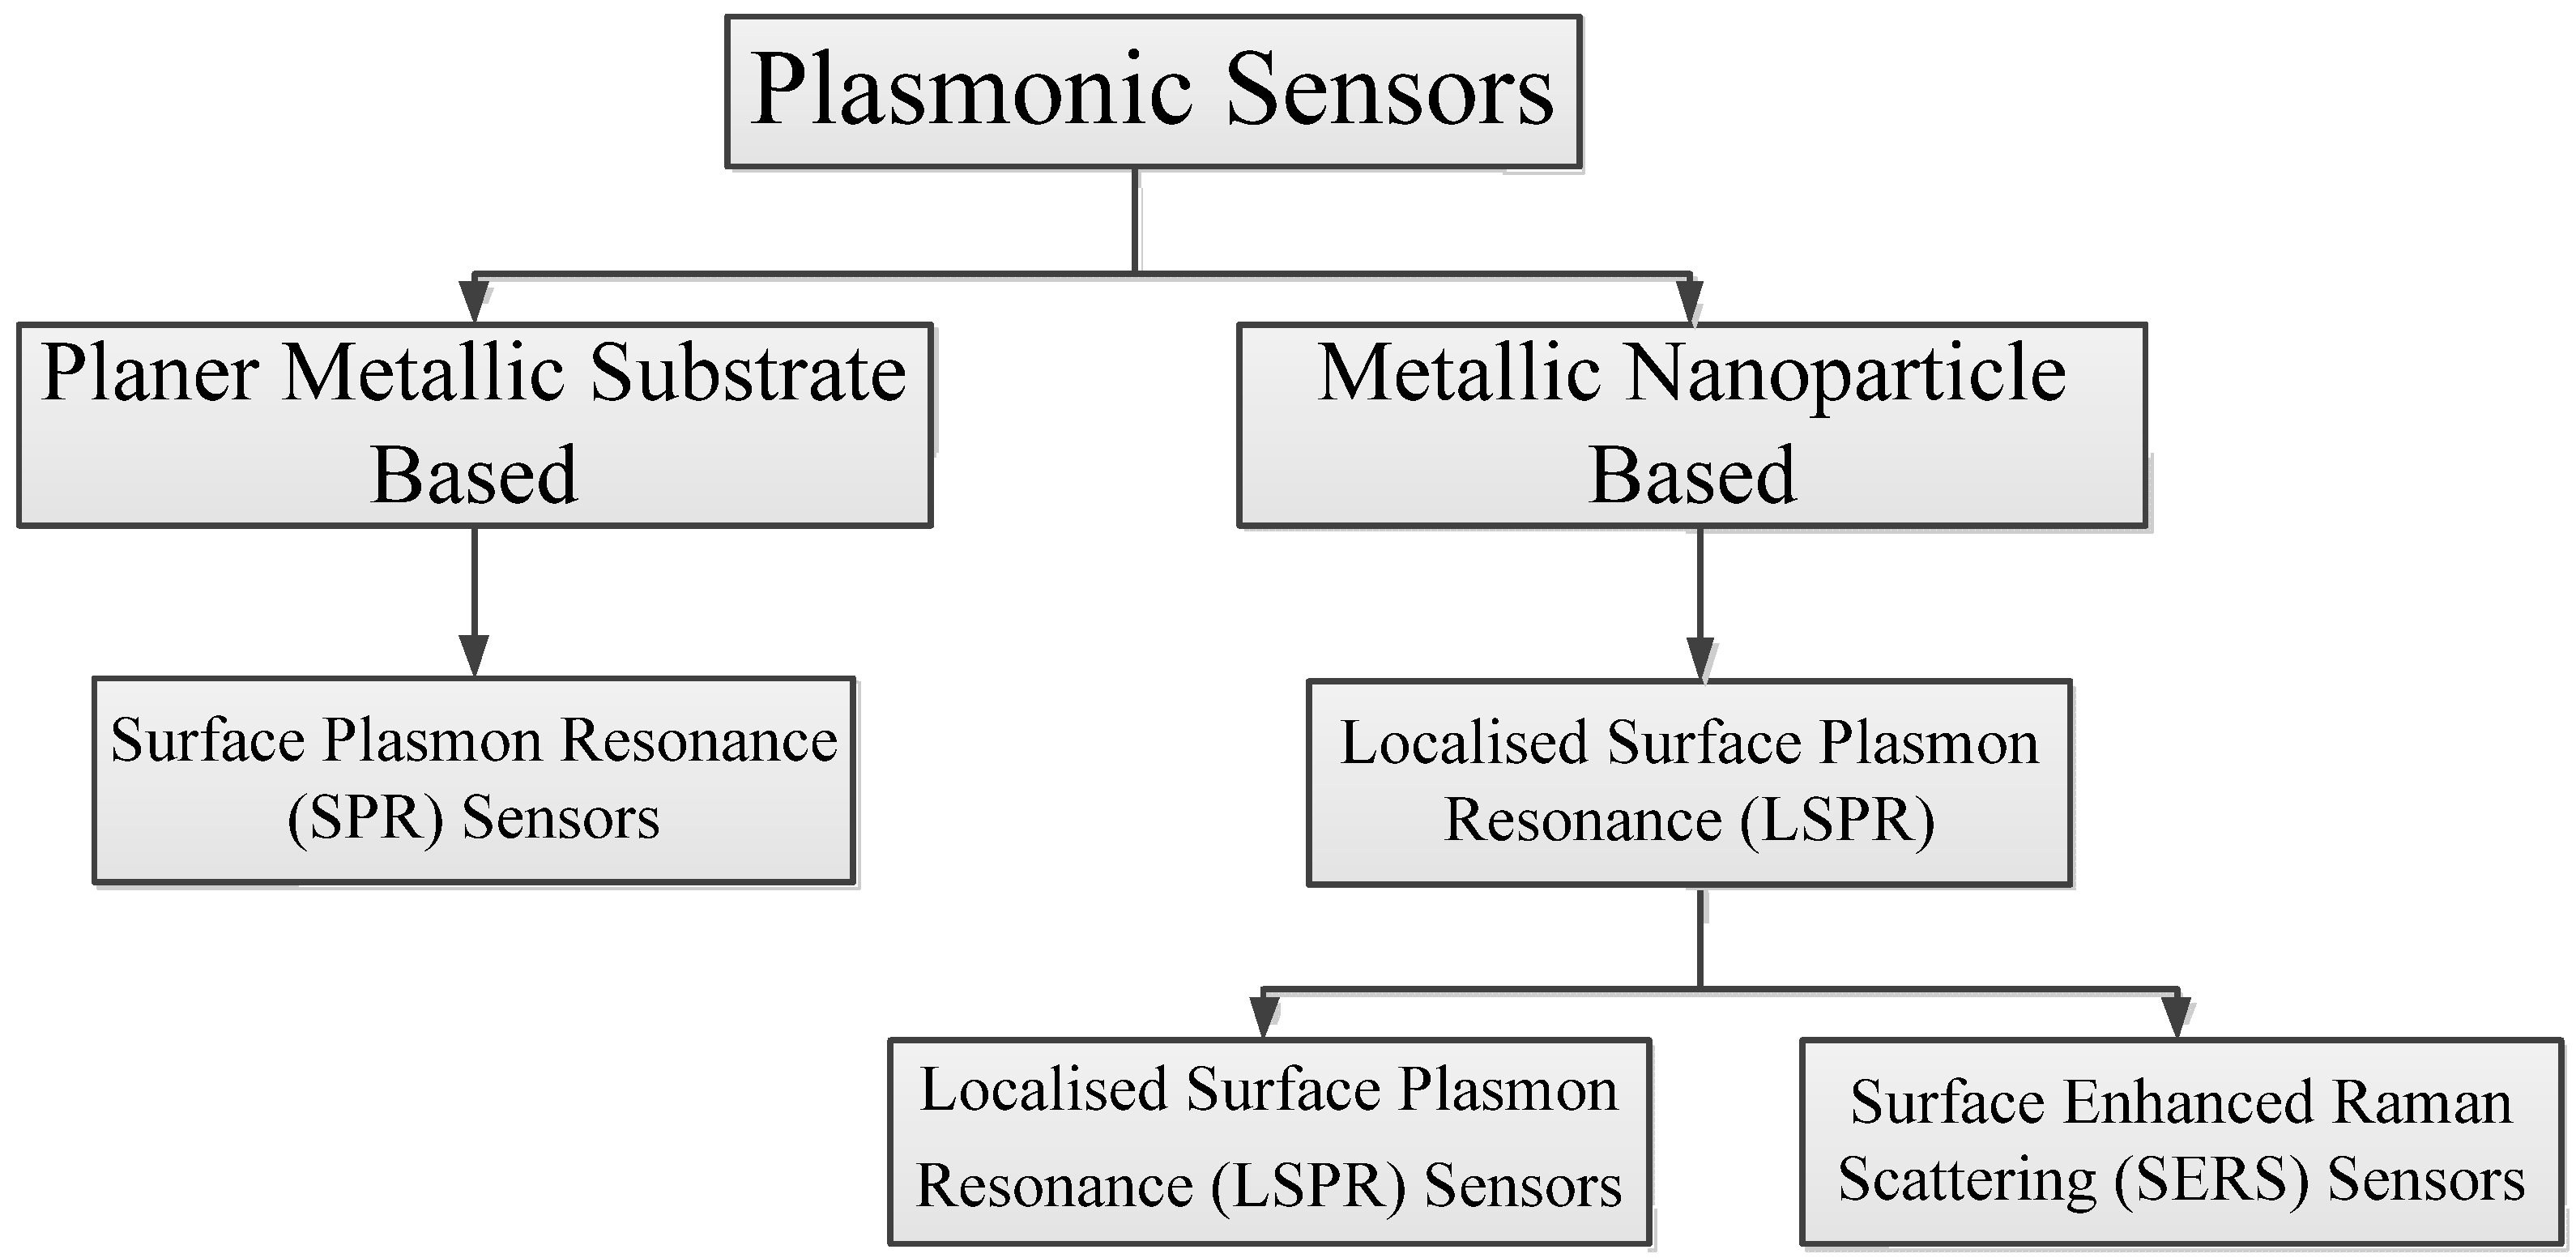
2. Principles of Plasmonic Sensing

Surface plasmon resonance and localised surface plasmon resonance are the two main approaches employed in plasmonic sensing. Surface enhanced Raman scattering-based sensors are explained based on the localised surface plasmon resonance phenomenon. This section is dedicated to the description of measurement principles and the general design of the sensing platform of each approach. Figure 1 shows the classification of the plasmonic sensors. SPR sensors are widely accepted for their simplicity and excellent refractive index sensitivity compared to LSPR sensors. However, LSPR sensors are cheaper, more compact, less sensitive to bulk refractive index alterations, less prone to mechanical noise and temperature drift, and more user friendly compared to SPR sensors [34,37].
Despite the promising advantages of LSPR sensors, SERS sensors are preferred when it comes to the detection of low molecular weight and low-concentration analytes, including gaseous molecules, due to their numerous advantages, such as high selectivity due to their unique fingerprint feature, simple preparation of the sample, single molecular detection capability, multiplex sensing capability, high throughput, and POC potentiality [34,38,39].

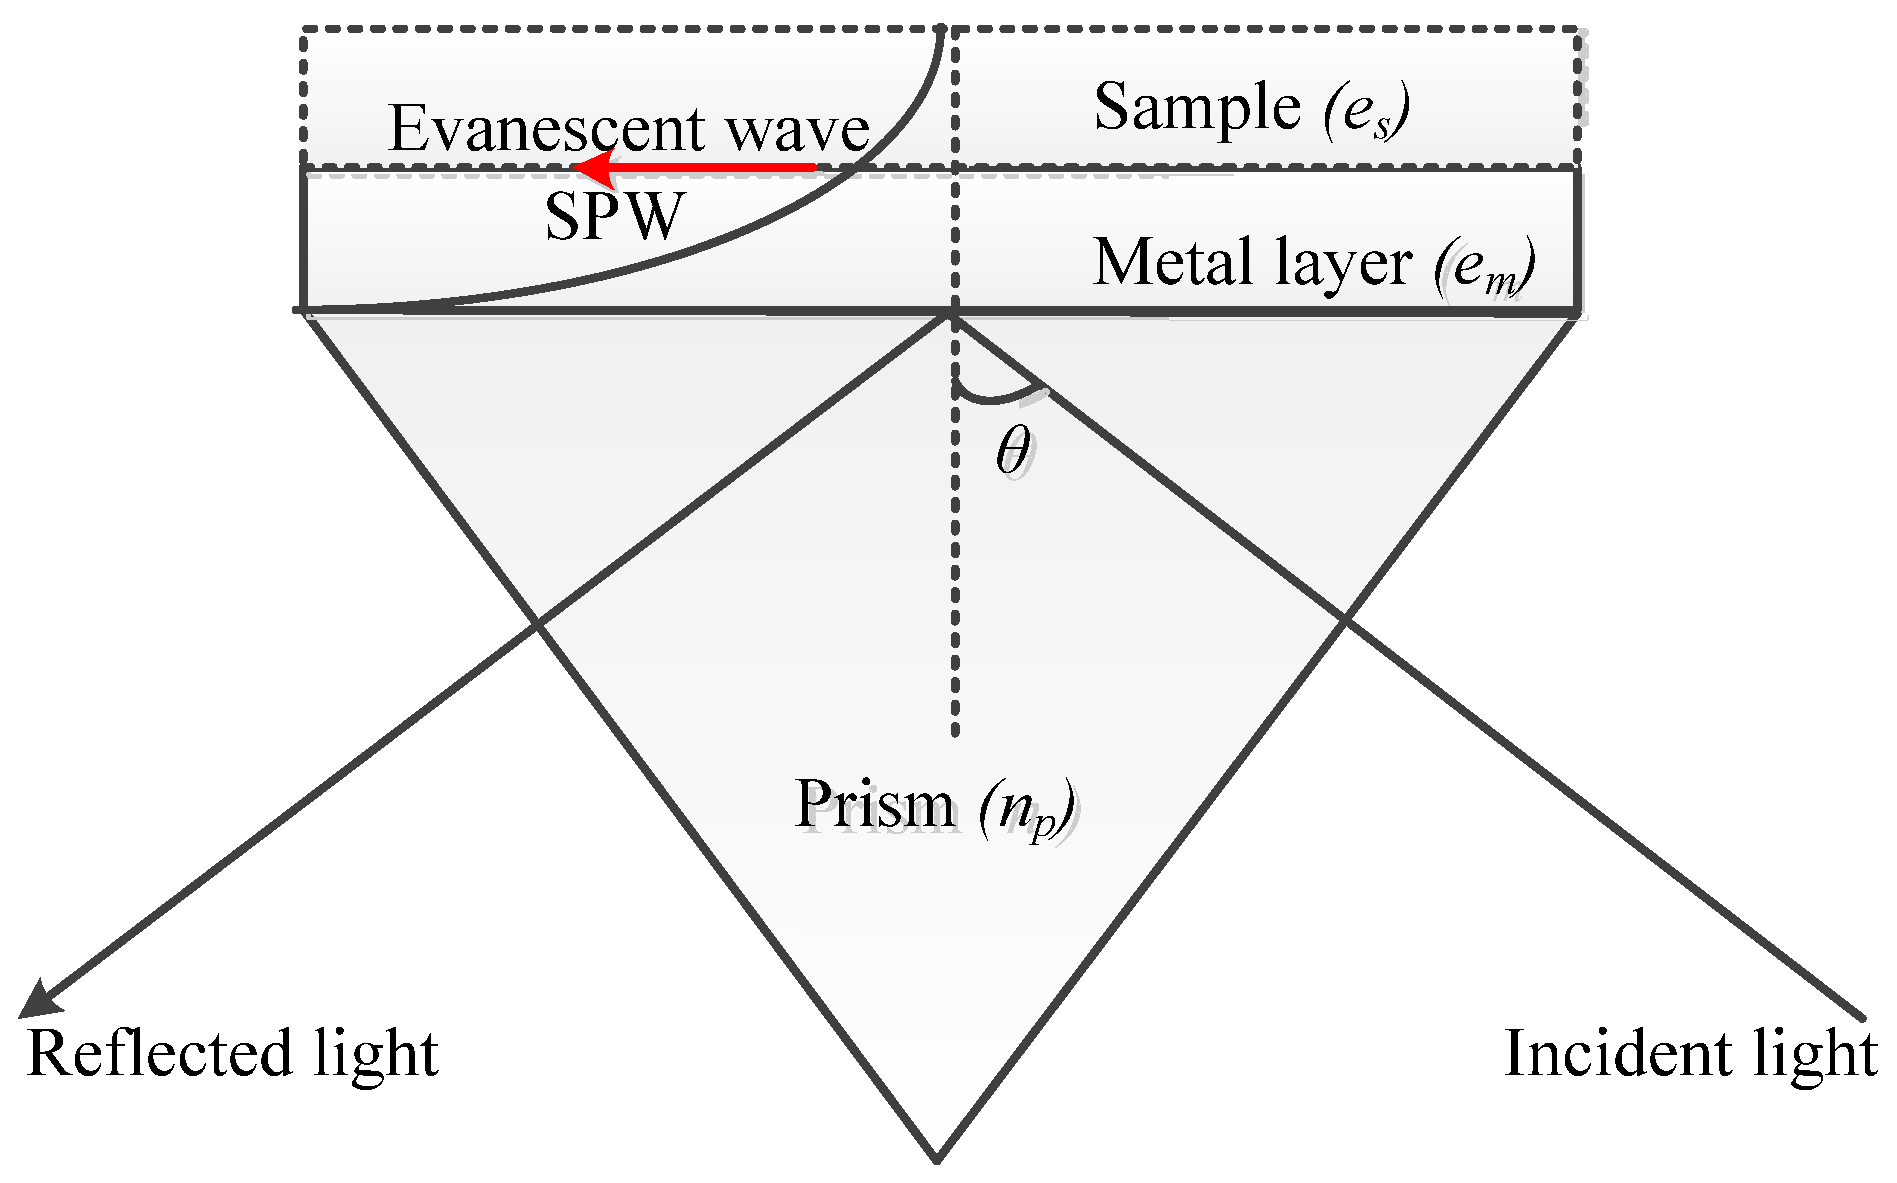
2.1. Surface Plasmon Resonance (SPR)

Supposing that electromagnetic waves (light waves), illustrated in Figure 2 and mathematically described by an electric field E in Equation (1) [44], travel from a higher refractive index (n1) medium 1 to a lower refractive index (n2) medium 2, the total internal reflection (TIR) takes place within medium 1 as long as the incident angle of the wave is greater than the critical angle [22,40,41].
This leads to the formation of evanescent waves in the lower refractive index medium 2 under the condition of TIR. This is mathematically denoted by another electric field E2 as shown in Equation (2) [40].
E = E 0 e x p ( j ω t j k . r ) = E 0 e x p ( j ω t j k x x j k y y j k z z )
where E0 is the amplitude of the electric field, ω is the angular frequency, k is the wavevector, and r = (x,y,z) is the position vector.
E 2 = E 0 e k y 2 y e x p ( j ω t j k x x )
The amplitude of the evanescent waves decays exponentially along the y-direction with a characteristic distance 1/ky2 (exponentially with the distance to the interface of media 1 and 2 [40]. If one of these two media is a dielectric (with a positive dielectric constant) and the other is a metal (with a negative dielectric constant), these evanescent waves are called surface plasmon waves or surface plasmon oscillations. Surface plasmon resonance (SPR) refers to the excitation of the surface plasmon at the interface of the two media. In a dielectric medium, the surface plasmon waves have a greater propagation constant than light waves and, as such, direct light cannot be used for the excitation. However, since the surface plasmons are TM polarised (plane polarised), they can be excited by p-polarised light (TM mode) [22]. At the resonant state, the wave vector of excitation light along the metal–dielectric interface is equal to the wave vector of the surface plasmon wave and is called the resonance condition.
The resonant excitation of the surface plasmons is observed as the minimum of the intensity of the reflected light at a certain incidence angle, which is known as the resonance angle of SPR. The position of the SPR angle (angular interrogation) or SPR wavelength (spectral interrogation) depends on the optical properties of the metal, the dielectric medium, and any adsorbate on the metal. This dependency is exploited in SPR biosensing [42].

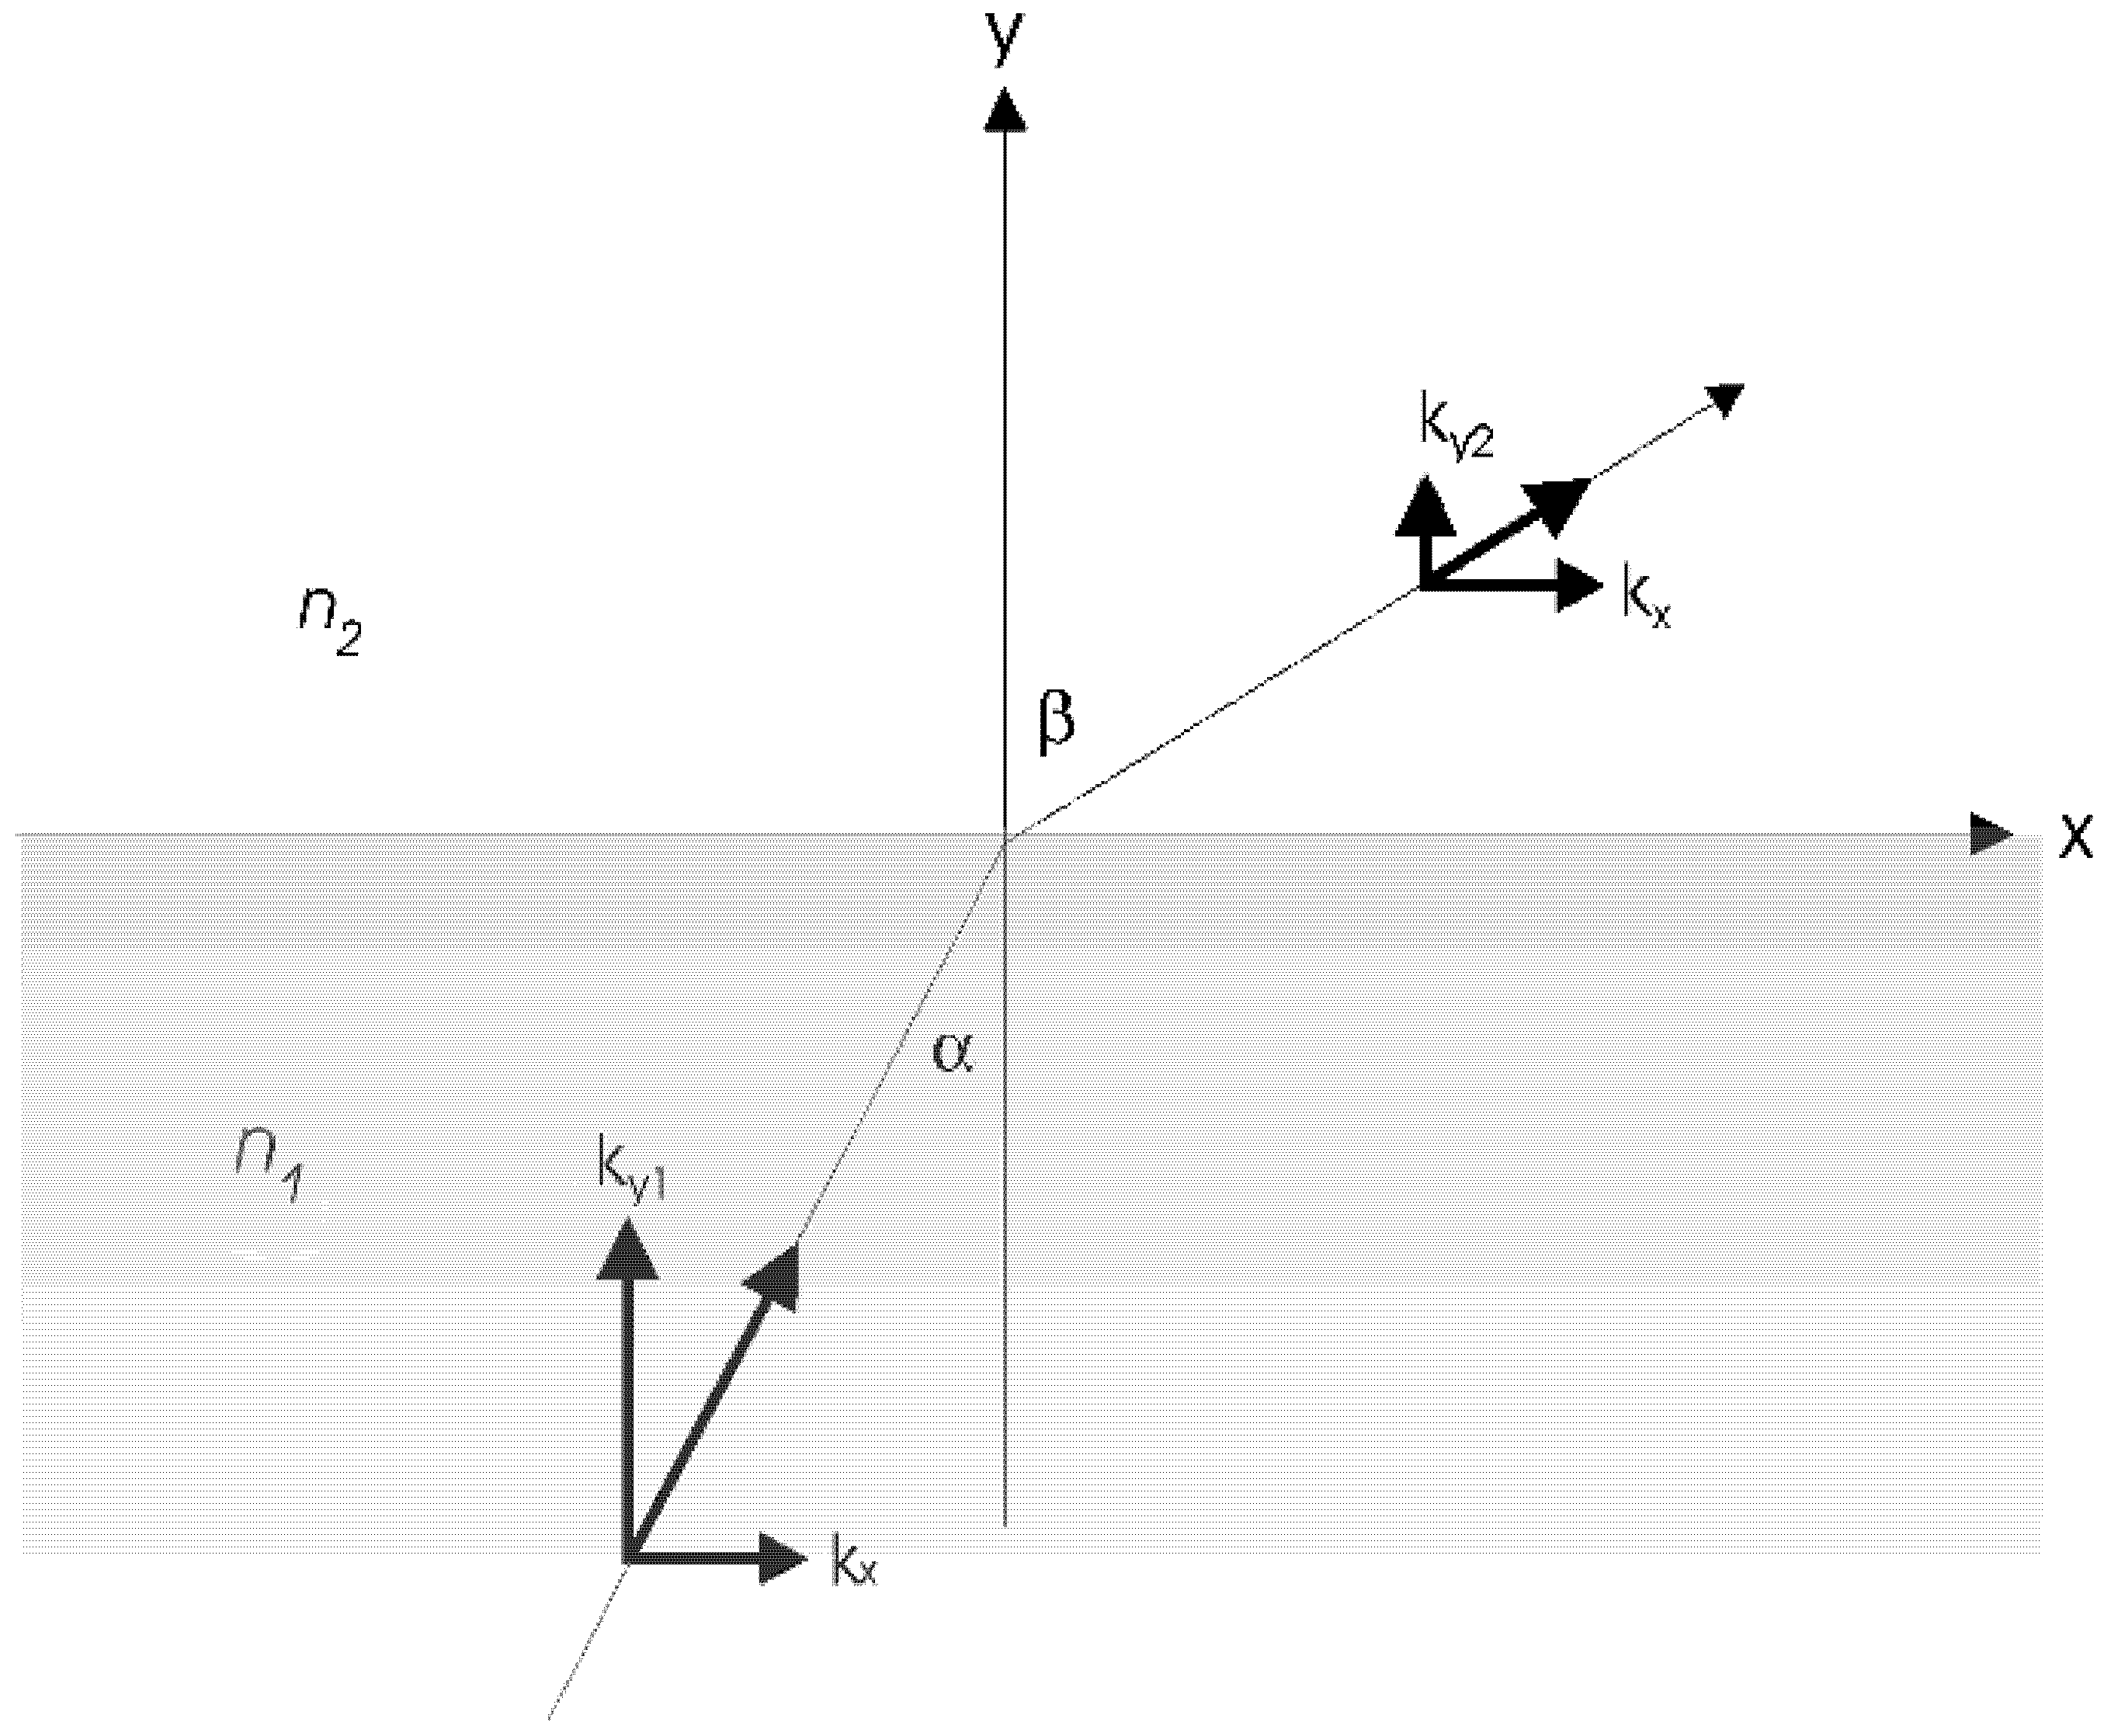
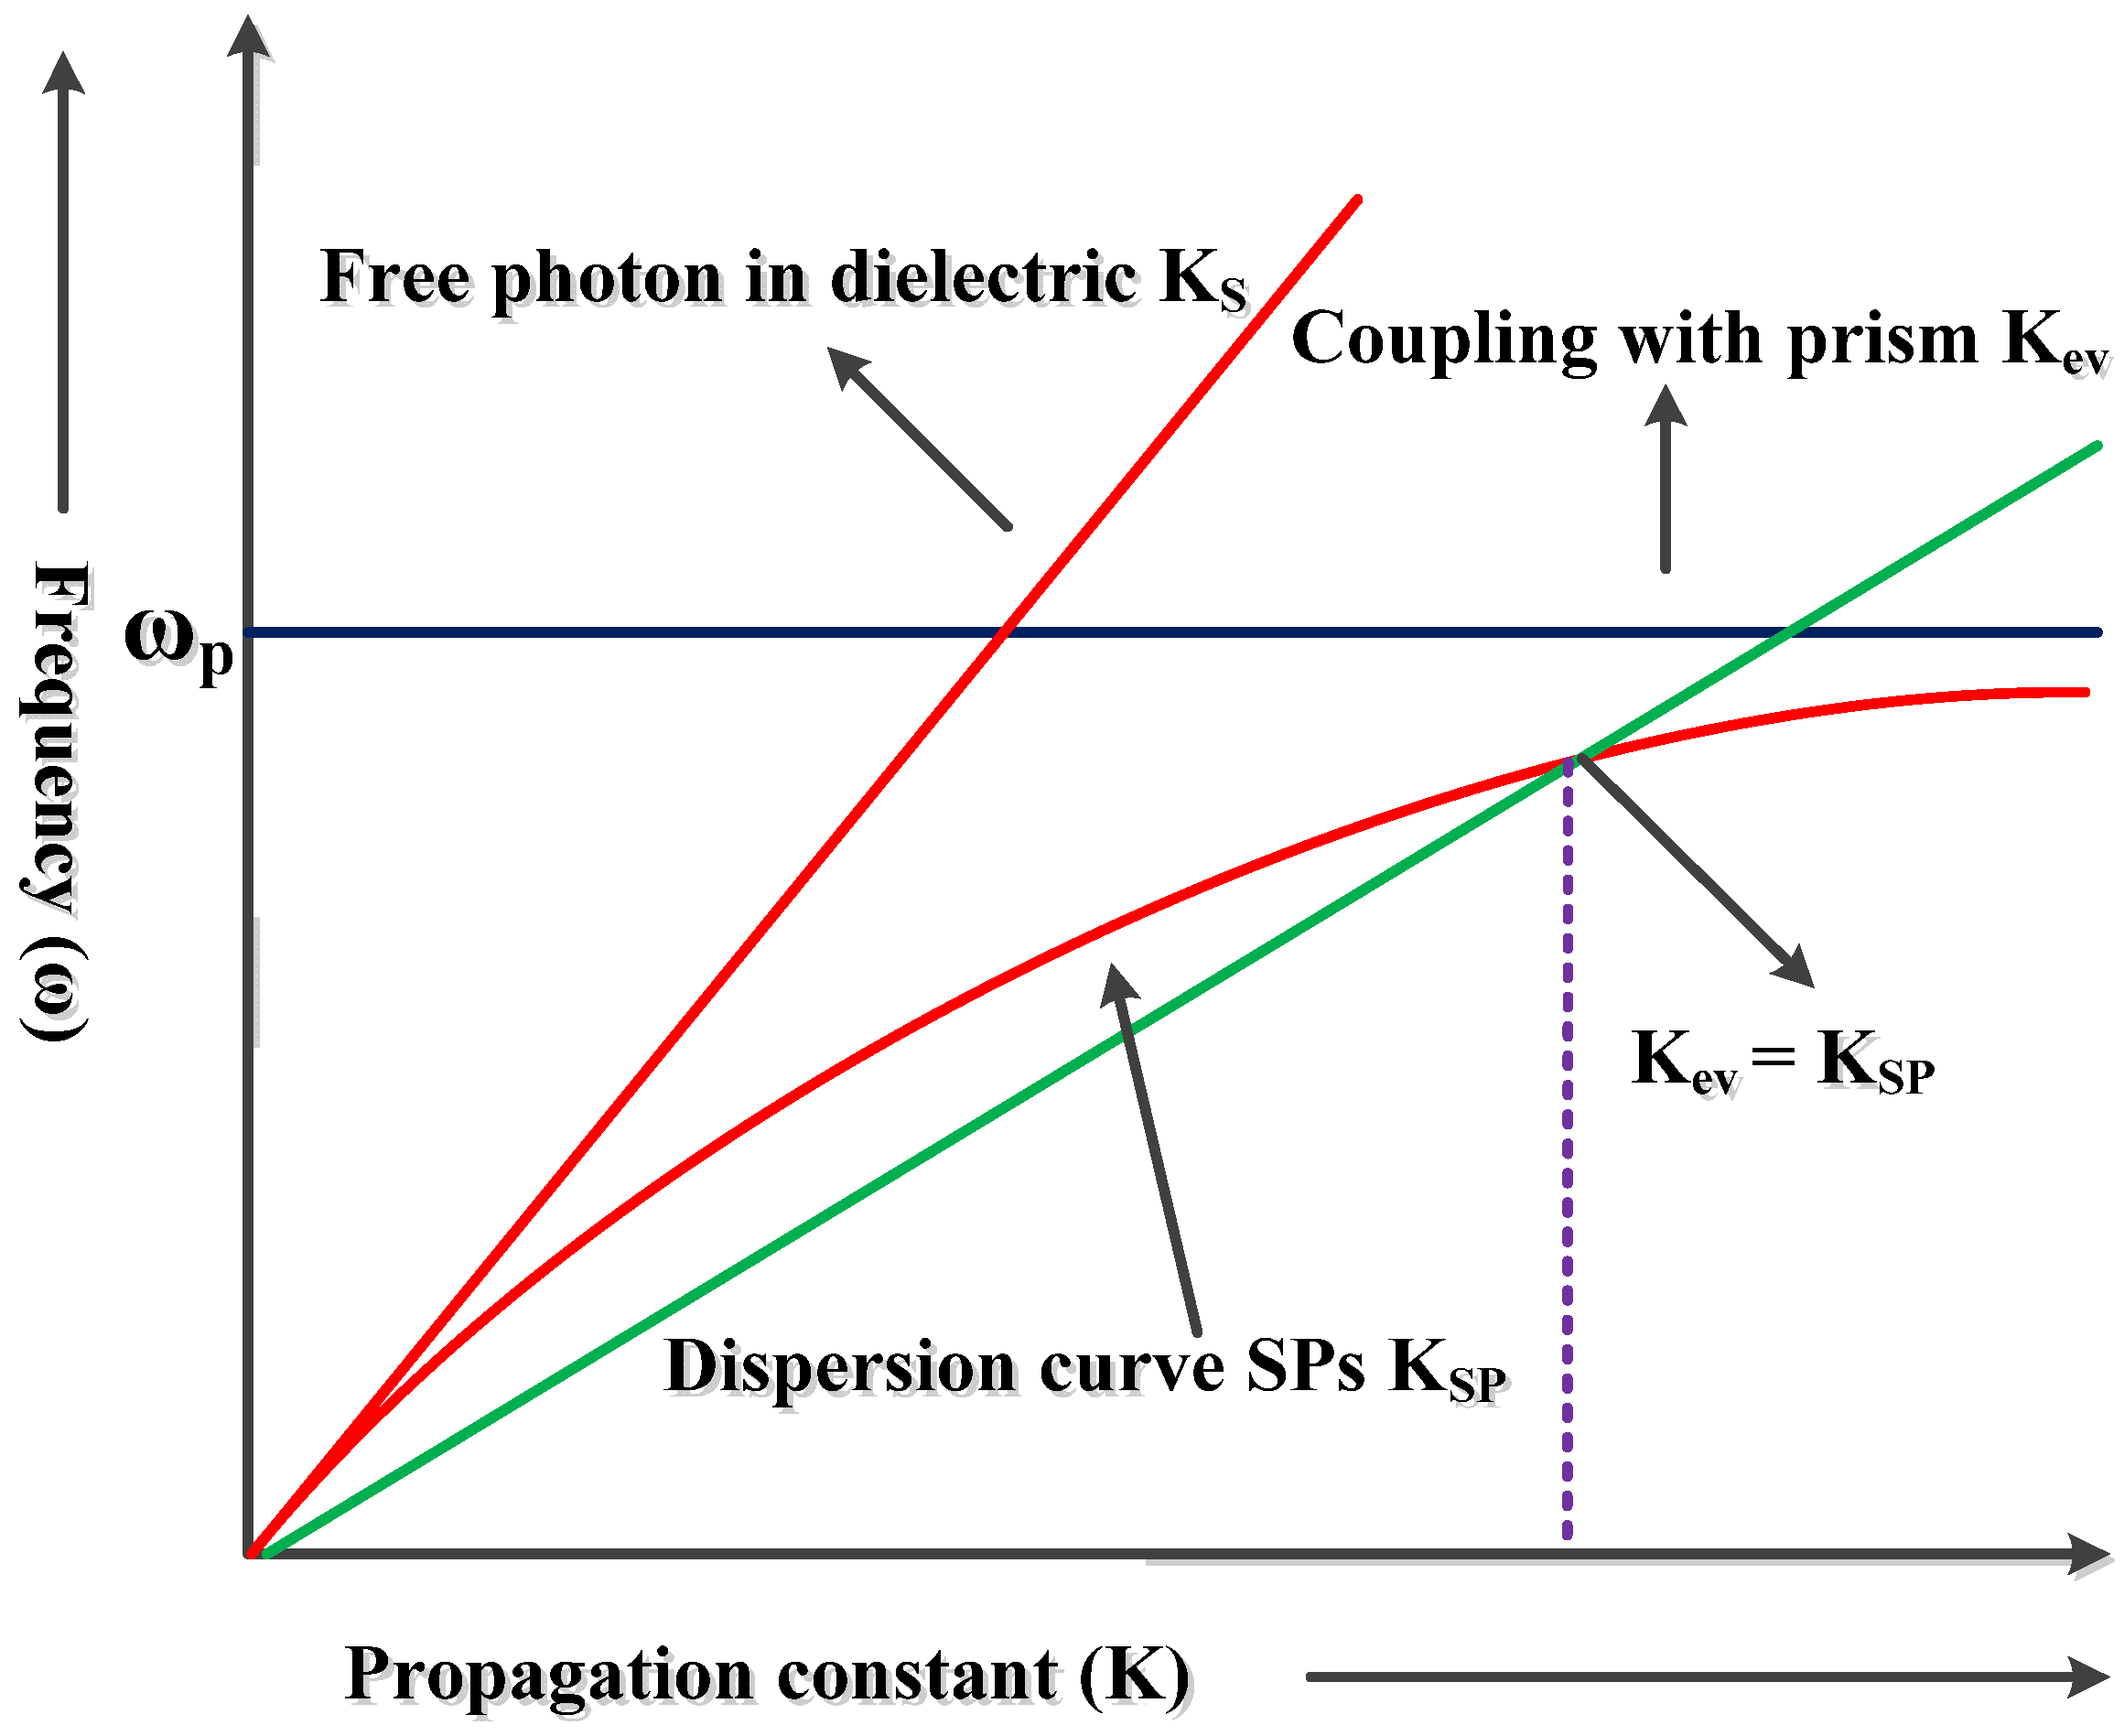
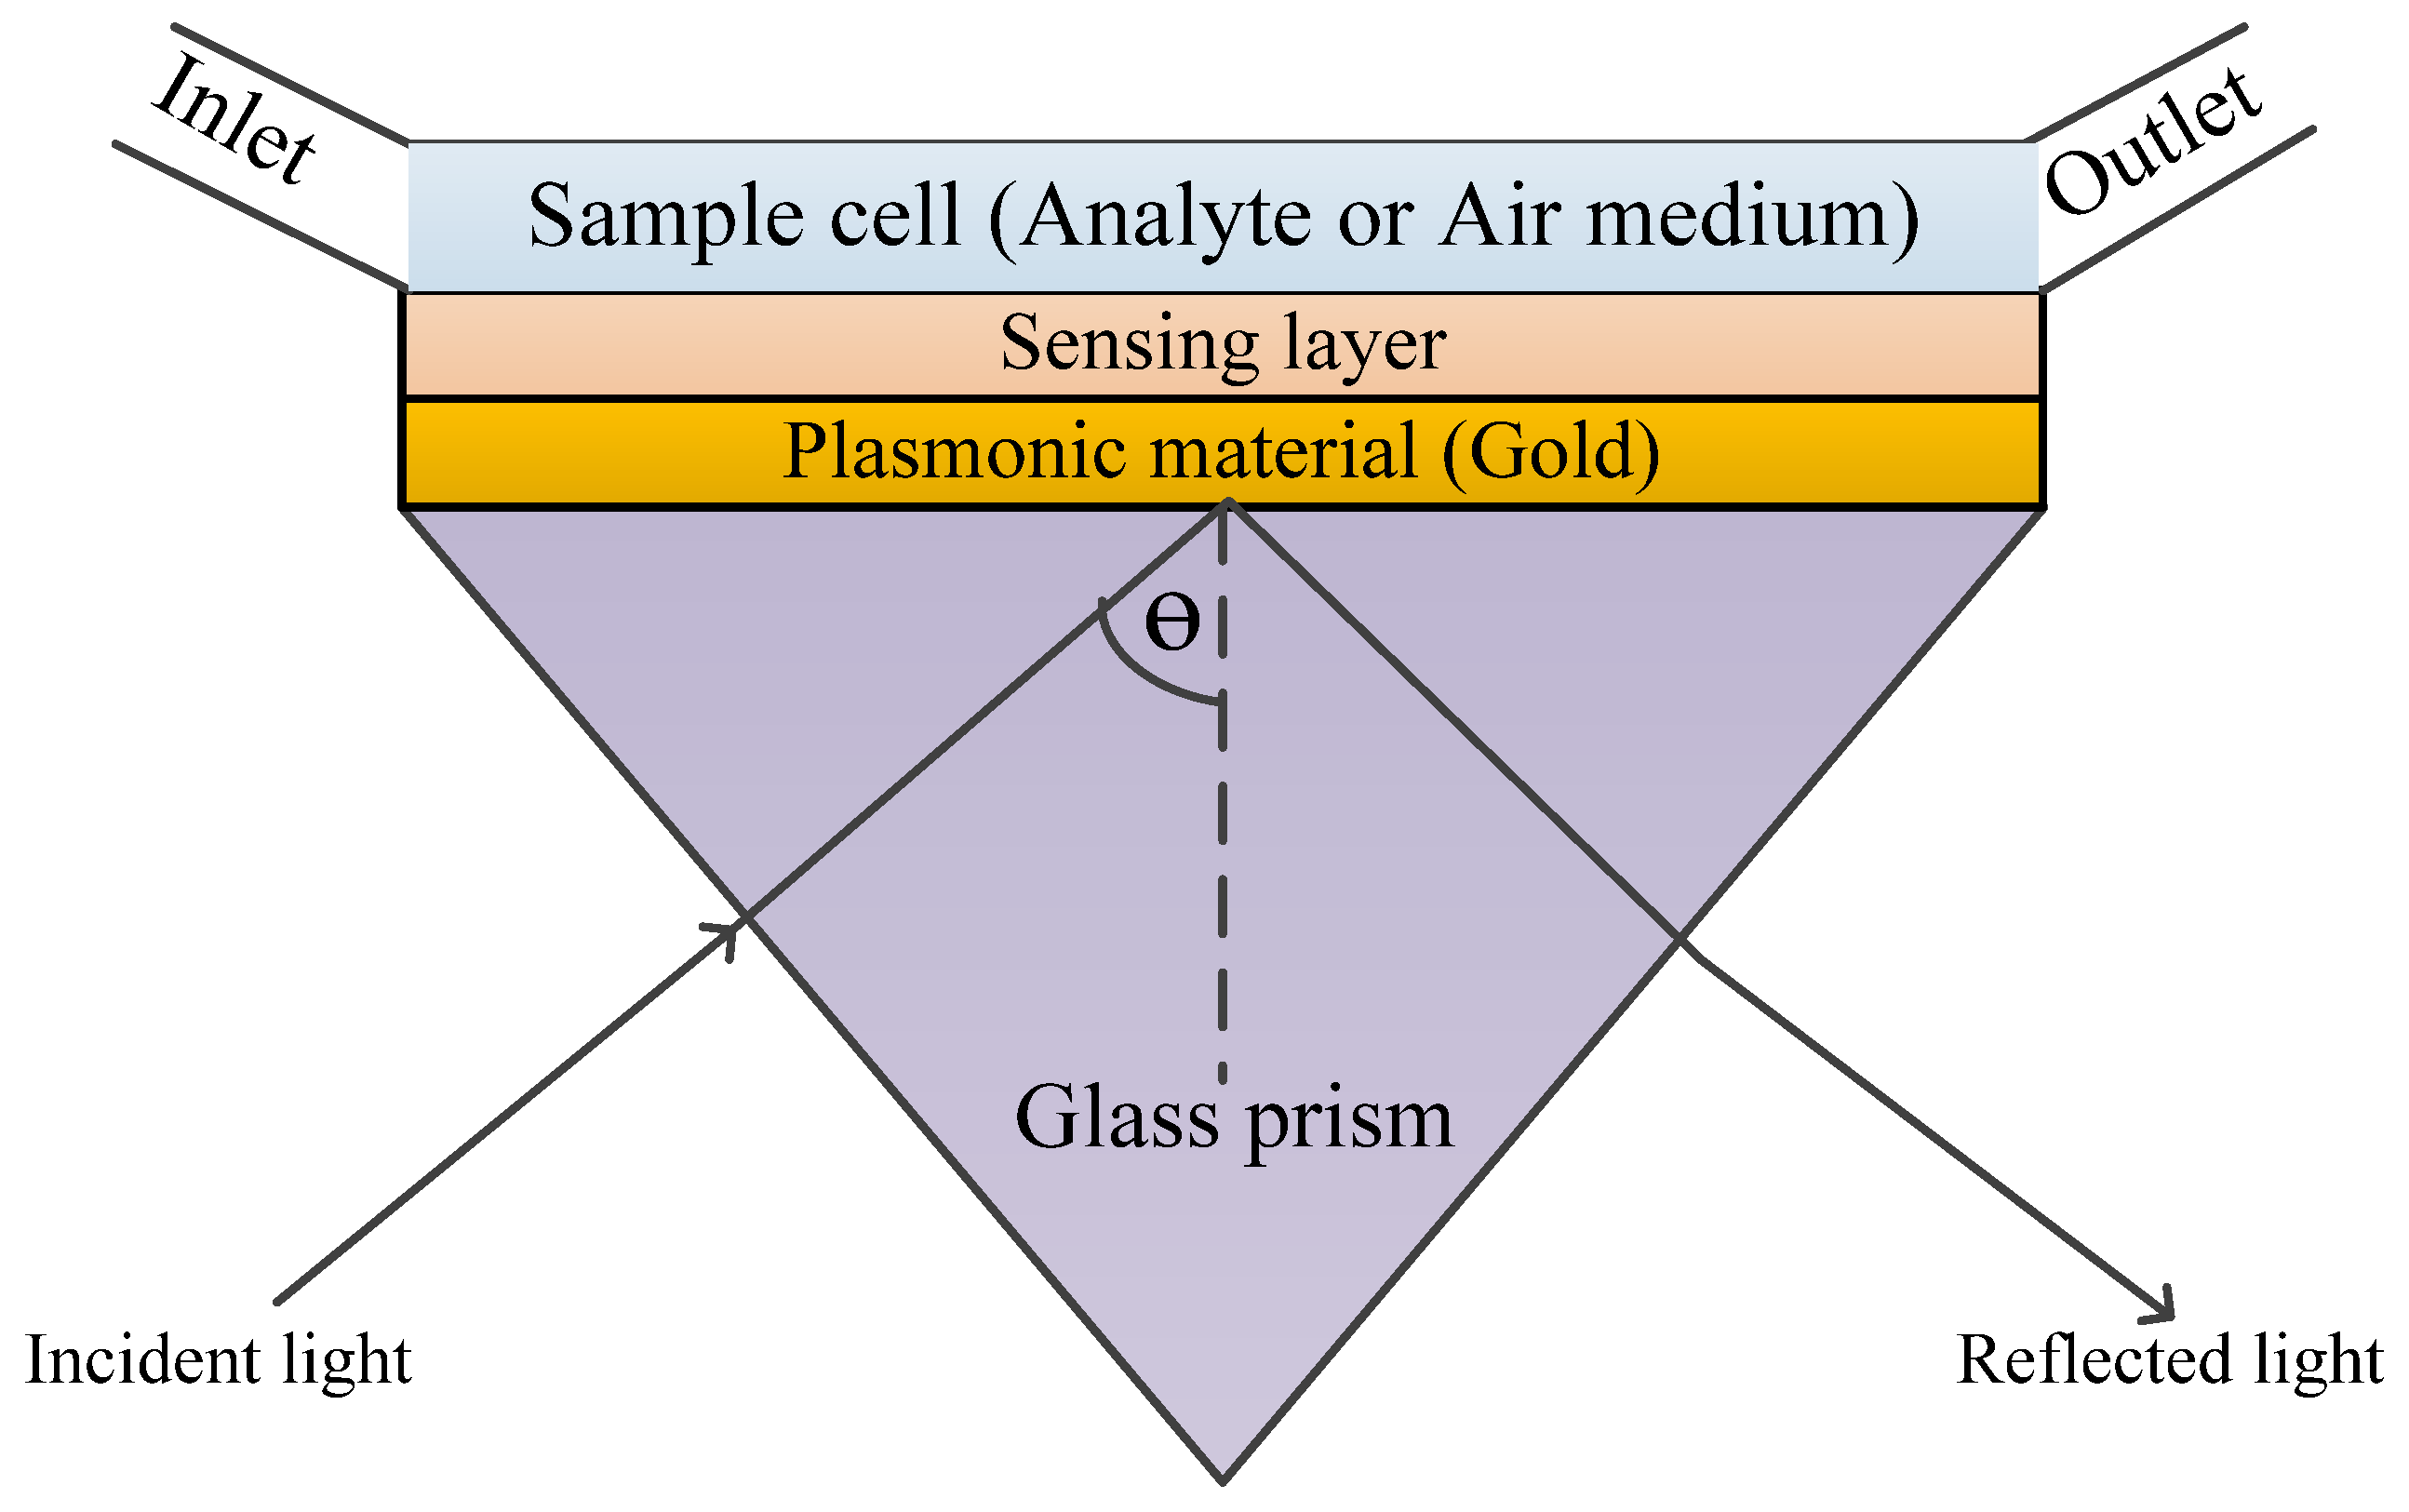
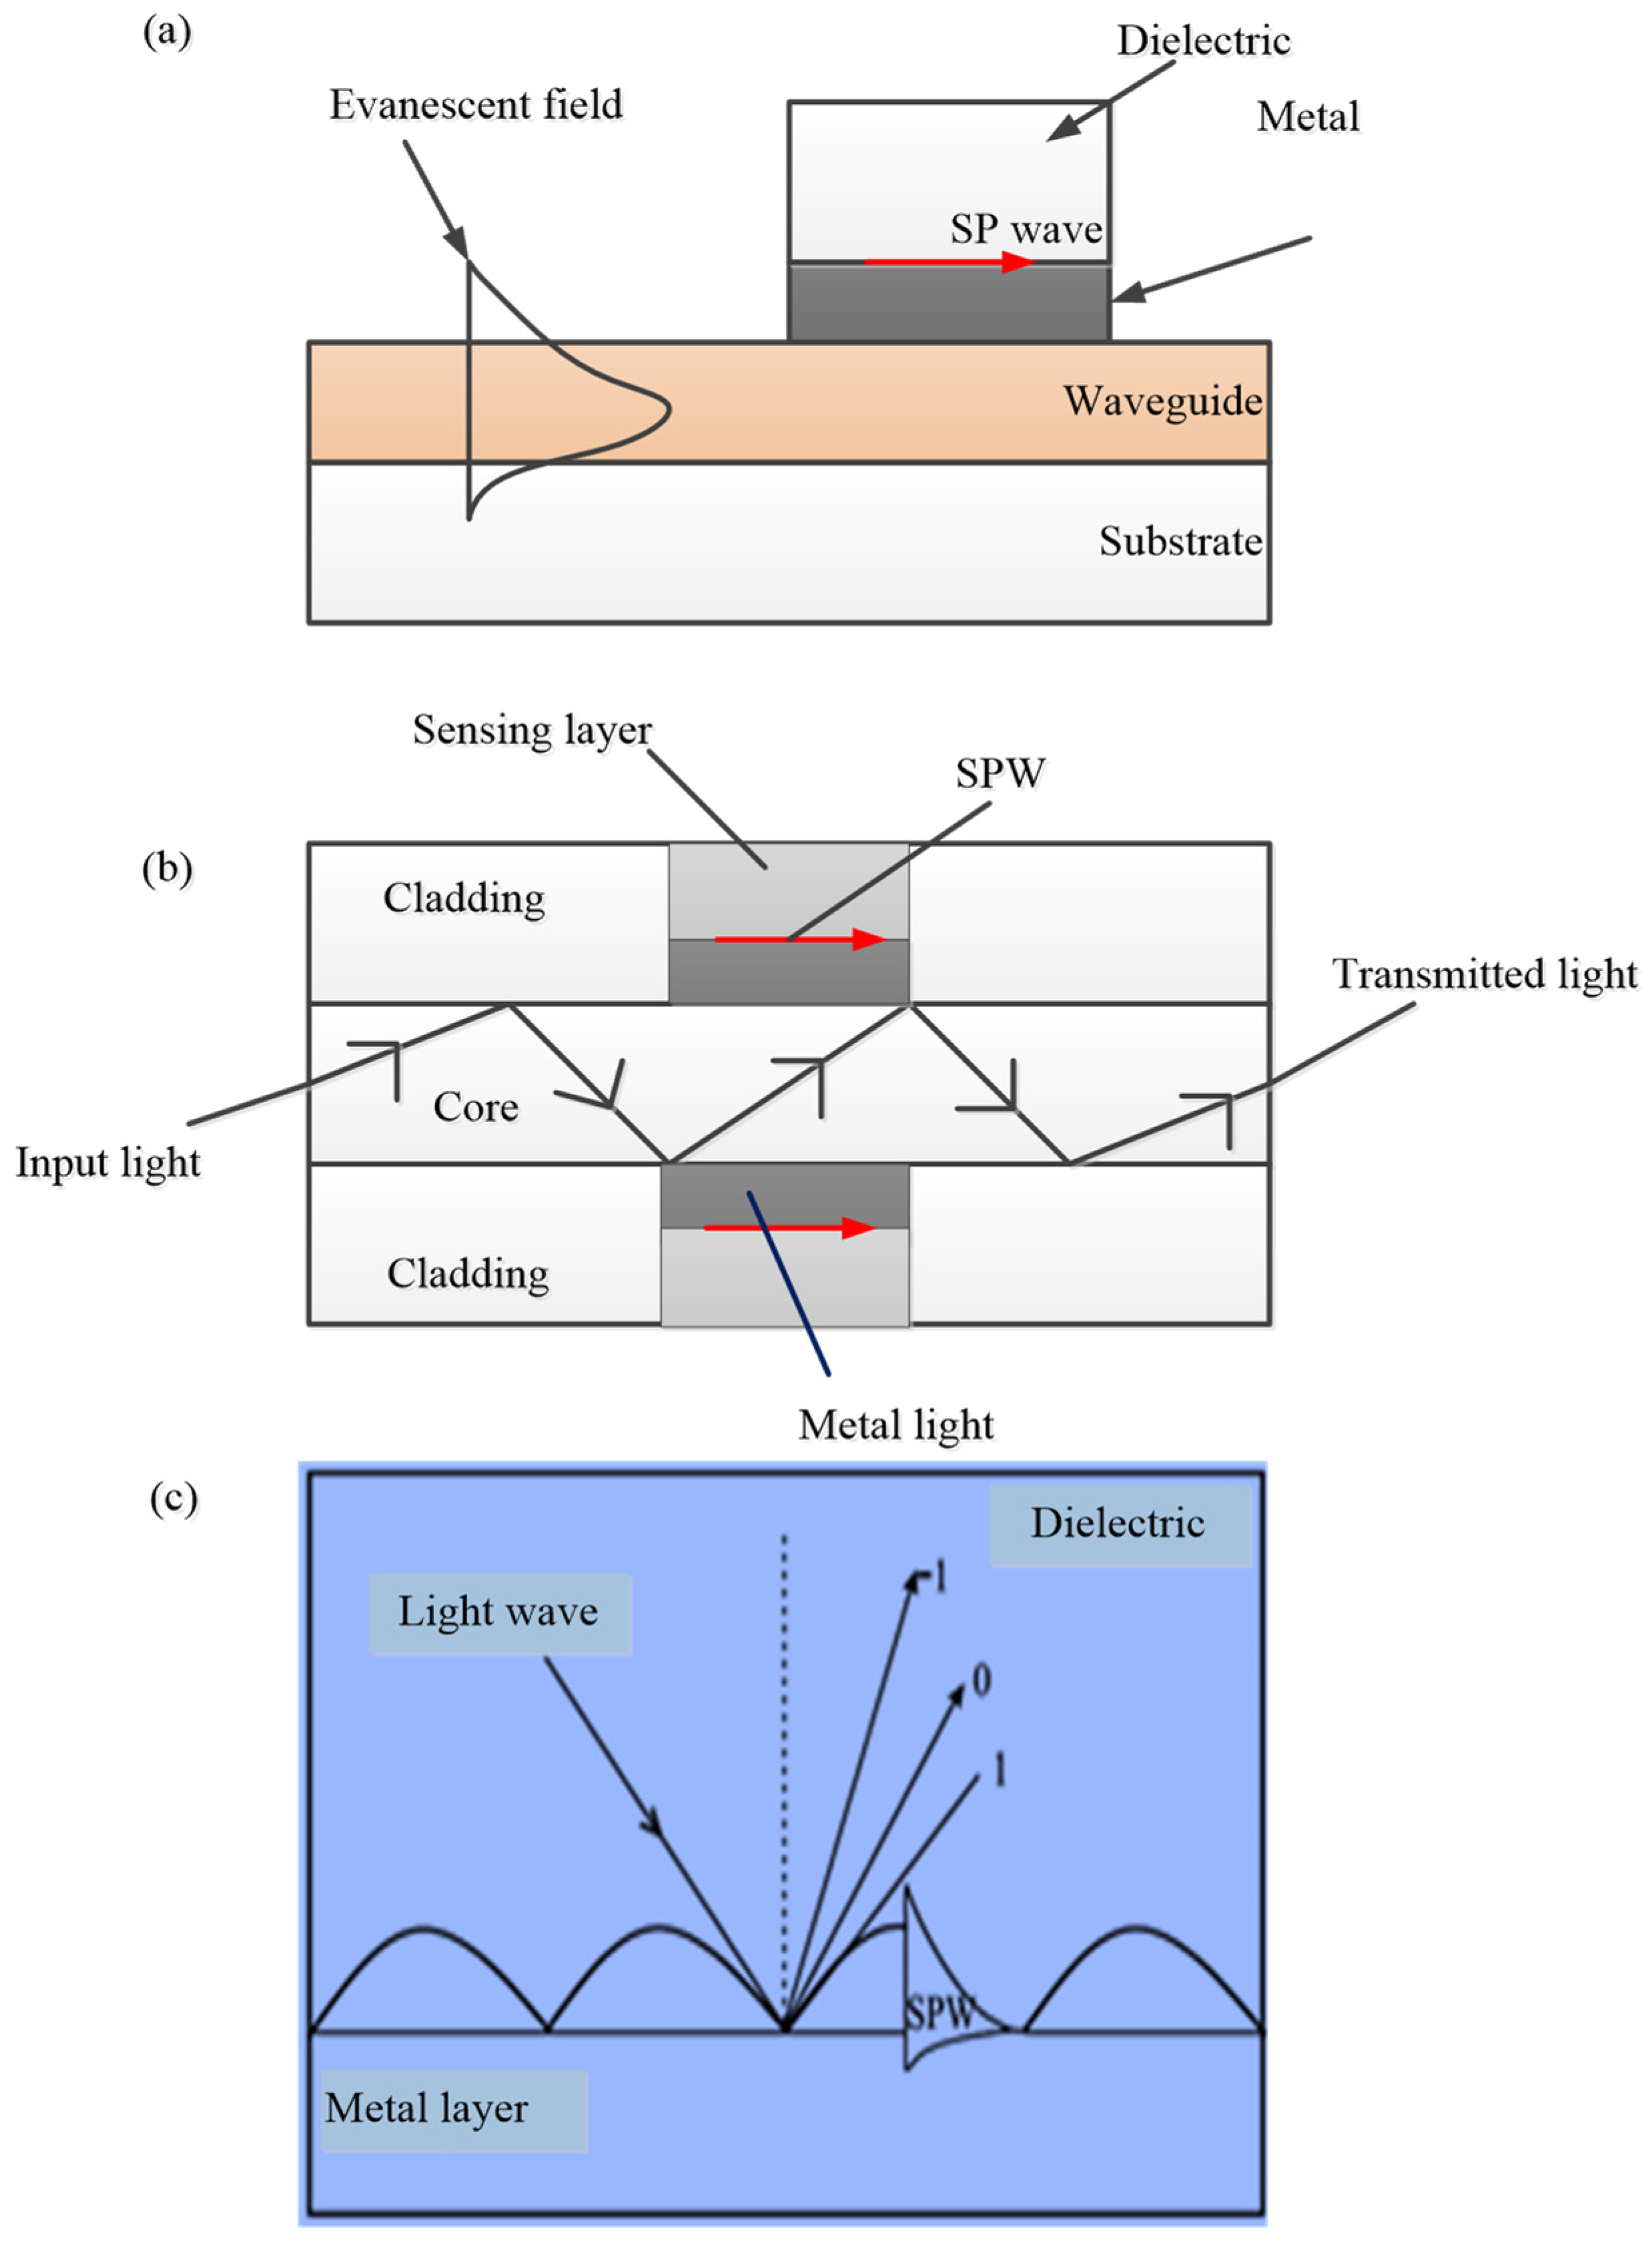
2.1.1. Excitation of Surface Plasmon Waves

A graph of the wave vector of direct light (Ks) and the wave vector of the surface plasmon wave (Ksp) against the frequency is illustrated in Figure 3. It can be observed that the two curves do not cross at any frequency and hence cannot be equal. This implies that the surface plasmons cannot be excited by direct light [43]. However, when the wave vector or the momentum of the excitation light is increased through the incorporation of a coupling prism with wave vector Kev, excitation occurs [22,43].
The system of an SPR sensor can be divided into four based on the structure of the optical couplers: optical prism couplers, grating couplers, optical fibre, and optical waveguides. Optical prism coupling is the most used method due to its simplicity.
(a)
Prism couplers
This coupling technique, usually based on the Kretchmann configuration, is the most widely investigated due to its simplicity and is termed “prism-based configuration.” As shown in Figure 4, the base of the prism is coated with metal. When light is incident on to one face of the prism, TIR occurs at the base of the prism when the angle of incidence is greater than the critical angle. This leads to the generation of an evanescent wave that propagates along the prism–metal layer interface [22,44].
The propagation constant of the evanescent wave (Kev) is evaluated using Equation (3).
K e v = ω c ε p s i n θ
where εp and np represent the dielectric constant and refractive index of the prism’s material, respectively; ω is the angular frequency; c is the speed of light in vacuum; and θ is the angle of incidence of light.
Equation (3) further proves that increasing the refractive index of the material of the prism can increase the wave vector of the evanescent wave that will excite the surface plasmon [22].
After the excitation of the surface plasmon at the metal–dielectric interface, the resonance condition or SPR condition is described using Equation (4) [22,41,45].
k o ε p s i n θ = k o ε m ε d ε m + ε d
where ε m   and ε d refer to the real part of the dielectric constant of metal and the dielectric constant of the dielectric medium, respectively; ko is the free space wave vector given by k o = 2 π λ o or ω c ; and λo is the free space wavelength.
The resonance angle or SPR angle (SPR signal) θspr can be evaluated by taking the inverse of sin θ in Equation (4) [22].
(b)
Waveguide couplers
Surface plasmon is also excited by modes of a dielectric waveguide (Figure 5a), which is similar to the principle of prism coupling in the Kretschmann structure. A mode of the dielectric waveguide propagates along the waveguide and when it enters the region with a metal film, it penetrates through the metal film and couples with a surface plasmon at the outer boundary of the metal. If the phase of the surface plasmon wave matches that of the surface plasmon waveguide mode, resonance will take place. The deployment of the waveguide in SPR sensors facilitates the effective controlling of the properties of light.
A few advantages of waveguide-based SPR sensors include portability, controllability, and good stability [22,43,44,46]. Unfortunately, a waveguide structure features poor sensitivity performance of the random numerical aperture (NA) dependent-incident angle θ. Furthermore, the non-adjustable nature of the incident angle makes polychromatic light the only suitable light source to obtain SPR and as such, only spectral interrogation is possible [47].
(c)
Optical fibre couplers
Miniaturised SPR sensors can be obtained using optical fibres. In an optical fibre SPR sensor, a small region (usually the centre) of cladding is removed and is coated with a surface plasmon metal layer (Figure 5b). When optical fibre SPR sensors are used, their metal layer part is kept in contact with the medium to be sensed. In an optical fibre, the light is guided by the total internal reflection at the boundary of the core and cladding. Here, the evanescent wave that decays exponentially is generated at the cladding region [50].
A few advantages of optical fibre couplers include miniaturisation, remote detection and distributed detection, and high sensitivity. However, they feature a relatively complex design in addition to the non-adjustable nature of the incident angle [43,44,46].
(d)
Grating couplers
Excitation of SPR can also be achieved by the diffraction of light with diffraction grating [46]. When light from a dielectric medium is made to fall on a metal grating, a series of diffracted waves are produced [46]. These diffracted waves get coupled with SP waves if the propagation constants of both waves are equal [46,48]. The excitation of SPR at the grating surface is shown in Figure 5c.
A few advantages of grating couplers include the realisation of micro- and batch production through the use of modern advanced micromachining technology [44]. In addition, thickness control of the metal film is not required. However, the mathematics involved in modelling grating SPR-sensing structures is more complex than planar prism-based systems, making modelling of the response of grating-based SPR structures and analysis of sensor data more difficult [44,46]. These hinder the applications of grating-coupled SPR sensors [44].

2.1.2. Generation of SPR Curve

The Kretchmann-based SPR system uses an angular interrogation method. In this case, the SPR sensors monitor the changes in reflectance intensity over a range of incident angles in which the minimum intensity is observed at the resonance angle (SPR angle). The whole process is described by an SPR curve, which is given as the graph of the reflectance intensity against the incident light angle [49,50]. The SPR curve is usually generated using a transfer matrix method (TMM). Typically, an N layer system featured by dielectric constants and thicknesses εi and di, respectively, placed between a prism with dielectric constant εp and an air medium with dielectric constant εair, is considered [49]. As shown in Figure 6, when a p-polarised light is incident at an angle θ, the complex reflection coefficient (rp) for the p-polarised incident light can be described using Equation (5) [40,42,51]. The transfer matrix (M) is described by Equations (6) and (7).
k o ε p s i n θ = k o ε m ε d ε m + ε d
M = M1·M2·……MN
And ,   M i = ( c o s ( k y , i d i ) j ε i k y , i s i n ( k y , i d i ) j k y , i ε i s i n ( k y , i d i ) c o s ( k y , i d i ) )
where ky is the wave vector perpendicular to the interface.
The angular dependence of rp is contained in the ky,i and the reflectance can be obtained from Equation (8).
R p = | r p | 2
The analysis of the reflectance over the range if the incident angle is conducted at a fixed wavelength (mostly 633 nm) [42].
Typically, the active surface electrons of the nanoparticles are confined to the surface of the nanoparticles and an LSPR wave is generated when the frequencies of the electron and incident light match, as shown in Figure 7 [52,53]. This leads to the absorption and scattering of the light by the nanoparticles (i.e., light extinction). An apparent wavelength shift is noticed at the position of maximum light extinction, called the LSPR peak wavelength. The shift can be monitored using a spectrometer, a dark field microscope, or the unaided eye depending on its intensity, which forms the basis of plasmonic sensing [28,52].
The interaction between the metallic nanoparticles and the light waves is usually explained using Mie scattering theory [54]. Based on this theory, the optical extinction (σe) for a metallic nanoparticle with a radius smaller than the wavelength of the incident wave (2r << λ) is described using Equation (9).
σ e ( λ ) = 24 π 2 r 3 ε d 3 / 2 N λ l n ( 10 ) ( ε i ( λ ) ( ε r ( λ ) + 2 ε d ) 2 + ε i ( λ ) 2 )
where N, λ, εd, εr, and εi represent the electron density, wavelength of the incident light, dielectric medium permittivity, real part metallic nanoparticle’s permittivity, and imaginary part metallic nanoparticle’s permittivity, respectively.
Assuming the permittivity of a nanosphere εr (λ) with radius r and the permittivity of the dielectric (surrounding) medium εd (λ) at wavelength λ, for 2r << λ, the polarizability α (λ) of the nanosphere can be described using Equation (10). The maximum value of α (λ) is obtained when the absolute value of the denominator is minimum. This condition is achieved when εr (λ) is negative, εd (λ) is constant, and the imaginary part permittivity of the nanosphere is small [54].
α ( λ ) = 4 π ε d ( λ ) r 3 ε r ( λ ) ε d ( λ ) ε r ( λ ) 2 ε d ( λ )
The above explanations are based on spherical nanoparticles. However, the performance of plasmonic devices is greatly enhanced with the modification of the nanoparticle shape. For instance, nanorods were reported to offer a higher sensitivity to refractive index changes compared to nanospheres [55,56]. In view of this, an extended version of Mie theory known as the Gans theory is used for the description of non-spherical nanoparticles. The theory describes the scattering features of prolate and oblate spheroid nanoparticles. Based on this, the absorption cross-section for a prolate spheroid is described by Equation (11) [55].
σ A = ω 3 c ε d 3 / 2 V j ( 1 / P j 2 ) ε i [ ε r + { ( 1 P j ) / P j } ε d ] 2 + ε i 2
where j represents the three dimensions of the particle and Pj encompasses the depolarisation factors PA, PB, and PC for each axis of the prolate spheroid particle.
Using Equation (11), LSPR peak frequencies can be derived. The effects of the aspect ratio on the LSPR peak wavelength can also be extracted from the equation [55].
The dependency of the LSPR peak wavelength on the permittivity of the surrounding medium (dielectric) can be proven using the Drude model, as shown in Equation (12).
ε r = 1 ω p 2 ω 2 + γ 2
where ωp and γ represent the plasmon frequency and the damping factor of the bulk metal, respectively. Equation (12) can be reduced to Equation (13) when γ << ωp in the visible and near-infrared regions.
ε r = 1 ω p 2 ω 2
As mentioned earlier, εr = −2εd under resonance condition. As such, the frequency of the LSPR peak ωmax can be described using Equation (14), from which the LSPR peak wavelength can be evaluated.
ω m a x = ω p 2 ε d + 1
In addition to the LSPR phenomenon, the resonant excitation results in a significant enhancement of the localised electromagnetic field (i.e., electromagnetic field near the surface of the nanoparticles), which forms the main mechanism for surface-enhanced Raman scattering (SERS). In other words, SERS is mainly based on the principle that an enhanced electromagnetic field is produced at the surface of the nanoparticles under resonance condition. The phenomenon is exploited for ultrasensitive sensing and bio-detection down to a single molecule. SERS makes the recognition of molecular species and supplying of structural information possible due to its unique vibrational Raman fingerprint [28,30,57,58]. This enables the capability for multiplex detection [38]. In SERS, the intense electromagnetic fields are created in regions called hot spots. The region is found in the spaces between nanoparticles, at the edges of the nanoparticles [58]. Details on SERS sensing devices can be found elsewhere [52,59]. Figure 8a,b illustrates the summary of the sensing principles for LSPR sensors and SERS sensors, respectively. As shown in Figure 8a, a typical LSPR sensor consists of a light source, LSPR transducers (a collection of nanoparticles), and a detector (spectrometer). The light source is used to illuminate the transducers through which part of the light is transmitted and detected by a spectrometer. This transmitted light carries adsorption information and is translated to absorbance spectra. Simply, adsorption of an analyte on the surface of the LSPR transducer leads to an LSPR peak shift depending on the amount of adsorbate (analyte) [52,55]. Besides the extinction measurement, darkfield microscopy and prism-coupling-based measurements have also been reported for LSPR sensors [52,55]. On the other hand, SERS instrumentation consists of a light source, SERS substrate, and Raman spectrometer. Typically, as shown in Figure 8b, when the light illuminates the SERS substrate, Raman scattered light (i.e., Stokes) is extracted from the scattered light originating from the surface-adsorbed molecule. The Raman scattered photons are then recorded by the detector of the Raman spectrophotometer [52].

3. Plasmonic Sensors for the Detection of Lung Cancer Biomarkers

As mentioned earlier, plasmonic sensors feature unique properties that make them ideal for the detection of lung cancer biomarkers, as explained in detail in the following sub-sections.

3.1. SPR Biosensors for the Detection of Lung Cancer Biomarkers

Recently, the detection of different lung cancer biomarkers using SPR biosensors has been investigated by numerous researchers, with promising results.

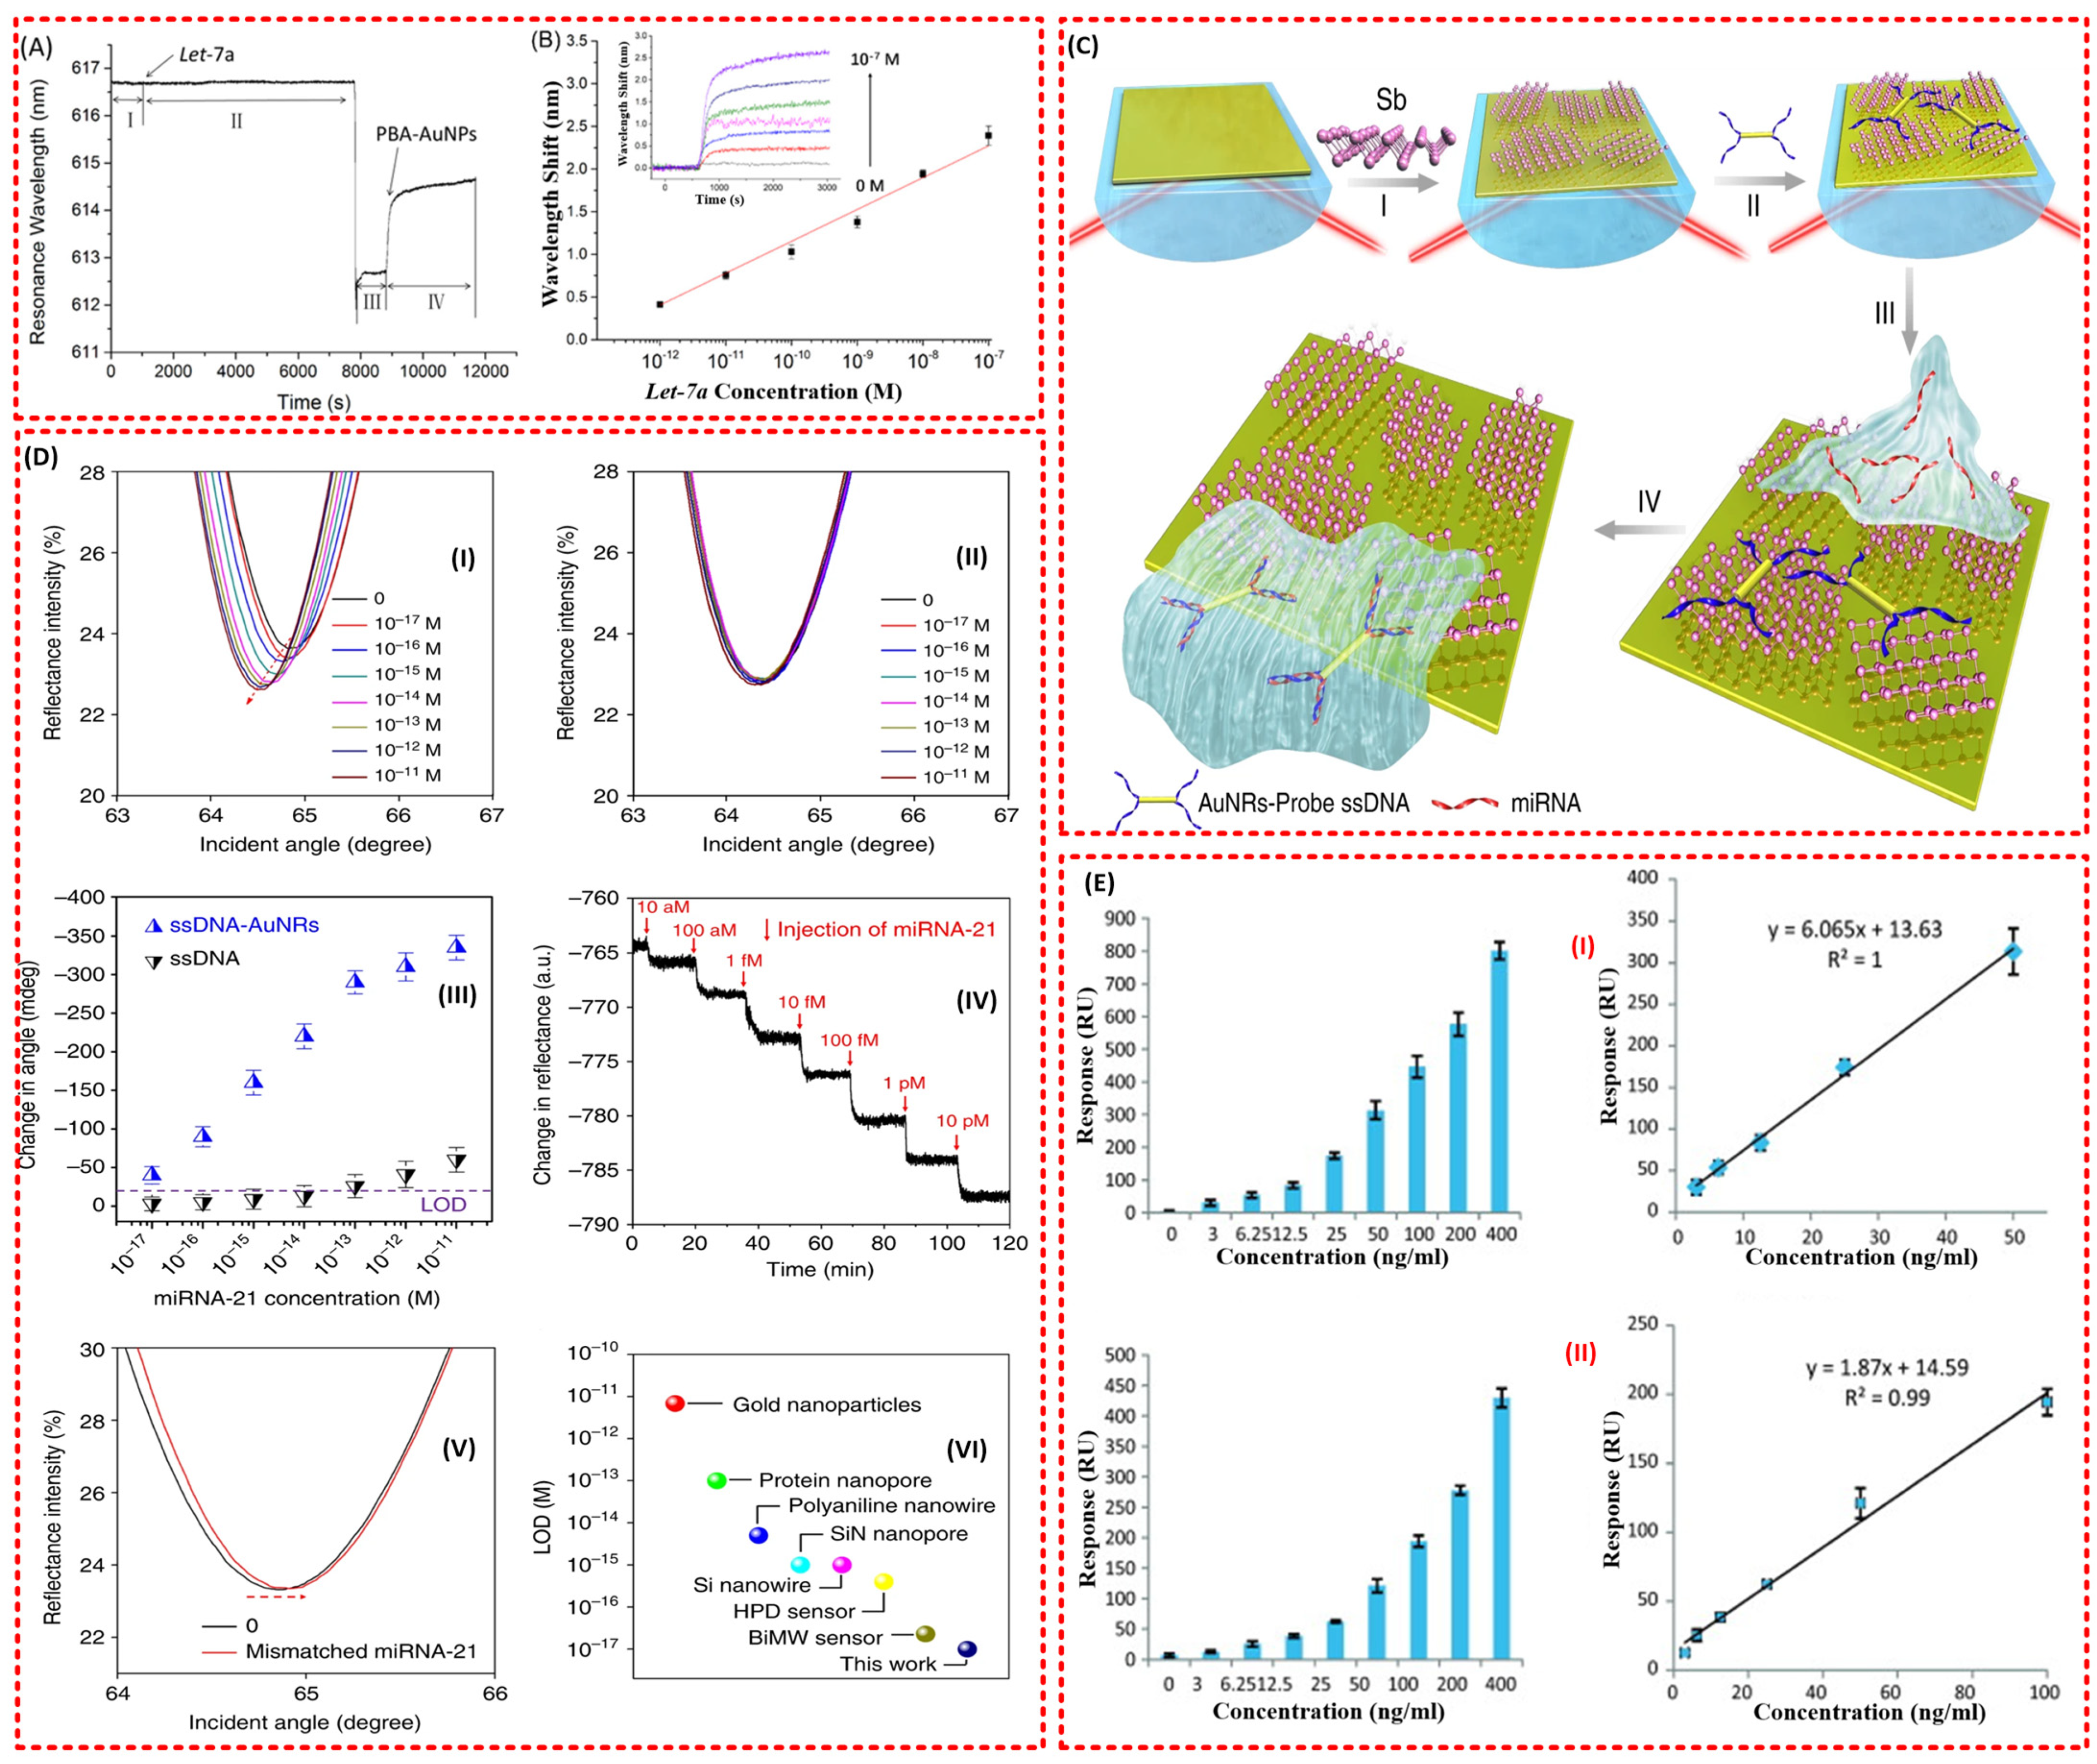
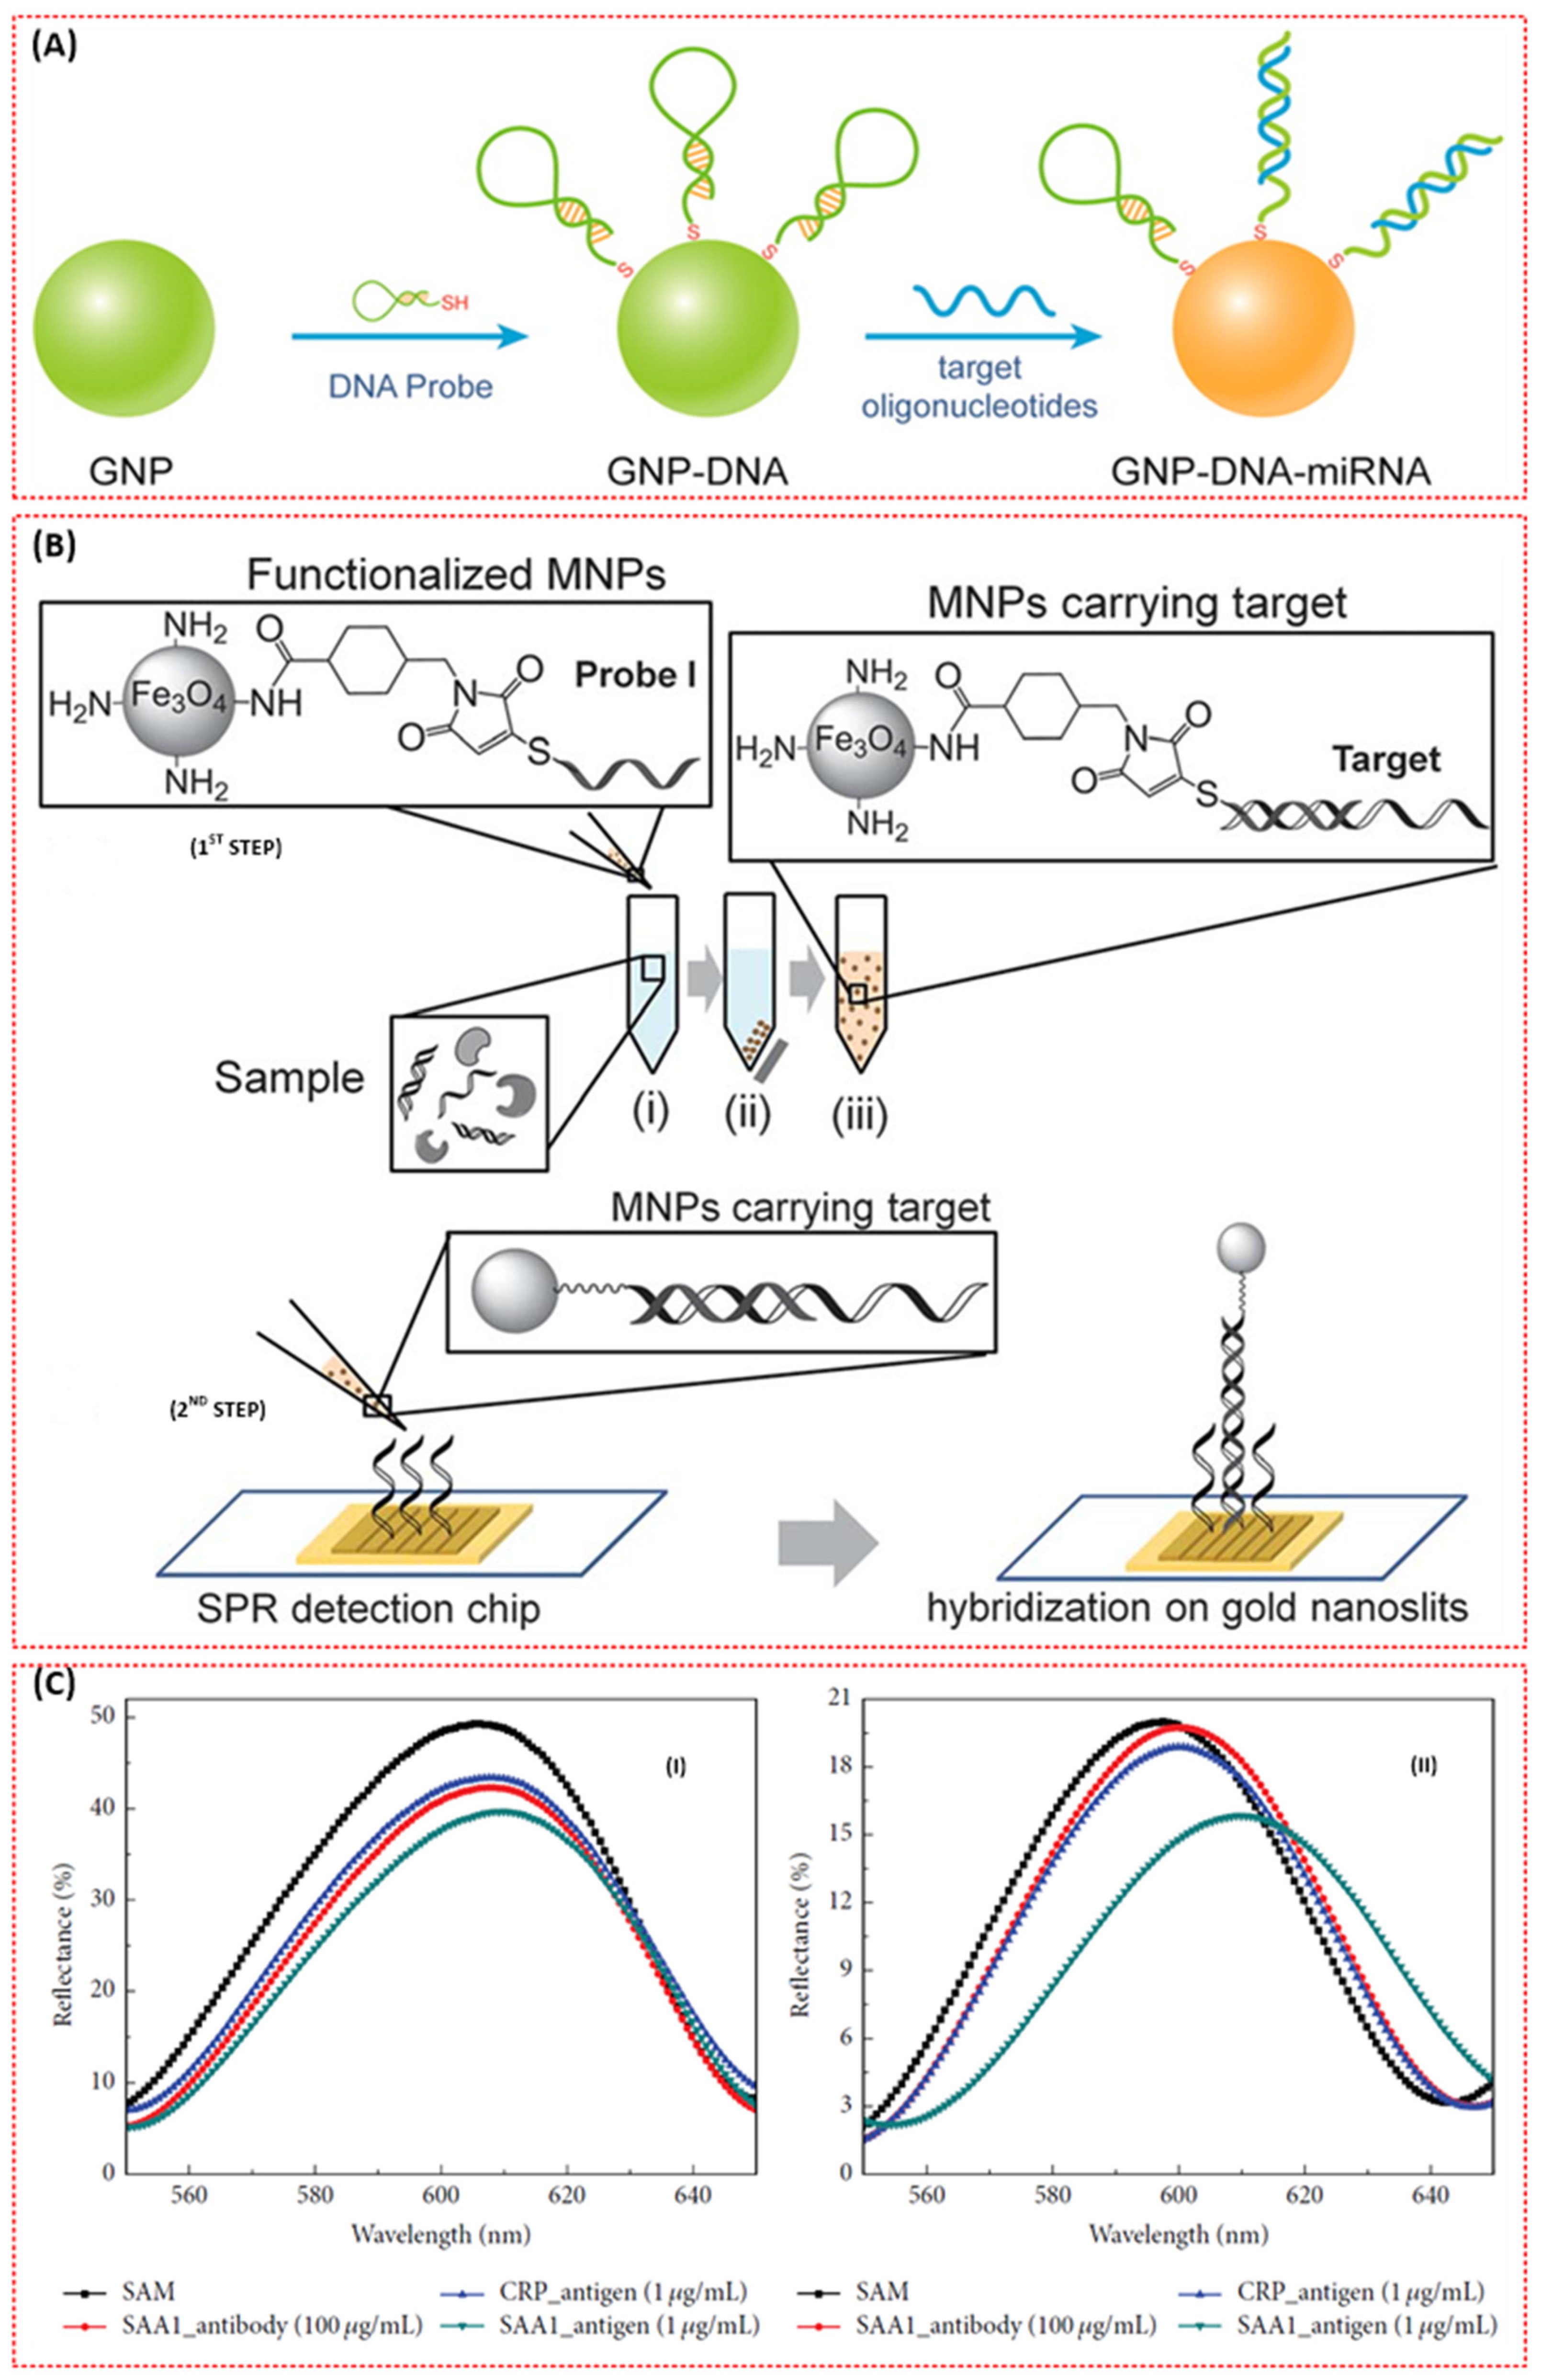
3.1.1. SPR Biosensors for miRNA Detection

Micro RNAs (miRNA) are among the top genetic/epigenetic lung cancer biomarkers explored using SPR biosensors. They are nanometre-long molecules characterised by around 19–25 nucleic acid base pairs [13,60,61]. These molecules have shown significant correlation with lung cancer disease, especially NSCLC, based on the upregulation/downregulation of miRNA or miRNA expression patterns [13,52,60,61]. Furthermore, the abundance of the molecules in body fluid demonstrates their potential utilisation as cancer biomarkers [13]. Several modifications have been incorporated into SPR biosensors to detect miRNA applicable for lung cancer diagnosis and screening.
For example, the functionalisation of SPR sensors with nanostructures has demonstrated promising performance. Qian et al. revealed a novel approach for the selective detection of microRNA (miRNA), Let-7a down to 0.27pM due to signal amplification of the fibreoptic SPR sensing system by phenylboronic acid functionalised Au nanoparticles (PBA-AuNPs), as shown in Figure 9A,B [62]. In addition, the PBA-AuNPs system was reported to differentiate RNA and DNA through selective amplification of the RNA signal. More importantly, the fibre optics technique lessened the complexity of the detection system [62].
A similar amplification approach with a few modifications has also been reported by Tianyu et al. [63]. The authors have demonstrated the potentiality of their antimonene modified SPR biosensor to detect miRNA-21 and miRNA-155 with ultra-sensitivity. The antimonene functionalised SPR biosensor was additionally functionalised with gold nanorod (AuNR)-ssDNA (Figure 9C) [63]. The lowest detection limit (LOD) of 10aM was incredibly (far better than many existing miRNA biosensors) achieved directly. This was attributed to the signal amplification from the improved coupling between the LSPR of the AuNR and the interaction between antimonene and ssDNA/dsDNA that was incorporated on the surface of the biosensor (Figure 9D) [63]. Another group also reported a superior performance of the 2D antimonene-based SPR biosensor compared to graphene-based and conventional (Au) SPR sensors for the detection of miRNA [64]. Moreover, the proposed biosensor requires no labelling for the detection of a hybridisation event and could provide real-time measurement.
Non-specific adsorption has always been an issue with biosensors. Nie et al. [65] fabricated a novel antifouling surface by coating DNA tetrahedron probes (DTPs) to the Au surface. SPR analysis showed low nonspecific adsorption (≤8.0 ng/cm2) onto DTP−Au surfaces. More importantly, the sensor could excellently distinguish miRNA (Let-7a) amidst a homologous family and detect it with good sensitivity and selectivity down to 0.8 fM [65].
Another amplification approach called sandwich assembly has also been reported for SPR sensors in the detection of miRNA for lung cancer. This includes a novel biosensing strategy developed by Ding et al. for the label-free detection of miRNA using SPR coupled with DNA super-sandwich assemblies and biotin–strepavidin-based amplification [66]. They termed the approach the “dual signal amplification strategy.” The amplification led to the attainment of LOD of 9 pM as opposed 470 pM in the direct approach [66].
Recently, a microRNA-21 genosensor exploiting surface plasmon resonance (SPR) to transduce a hybridisation event was developed [67]. The biosensing platform was built by self-assembling two bilayers of poly (diallyldimethylammonium chloride) (PDDA) and graphene oxide (GO) on a 3-mercaptopropane sulfonate (MPS) modified gold surface, followed by the covalent attachment of the DNA probe. The GO serves two functions: to allow the anchoring of the probe DNA and to increase the sensitivity of the biosensing event owing to its field enhancer effect. The new bioanalytical platform is an excellent alternative for the label-free biosensing of microRNA-21, with a linear range of between 1.0 fM and 10 nM, a sensitivity of 5.1  ±  0.1 moM−1, and a detection limit of 0.3 fM. The proposed sensing strategy was utilised for the quantification of microRNA-21 in urine samples [67].

3.1.2. SPR Biosensors for Carcinoembryonic Antigen (CEA) Detection

Besides miRNA, carcinoembryonic antigen (CEA) is a protein marker for lung cancer that has attracted the attention of many researchers [8]. It is a cell glycoprotein that is believed to be scarcely present in the blood of healthy humans, except for smokers. Normally, a CEA concentration greater than 3–5 ng/mL is considered a sign of lung cancer occurrence [8,13]. The SPR sensing of CEA for lung cancer has shown significant success.
In 2011, Altintas et al. came up with an optimised SPR biosensor for the detection of the cancer biomarker carcinoembryonic antigen (CEA) [8]. Among the different formats of the immunoassay investigated, including direct capture and sandwich immunoassay, superior performance was observed for the sandwich assay, which showed high sensitivity and reproducibility for CEA detection down to 3 ng ml−1 (Figure 9E) [8].
Four years later, another group succeeded in developing an improved SPR biosensor by incorporating gold nanoparticles (SA-NPs) in addition to the sandwich amplification approach [73]. The lowest detection limit (LOD) of 1.0 ng/mL was achieved for the SA-NP-based detection of CEA, which is below the lung cancer threshold [68]. Moreover, the system demonstrated the capability of detecting CEA in buffer or in spiking serum samples with excellent sensitivity and selectivity.
Teotia et al. proposed a grating-based surface plasmon resonance waveguide biosensor that demonstrated potential application for the detection of two protein-based lung cancer biomarkers: carcinoembryonic antigen (CEA) and epidermal growth factor receptor (EGFR) [69].
Recently, a cost-effective scheme for the portable and rapid detection of CEA in human serums with high sensitivity has been developed. The biosensing chips were prepared by functionalising the surface of a plasmonic nanocave array (PNA) with anti-CEA. This plasmonic design provides exceptional sensitivity and allows for a simple measuring configuration. More importantly, detection capability for a CEA concentration below the lung cancer threshold was successfully attained [70].

3.1.3. SPR Biosensors for the Detection of Cytokeratin CYFRA 21-1 (CA-19 Fragment or Cytokeratin 19)

Cytokeratins are another protein-based lung cancer biomarker vigorously explored by researchers. An experiment demonstrated the role of this protein in the diagnosis of NSCLC, which represents almost 80% of all lung cancer cases [13,71]. Moreover, it was reported in a comprehensive review that both the specificity and sensitivity of cytokeratin CYFRA 21-1 is higher than the other protein markers, including CEA and squamous cell carcinoma (SCC)-related antigen to evaluate NSCLS [8].
Like other biomarkers, the detection of cytokeratins for lung cancer diagnosis, especially CYFRA 21-1 (CA-19 fragment or cytokeratin 19) and cytokeratin 17, has been investigated using SPR sensing techniques. More importantly, several problems have been addressed successfully. For example, the requirement of a small number of test samples, the realisation of a high-throughput sensor, and the provision of more results per sample have been achieved by developing a multiplex detection system. The SPR biosensors can perform multiple tests of different biomarkers simultaneously in a single measurement [72,73,74]. The poor affinity problem has also been solved for cytokeratin SPR biosensors by incorporating carboxylic functional groups, which are known for their high surface area and excellent bio affinity [72,75]. This has enabled the biosensors to detect the cytokeratin even below the threshold for lung cancer occurrence (see Table 4) [72,75]. On the other hand, the signal of a CYFRA 21-1 SPR sensor has been enhanced by deploying a dual signal amplification strategy using gold nanoparticle (AuNP)–antibody and antibody–quantum dot (QD) conjugates [73]. QDs are well known for their unique optical and electrical properties, such as broad excitation region, narrow emission area, tuneable optical properties, strong luminescence, and excellent photostability. The use of a dual signal amplification strategy was reported to amplify the signal of the biosensor by 50-fold [73].
Unfortunately, most of the presented cytokerakin biosensors were based on the conventional Kretschmann SPR configuration, which is bulky and requires large amounts of analytes. These problems were rectified through the deployment of fibre optic technology. Ribaut et al. developed a surface plasmon resonance (SPR) optical fibre biosensor based on tilted fibre Bragg grating (TFBG) technology for the direct detection of cytokeratin 7 (CK7), a small biomarker of interest for lung cancer diagnosis [74]. The measurement by this biosensor was offered at near infrared wavelengths, yielding a high Q-factor. In addition, the configuration also allows for easy compensation of temperature fluctuations and straightforward injection of polarised light for appropriate SPR generation [74]. A detection limit of 0.4 nM was able to be achieved by the biosensor in buffer and serum.
Besides the potential miniaturisation and small sample requirements of the fibre optic SPR sensor, important features of optical fibres, such as their cylinder shape, miniaturised size, easy light injection, and flexibility, can lead to the realisation of in vivo measurements (measurements in soft matter). By exploiting this, a biosensor can be brought directly into contact with a suspicious tissue and therefore avoid the need for any sample collection, leading to a minimally invasive diagnosis [76,77]. Loyez et al. developed a catheter-embedded optical fibre sensor for the detection of the cytokeratin-17 biomarker. The results proved the capability of their biocompatible endoscopic tool to navigate inside lungs with high flexibility [77]. Another group also demonstrated that the detection of biomarkers in soft matter, including tissue, can be performed accurately with a plasmonic optical fibre grating immunosensor. The experimental detection of CK17 was conducted by trapping it in a porous polyacrylamide gel matrix (to mimic human tissue) [76].

3.1.4. SPR Biosensors for the Detection of Volatile Organic Compound (VOC) Biomarkers

VOCs from human breath are organic compounds that show a distinct pattern in the pathological state, where the pattern is affected by a modification that appears in different cellular processes. The produced VOCs are excreted into the bloodstream on order to be transported to the lungs and be exhaled [78]. Most lung cancer diagnosis methods are only useful at an advanced stage due to the asymptomatic development of the disease at an early stage [14,79]. Fortunately, lung cancer diagnosis using exhaled breath VOC biomarkers can provide an avenue for simpler and faster screening in a non-invasive and real-time manner [7,10].
Contributions to plasmonic gas sensing are lacking due to the small sensing signal, especially when sensing gases with low concentrations (nmol/mol to sub µmol/mol) [80,81]. The work by Sudheer et al. is the only available recent contribution reported on the detection of VOCs in terms of lung cancer [87]. They proposed a novel fibre-optic surface plasmon resonance (SPR) sensor incorporating metal (Au, Ag, and Al)/graphene/Ti3C2Tx MXene layers for the detection of acetone and ethanol vapours. The authors were able optimise the key performance parameters of their proposed sensor using simulations based on theoretical models.

3.1.5. SPR Biosensors for the Detection of Other Biomarkers

Exosomal LRG1 has been identified as a potential urinary biomarker for the detection of non-small-cell lung cancer [83,84]. In a move to clear up the limitations of conventional SPR sensors and few limitations of nanoplasmonic biosensors, such as the difficult and expensive fabrication of nanostructures, Liu et al. [84] developed an intensity modulated and compact SPR biosensor with dimensions of 25 cm × 10 cm × 25 cm. The nano-biosensor is based on a conventional SPR sensing mechanism and requires no nanostructure fabrication. The authors demonstrated the practicability of their small-scale SPR biosensor in lung cancer diagnosis using exosomal epidermal growth factor receptor (EGFR) biomarkers. In addition, the SPR biosensor depicted a sensitivity greater than ELISA and a sensing accuracy similar to ELISA [84]. Usually, the detection of EFGR using SPR sensors is limited due to the nature of its molecular size. Fortunately, the conjugation of magnetic nanoparticles (MNPS) to an erlotinib functionalised SPR sensor has demonstrated a mean signal amplification of about 2.5-fold for its interaction with EFGR (A549 lung cancer cells) compared to the erlotinib functionalised sensor [85]. Similarly, the sensitivity issue can be overcome by engineering a phase-based SPR sensor with an atomically thin two-dimensional film made from novel materials such as Ge2Sb2Te5 [86].
Investigations on the detection of lung cancer biomarkers using SPR biosensors are summarised in Table 4.

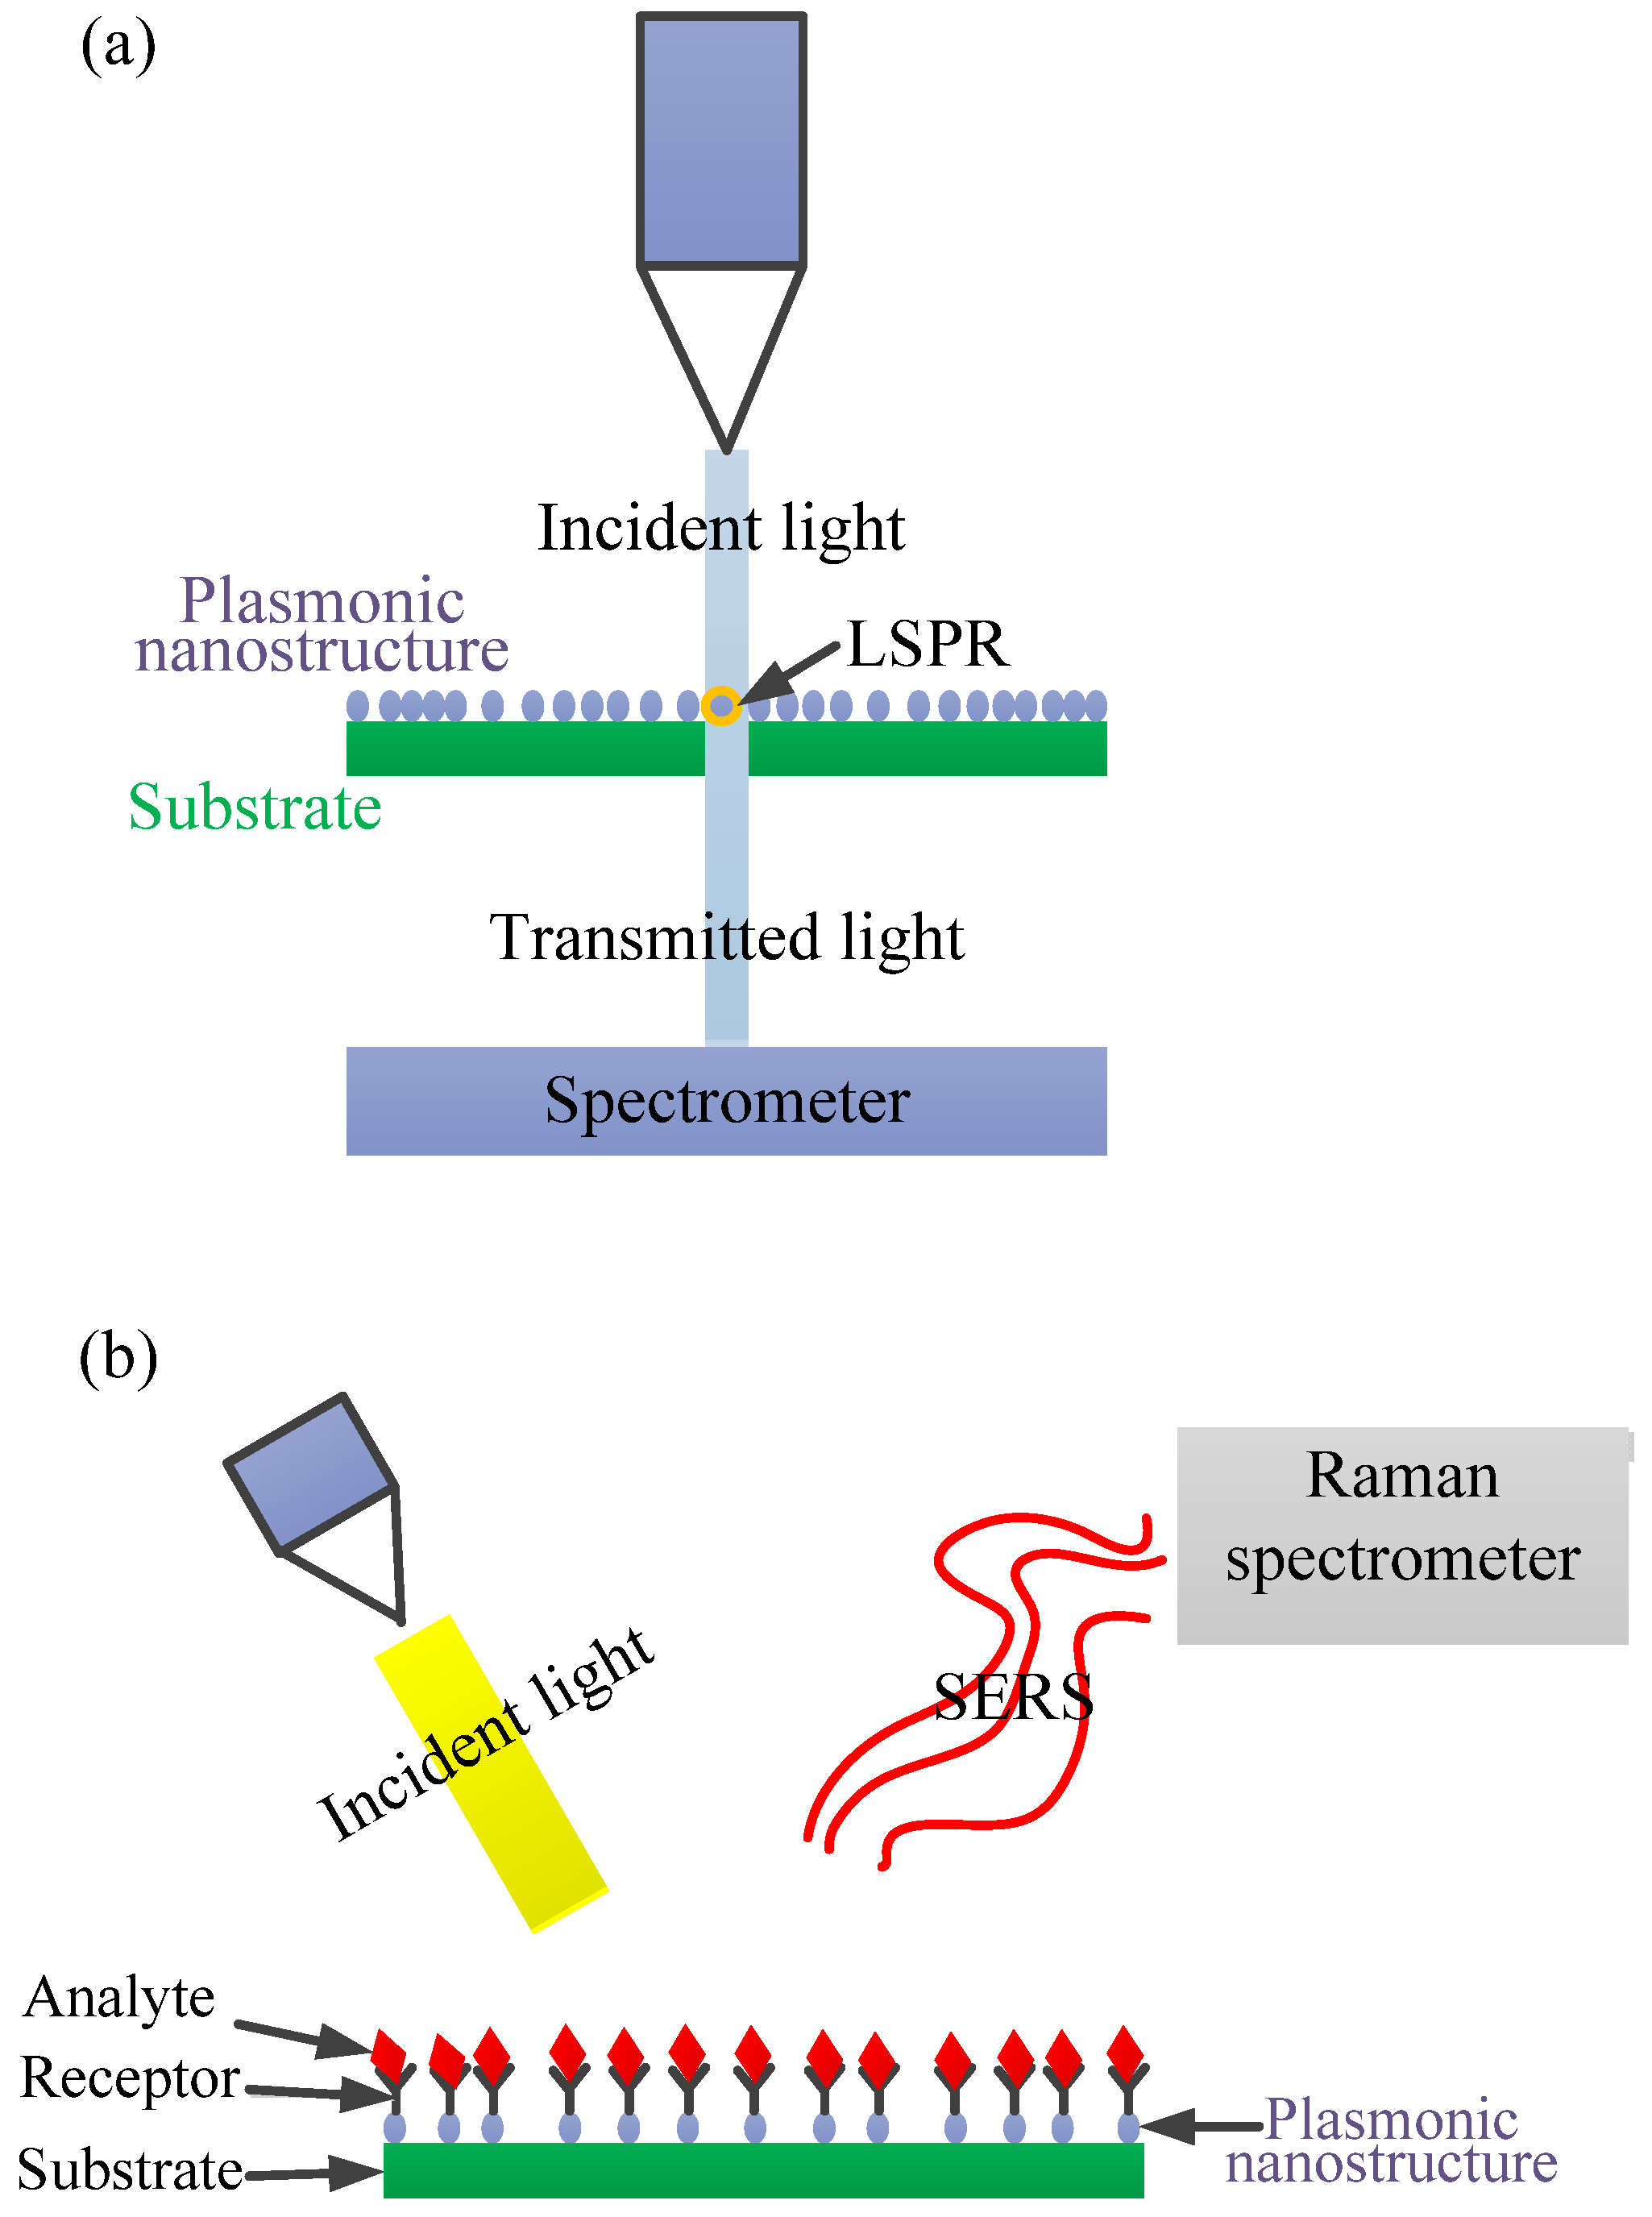
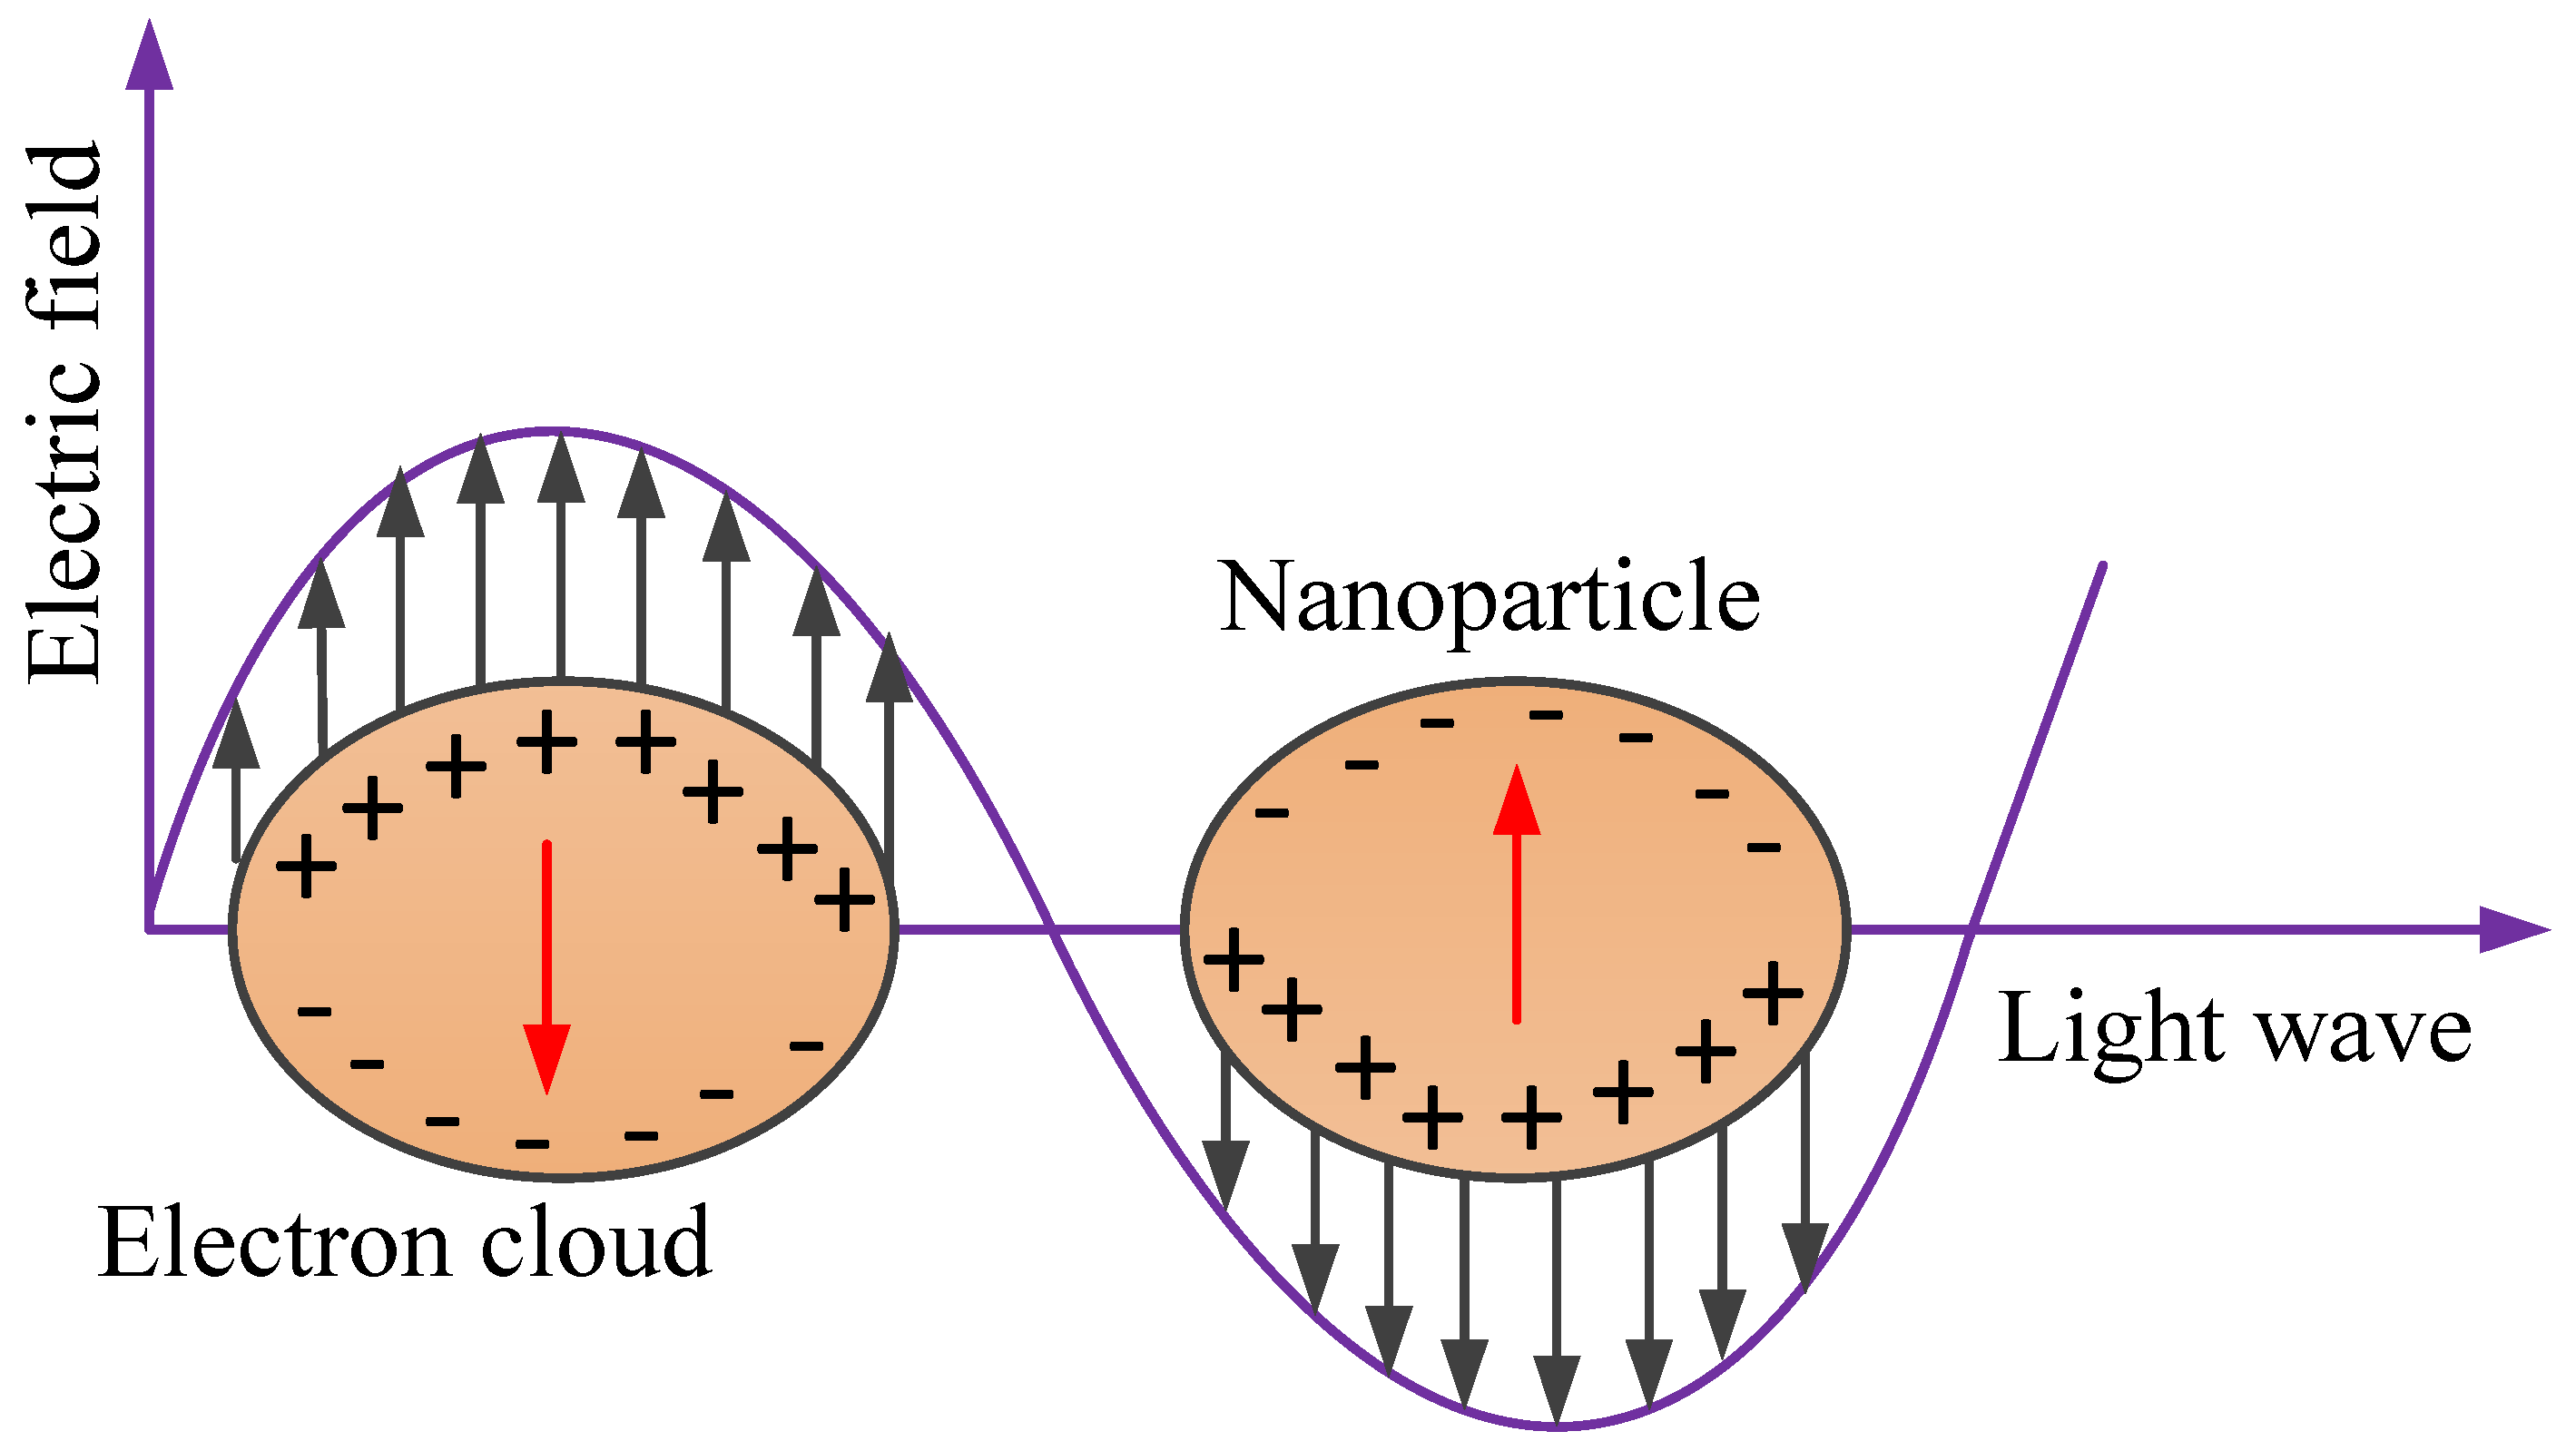
3.2. LSPR Biosensors for the Detection of Lung Cancer Biomarkers

The principle of LSPR sensors is explained in the previous section. To shed more light, LSPR creates a strong resonance absorbance peak, mostly in the visible wavelength range, called the LSPR peak. The position of the LSPR peak is highly sensitive to the local refractive index surrounding the particle. As such, it measures small changes in the wavelength of the LSPR peak’s position. The LSPR sensing system offers better features compared to SPR, including simplicity since no prism is required, being weakly affected by mechanical and vibration noise, being weakly affected by bulk effects due its strong and short-range decay length, cost effectiveness, and being more user friendly [88,89,90].
The advantages have encouraged numerous investigations on the utilisation of LSPR strategy in the detection of lung cancer biomarkers.

3.2.1. LSPR Biosensors for the Detection of miRNA Biomarkers

Besides the mentioned merit of the LSPR sensors, various investigations have been conducted on miRNA sensing at the single nanoparticle level due the potentiality of its signals to provide even more detailed information [91,92,93]. miRNA and general nucleic acid-based biomarkers are reported to possess many advantages over protein biomarkers, including instability and complexity [93].
For example, Hu et al. developed a simple and selective miRNA-21-based LSPR biosensor based on a modified single strand of individual gold nanoparticles (GNPs) (Figure 10A) [92]. The authors immobilised GNPs onto an ITO glass substrate in order to form the main part of the sensors. Probe ssDNA was modified on the surface of the GNPs through an Au−S bond to capture the miRNA-21. More importantly, the biosensor enabled the detection of the miRNA-21 down to 3 nM with good selectivity [92]. Couple with these LSPR features, incorporating magnetic particles into the SPR sensors has led to better sensitivity and specificity [94].
In light of this, a novel detection method utilising SPR functionalised magnetic nanoparticles (MNPs) (Figure 10B) was investigated for the ultra-sensitive detection of an mRNA biomarker, heterogeneous nuclear ribonucleoproteins (hnRNP B1) [93]. The MNPs enabled the isolation of the target molecule from the sample matrix in order to prevent non-specific binding and enhanced the SPR response. As such, the lowest detection limit of 30 fM was achieved in the absence of further amplification or labelling of the target molecule.
The engineering of nanostructures to novel shapes increases the sensitivity of the LSPR biosensors [55,96]. Unfortunately, the design of sophisticated novel structures such as nanogap antennas that supports the confinement of a huge local electromagnetic field within a nanoscale gap are commonly obtained with top-down fabrication processes, such as electron beam lithography (EBL) or focused ion beam (FIB), which offer high precision and resolution below 10 nm. However, they are expensive and render small-area substrates [97,98]. Recently, a facile, low-cost, and high-throughput nanofabrication method based on hole-mask colloidal lithography providing Au-nanogap antennas with a gap size of ≈12 nm was reported [98]. More importantly, the plasmonic biosensor based on the structure demonstrated highly sensitive, direct, and label-free detection of lung cancer biomarker miRNA-210 down to 0.78 nM [98].
Besides the utilisation of AuNPs as the plasmonic material for miRNA-based LSPR biosensors, nanostructures based on other materials have been explored due to the exhibition of improved features by those nanostructures compared to conventional nanoparticles. For example, distance-dependent coupling effects in two silver nanoparticles showed a greater red-shift than gold nanoparticles [99,100]. Additionally, specially designed structures have been reported to be more sensitive to the changes on the surface of nanoparticles [89]. In line with this, Zhang et al. were motivated to develop a new procedure that merges LSPR spectroscopy and dark-field microscopy (DFM) colour images for the ultrasensitive detection of miRNA-21 on a single silver nanocube (AgNC). They demonstrated a colour change in DFM and a linear red-shifting of the scattering peak when the concentration of the miR-21 was increased. This was attributed to the hybridisation between ssDNA and miR-21 on the AgNC surface [99]. Moreover, the system depicted excellent sensitivity and linearity for the detection of miRNA down to 0.1 fM [99].
LSPR biosensors for miRNA were also reported to undergo various modifications for signal amplification and the attainment of excellent specificity. This essentially required the dynamic range of the biosensors to be extended and the way of attaining accurate conclusions from miRNA analysis to be eased due to the correlation of the biomarker with numerous cancers [101,102]. Miti et al. and Wu et al. developed two different strategies for amplifying the signal of their miRNA-based LSPR biosensors and improving their specificity [103,104]. Briefly, Miti et al. devised a novel strategy of incorporating hairpin probes for recognition specificity and hybridisation chain reaction (HCR) for surface-bound isothermal enzyme-free amplification, which led to an increased LSPR signal [103]. On the other hand, Wu et al. developed a miRNA biosensor based on an Au-on-Ag heterostructure and a DNA tetrahedral framework (DTF). The authors revealed the capture of miRNA by various DNA tetrahedral framework (DTF) probes immobilised on the gold array chip. Subsequently, a single-stranded DNA (ssDNA) functionalised with a silver nanocube (AgNC) hybridised first with the captured miRNA, and then the ssDNA-coated Au nanoparticles were assembled on the surface of AgNC, forming Au-on-Ag heterostructures, which are essential labels capable of realising an amplified SPR response [104]. Recently, an attomolar detection of miRNA-155 was achieved due to the incorporation of core/shell Fe3O4@Au nanoparticles [105].

3.2.2. LSPR Biosensors for the Detection of Volatile Organic Compound (VOC) Biomarkers

As mentioned in Section 3.1.4, reports on plasmonic gas sensors are lacking due to poor sensitivity, especially at low concentrations. Fortunately, metal organic frameworks (MOFs) have been reported to be promising for gas sensing [106,107,108]. This motivated an investigation on the detection of lung cancer VOC biomarkers including acetone and ethanol using a MOF-coated nanohole array (NHA) plasmonic biosensor [81]. The result demonstrated the potentiality of the biosensor to detect the VOCs down to 5 ppm.

3.2.3. LSPR Biosensors for the Detection of Other Biomarkers

Besides miRNA and VOCs, numerous contributions have been reported on the modification of LSPR biosensors for the detection of other biomarkers. For example, Zeng et al. reduced the size and cost of the biosensor for the lung cancer biomarker exosomal protein by developing a plasmonic interferometer array (PIA) biosensor that uses intensity modulation at a single wavelength [109]. The intensity modulation allows for the attainment of high spatial density multiplexed measurements and reduces the size due to the non-requirement of a spectrometer as in wavelength modulation [110,111]. Furthermore, the PIA biosensor was integrated into an optofluidic biochip and attached to the imaging system of a smartphone for general portable biosensing. This enabled the realisation of a sensing resolution of 9.72 × 10⁹ exosomes/mL using the portable biosensor. Sun et al. also reported the realisation of direct LDI MS detection of small metabolites in biofluids and exosomes using plasmonic gold chip substrates. The novel design only requires about 500 nL of various biofluids and exosomes [112].
In another development, the complicated and prolonged detection process encountered during signal amplification when complementary DNA is used as a linker for binding proteins and particles after hybridisation was solved using a 3D multi-layered plasmonic biosensor [113]. DNA hybridisation was detected in the absence of any supplemental particles for signal amplification. The detection of a low concentration and volume (2 μL) of live lung cancer A549 cells was depicted by the 3D multi-layered plasmonic nanostructures [113].
Another important aspect is the proper selection of the sensing platform. Due to its unique set of chemicals, optical, mechanical, and electrical properties, anodic aluminium oxide (AAO) has been selected as a sensing platform for the detection of lung cancer biomarker serum amyloid A1 (SAA1) using a nanoporous biosensor based on LSPR. After fabrication of the AAO chip with different nanopore diameters, a gold layer was deposited on the nanostructure in order to induce LSPR and facilitate immobilisation of the antibodies [95]. The response of the biosensor based on 15 nm and 95 nm pore diameters is shown in Figure 10C. More importantly, the 95 nm pore diameter-based biosensor allowed for the detection of SAA1 down to 100 ag/mL with excellent sensitivity.
Investigations on the detection of lung cancer biomarkers using LSPR biosensors are summarised in Table 5.

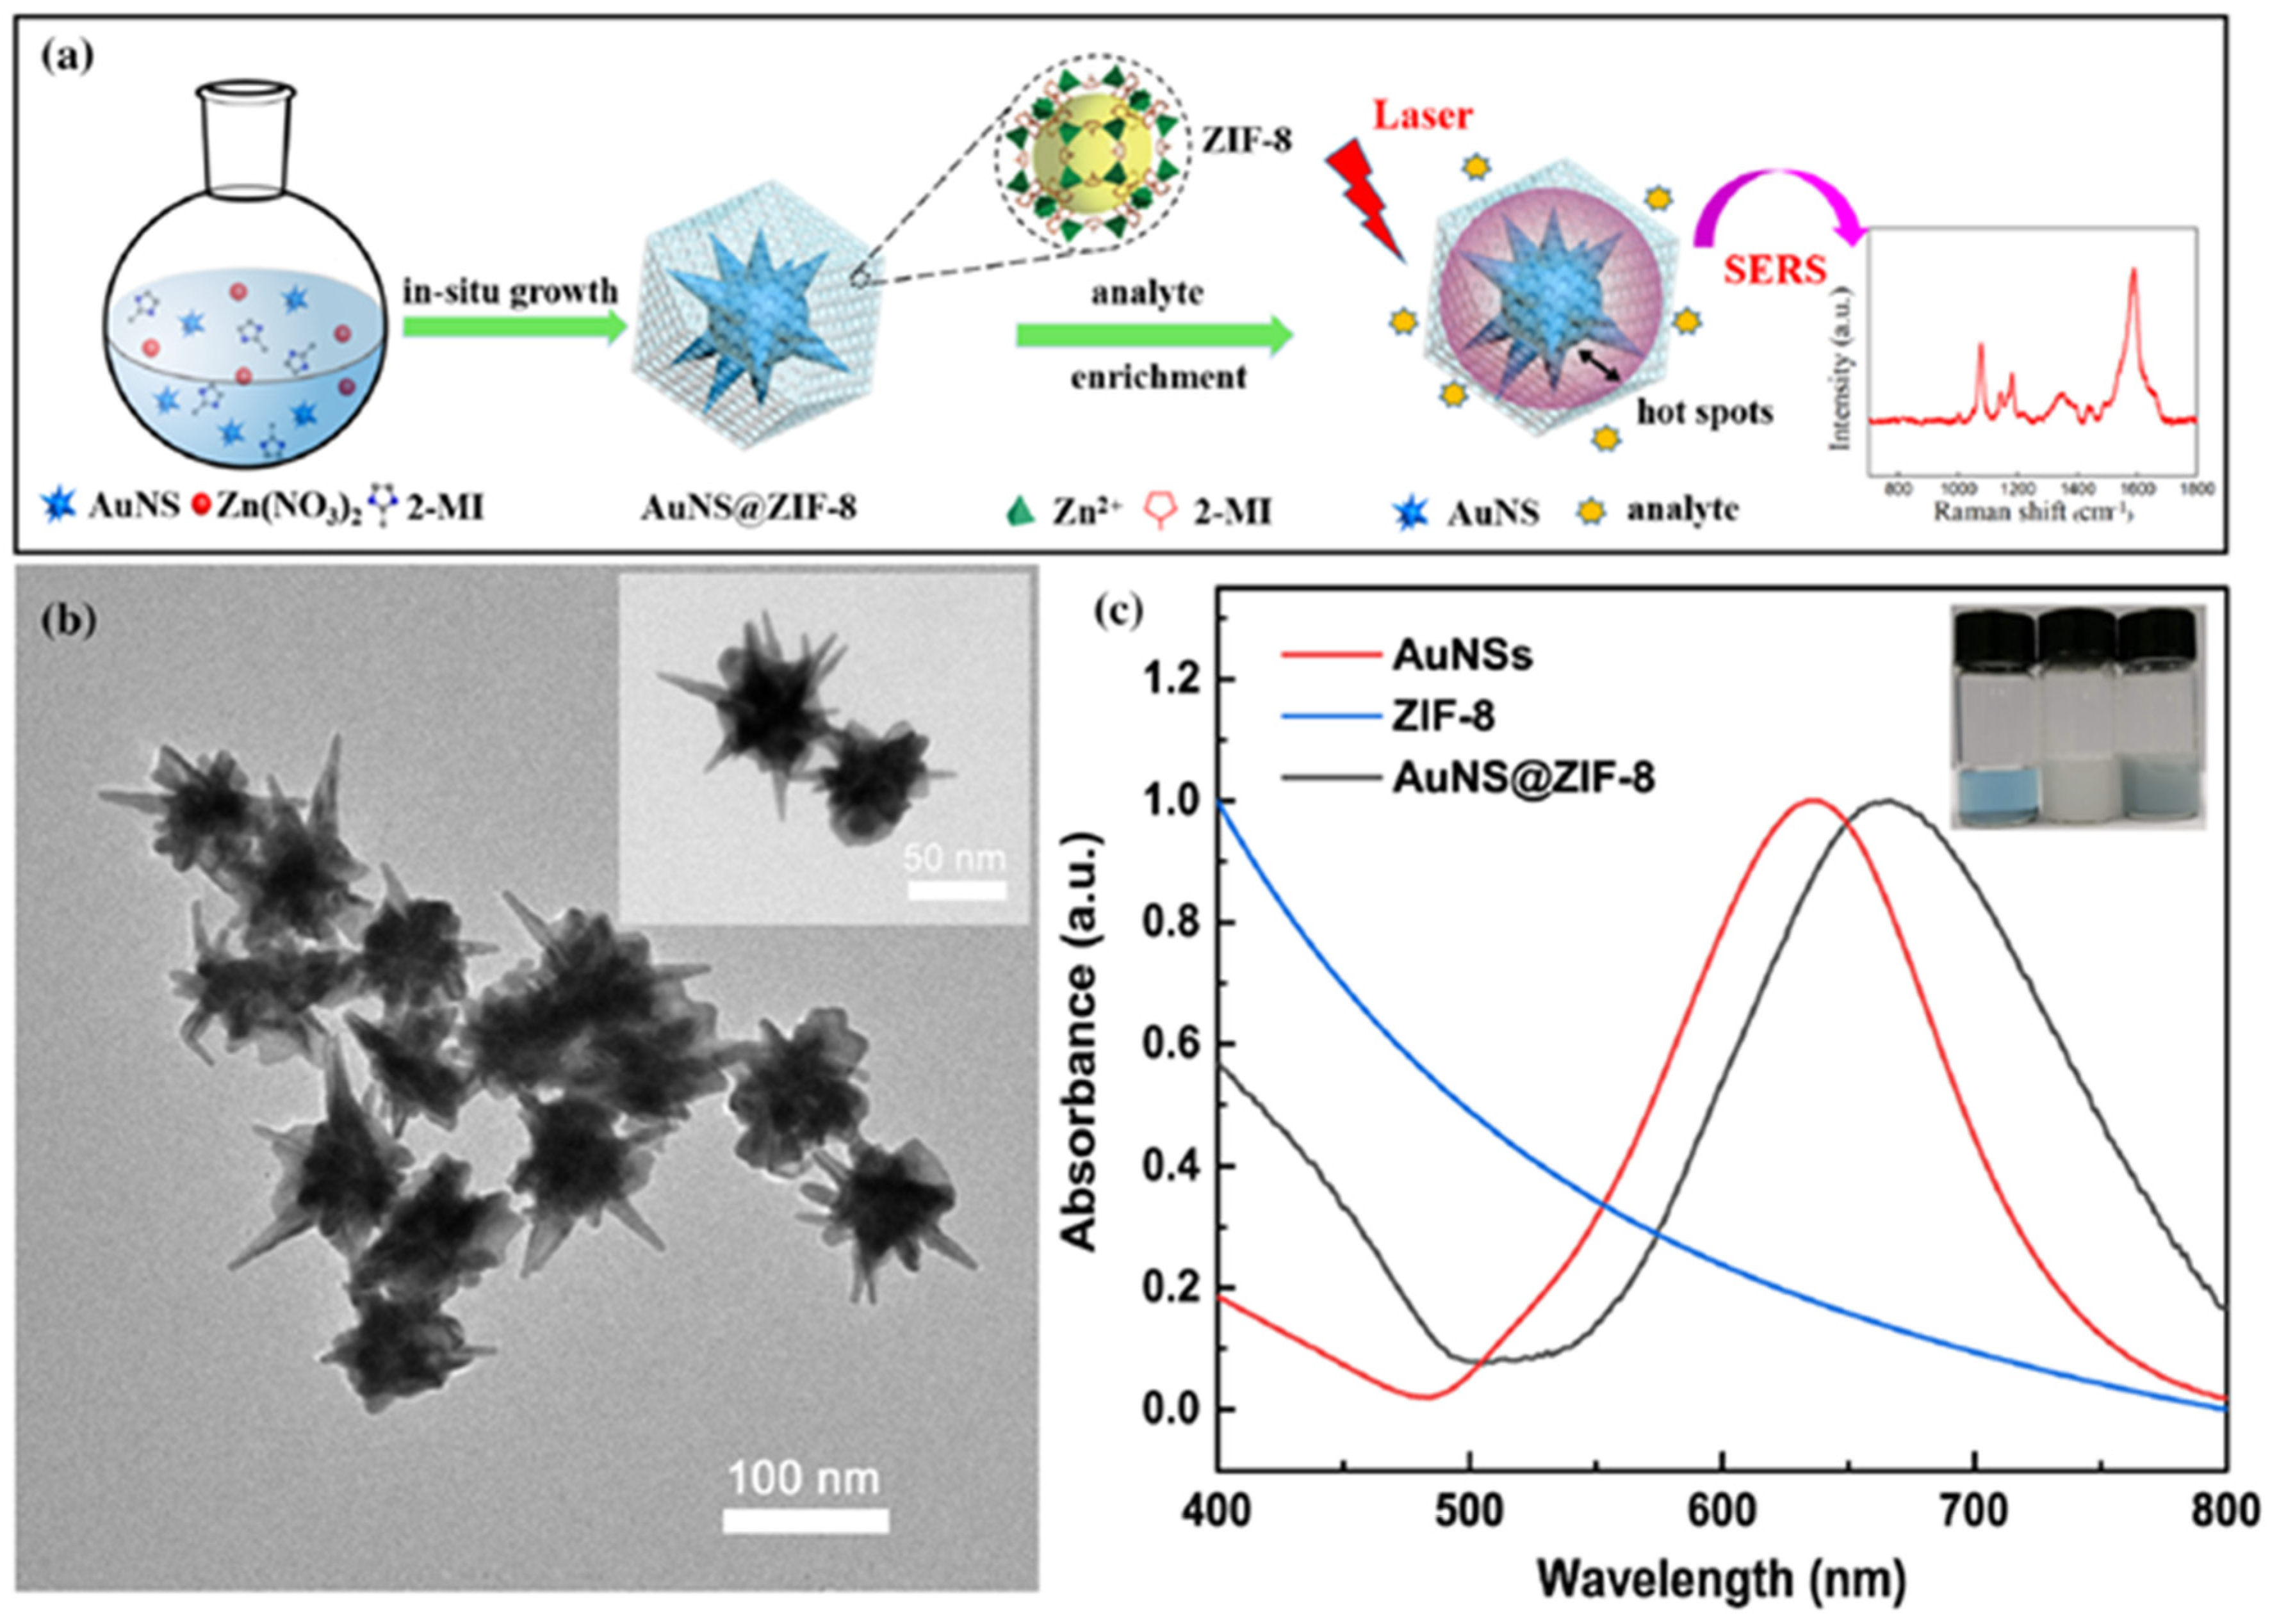
3.3. SERS Biosensors for the Detection of Lung Cancer Biomarkers

The important features of surface-enhanced Raman scattering (SERS), including single molecular detection, multiplex detection capability, ultra-sensitivity, and specificity, have attracted numerous investigations on the detection of lung cancer biomarkers both in gas and liquid phases using SERS biosensors.

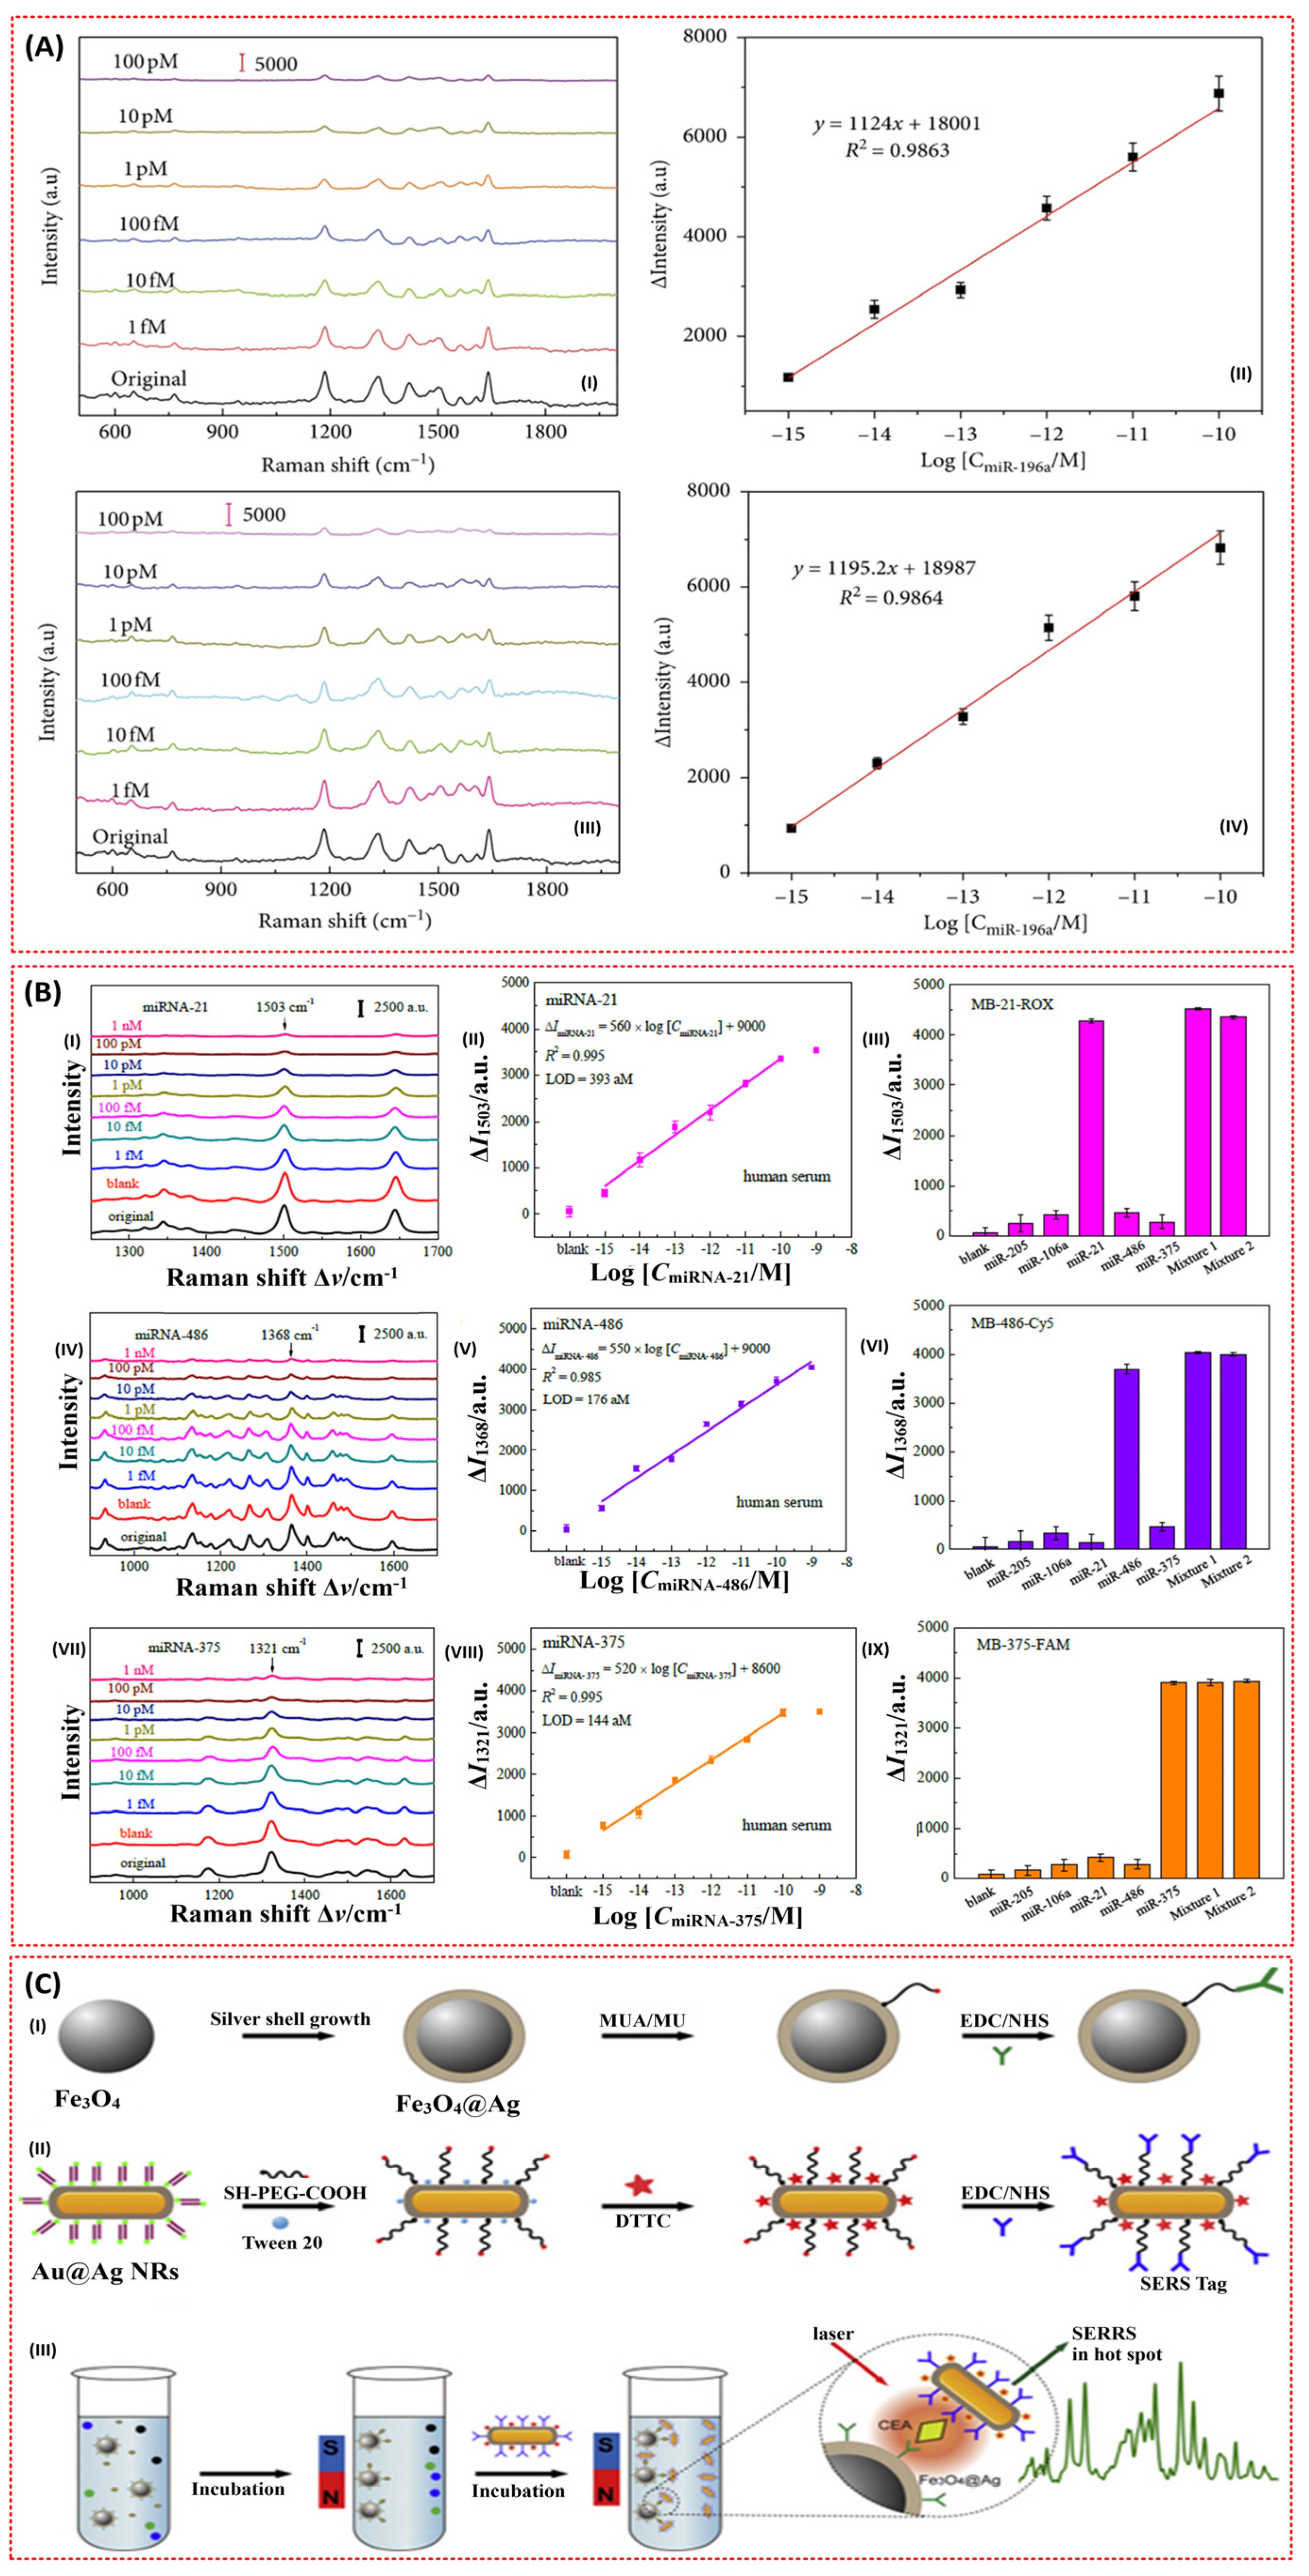
3.3.1. SERS Biosensors for the Detection of miRNA Biomarkers

The detection of lung cancer-related miRNA biomarkers has received limited attention recently. Inspired by the cost effectiveness, flexibility, biocompatibility, and portability of paper-based SERS substrates, Xia et al. developed a SERS technique for the detection of miR-196a based on bimetallic Au-Ag nanowire (AgNW@AuNP) substrates coupled with the target hairpin DNA [115,116,117]. Filter paper was used as the capturing substrate. In addition, the paper was treated with hexadecenyl succinic anhydride hydrophobic and modified with AgNWs@AuNPs in order to prevent the weakening of the paper-based SERS signal due to the hydrophilicity of the filter paper and ensure good sensitivity and reproducibility of the SERS biosensor [117,118]. Consequently, in addition to the attained high sensitivity, specificity, uniformity, and reproducibility of the biosensor; the detection of miR-196a down to 96.58 aM and 130 aM was also achieved in both (phosphate buffer saline) PBS and serum (Figure 11A (I–IV)) [117].
Besides improvement in sensitivity, and the good specificity, uniformity, reproducibility, and stability of miRNA-based SERS biosensors, multiplex detection is also important due to the connection of miRNA with other cancer types, as mentioned earlier. In addition to the multiplex detection capability of SERS, Song et al. incorporated molecular beacons (MBs) and developed a portable and ultrasensitive SERS sensor based on an Ag nanorod array SERS substrate by assembling the special hairpin-shaped molecular beacons (MBs) for the simultaneous detection of miRNA-21, miRNA-486, and miRNA-375 lung cancer biomarkers [38]. The molecular beacons (MBs) were reported to detect specific nucleic acids with a high signal-to-noise ratio and remarkable selectivity [120]. Generally, MBs are capable of restoring their fluorescence upon binding a target nucleic acid sequence [121]. They are also stable, selective, and specific, and can differentiate single base-pair mismatched targets, which are all advantageous to developing a reliable biosensor [38]. The aforementioned features were confirmed through the realisation of the simultaneous detection of miRNA-21, miRNA-486, and miRNA-375 in serum using the SERS sensor array down to 393 aM, 176 aM, and 144 aM, respectively (Figure 11B) [38].

3.3.2. SERS Biosensors for the Detection of Carcinoembryonic Antigen (CEA) Biomarkers

Like other plasmonic CEA biosensors, SERS biosensors employing novel detection strategies and incorporating novel materials have been investigated for the detection of CEA lung cancer biomarkers. The potentiality of super-paramagnetic materials to realise a rapid and highly sensitive detection of analytes due their capability to segregate and enhance analytes from samples with an external magnetic field motivated Rong et al. to develop a SERS-based magnetic immunoassay for the sensitive detection of CEA lung cancer biomarkers [119]. According to the researchers, the problems limiting the incorporation of metal shell-coated MNPs to SERS-based immunoassays such as poor magnetic responsiveness, oxidisation, and aggregation were solved through a novel synthesis of silver shell magnetic nanoparticles (Fe3O4@Ag MNPs) with superparamagnetism and good dispersibility. In brief, the capture antibody-coated silver shell magnetic nanoparticles (Fe3O4@Ag MNPs) serve two functions, including as the signal amplification substrate and as the CEA enhancement medium. Gold nanorods (AuNRs) were also coated with a thin silver shell and modified with detection antibody. The formation of sandwich immune complexes was then realised in the presence of CEA and plasmonic coupling between the Au@Ag NRs and Fe3O4@Ag MNPs was created Figure 11C. Consequently, the biosensor demonstrated the capability of detecting the CEA down to 4.75 fg/mL [119].
The detection of a sandwich immune complex immobilised on a solid substrate has been the most prominent medium for a SERS-based immunoassay. However, the popularity of this strategy is hindered due to prolonged incubation time, the labour-intensive washing of non-specific binding, poor reproducibility, and the reduction of biological activity of immune-reagent components due immobilisation on solid substrate [122]. These issues were resolved by Hyangah et al. by developing a quick and reproducible surface-enhanced Raman scattering (SERS)-based immunoassay technique that uses hollow gold nanospheres (HGNs) and magnetic beads. In this case, the HGNs and magnetic beads serve as the SERS agents and the supporting substrates for the formation of the immune-complex, respectively. In addition, the utilisation of the HGNs solves the overaggregation of silver nanoparticles, which ultimately reduces the reproducibility of the SERS signals [122,123,124]. Moreover, the utilisation of the magnetic beads as the antibody-supporting materials controls the delayed immunoreaction issues caused by the diffusion-limited kinetics on a solid substrate because the reaction happens in solution [122]. Based on this, the biosensor was demonstrated to be about 100–1000 times more sensitive than the enzyme-linked immunosorbent assay.
Recently, a CEA-based SERS biosensor utilising a unique 3D and biocompatible aluminium-based quantum structure (QS) was fabricated and demonstrated the capability of diagnosing cancer at an earlier stage [57].

3.3.3. SERS Biosensors for the Detection of VOC Biomarkers

The molecular detection capability of SERS is a breakthrough in the early diagnosis of lung cancer. However, the potential application of SERS in the detection of lung cancer-related VOCs is hindered due the poor absorptivity and weak Raman scattering of the VOCs [125,126]. As such, investigation into novel SERS substrates and detection strategies is required in order to detect Raman weak-intensity molecules and improve the absorbability of the VOCs on SERS substrates.
Recently, numerous investigations have been conducted in order to address these problems. For example, metal organic frameworks (MOFs) have been coated onto plasmonic nanostructures in various SERS biosensors in order to enhance the adsorption of VOCs [39,125,126]. In that, the MOFs were reported to slow the flow rate of gaseous biomarkers and depress the exponential decay of the electromagnetic field around the surfaces of the plasmonic nanostructures, which resulted in improved absorbability of the VOCs [125,126]. Ultimately, the detection of lung cancer-related VOCs was realised at part per billion (ppb) levels, as shown in Table 6.
Despite the promising features of MOF–SERS substrates in the detection of VOCs, the development of prominent core–shell noble-metal@MOF–SERS substrates is hindered due to the difficulty in enclosing the plasmonic nanostructures (noble metals) into MOFs and controlling the thickness of the MOF shell [126]. Yuzhou et al. revealed a reliable SERS strategy by synthesising an ultrasensitive core shell MOF–SERS substrate to detect a lung cancer-related VOC, gaseous formaldehyde (Figure 12a,b) [126]. In it, a porous zeolitic imidazolate framework-8 (ZIF-8) encloses gold nanostars (AuNSs) and, more importantly, the thickness of the porous ZIF-8 could be managed successfully [126]. Moreover, the ppb detection capability of the gaseous formaldehyde-based SERS biosensor was achieved through a nucleophilic addition reaction with 4-aminothiophenol (4-ATP), which was pre-grafted onto the AuNS@ZIF-8 with a thin shell.
Recently, Fu et al. were able to develop a SERS-based sensory array capable of multiplex detection of volatile organic compounds (VOCs) for the first time using a novel MOFs SERS substrate, MIL-100(Fe), comprised of Fe clusters and 1,3,5-benzenetricarboxylic acid (TMA) [39]. The sensory array possesses the remarkable feature of enabling easy discrimination of various VOCs associated with diverse diseases.
In addition to MOF-based SERS sensing, a dual-mode sensing strategy incorporating fluorescent (FL) and surface-enhanced Raman spectroscopy (SERS) was employed in a move to achieve ultrasensitive detection of volatile benzaldehyde [127]. In that case, a vapour generation paper-based thin-film microextraction (VG–PTFM) platform for FL and SERS sensing of volatile benzaldehyde (BA) was fabricated using core−shell gold nanorod-quantum dot (GNRs-QD)@NU-901 structures [127]. The dual-sensing mode enabled the physical visualisation and quantitative detection of analytes.
Besides MOFs, other novel materials and strategies were also explored. Zhang et al. improved the absorptivity of lung cancer-related VOC aldehyde by creating a dendritic Ag nanocrystal characterised by numerous cavity traps that increase the reaction time of the gaseous molecules on the surface of solid surface through the “cavity-vortex” effect [128]. In another development, novel and renewable hierarchical porous CuFeSe2/Au heterostructure nanospheres were employed in specific and sensitive aldehydes down to 1 ppb [129]. The nanospheres in this case also possess many cavity traps, enabling the gaseous aldehydes to undergo the “cavity vortex effect,” which consequently prolongs the reaction time of the gas on the surface. Moreover, the heterostructure nanosphere features excellent photocatalytic cleaning performance and could provide efficient renewable properties [129].
Generally, the reusability issue hinders the development of exhaled VOC-based SERS biosensors. Reusability for the sensitive SERS-based detection of aldehyde down to 1.35 nM was realised by fabricating a multifunctional Ag NPs@ZIF-67/g-C3N4 solid-phase extraction (SPE) membrane [130]. In this case, the self-cleaning ability of the Ag NPs@ZIF-67/g-C3N4 membrane due to the photocatalytic properties of g-C3N4 is exploited for the realisation of the reusable detection [130].
Moreover, the issue of low enhancement factor (EF) associated with SERS-based trace detection was addressed using a chemical mechanism-based SERS substrate by developing a novel sponge-like Cu-doping SnO2-NiO p-n semiconductor heterostructure (SnO2-NiOx/Cu) [131]. Consequently, an EF of 1.66 × 10¹⁰ attributable to the enhanced charge-separation efficacy of p-n heterojunction and charge transfer resonance from Cu doping as well as ppb level detection of lung cancer VOC biomarkers were realised.

3.3.4. SERS Biosensors for the Detection of Other Biomarkers

Numerous other contributions related to the SERS-based detection of various lung cancer biomarkers have also been reported. For instance, Monica et al. utilised a modified core-shell strategy by designing a SERS nanotag. The nanotag was designed by anchoring a strong Raman active molecule (the reporter molecule), para-aminothiophenol (p-ATP), onto the surface of a silver nanotriangle through silver–sulphur interactions. Thereafter, the silver nanoparticles were enclosed in chitosan (Chit-AgNT) for the non-invasive SERS imaging of lung cancer cells (A549) under multiple wavelength excitations [58]. In this case, the chitosan hampers the aggregation of the silver nanotriangles and ensures their biocompatibility [132]. A few years later, another group developed another non-invasive means of detecting a lung cancer biomarker, adenosine, based on a magnetically assisted surface enhanced Raman scattering (SERS) protocol using Fe3O4/Au/Ag nanocomposites weaved and stabilised by phytic acid and its sodium salt. Based on this procedure, a trace level of adenosine was tested in urine samples from both lung cancer patients and healthy humans. In addition to the non-invasive nature of this procedure, excellent sensitivity, stability, reproducibility, and time efficiency have also been reported [132]. Recently, label-free detection of adenosine was achieved using a flexible polyamide–Ag hybrid nanoarray film [133]. Adenosine detection down to 9.83 × 10¹⁰ M was achieved after the introduction of 4-mercaptophenylboronic acid-modified AgNPs, which led to the formation of Ag-adenosine-Ag molecular bridges via the boronate affinity technique [133].
In addition, the prominent sandwich SERS sensing technique based on Raman intensity variation faces has diminished specificity and sensitivity issues. These usually originate from the pronounced nonspecific adsorption related to bulkiness and the requirement of multiple reaction steps. Recently, a frequency-shift-based SERS method was employed in solving the problems [134]. A DNA-Rn1-DNA-mediated surface-enhanced Raman scattering frequency shift assay was developed that enables sensitive and non-invasive detection of circulating tumour DNA (ctDNA) down to the sub-femtomolar level with one single base pair mutation (KARS G12D mutation) from the normal ones (KARS G12D normal) of lung cancer. Moreover, a designed hairpin DNA-Rn1-DNA probe served as specific ctDNA recogniser and signal amplification was achieved by hydrolysing a DNA-Rn1-DNA/ctDNA hybrid by an Rnase HII enzyme [134].
In another development, the poor repeatability of dealloyed nanoporous metals during single molecular detection has been reported to originate from the lack of proper control of structural parameters such as pore geometry and order [135]. Wen et al. demonstrated improved repeatability by developing a renewable sensor with photocatalytic activity based on CuFeSe2/Au heterostructure nanospheres for the specific and sensitive detection of A549 lung cancer cells [129].
In addition, non-invasive diagnosis of lung cancer can be achieved through the analysis of phosphoproteins stored in exosomes [136]. Unfortunately, the detection of exosomes, especially in the label-free format, is greatly hindered due to the obvious failure and difficulty of coordinating the interaction of laser, sample, and SERS substrate, which collectively determine the SERS signal [137]. More recently, a three-dimensional (3D) gold (Au)-coated TiO2 beehive-like icroporous inverse opal (MIO) structure that can perfectly coordinate the interaction of the laser, sample, and SERS substrate was developed [137]. The structure was reported to serve as a perfect trap for exosomes and improves the Raman signals of exosomes due to the SERS effect and slow light effect of the TiO2 MIO structures [137,138].
Investigations on the detection of lung cancer biomarkers using SERS biosensors are summarised in Table 6.

4. Conclusions and Future Outlook

In this review, the rapid progress of plasmonic biosensor technology for the detection of lung cancer biomarkers was reported. Plasmonic biosensors including SPR, LSPR, and SERS biosensors have demonstrated promising applicability for the detection of diverse lung cancer biomarkers with good sensitivity and specificity for the diagnosis and monitoring of the lung cancer at its early stage. This has been achieved by following a series of novel surface modifications and adopting a variety of novel detection strategies. Despite the capability of the three types of plasmonic biosensors to detect the lung carcer biomarkers, many issues need to be addressed before these techniques can be applied outside laboratory environments. For instance, the detection systems for most of the available plasmonic biosensors are bulky, making the realisation of point-of-care testing (POCT) and the likes difficult. As such, the miniaturisation aspect also needs attention, in addition to the development of novel sensing layer materials, detection strategies, and the improvement of existing detection strategies. The detection of VOCs in human exhaled breath is also expected to provide more promising non-invasive means of lung cancer diagnosis compared to other biomarkers. However, the detection of VOCs using plasmonic sensors is lacking, especially in the case of SPR and LSPR techniques. Thus, the surface of these biosensors is encouraged to be engineered in order to increase its interaction with gaseous analytes and small molecules. Moreover, some of the investigated biomarkers are related to the occurrence of other cancer types and diseases. As such, vigorous research is still required in order to come up with specific biomarkers related to lung cancer. It is hoped that addressing these problems and studying this review will help foster further research in the detection of lung cancer biomarkers using plasmonic biosensors.

Author Contributions

Conceptualization, F.U. and J.O.D.; software, F.U. and A.A.; validation, J.O.D., F.M., Z.U.Z. and A.I.A.; investigation, F.U. and O.A.; resources, Z.U.Z. and M.B.; writing—original draft preparation, F.U.; writing—review and editing, J.O.D., F.M., O.A. and K.H.I.; visualization, A.A., M.K.M.A. and M.B.; supervision, J.O.D. and F.M.; project administration, A.I.A., O.A., K.H.I. and M.K.M.A.; funding acquisition, A.I.A., O.A. and K.H.I. All authors have read and agreed to the published version of the manuscript.

Funding

This work was funded by the Deanship of Scientific Research at Imam Mohammad Ibn Saud Islamic University, Saudi Arabia, through research group no. RG-21-09-50.

Institutional Review Board Statement

Not applicable.

Informed Consent Statement

Not applicable.

Data Availability Statement

Not applicable.

Acknowledgments

The authors extend their appreciation to the Deanship of Scientific Research at Imam Mohammad Ibn Saud Islamic University for funding this work through research group no. RG-21-09-50. The authors would also like to thank Universiti Teknologi PETRONAS Malaysia for the provision of the required technical support.

Conflicts of Interest

The authors declare no conflict of interest.

References

  1. Available online: https://www.chestnet.org/News/CHEST-News/2020/07/World-Lung-Cancer-Day-2020-Fact-Sheet (accessed on 25 September 2021).
  2. Jia, Z.; Patra, A.; Kutty, V.K.; Venkatesan, T. Critical review of volatile organic compound analysis in breath and in vitro cell culture for detection of lung cancer. Metabolites 2019, 9, 52. [Google Scholar] [CrossRef] [PubMed] [Green Version]
  3. Available online: https://gco.iarc.fr/today/data/factsheets/populations/682-saudi-arabia-fact-sheets.pdf (accessed on 28 September 2021).
  4. Rudnicka, J.; Kowalkowski, T.; Buszewski, B. Searching for selected VOCs in human breath samples as potential markers of lung cancer. Lung Cancer 2019, 135, 123–129. [Google Scholar] [CrossRef] [PubMed]
  5. Khanmohammadi, A.; Aghaie, A.; Vahedia, E.; Qazvini, A.; Ghanei, M.; Afkhami, A.; Hajian, A.; Bagheri, H. Electrochemical biosensors for the detection of lung cancer biomarkers: A review. Talanta 2020, 206, 120251. [Google Scholar] [CrossRef] [PubMed]
  6. Davis, J.N.; Medbery, C.; Sharma, S.; Pablo, J.; Kimsey, F.; Perry, D.; Muacevic, A.; Mahadevan, A. Stereotactic body radiotherapy for centrally located early-stage non-small cell lung cancer or lung metastases from the RSSearch® patient registry. Radiat. Oncol. 2015, 10, 113. [Google Scholar] [CrossRef] [Green Version]
  7. Wang, L. Screening and biosensor-based approaches for lung cancer detection. Sensors 2017, 17, 2420. [Google Scholar] [CrossRef] [PubMed] [Green Version]
  8. Altintas, Z.; Uludag, Y.; Gurbuz, Y.; Tothill, I.E. Surface plasmon resonance based immunosensor for the detection of the cancer biomarker carcinoembryonic antigen. Talanta 2011, 86, 377–383. [Google Scholar] [CrossRef] [Green Version]
  9. Ghosal, R.; Kloer, P.; Lewis, K. A review of novel biological tools used in screening for the early detection of lung cancer. Postgrad. Med. J. 2009, 85, 358–363. [Google Scholar] [CrossRef]
  10. Saalberg, Y.; Wolff, M. VOC breath biomarkers in lung cancer. Clin. Chim. Acta 2016, 459, 5–9. [Google Scholar] [CrossRef]
  11. Fourkala, E.-O.; Blyuss, O.; Field, H.; Gunu, R.; Ryan, A.; Barth, J.; Jacobs, I.; Zaikin, A.; Dawnay, A.; Menon, U. Sex hormone measurements using mass spectrometry and sensitive extraction radioimmunoassay and risk of estrogen receptor negative and positive breast cancer: Case control study in UK Collaborative Cancer Trial of Ovarian Cancer Screening (UKCTOCS). Steroids 2016, 110, 62–69. [Google Scholar] [CrossRef]
  12. Arya, S.K.; Bhansali, S. Lung cancer and its early detection using biomarker-based biosensors. Chem. Rev. 2011, 111, 6783–6809. [Google Scholar] [CrossRef]
  13. Roointan, A.; Ahmad, T.; Wani, S.I.; Rehman, M.-U.; Hussain, K.K.; Ahmed, B.; Abrahim, S.; Savardashtaki, A.; Gandomani, G.; Gandomani, M.; et al. Early detection of lung cancer biomarkers through biosensor technology: A review. J. Pharm. Biomed. Anal. 2019, 164, 93–103. [Google Scholar] [CrossRef]
  14. Zhou, J.; Huang, Z.-A.; Kumar, U.; Chen, D.D.Y. Review of recent developments in determining volatile organic compounds in exhaled breath as biomarkers for lung cancer diagnosis. Anal. Chim. Acta 2017, 996, 1–9. [Google Scholar] [CrossRef]
  15. Busze Buszewski, B.; Ligor, T.; Jezierski, T.; Piesik, A.W.; Walczak, M.; Rudnicka, J. Identification of volatile lung cancer markers by gas chromatography—Mass spectrometry: Comparison with discrimination by canines. Anal. Bioanal. Chem. 2012, 404, 141–146. [Google Scholar] [CrossRef] [PubMed] [Green Version]
  16. Shabaninejada, Z.; Yousefi, F.; Movahedpour, A.; Ghasemi, Y.; Dokanehiifard, S.; Rezaei, S.; Aryan, R.; Savardashtaki, A.; Mirzaei, H. Electrochemical-based biosensors for microRNA detection: Nanotechnology comes into view. Anal. Biochem. 2019, 581, 113349. [Google Scholar] [CrossRef]
  17. Zhang, Y.; Yang, D.; Weng, L.; Wang, L. Early lung cancer diagnosis by biosensors. Int. J. Mol. Sci. 2013, 14, 15479–15509. [Google Scholar] [CrossRef] [PubMed]
  18. Lou, J.; Wang, Y.; Tong, L. Microfiber optical sensors: A review. Sensors 2014, 14, 5823–5844. [Google Scholar] [CrossRef] [Green Version]
  19. Gauglitz, G. Direct optical sensors: Principles and selected applications. Anal. Bioanal. Chem. 2005, 381, 141–155. [Google Scholar] [CrossRef] [PubMed]
  20. Fraden, J. Handbook of Modern Sensors; Springer: Berlin/Heidelberg, Germany, 2010. [Google Scholar]
  21. Tuchin, V.V. Handbook of Optical Sensing of Glucose in Biological Fluids and Tissues; CRC Press: Boca Raton, FL, USA, 2008. [Google Scholar]
  22. Santos, J.L.; Farahi, F. Handbook of Optical Sensors; CRC Press: Boca Raton, FL, USA, 2014. [Google Scholar]
  23. Chen, X.; Wong, C.K.; Yuan, C.A.; Zhang, G. Nanowire-based gas sensors. Sens. Actuators B Chem. 2013, 177, 178–195. [Google Scholar] [CrossRef]
  24. Tabassum, R.; Mishra, S.K.; Gupta, B.D. Surface plasmon resonance-based fiber optic hydrogen sulphide gas sensor utilizing Cu–ZnO thin films. Phys. Chem. Chem. Phys. 2013, 15, 11868–11874. [Google Scholar] [CrossRef]
  25. Ahuja, D.; Parande, D. Optical sensors and their applications. J. Sci. Res. Rev. 2012, 1, 060–068. [Google Scholar]
  26. Gramotnev, D.K.; Bozhevolnyi, S.I. Plasmonics beyond the diffraction limit. Nat. Photonics 2010, 4, 83–91. [Google Scholar] [CrossRef]
  27. Barizuddin, S.; Bok, S.; Gangopadhyay, S. Plasmonic sensors for disease detection-a review. J. Nanomed. Nanotechnol. 2016, 7, 1000373. [Google Scholar]
  28. Cathcart, N.; Chen, J.I.L. Sensing biomarkers with plasmonics. Anal. Chem. 2020, 92, 7373–7381. [Google Scholar] [CrossRef] [PubMed]
  29. Wang, Y.; Zhu, X.; Wu, M.; Xia, N.; Wang, J.; Zhou, F. Simultaneous and label-free determination of wild-type and mutant p53 at a single surface plasmon resonance chip preimmobilized with consensus DNA and monoclonal antibody. Anal. Chem. 2009, 81, 8441–8446. [Google Scholar] [CrossRef]
  30. Kajikawa, K. Sensing Based on Localized Surface Plasmon Resonance in Metallic Nanoparticles. In Nanoparticle Technology Handbook; Elsevier: Amsterdam, The Netherlands, 2018; pp. 631–633. [Google Scholar]
  31. Barozzi, M.; Manicardi, A.; Vannucci, A.; Candiani, A.; Sozzi, M.; Konstantaki, M.; Pissadakis, S.; Corradini, R.; Selleri, S.; Cucinotta, A. Optical fiber sensors for label-free DNA detection. J. Light. Technol. 2016, 35, 3461–3472. [Google Scholar] [CrossRef]
  32. Wang, F.; Anderson, M.; Bernards, M.T.; Hunt, H.K. PEG functionalization of whispering gallery mode optical microresonator biosensors to minimize non-specific adsorption during targeted, label-free sensing. Sensors 2015, 15, 18040–18060. [Google Scholar] [CrossRef] [Green Version]
  33. Verschueren, D.V.; Pud, S.; Shi, X.; De Angelis, L.; Kuipers, L.; Dekker, C. Label-free optical detection of DNA translocations through plasmonic nanopores. ACS Nano 2018, 13, 61–70. [Google Scholar] [CrossRef]
  34. Shrivastav, A.M.; Cvelbar, U.; Abdulhalim, I. A comprehensive review on plasmonic-based biosensors used in viral diagnostics. Commun. Biol. 2021, 4, 1–12. [Google Scholar] [CrossRef]
  35. Qiu, G.; Gai, Z.; Tao, Y.; Schmitt, J.; Kullak-Ublick, G.A.; Wang, J.J. Dual-functional plasmonic photothermal biosensors for highly accurate severe acute respiratory syndrome coronavirus 2 detection. ACS Nano 2020, 14, 5268–5277. [Google Scholar] [CrossRef] [Green Version]
  36. Ahmadivand, A.; Gerislioglu, B.; Ramezani, Z.; Kaushik, A.; Manickam, P.; Ghoreishi, S.A. Functionalized terahertz plasmonic metasensors: Femtomolar-level detection of SARS-CoV-2 spike proteins. Biosens. Bioelectron. 2021, 177, 112971. [Google Scholar] [CrossRef]
  37. Kim, D.M.; Park, J.S.; Jung, S.-W.; Yeom, J.; Yoo, S.M. Biosensing applications using nanostructure-based localized surface plasmon resonance sensors. Sensors 2021, 21, 3191. [Google Scholar] [CrossRef] [PubMed]
  38. Song, C.Y.; Yang, Y.J.; Yang, B.Y.; Sun, Y.Z.; Zhao, Y.P.; Wang, L.H. An ultrasensitive SERS sensor for simultaneous detection of multiple cancer-related miRNAs. Nanoscale 2016, 8, 17365–17373. [Google Scholar] [CrossRef]
  39. Fu, J.-H.; Zhong, Z.; Xie, D.; Guo, Y.-J.; Kong, D.-X.; Zhao, Z.-X.; Zhao, Z.-X.; Li, M. SERS-Active MIL-100 (Fe) Sensory Array for Ultrasensitive and Multiplex Detection of VOCs. Angewandte Chemie 2020, 132, 20670–20679. [Google Scholar] [CrossRef]
  40. Kooyman, R.P. Physics of surface plasmon resonance. In Handbook of Surface Plasmon Resonance 1; Royal Society of Chemistry: Cambridge, UK, 2008. [Google Scholar]
  41. Tang, Y.; Zeng, X.; Liang, J. Surface plasmon resonance: An introduction to a surface spectroscopy technique. J. Chem. Educ. 2010, 87, 742–746. [Google Scholar] [CrossRef] [PubMed] [Green Version]
  42. Usman, F.; Dennis, J.O.; Seong, K.C.; Ahmed, A.Y.; Ferrell, T.L.; Fen, Y.W.; Sadrolhosseini, A.R.; Ayodele, O.B.; Meriaudeau, F.; Saidu, A. Enhanced Sensitivity of Surface Plasmon Resonance Biosensor Functionalized with Doped Polyaniline Composites for the Detection of Low-Concentration Acetone Vapour. J. Sens. 2019, 2019, 5786105. [Google Scholar] [CrossRef] [Green Version]
  43. Gupta, B.D.; Pathak, A.; Semwal, V. Carbon-based nanomaterials for plasmonic sensors: A review. Sensors 2019, 19, 3536. [Google Scholar] [CrossRef] [Green Version]
  44. Yao, Y.; Yi, B.; Xiao, J.; Li, Z. Surface plasmon resonance biosensors and its application. In Proceedings of the 2007 1st International Conference on Bioinformatics and Biomedical Engineering, Wuhan, China, 6–8 July 2007; pp. 1043–1046. [Google Scholar]
  45. Mukhtar, W.; Menon, P.S.; Shaari, S.; Malek, M.; Abdullah, A. Angle shifting in surface plasmon resonance: Experimental and theoretical verification. J. Phys. Conf. Ser. 2013, 431, 012028. [Google Scholar] [CrossRef]
  46. Nivedha, S.; Babu, P.R.; Senthilnathan, K. Surface plasmon resonance: Physics and technology. Curr. Sci. 2018, 115, 00113891. [Google Scholar] [CrossRef]
  47. Prabowo, B.A.; Purwidyantri, A.; Liu, K.-C. Surface plasmon resonance optical sensor: A review on light source technology. Biosensors 2018, 8, 80. [Google Scholar] [CrossRef] [Green Version]
  48. Wijaya, E.; Lenaerts, C.; Maricot, S.; Hastanin, J.; Habraken, S.; Vilcot, J.-P.; Boukherroub, R.; Szunerits, S. Surface plasmon resonance-based biosensors: From the development of different SPR structures to novel surface functionalization strategies. Curr. Opin. Solid State Mater. Sci. 2011, 15, 208–224. [Google Scholar] [CrossRef]
  49. Kurihara, K.; Suzuki, K. Theoretical understanding of an absorption-based surface plasmon resonance sensor based on Kretchmann’s theory. Anal. Chem. 2002, 74, 696–701. [Google Scholar] [CrossRef] [PubMed]
  50. Ozdemir, S.; Turhan-Sayan, G. Temperature effects on surface plasmon resonance: Design considerations for an optical temperature sensor. J. Lightwave Technol. 2003, 21, 805. [Google Scholar] [CrossRef]
  51. Srivastava, S.K.; Verma, R.; Gupta, B.D. Theoretical modeling of a self-referenced dual mode SPR sensor utilizing indium tin oxide film. Opt. Commun. 2016, 369, 131–137. [Google Scholar] [CrossRef]
  52. Ferhan, A.R.; Jackman, J.A.; Park, J.H.; Cho, N.-J.; Kim, D.-H. Nanoplasmonic sensors for detecting circulating cancer biomarkers. Adv. Drug Deliv. Rev. 2018, 125, 48–77. [Google Scholar] [CrossRef] [PubMed]
  53. Long, Y.-T.; Jing, C. Localized Surface Plasmon Resonance Based Nanobiosensors; Springer: Berlin/Heidelberg, Germany, 2014. [Google Scholar]
  54. Alharbi, R.; Irannejad, M.; Yavuz, M. A short review on the role of the metal-graphene hybrid nanostructure in promoting the localized surface plasmon resonance sensor performance. Sensors 2019, 19, 862. [Google Scholar] [CrossRef] [Green Version]
  55. Hong, Y.; Huh, Y.-M.; Yoon, D.S.; Yang, J. Nanobiosensors based on localized surface plasmon resonance for biomarker detection. J. Nanomater. 2012, 2012, 111. [Google Scholar] [CrossRef] [Green Version]
  56. Pérez-Juste, J.; Pastoriza-Santos, I.; Liz-Marzán, L.M.; Mulvaney, P. Gold nanorods: Synthesis, characterization and applications. Coord. Chem. Rev. 2005, 249, 1870–1901. [Google Scholar] [CrossRef]
  57. Ganesan, S.; Venkatakrishnan, K.; Tan, B. Wrinkled metal based quantum sensor for In vitro cancer diagnosis. Biosens. Bioelectron. 2020, 151, 111967. [Google Scholar] [CrossRef]
  58. Potara, M.; Boca, S.; Licarete, E.; Damert, A.; Alupei, M.-C.; Chiriac, M.T.; Popescu, O.; Schmidt, U.; Astilean, S. Chitosan-coated triangular silver nanoparticles as a novel class of biocompatible, highly sensitive plasmonic platforms for intracellular SERS sensing and imaging. Nanoscale 2013, 5, 6013–6022. [Google Scholar] [CrossRef]
  59. Langer, J.; Aberasturi, D.J.D.; Aizpurua, J.; Alvarez-Puebla, R.A.; Auguié, B.; Baumberg, J.J.; Bazan, G.C.; Bell, S.E.J.; Boisen, A.; Brolo, A.G. Present and future of surface-enhanced Raman scattering. ACS Nano 2019, 14, 28–117. [Google Scholar] [CrossRef] [Green Version]
  60. Ambros, V.; Bartel, B.; Bartel, D.P.; Burge, C.B.; Carrington, J.C.; Chen, X.; Dreyfuss, G.; Eddy, S.R.; Griffiths-Jones, S.; Marshall, M. A uniform system for microRNA annotation. RNA 2003, 9, 277–279. [Google Scholar] [CrossRef] [PubMed] [Green Version]
  61. Wahid, F.; Shehzad, A.; Khan, T.; Kim, Y.Y. MicroRNAs: Synthesis, mechanism, function, and recent clinical trials. Biochim. Biophys. Acta 2010, 1803, 1231–1243. [Google Scholar] [CrossRef] [Green Version]
  62. Qian, S.; Lin, M.; Ji, W.; Yuan, H.; Zhang, Y.; Jing, Z.; Zhao, J.; Masson, J.-F.; Peng, W. Boronic acid functionalized Au nanoparticles for selective microRNA signal amplification in fiber-optic surface plasmon resonance sensing system. ACS Sensors 2018, 3, 929–935. [Google Scholar] [CrossRef] [PubMed]
  63. Xue, T.; Liang, W.; Li, Y.; Sun, Y.; Xiang, Y.; Zhang, Y.; Dai, Z.; Duo, Y.; Wu, L.; Qi, K. Ultrasensitive detection of miRNA with an antimonene-based surface plasmon resonance sensor. Nat. Commun. 2019, 10, 1–9. [Google Scholar] [CrossRef]
  64. Singh, M.K.; Pal, S.; Prajapati, Y.; Saini, J. Highly sensitive antimonene based SPR biosensor for miRNA detection. Mater. Today Proc. 2020, 28, 1776–1780. [Google Scholar] [CrossRef]
  65. Nie, W.; Wang, Q.; Zou, L.; Zheng, Y.; Liu, X.; Yang, X.; Wang, K. Low-fouling surface plasmon resonance sensor for highly sensitive detection of microRNA in a complex matrix based on the DNA tetrahedron. Anal. Chem. 2018, 90, 12584–12591. [Google Scholar] [CrossRef] [PubMed]
  66. Ding, X.; Yan, Y.; Li, S.; Zhang, Y.; Cheng, W.; Cheng, Q.; Ding, S. Surface plasmon resonance biosensor for highly sensitive detection of microRNA based on DNA super-sandwich assemblies and streptavidin signal amplification. Anal. Chim. Acta 2015, 874, 59–65. [Google Scholar] [CrossRef]
  67. Mujica, M.L.; Zhang, Y.; Bédioui, F.; Gutiérrez, F.; Rivas, G. Label-free graphene oxide–based SPR genosensor for the quantification of microRNA21. Anal. Bioanal. Chem. 2020, 412, 3539–3546. [Google Scholar] [CrossRef]
  68. Li, R.; Feng, F.; Chen, Z.-Z.; Bai, Y.-F.; Guo, F.-F.; Wu, F.-Y.; Zhou, G. Sensitive detection of carcinoembryonic antigen using surface plasmon resonance biosensor with gold nanoparticles signal amplification. Talanta 2015, 140, 143–149. [Google Scholar] [CrossRef]
  69. Teotia, P.K.; Kaler, R. 1-D grating based SPR biosensor for the detection of lung cancer biomarkers using Vroman effect. Opt. Commun. 2018, 406, 188–191. [Google Scholar] [CrossRef]
  70. Zhou, J.; Tao, F.; Zhu, J.; Lin, S.; Wang, Z.; Wang, X.; Ou, J.-Y.; Li, Y.; Liu, Q.H. Portable tumor biosensing of serum by plasmonic biochips in combination with nanoimprint and microfluidics. Nanophotonics 2019, 8, 307–316. [Google Scholar] [CrossRef]
  71. Ono, A.; Takahashi, T.; Mori, K.; Akamatsu, H.; Shukuya, T.; Taira, T.; Kenmotsu, H.; Naito, T.; Murakami, H.; Nakajima, T. Prognostic impact of serum CYFRA 21–1 in patients with advanced lung adenocarcinoma: A retrospective study. BMC Cancer 2013, 13, 1–10. [Google Scholar] [CrossRef] [PubMed] [Green Version]
  72. Chiu, N.-F.; Yang, H.-T. High-sensitivity detection of the lung cancer biomarker CYFRA21-1 in serum samples using a Carboxyl-MoS2 functional film for SPR-based immunosensors. Front. Bioeng. Biotechnol. 2020, 8, 234. [Google Scholar] [CrossRef] [PubMed] [Green Version]
  73. Wang, H.; Wang, X.; Wang, J.; Fu, W.; Yao, C. A SPR biosensor based on signal amplification using antibody-QD conjugates for quantitative determination of multiple tumor markers. Sci. Rep. 2016, 6, 1–9. [Google Scholar] [CrossRef]
  74. Ribaut, C.; Voisin, V.; Malachovská, V.; Dubois, V.; Mégret, P.; Wattiez, R.; Caucheteur, C. Small biomolecule immunosensing with plasmonic optical fiber grating sensor. Biosens. Bioelectron. 2016, 77, 315–322. [Google Scholar] [CrossRef]
  75. Chiu, N.-F.; Lin, T.-L.; Kuo, C.-T. Highly sensitive carboxyl-graphene oxide-based surface plasmon resonance immunosensor for the detection of lung cancer for cytokeratin 19 biomarker in human plasma. Sens. Actuators B Chem. 2018, 265, 264–272. [Google Scholar] [CrossRef]
  76. Ribaut, C.; Voisin, V.; Malachovská, V.; Dubois, V.; Mégret, P.; Wattiez, R.; Caucheteur, C. Cancer biomarker sensing using packaged plasmonic optical fiber gratings: Towards in vivo diagnosis. Biosens. Bioelectron. 2017, 92, 449–456. [Google Scholar] [CrossRef]
  77. Loyez, M.; Larrieu, J.-C.; Chevineau, S.; Remmelink, M.; Leduc, D.; Bondue, B.; Lambert, P.; Devière, J.; Wattiez, R.; Caucheteur, C. In situ cancer diagnosis through online plasmonics. Biosens. Bioelectron. 2019, 131, 104–112. [Google Scholar] [CrossRef] [Green Version]
  78. Cainap, C.; Pop, L.A.; Balacescu, O.; Cainap, S.S. Early diagnosis and screening in lung cancer. Am. J. Cancer Res. 2020, 10, 1993. [Google Scholar] [PubMed]
  79. Horvath, I.; Lazar, Z.; Gyulai, N.; Kollai, M.; Losonczy, G. Exhaled biomarkers in lung cancer. Eur. Respir. J. 2009, 34, 261–275. [Google Scholar] [CrossRef]
  80. Mehta, B.; Benkstein, K.D.; Semancik, S.; Zaghloul, M.E. Gas sensing with bare and graphene-covered optical nano-antenna structures. Sci. Rep. 2016, 6, 1–10. [Google Scholar] [CrossRef]
  81. Zhao, Y.; Zaghloul, M.; Lilach, Y.; Benkstein, K.; Semancik, S. Metal Organic Framework-Coated Optical VOC Gas Sensor. In Proceedings of the 2018 IEEE Photonics Conference (IPC), Reston, VA, USA, 30 September–4 October 2018; pp. 1–2. [Google Scholar]
  82. Sudheer, V.; Kumar, S.S.; Sankararaman, S. Ultrahigh Sensitivity Surface Plasmon Resonance–Based Fiber-Optic Sensors Using Metal-Graphene Layers with Ti3C2Tx MXene Overlayers. Plasmonics 2020, 15, 457–466. [Google Scholar] [CrossRef]
  83. Li, Y.; Zhang, Y.; Qiu, F.; Qiu, Z. Proteomic identification of exosomal LRG1: A potential urinary biomarker for detecting NSCLC. Electrophoresis 2011, 32, 1976–1983. [Google Scholar] [CrossRef] [PubMed]
  84. Liu, C.; Zeng, X.; An, Z.; Yang, Y.; Eisenbaum, M.; Gu, X.; Jornet, J.M.; Dy, G.K.; Reid, M.E.; Gan, Q.; et al. Sensitive detection of exosomal proteins via a compact surface plasmon resonance biosensor for cancer diagnosis. ACS Sensors 2018, 3, 1471–1479. [Google Scholar] [CrossRef]
  85. Mohammadzadeh-Asl, S.; Aghanejad, A.; de la Guardia, M.; Dolatabadi, J.E.N.; Keshtkar, A. Surface plasmon resonance signal enhancement based on erlotinib loaded magnetic nanoparticles for evaluation of its interaction with human lung cancer cells. Opt. Laser Technol. 2021, 133, 106521. [Google Scholar] [CrossRef]
  86. Wang, Y.; Zeng, S.; Crunteanu, A.; Xie, Z.; Humbert, G.; Ma, L.; Wei, Y.; Brunel, A.; Bessette, B.; Orlianges, J.-C. Targeted Sub-Attomole Cancer Biomarker Detection Based on Phase Singularity 2D Nanomaterial-Enhanced Plasmonic Biosensor. Nano-Micro Lett. 2021, 13, 1–11. [Google Scholar] [CrossRef]
  87. Law, W.-C.; Yong, K.-T.; Baev, A.; Prasad, P.N. Sensitivity improved surface plasmon resonance biosensor for cancer biomarker detection based on plasmonic enhancement. ACS Nano 2011, 5, 4858–4864. [Google Scholar] [CrossRef]
  88. Available online: https://nicoyalife.com/nicoya-surface-plasmon-resonance-resources/what-is-spr/lspr-vs-spr-2/#:~:text=Although%20SPR%20sensors%20have%20a,biomolecular%20binding%20events%20is%20similar.&text=This%20smaller%20sensing%20volume%20means,less%20sensitive%20to%20bulk%20effects (accessed on 30 July 2021).
  89. Willets, K.A.; Van Duyne, R.P. Localized surface plasmon resonance spectroscopy and sensing. Annu. Rev. Phys. Chem. 2007, 58, 267–297. [Google Scholar] [CrossRef] [Green Version]
  90. Yonzon, C.R.; Jeoung, E.; Zou, S.; Schatz, G.C.; Mrksich, M.; Van Duyne, R.P. A comparative analysis of localized and propagating surface plasmon resonance sensors: The binding of concanavalin A to a monosaccharide functionalized self-assembled monolayer. J. Am. Chem. Soc. 2004, 126, 12669–12676. [Google Scholar] [CrossRef]
  91. Liu, Y.; Huang, C.Z. Real-time dark-field scattering microscopic monitoring of the in situ growth of single Ag@ Hg nanoalloys. ACS Nano 2013, 7, 11026–11034. [Google Scholar] [CrossRef] [PubMed]
  92. Hu, Y.; Zhang, L.; Zhang, Y.; Wang, B.; Wang, Y.; Fan, Q.; Huang, W.; Wang, L. Plasmonic nanobiosensor based on hairpin DNA for detection of trace oligonucleotides biomarker in cancers. ACS Appl. Mater. Interfaces 2015, 7, 2459–2466. [Google Scholar] [CrossRef] [PubMed]
  93. Mousavi, M.Z.; Chen, H.-Y.; Wu, S.-H.; Peng, S.-W.; Lee, K.-L.; Wei, P.-K.; Cheng, J.-Y. Magnetic nanoparticle-enhanced SPR on gold nanoslits for ultra-sensitive, label-free detection of nucleic acid biomarkers. Analyst 2013, 138, 2740–2748. [Google Scholar] [CrossRef]
  94. Krishnan, S.; Mani, V.; Wasalathanthri, D.; Kumar, C.V.; Rusling, J.F. Attomolar detection of a cancer biomarker protein in serum by surface plasmon resonance using superparamagnetic particle labels. Angew. Chem. Int. Ed. 2011, 50, 1175–1178. [Google Scholar] [CrossRef]
  95. Lee, J.-S.; Kim, S.-W.; Jang, E.-Y.; Kang, B.-H.; Lee, S.-W.; Sai-Anand, G.; Lee, S.-H.; Kwon, D.-H.; Kang, S.-W. Rapid and sensitive detection of lung cancer biomarker using nanoporous biosensor based on localized surface plasmon resonance coupled with interferometry. J. Nanomater. 2015, 2015, 1. [Google Scholar] [CrossRef] [Green Version]
  96. Wang, G.; Guo, Y.; Liu, Y.; Zhou, W.; Wang, G. Algorithm-Assisted Detection and Imaging of microRNAs in Living Cancer Cells via the Disassembly of Plasmonic Core-Satellite Probes Coupled with Strand Displacement Amplification. ACS Sensors 2021, 6, 958–966. [Google Scholar] [CrossRef] [PubMed]
  97. Portela, A.; Calvo-Lozano, O.; Estevez, M.-C.; Escuela, A.M.; Lechuga, L.M. Optical nanogap antennas as plasmonic biosensors for the detection of miRNA biomarkers. J. Mater. Chem. B 2020, 8, 4310–4317. [Google Scholar] [CrossRef] [PubMed]
  98. Mühlschlegel, P.; Eisler, H.-J.; Martin, O.J.F.; Hecht, B.; Pohl, D.W. Resonant optical antennas. Science 2005, 308, 1607–1609. [Google Scholar] [CrossRef] [PubMed] [Green Version]
  99. Zhang, L.; Zhang, Y.; Hu, Y.; Fan, Q.; Yang, W.; Li, A.; Li, S.; Huang, W.; Wang, L. Refractive index dependent real-time plasmonic nanoprobes on a single silver nanocube for ultrasensitive detection of the lung cancer-associated miRNAs. Chem. Commun. 2014, 51, 294–297. [Google Scholar] [CrossRef]
  100. Sönnichsen, C.; Reinhard, B.M.; Liphardt, J.; Alivisatos, P. A molecular ruler based on plasmon coupling of single gold and silver nanoparticles. Nat. Biotechnol. 2005, 23, 741–745. [Google Scholar] [CrossRef] [Green Version]
  101. Ma, D.; Huang, C.; Zheng, J.; Tang, J.; Li, J.; Yang, J.; Yang, R. Quantitative detection of exosomal microRNA extracted from human blood based on surface-enhanced Raman scattering. Biosens. Bioelectron. 2018, 101, 167–173. [Google Scholar] [CrossRef]
  102. Xia, Y.; Wang, L.; Li, J.; Chen, X.; Lan, J.; Yan, A.; Lei, Y.; Yang, S.; Yang, H.; Chen, J. A ratiometric fluorescent bioprobe based on carbon dots and acridone derivate for signal amplification detection exosomal microRNA. Anal. Chem. 2018, 90, 8969–8976. [Google Scholar] [CrossRef] [PubMed]
  103. Miti, A.; Sophie, T.; Philipp, M.; Andrea, C.; Wolfgang, F.; Giampaolo, Z. A miRNA biosensor based on localized surface plasmon resonance enhanced by surface-bound hybridization chain reaction. Biosens. Bioelectron. 2020, 167, 112465. [Google Scholar] [CrossRef]
  104. Wu, W.; Yu, X.; Wu, J.; Wu, T.; Fan, Y.; Chen, W.; Zhao, M.; Wu, H.; Li, X.; Ding, S. Surface plasmon resonance imaging-based biosensor for multiplex and ultrasensitive detection of NSCLC-associated exosomal miRNAs using DNA programmed heterostructure of Au-on-Ag. Biosens. Bioelectron. 2021, 175, 112835. [Google Scholar] [CrossRef]
  105. Al Mubarak, Z.H.; Premaratne, G.; Dharmaratne, A.; Mohammadparast, F.; Andiappan, M.; Krishnan, S. Plasmonic nucleotide hybridization chip for attomolar detection: Localized gold and tagged core/shell nanomaterials. Lab Chip 2020, 20, 717–721. [Google Scholar] [CrossRef] [PubMed]
  106. Kreno, L.E.; Leong, K.; Farha, O.K.; Allendorf, M.; Van Duyne, R.P.; Hupp, J.T. Metal–organic framework materials as chemical sensors. Chem. Rev. 2012, 112, 1105–1125. [Google Scholar] [CrossRef]
  107. Achmann, S.; Hagen, G.; Kita, J.; Malkowsky, I.M.; Kiener, C.; Moos, R. Metal-organic frameworks for sensing applications in the gas phase. Sensors 2009, 9, 1574–1589. [Google Scholar] [CrossRef] [Green Version]
  108. Kreno, L.E.; Hupp, J.T.; Van Duyne, R.P. Metal− organic framework thin film for enhanced localized surface plasmon resonance gas sensing. Anal. Chem. 2010, 82, 8042–8046. [Google Scholar] [CrossRef] [PubMed]
  109. Zeng, X.; Yang, Y.; Zhang, N.; Ji, D.; Gu, X.; Jornet, J.M.; Wu, Y.; Gan, Q. Plasmonic interferometer array biochip as a new mobile medical device for cancer detection. IEEE J. Sel. Top. Quantum Electron. 2018, 25, 1–7. [Google Scholar] [CrossRef] [PubMed]
  110. Soler, M.; Belushkin, A.; Cavallini, A.; Kebbi-Beghdadi, C.; Greub, G.; Altug, H. Multiplexed nanoplasmonic biosensor for one-step simultaneous detection of Chlamydia trachomatis and Neisseria gonorrhoeae in urine. Biosens. Bioelectron. 2017, 94, 560–567. [Google Scholar] [CrossRef]
  111. Li, X.; Soler, M.; Özdemir, C.I.; Belushkin, A.; Yesilköy, F.; Altug, H. Plasmonic nanohole array biosensor for label-free and real-time analysis of live cell secretion. Lab Chip 2017, 17, 2208–2217. [Google Scholar] [CrossRef]
  112. Sun, X.; Huang, L.; Zhang, R.; Xu, W.; Huang, J.; Gurav, D.D.; Vedarethinam, V.; Chen, R.; Lou, J.; Wang, Q. Metabolic fingerprinting on a plasmonic gold chip for mass spectrometry based in vitro diagnostics. ACS Central Sci. 2018, 4, 223–229. [Google Scholar] [CrossRef] [Green Version]
  113. Zhu, S.; Li, H.; Yang, M.; Pang, S.W. Label-free detection of live cancer cells and DNA hybridization using 3D multilayered plasmonic biosensor. Nanotechnology 2018, 29, 365503. [Google Scholar] [CrossRef] [PubMed]
  114. Zhang, L.; Wang, J.; Zhang, J.; Liu, Y.; Wu, L.; Shen, J.; Zhang, Y.; Hu, Y.; Fan, Q.; Huang, W.; et al. Individual Au-nanocube based plasmonic nanoprobe for cancer relevant microRNA biomarker detection. ACS Sensors 2017, 2, 1435–1440. [Google Scholar] [CrossRef] [PubMed]
  115. Zhang, W.; Li, B.; Chen, L.; Wang, Y.; Gao, D.; Ma, X.; Wu, A. Brushing, a simple way to fabricate SERS active paper substrates. Anal. Methods 2014, 6, 2066–2071. [Google Scholar] [CrossRef]
  116. Li, B.; Zhang, W.; Chen, L.; Lin, B. A fast and low-cost spray method for prototyping and depositing surface-enhanced Raman scattering arrays on microfluidic paper based device. Electrophoresis 2013, 34, 2162–2168. [Google Scholar] [CrossRef]
  117. Xia, J.; Liu, Y.; Ran, M.; Lu, D.; Cao, X.; Wang, Y. SERS Platform Based on Bimetallic Au-Ag Nanowires-Decorated Filter Paper for Rapid Detection of miR-196ain Lung Cancer Patients Serum. J. Chem. 2020, 2020, 5073451. [Google Scholar] [CrossRef]
  118. Fu, X.; Cheng, Z.; Yu, J.; Choo, P.; Chen, L.; Choo, J. A SERS-based lateral flow assay biosensor for highly sensitive detection of HIV-1 DNA. Biosens. Bioelectron. 2016, 78, 530–537. [Google Scholar] [CrossRef]
  119. Rong, Z.; Wang, C.; Wang, J.; Wang, D.; Xiao, R.; Wang, S. Magnetic immunoassay for cancer biomarker detection based on surface-enhanced resonance Raman scattering from coupled plasmonic nanostructures. Biosens. Bioelectron. 2016, 84, 15–21. [Google Scholar] [CrossRef]
  120. Tyagi, S.; Kramer, F.R. Molecular beacons: Probes that fluoresce upon hybridization. Nat. Biotechnol. 1996, 14, 303–308. [Google Scholar] [CrossRef]
  121. Xie, N.; Huang, J.; Yang, X.; Yang, Y.; Quan, K.; Wang, H.; Ying, L.; Ou, M.; Wang, K. A DNA tetrahedron-based molecular beacon for tumor-related mRNA detection in living cells. Chem. Commun. 2016, 52, 2346–2349. [Google Scholar] [CrossRef]
  122. Chon, H.; Lee, S.; Son, S.W.; Oh, C.H.; Choo, J. Highly sensitive immunoassay of lung cancer marker carcinoembryonic antigen using surface-enhanced Raman scattering of hollow gold nanospheres. Anal. Chem. 2009, 81, 3029–3034. [Google Scholar] [CrossRef]
  123. Chen, L.; Choo, J. Recent advances in surface-enhanced Raman scattering detection technology for microfluidic chips. Electrophoresis 2008, 29, 1815–1828. [Google Scholar] [CrossRef]
  124. Lee, S.; Kim, S.; Choo, J.; Shin, S.Y.; Lee, Y.H.; Choi, H.Y.; Ha, S.; Kang, K.; Oh, C.H. Biological imaging of HEK293 cells expressing PLCγ1 using surface-enhanced Raman microscopy. Anal. Chem. 2007, 79, 916–922. [Google Scholar] [CrossRef]
  125. Qiao, X.; Su, B.; Liu, C.; Song, Q.; Luo, D.; Mo, G.; Wang, T. Selective surface enhanced Raman scattering for quantitative detection of lung cancer biomarkers in superparticle@ MOF structure. Adv. Mater. 2018, 30, 1702275. [Google Scholar] [CrossRef] [PubMed]
  126. Fu, Y.; Xin, M.; Chong, J.; Li, R.; Huang, M.J. Plasmonic gold nanostars@ ZIF-8 nanocomposite for the ultrasensitive detection of gaseous formaldehyde. J. Mater. Sci. 2021, 56, 4151–4160. [Google Scholar] [CrossRef]
  127. Xia, Z.; Li, D.; Deng, W. Identification and Detection of Volatile Aldehydes as Lung Cancer Biomarkers by Vapor Generation Combined with Paper-Based Thin-Film Microextraction. Anal. Chem. 2021, 93, 4924–4931. [Google Scholar] [CrossRef]
  128. Zhang, Z.; Yu, W.; Wang, J.; Luo, D.; Qiao, X.; Qin, X.; Wang, T. Ultrasensitive surface-enhanced Raman scattering sensor of gaseous aldehydes as biomarkers of lung cancer on dendritic Ag nanocrystals. Anal. Chem. 2017, 89, 1416–1420. [Google Scholar] [CrossRef] [PubMed] [Green Version]
  129. Wen, H.; Wang, H.; Hai, J.; He, S.; Chen, F.; Wang, B. Photochemical synthesis of porous CuFeSe2/Au heterostructured nanospheres as SERS sensor for ultrasensitive detection of lung cancer cells and their biomarkers. ACS Sustain. Chem. Eng. 2019, 7, 5200–5208. [Google Scholar] [CrossRef]
  130. Huang, Y.; Xie, T.; Zou, K.; Gu, Y.; Yang, G.-H.; Zhang, F.-L.; Qu, L.-L.; Yang, S. Ultrasensitive SERS detection of exhaled biomarkers of lung cancer using a multifunctional solid phase extraction membrane. Nanoscale 2021, 13, 13344–13352. [Google Scholar] [CrossRef]
  131. Tian, Y.; Zhou, Y.; Gu, Q.; Qiu, T.; He, X.; Chen, J.; Qi, R.; Huang, R.; Zheng, T. Cu-doping SnO2-NiO pn Heterostructure for Significant Raman Enhancement with EF> 1010: Toward Ultrasensitive VOCs Sensing. Res. Square 2021. [Google Scholar] [CrossRef]
  132. Yang, T.; Guo, X.; Wu, Y.; Wang, H.; Fu, S.; Wen, Y.; Yang, H. Facile and label-free detection of lung cancer biomarker in urine by magnetically assisted surface-enhanced Raman scattering. ACS Appl. Mater. Interfaces 2014, 6, 20985–20993. [Google Scholar] [CrossRef] [PubMed]
  133. Li, Y.; Xin, X.; Zhang, T.; Li, W.; Li, J.; Lu, R. Raspberry-like polyamide@ Ag hybrid nanoarrays with flexible cores and SERS signal enhancement strategy for adenosine detection. Chem. Eng. J. 2021, 422, 129983. [Google Scholar] [CrossRef]
  134. Zhang, J.; Dong, Y.; Zhu, W.; Xie, D.; Zhao, Y.; Yang, D.; Li, M. Ultrasensitive detection of circulating tumor DNA of lung cancer via an enzymatically amplified SERS-based frequency shift assay. ACS Appl. Mater. Interfaces 2019, 11, 18145–18152. [Google Scholar] [CrossRef]
  135. Zhang, X.; Zheng, Y.; Liu, X.; Lu, W.; Dai, J.; Lei, D.Y.; MacFarlane, D.R. Hierarchical porous plasmonic metamaterials for reproducible ultrasensitive surface-enhanced Raman spectroscopy. Adv. Mater. 2015, 27, 1090–1096. [Google Scholar] [CrossRef] [PubMed]
  136. Chen, I.-H.; Xue, L.; Hsu, C.-C.; Paez, J.S.P.; Pan, L.; Andaluz, H.; Wendt, M.K.; Iliuk, A.B.; Zhu, J.-K.; Tao, W.A. Phosphoproteins in extracellular vesicles as candidate markers for breast cancer. Proc. Natl. Acad. Sci. USA 2017, 114, 3175–3180. [Google Scholar] [CrossRef] [Green Version]
  137. Dong, S.; Wang, Y.; Liu, Z.; Zhang, W.; Yi, K.; Zhang, X.; Zhang, X.; Jiang, C.; Yang, S.; Wang, F. Beehive-inspired macroporous SERS probe for cancer detection through capturing and analyzing exosomes in plasma. ACS Appl. Mater. Interfaces 2020, 12, 5136–5146. [Google Scholar] [CrossRef]
  138. Qi, D.; Lu, L.; Xi, Z.; Wang, L.; Zhang, J. Enhanced photocatalytic performance of TiO2 based on synergistic effect of Ti3+ self-doping and slow light effect. Appl. Catal. B Environ. 2014, 160, 621–628. [Google Scholar] [CrossRef]
Figure 1. Classification of the plasmonic sensors.
Chemosensors 09 00326 g001
Figure 2. Refraction of light at an incident angle α, at the interface of two materials with refractive indices n1 and n2 [40,41].
Chemosensors 09 00326 g002
Figure 3. Dispersion curves of light in free space and the surface plasmon [47].
Chemosensors 09 00326 g003
Figure 4. The excitation of SPR using prism couplers.
Chemosensors 09 00326 g004
Figure 5. The excitation of SPR using (a) waveguide couplers, (b) fibre optic couplers, and (c) grating couplers [46].
Chemosensors 09 00326 g005
Figure 6. The sketched diagram of a typical SPR sensor.
Chemosensors 09 00326 g006
Figure 7. Localised surface plasmon resonance (LSPR) due to collective oscillations of delocalised electrons in response to the external electric field.
Chemosensors 09 00326 g007
Figure 8. (a) A simplified schematic of a localised surface plasmon resonance (LSPR) sensor setup in transmission mode. Typically, the incident light illuminates a group of LSPR transducers (i.e., plasmonic nanoparticles) and the transmitted light is then collected at the detector (spectrometer), which translates the signal into an absorbance spectrum. (b) A simplified illustration of the SERS principle resulting from the interaction of incident light with analytes directly adsorbed on the surfaces of nanoparticle collections termed “hot spots”.
Chemosensors 09 00326 g008
Figure 9. (A) Real-time sensorgram of Let-7a (10−8 M) with the fibre-optic SPR sensor. I: hybridisation buffer. II: Let-7a in hybridisation buffer. III: water. IV: PBA-AuNPs in water. (B) Linear relationship between the amplified signal and the logarithm of Let-7a concentration. Inset: the wavelength shift in the presence of PBA-AuNPs with different concentrations of Let-7a (from 0 M to 10−7 M) [62]. (C) Fabrication of a miRNA sensor integrated with antimonene nanomaterials. Schematic illustration of the strategy employed to detect antimonene miRNA hybridisation events. I—The antimonene nanosheets were assembled on the surface of Au film. II—AuNR-ssDNAs were adsorbed on the antimonene nanosheets. III—miRNA solution with different concentrations flowed through the surface of the antimonene and paired up to form a double strand with complementary AuNR-ssDNA. IV—The interaction between miRNA with AuNR-ssDNA resulted in the release of the AuNR-ssDNA from the antimonene nanosheets. The reduction in the molecules of AuNR-ssDNA on the SPR surface made for a significant decrease in the SPR angle [63]. (D) Detection of miRNA-21 using an antimonene SPR sensor. I—SPR spectra with miRNA-21 concentrations ranging from 10−17 to 10−11 M using AuNRs amplification. The arrow denotes the shift in the SPR angle. II—SPR spectra with miRNA-21 concentrations ranging from 10−17 to 10−11 M without AuNR. III—The relationship between the SPR angle and miRNA concentration. Each point corresponds to the SPR angle shift with the indicated miRNA concentration. All error bars are the standard error of the SPR angle shift from five data points. IV—The real-time SPR response of ssDNA AuNR desorption from the antimonene surface. V—The SPR curve change of miRNA-21 contained one mismatched nucleobase (red line). VI—Comparison of the LOD of the antimonene miRNA SPR sensor with that of state-of-the-art sensors [63]. (E) I—The overall results of the sandwich assay and II—the overall results of the RAM-capture assay [8].
Chemosensors 09 00326 g009
Figure 10. (A) Scheme of the GNP-DNA biosensor based on the dielectric constant change caused by hybridisation on the surface of a single GNP [92]. (B) Schematic of the two-step method to detect the nucleic acid target. First step: (i) mixing the sample with the functionalised MNPs to hybridise with probe I on the MNP, (ii) isolating the MNPs with a magnet, and (iii) suspending the MNPs carrying the target molecule in buffer. Second step: hybridising the target molecule isolated on the MNPs with probe II on the gold nanoslits (Reprinted with permission from, Copyright 2013 Royal Society of Chemistry [93].) (C) Selectivity evaluation of the AAO chip: pore diameter of (I) 15 nm and (II) 95 nm [95].
Chemosensors 09 00326 g010
Figure 11. (A) (I) SERS spectra of 5-FAM obtained before and after hairpin DNA hybridisation at various concentrations of miR-196a in PBS. (II) Calibration curve of SERS intensities of ΔI1334 versus the miRNA concentration in PBS buffer. (III) Corresponding SERS spectra of 5-FAM collected before and after hairpin DNA hybridisation by various concentrations of miR-196a in serum. (IV) Calibration curve of SERS intensities of ΔI1334 versus the miRNA concentration in serum. Red scale bars represent 5000 a.u. [117]. (B) SERS sensor array performance for detecting three miRNA mixtures in human serum. Representative SERS spectra obtained from the miRNA-21 (I), miRNA-486 (IV), and miRNA-375 (VII) sensors for different mixture concentrations. The semi-log plots of the SERS intensity changed ΔI1503, ΔI1368, and ΔI1321 as a function of miRNA concentration for miRNA-21 (II), miRNA-486 (V), and miRNA-375 (VIII), respectively. A specificity assessment of each individual sensor was conducted on the proposed SERS sensor array using complementary and noncomplementary individual miRNA solutions, a mixture of three target miRNA-21/375/486 (Mixture 1), and a mixture of all five miRNAs (Mixture 2) for MB-21-ROX (III), MB-486-Cy5 (VI), and MB-375-FAM (IX), respectively (Reprinted with permission from, Copyright 2016 Royal Society of Chemistry [38]) (C) Schematic illustration of (I) the synthesis of Fe3O4@Ag MNPs and the conjugation to the capture antibody, (II) the conjugation of Au@Ag NRs to the detection antibody, and (III) the operating principle of the SERS immunoassay for CEA detection based on coupled plasmonic nanostructures [119].
Chemosensors 09 00326 g011
Figure 12. (a) Schematic illustration of the process for synthesising core–shell AuNS@ZIF-8 nanoparticles and of the SERS detection procedure for target analytes; (b) TEM images of the as-synthesised AuNS@ZIF-8 nanoparticles with a thin shell; (c) UV–Vis absorption spectra of AuNSs, ZIF-8, and AuNS@ZIF-8. The inset shows the optical images of the nanoparticles dispersed in ultrapure water (Reprinted with permission from, Copyright 2020 Nature [126]).
Chemosensors 09 00326 g012
Table 1. Main disadvantages of the most frequently used methods for the screening and monitoring of lung cancer [7,9].
TypeDisadvantagesTime
Chest X-rayProduction of radiation, low sensitivity and specificityFew seconds
CTCostly, high false-positive rate, low sensitivity, production of radiation5 min
MRICostly, not suitable for all cancer types40–60 min
PETCostly, requirement of radioactive substance and sophisticated instruments, not suitable for patients with other complications90–240 min
Table 2. DNA/genetic and protein-based biomarkers in lung cancer detection [12,13].
ClassificationsSubclassBiomarker
Genetic and epigenetic biomarkersMutations, rearrangements, amplifications, or deletions in genesEpidermal growth factor receptors (c-ErbB-1, c-ErbB-2), K-ras and p53 mutant, FHIT, COX2, RASSFIA, MET, Her2, BRAF, PIK3CA, RET, PTEN, IL-8 Mrna
DNA hyper-methylation of genesSHOX2, CDKN2A, RASSF1A, APC, AC ESR1, HOXA9, CDH13, PRCS3, DAPK
miRNAsmiR-205, miR-210, miR-708, miR-486, miR-21, miR-200b, miR-375, miR-137
Protein biomarkers-CEA, NSE, CYFRA 21-1, vascular endothelial growth factor (VEGF), haptoglobin-R 2, KLKB1, R-enolase (ENO1), APOA1, chromogranin A, TPA, bombesin-like gastrin-releasing peptide, cytokeratin-7, tumour M2-pyruvate kinase, nitrated ceruloplasmin, CD34 and CD59 glycoproteins, transthyretin (TTR), cytokeratin 17 and 18, GM2 activator protein (GM2AP), ProGRP, carbohydrate antigens 19-9, 125 and 15-3 (CA 19-9, CA 125, CA 15-3), annexin II, R-1-acid glycoprotein, protein gene product 9.5 (PGP 9.5), BB isoenzyme of creatine kinase (CK-BB), plasma kallikrein B1, cytokeratin fragment 21-1, and Ig-free light chain
Table 3. Main VOC biomarkers determined to be available in lung cancer patients [2,10,14,15].
VOCConcentration TrendsConcentration Range in Healthy Subjects (ppb)Concentration Range in Lung Cancer Patients (ppb)
1,2,4-trimethyl benzene--
2,4-dimethyl heptane↑↓--
3-hydroxy-2-butanone1.35–3.181.35–2.86
Acetone↑↓44.2–531.4534.57–390.60
Benzene↑↓1.38–14.971.29–3.82
Butane↑↓--
Decane--
Heptane--
Heptanal--
Ethanol↑↓--
Hexanal↑↓--
Isoprene↑↓--
Octane--
Pentane↑↓6.84–14.361.73–17.50
Propyl benzene--
Styrene↑↓--
Toluene1.45–37.211.12–17.10
Undecane--
Cyclohexane--
Propanol--4.37–13.15
Ethyl benzene2.22–18.381.45–3.16
Propanal1.56–3.441.56–3.74
Pentanal---
Butanal-1.35–1.871.32–2.55
Methyl ethyl ketone---
2-methyl-1,3-butadiene---
2-Pentanone, methyl propyl ketone1.80–4.113.25–8.77
Benzaldehyde--
Methyl cyclopentane--
Octanal---
Nonanal--
Acetyldehyde↑↓--
Dimethyl sulfide--
4-Methyl octane--
Propane---
2-Methyl pentane, isohexane2.37–10.800.93–3.77
Increased concentration Decreased concentration ↑↓ Contradicting reports of increased and decreased concentration.
Table 4. SPR biosensors for lung cancer biomarker detection.
S/NSensing Layer Material
(Functional Material)
Analyte (Biomarker)ConfigurationLODSizeRef.
1Gold layer + SAM + anti-cytokeratin 17 antibody (AbCK17)Cytokeratin 17 protein (CK17)Optical fibre SPR-Portable[76]
2Gold layer + carboxyl-functionalised Graphene oxide (GO-COOH) composites + anti-CK19 antibodyCytokeratin 19 biomarkerBI-SPR 3000 1 fg/mL. Bulk[75]
3Gold layer + SAM + anti-CK17 antibodiesCytokeratin-17 proteinsOptical fibre SPR-Portable[77]
4Gold layer + antimonene + AuNR-ssDNAmiRNA (miRNA-21 and miRNA-155)Prism SPR (kretchmann)10 aMBulk[63]
5Gold layer + SAM + cytokeratin 7 antibodies (AbCK7)Cytokeratin 7 (CK7)Tilt fibre Bragg grating SPR0.4 nM.Portable[74]
6Gold layer + SAM (MUDA) + monoclonal mouse anti-CEA antibodyCarcinoembryonic antigen (CEA)BIOCORE 3000 SPR3 ng/mL Bulk[8]
7Gold layer + SAM + biotinylated anti-EGFR antibodies, biotinylated anti-PD-L1 antibodies, and biotinylated anti-IgG antibodies Exosomal protein biomarkers (epidermal growth factor receptor (EGFR) and programmed death-ligand 1 (PD-L1))Compact SPR chip2 × 1010 exosomes/mLPortable[84]
8PNA pieces (gold) + SAM (MUA) + anti-CEA (anti-CA 19-9/anti-CA 242) Carcinoembryonic antigen (CEA)Compact
reflection optical fibre SPR
less than 5 ng/mL Portable[70]
9Au film + DNA tetrahedron probes (DTPs)MicroRNA Let-7aPrism-coupling-based SPR0.8 fM Bulk[65]
10Au film + capture single-stranded DNA
(HS-ssDNA) + phenylboronic acid modified AuNPs (PBA-AuNPs)
MicroRNA (miRNA) (Let-7a)Fibre-optic SPR2.7 × 10−13 M (0.27 pM)-[62]
11Au film + mAbCEA-C3 + CEA+ bio- mAbCEA-B5 antibodies (mAbCEA-C3) + GNPsCarcinoembryonic antigen (CEA)Biacore X™ (Uppsala, Sweden) and CM5 sensor chop1.0 ng/mL.
(SA–GNPs enhanced sandwich
Format)
Bulk[68]
12Gold layer + SAM + carboxyl-MoS2 + anti-CYFRA21-1Cytokeratin 19 fragment (CYFRA21-1)BI-SPR 3000 dual channel instrument (Biosensing Instrument Inc., Tempe, AZ, United States)0.05 pg/mLBulk[72]
13Gold layer + SAM (HDT) + AuNP + SAM (AHT) + anti-CYFRA 21-1 + anti-CYFRA 21-1/quantum dot (QD) conjugatesCytokeratin fragment 21-1 (CYFRA 21-1)Prism-coupling-based SPR0.1 ng/mLBulk[73]
14Gold layer + SAM + microRNA + DNA super-sandwich assemblies and biotin–strepavidinMicroRNABiacore XTM (Prism based SPR)9 pMBulk[66]
15Au film + antimonene miRNAAngular interrogation method based on Kretschmann geometry- [64]
16Gold film + 3-mercaptopropane sulfonate (MPS) + poly (diallyldimethylammonium chloride)-graphene oxide (PDDA-GO)2miRNA-21Single channel autolab e-spr springle instrument (Prism SPR)0.3 fMBulk[67]
17Metal film (Au, Ag, and Al)/graphene/Ti3C2Tx MXeneAcetone and ethanolFibre-optic SPR sensor-Portable[82]
18Gold film + monoclonal anti-human TNF-α antibody + antigen + anti-human TNF-α antibodyTumour necrosis factor alpha (TNF-α) antigenPrism SPR (phase interrogation)0.03 pMBulk[87]
19Au film + erlotinib-MNPsA549 cellsPrism coupling-Bulk[85]
20Au film + Ge2Sb2Te5TNF-α cancer markerPhase interrogation-based prism coupling10−15 mol/L Bulk[86]
Table 5. LSPR biosensors for lung cancer biomarker detection.
S/NPlasmonic NanostructureAnalyte (Biomarker)Functional MaterialLODSizeRef.
1Gold nanoslitsmRNA (heterogeneous nuclear ribonucleoproteins (hnRNP B1))Magnetic nanoparticles (MNPs)30 fM Bulk[93]
2Ring-hole Au nanostructure Exosomal EGFR (epidermal growth factor receptor)Biotinylated anti-EGFR antibodies -Portable[109]
3Au nanosquaresA549 live cancer cellO2 plasma treatment5×103 cells ml−1Bulk[113]
4Nanogap antennas (pairs of goldnanodisks)miRNA-210Complementary DNA capture probe0.78 nMBulk[97]
5Gold nanoparticles (GNPs)DNA and miRNA-21Single-strand DNA probes (ssDNA)3 nMBulk[92]
6Silver nanocubes (AgNCs)MiRNA (miR-21)Thiolated single-stranded DNA (ssDNA)0.1 fM.Bulk[99]
7Nanoporous anodic aluminum oxide (AAO)-AuSerum amyloid A1 (SAA1)SAA1 antibody100 ag/mLBulk[95]
8Au nanoparticlesmiR-17DNA hairpin1 pMBulk[103]
9AgNCs and AuNPsmiRNA-21, miRNA-378, miRNA-200, and miRNA-139 DNA tetrahedral framework (DTF) and single-stranded DNA (ssDNA) functionalised silver nanocube (AgNC) + ssDNA-AuNPs1.68 fM Bulk[104]
10Au nanoholesAcetone and ethanolCu 1,3,5-benzenetricarboxylic acid (Cu-BTC) metal organic frameworks (MOFs)5 μmol/molBulk[81]
11Gold nanocubes (AuNCs)MicroRNA205 (miR-205)Single-stranded DNA (ssDNA)5 pMBulk[114]
12Au50@Au13 core-satellite (DNA/AuNPs)miRNA-21DNA2 pMLess bulky[96]
13Fe3O4@Au NPsmiRNA-155DNA80 aMLess bulky[105]
Table 6. SERS biosensors for lung cancer biomarker detection.
S/NPlasmonic NanostructureAnalyte (Biomarker)Functional MaterialLODSizeRef.
1Silver
nanotriangles (AgNTs)
Lung cancer cells (A549)Para-aminothiophenol (p-ATP labelled chitosan-Bulk[58]
2CuFeSe2/Au
heterostructure nanospheres
Aldehydes and lung cancer cells 4-aminothiophenol
(4-ATP)-aldehydes
Folic acid (FA)—lung cancer cells
1.0 ppb (aldehydes) Bulk[129]
3Silver-coated AuNRs (Au@Ag NRs)Carcinoembryonic antigen (CEA)Detection antibody4.75 fg/mL Bulk[119]
4Ag nanorod array miRNA-21, miRNA-486, and miRNA-375Hairpin-shaped molecular beacons (MBs)393 aM (miRNA-21), 176 aM (miRNA-486) and 144 aM (miRNA-375)Bulk[38]
5Gold superparticles (GSPs)Gaseous aldehydes ZIF-8 metal organic framework layer10 ppbBulk[125]
6Hollow gold nanospheres (HGNs)Carcinoembryonic antigen (CEA)Magnetic beads/monoclonal anti-CEA antibodies1–10 pg/Ml Bulk[122]
7Au/Ag nanoparticlesAdenosineFe3O4/Au/Ag nanocomposite0.5 nMPortable[132]
8Bimetallic Au-Ag nanowire decorated filter papermiR-196aTarget hairpin DNA96.58 aM (in PBS) and 130 aM (in serum)Bulk[117]
9Aluminum-based quantum structure (QS)CEA-Femtomolar concentration (10–15 M)Bulk[57]
10Au-coated TiO2 macroporous inverse opal (MIO) structureExosomes--Bulk[137]
11Gold nanostars Gaseous formaldehydePorous ZIF-8 metal–organic frameworks (MOFs)/4-aminothiophenol (4-ATP)Parts per billion (ppb) levelBulk[126]
12Dendritic Ag nanocrystalsAldehydes4-ATP moleculesParts per billion (ppb) levelBulk[128]
13Gold nanoparticlesToluene
Acetone and chloroform
MOFs of MIL-100(Fe) composed of Fe clusters and 1,3,5-benzenetricarboxylic acid (TMA)0.48 ppbBulk[39]
14Silver nanoparticle films (AgNFs)Circulating tumour DNA (ctDNA) Hairpin DNA-rN1-DNA probe 1.2 × 10⁻¹⁶ M Bulk[134]
15SnO2-NiOx/Cu-CuPyrene (PYR), 2-naphthalenethiol (2-NT) and 4-ethylbenzaldehyde (EBZA)phthalocyanineppb levelBulk[131]
16Ag NPs@ZIF-67/g-C3N4Benzaldehyde4-ATP molecules1.35 nMBulk[130]
17Polyamide-Ag filmAdenosineMPBA-modified AgNPs (amplification)9.83 × 10¹⁰ MBulk[133]
18GNRs-QDs@NU-
901
Benzaldehyde-sub-ppb levelBulk[127]
Publisher’s Note: MDPI stays neutral with regard to jurisdictional claims in published maps and institutional affiliations.

