Article

Potentiometric Carboxylate Sensors Based on Carbazole-Derived Acyclic and Macrocyclic Ionophores

1
Laboratory of Molecular Science and Engineering, Johan Gadolin Process Chemistry Centre, Åbo Akademi University, Biskopsgatan 8, FI-20500 Turku, Finland
2
Institute of Chemistry, University of Tartu, Ravila 14a, 50411 Tartu, Estonia
*
Author to whom correspondence should be addressed.
Chemosensors 2021, 9(1), 4; https://doi.org/10.3390/chemosensors9010004
Submission received: 16 November 2020 / Revised: 9 December 2020 / Accepted: 17 December 2020 / Published: 24 December 2020
(This article belongs to the Special Issue Feature Papers- Electrochemical Devices and Sensors)

Abstract

:
Solid-contact ion-selective electrodes with carbazole-derived ionophores were prepared. They were characterized as acetate sensors, but can be used to determine a number of carboxylates. The potentiometric response characteristics (slope, detection limit, selectivity, and pH sensitivity) of sensors prepared with different membrane compositions (ionophore, ionophore concentration, anion exchanger concentration, and plasticizer) were evaluated. The results show that for the macrocyclic ionophores, a larger cavity provided better selectivity. The sensors exhibited modest selectivity for acetate but good selectivity for benzoate. The carbazole-derived ionophores effectively decreased the interference from lipophilic anions, such as bromide, nitrate, iodide, and thiocyanate. The selectivity, detection limit, and linear range were improved by choosing a suitable plasticizer and by reducing the ionophore and anion exchanger concentrations. The influence of the electrode body’s material upon the composition of the plasticized poly(vinyl chloride) membrane, and thus also upon the sensor characteristics, was also studied. The choice of materials for the electrode body significantly affected the characteristics of the sensors.

1. Introduction

Ion-selective electrodes (ISEs) were invented over a hundred years ago [1] and they have become routinely used instruments in analytical laboratories, clinical laboratories, industrial quality control, etc. A key advantage that ISEs possess in comparison to many other analytical techniques is portability, which stems from the form factor of the equipment needed to perform the measurements combined with the minimal sample pretreatment needed in many cases. The ability to perform measurements outside of a laboratory setting, which reduces the risk of sample decomposition or contamination during transit, with response times typically ranging from a few seconds to a few minutes makes ISEs particularly alluring. The conventional liquid-contact ISEs are still used to manufacture commercial ISEs and to conduct research, but solid-contact ISEs (SC-ISEs) quickly gained traction for several reasons. Those reasons include a rugged construction that is often based around polymeric materials, the lack of need for filling solutions that evaporate and require refilling, and the ease of manufacturing different form factors using, e.g., 3D printing [2]. Conducting polymers are widely used as solid contacts and have been for decades [3]. Several types of ion-selective membranes (ISMs) have been developed so far (e.g., glass [4,5], crystal [6], liquid [7], solvent polymeric [8]). Among these, the solvent polymeric membranes are the most actively developed type of membrane, since an astounding variety of membranes can be tailored to meet the needs of a specific application [9,10]. Receptors, which can be used as ionophores to improve the selectivity of solvent polymeric ISMs, are actively studied by many different groups in an effort to target a large variety of analytes [10,11,12,13,14]. Many inorganic cationic analytes (e.g., H + , N a + , K + , C u 2 + , Pb2+) have receptors that can be used to prepare ISMs with good or even excellent selectivity [12]. However, there are many anionic analytes that are of great importance in, e.g., clinical chemistry, and, as such, the field of anion receptors has received a great deal of attention in the last two decades [15,16,17,18,19,20,21,22,23,24,25,26,27,28,29,30]. Many new anion receptors are published each year, but unfortunately, in the vast majority of cases, these receptors do not make the leap from binding studies to sensor prototyping, let alone practical use. As a result, there are still no commercial ISEs available for many common anions, such as food additives like acetate and benzoate. For applications involving ISEs, there may be several reasons preventing the use of a receptor as part of an ISM. For example, the compound might be unstable at the conditions that ISEs are typically used in (e.g., room temperature, exposed to light, exposed to oxygen). The compound might also have insufficient lipophilicity [29] to be contained within the ISMs for several weeks or months, or the compound might lack a functional group suitable for immobilization onto the membrane’s polymeric matrix.
In the present work, four derivatives of 1,3-bis(carbazolyl)urea (Figure 1) were systematically studied as anion receptors in SC-ISEs. These receptors were originally designed in silico and were recently found to be promising as ionophores for acetate and other carboxylates [30,31]. Here, ISEs based on these four anion receptors were prepared and investigated. The receptors included three macrocyclic receptors (Figure 1a) and an acyclic receptor (Figure 1b). The chosen receptors had previously only been used to prepare ISEs with a single membrane composition [30,31]. In this work, the influences of the plasticizer and the material of the electrode body were studied systematically for each anion receptor. One of the receptors was also used to prepare ISEs with varying concentrations of receptor and anion exchanger in the membrane.

2. Materials and Methods

2.1. Reagents

The anion receptors were prepared as described in previous publications [28,30]. The chemicals used to prepare the membrane cocktails were of Selectophore™ grade: 2-nitrophenyl octyl ether (o-NPOE, ≥ 99.0 %, Sigma-Aldrich, St. Louis, MO, USA), bis(2-ethylhexyl) sebacate (DOS, ≥ 97 %, Fluka, Munich, Germany), high molecular weight poly(vinyl chloride) (HMW PVC, Fluka), tetrahydrofuran (THF, ≥ 99.5 %, Sigma-Aldrich), and tridodecylmethylammonium chloride (TDMACl, ≥ 98 %, Fluka). The solid contacts were prepared using 3,4-ethylenedioxythiophene monomer (EDOT, 97 %, Sigma-Aldrich). Nitric acid (65 %, J.T. Baker) was used in diluted form to clean electrodes. The rest of the chemicals were of analytical or reagent grade of ≥ 98 % purity and acquired from commercial sources (Fluka, Sigma-Aldrich, Merck, Acros Organics, J.T. Baker, Alfa Aesar, VWR Chemicals, and Riedel-de Haën). These and all other chemicals were purchased from Sigma-Aldrich (Merck Life Science OY, Espoo, Finland) and VWR (VWR International OY, Helsinki, Finland), and were used as received. Ultrapure water (PURELAB® Ultra, ELGA LabWater, High Wycombe, UK) was used to prepare all solutions and for rinsing electrodes and glassware.

2.2. Equipment

The following reference electrodes were used in this study: two 6.0726.100 double-junction A g / A g C l / 3 M K C l // 1 or 0.1 M K C l reference electrodes (Metrohm AG, Herisau, Switzerland) and an RL-100 double-junction A g / A g C l / saturated K C l // 1 or 0.1 M KCl reference electrode (Elmetron Sp. j., Zabrze, Poland). Glassy carbon (GC) rods (3 m m diameter, SIGRADUR® G, HTW Hochtemperatur-Werkstoffe GmbH, Thierhaupten, Germany) were used as counter electrodes and to prepare working electrodes with PVC shells ( 8.5 m m outer diameter). MF-2012 electrodes (BASI Bioanalytical Systems Inc., West Lafayette, IN, USA) with a glassy carbon disk (3 m m diameter) and poly(chlorotrifluoroethylene) (PCTFE) shells ( 6.35 m m outer diameter) were also used to prepare working electrodes.
All cyclic voltammetry, electropolymerizations, and electrochemical impedance spectroscopy measurements were performed with Autolab PGSTAT20 and Autolab PGSTAT30 potentiostats (EcoChemie BV, Utrecht, Netherlands) equipped with frequency response analyzer modules. High input impedance ( 10 15 Ω ) EMF16 multichannel interfaces (Lawson Labs, Inc., Malvern, PA, USA) were used for all potentiometric measurements (calibrations, selectivity determinations, and pH titrations). The dilution of samples during the potentiometric calibrations was performed with a pair of 800 Dosino dosing systems controlled by a 905 Titrando titrator (Metrohm AG, Herisau, Switzerland) connected to a computer. An Orion Star A111 pH-meter and an Orion 9157BNMD pH-electrode (Thermo Fisher Scientific, Waltham, MA, USA) were used to measure the pH and temperature of solutions.
All measurements were performed at room temperature ( 23 ± 2 C ). The Henderson equation [32] was used to estimate liquid junction potentials, which were in the range of 6.92 m V to 0.02 m V . Activity coefficients, which were in the range of 0.41 to 1, were estimated with ChemPy [33] by using the Debye–Hückel theory [34]. Analysis of the impedance spectra was performed with Elchemea Analytical [35]. Estimation of the membrane bulk conductivity and dielectric constant was performed similarly to Bobacka et al. [36]. The membrane geometry was approximated with a conical frustum with a height equal to the membrane thickness, the radius of one end equal to the radius of the GC rod, and the radius of the other end equal to the outer radius of the electrode body.

2.3. Preparation of the Membranes

Sixteen different membrane cocktails (including controls) were prepared during this study. THF was used as the solvent, while the “dry mass” consisted of the following components: ionophore, anion exchanger (TDMACl), polymer (HMW PVC), and plasticizer. Membrane cocktails were prepared with each of the ionophores and the two plasticizers: DOS and o-NPOE. These membrane cocktails contained 2.0 wt . % (dry mass) of an ionophore and 50 mol . % (relative to the ionophore) of TDMACl. Additional membranes were prepared with MC9 as the ionophore and o-NPOE as the plasticizer to study different ratios of the membrane components. The concentration of MC9 was varied between 1 and 4 wt . % (dry mass) while keeping the TDMACl concentration at 50 mol . % (relative to the ionophore). Finally, the concentration of TDMACl was decreased to 25 mol . % (relative to the ionophore), while the concentration of MC9 was set at 1 wt . % (dry mass). The remaining parts of each membrane’s “dry mass” were plasticizer and PVC in a ratio of 2:1. Each of the “dry masses” were dissolved in THF to produce membrane cocktails with the “dry mass” accounting for 17 wt . % of the total mass. Control membrane cocktails, which did not contain any ionophore but similar concentrations of TDMACl ( wt . % of the total mass) to those in the ISM cocktails, were prepared for each of the membrane compositions that were tested.

2.4. Preparation of the Sensors

The electrodes with PVC shells were polished with sandpapers, diamond pastes (15, 9, 3 and 1 μ m ), and 0.3 μ M A l 2 O 3 . The PCTFE-shelled electrodes were polished only with 0.3 μ M A l 2 O 3 . Cyclic voltammetry was used to verify that there were no traces of contaminants, such as residues from previous solid contacts. The electrodes were cleaned after the polishing steps by ultrasonication in deionized water and in ethanol baths by immersion in 1 M H N O 3 , and ultrasonicated once more in deionized water.
A layer of PEDOT:Cl was electropolymerized onto the exposed disk-shaped GC surface ( 0.07 c m 2 ) of each electrode. A monomer solution containing 10 2 M EDOT and 10 1 M K C l was prepared and mixed overnight to ensure proper dissolution of the monomer. The monomer solution was deaerated prior to the polymerization for at least 15 min by bubbling N 2 gas through the solution while stirring the solution. The N 2 gas was set to flow over the solution surface for the entire duration of the polymerization to minimize the dissolution of oxygen back into the solution. The polymerization was performed galvanostatically with a three-electrode cell by applying a constant 14 μ A current for 714 s The bridge electrolyte of the reference electrode was 1 M K C l during all electropolymerizations. The electrodes were rinsed after the polymerization and conditioned overnight in 10 1 M sodium acetate solution.
The electrodes were rinsed after the conditioning step and left to air-dry prior to drop-casting the membrane cocktails. A total of 100 μ L and 40 μ L of a membrane cocktail were drop-cast onto the PVC- and PCTFE-shelled electrodes, respectively. The drop-casting was done in two steps, where half of the total volume was added each time and with approximately 30 min between the steps. A set of coated wire electrodes (CWEs) were also prepared with different volumes of the MC9N1/25 membrane cocktail. The PVC-shelled CWEs were prepared with 100 μ L of the membrane cocktail, while the PCTFE-shelled CWEs were prepared with 20, 40, 60 and 80 μ L of the membrane cocktail. The drying electrodes were covered with beakers and left overnight to let the solvent from the membrane cocktails slowly evaporate, after which the finished sensors were placed in 10 2 M sodium acetate solutions for conditioning for at least two days.

2.5. Electrochemical Impedance Spectroscopy

Electrochemical impedance spectroscopy (EIS) measurements were performed potentiostatically with each sensor using a three-electrode cell containing a 10 1 M sodium acetate solution. The open-circuit potential (OCP) was measured prior to each EIS measurement, and a constant potential E d c = 0   V vs . OCP was applied during each EIS measurement. A sinusoidal alternating current signal with an amplitude Δ E a c = 100   mV (root mean square—RMS) was applied as the excitation signal in the frequency range of f = 100 m Hz 100 k Hz for a total of 61 measurement points. The bridge electrolyte of the reference electrode was 1 M K C l during all EIS measurements.

2.6. Potentiometry

The bridge electrolyte of the reference electrode was 0.1 M K C l instead of 1.0 M K C l during all potentiometric measurements to minimize the diffusion of C l to the sample solutions. Potentiometric measurements were performed with multiple sensors simultaneously in the same solution. In order to minimize any systematic error in the results, the sensors were split into two or more groups almost at random, and this grouping changed from day to day. The two constraints for grouping were that (a) each group should contain both PVC- and PCTFE-shelled sensors, and (b) at least one sensor per membrane should be included from the batch of membranes being tested.
Potentiometric calibrations were performed with automated dilution from 10 1 M to 10 7 M in half-decade steps with 7 min intervals. Deaerating the sample solutions and the deionized water, which was used for dilutions, was not practically feasible on a continuous basis. However, the pumps and their reservoirs were filled with fresh deionized water before each calibration to minimize the amount of dissolved C O 2 . Mixing of the sample solution was left to the pumping action that occurred at each dilution step.
The influence of solution pH upon the potentiometric response of the electrodes was studied by titrating a 10 2 M acetic acid solution with a mixture of 0.25 M N a O H and 10 2 M sodium acetate while constantly stirring the solution. The solution pH was raised from approximately 3.3 to 9.5 over the course of each titration experiment. The duration of each titration experiment was approximately 90 min with intervals of approximately 3 min between additions of the titrant to the sample. The acetic acid solutions were deaerated with N 2 gas for at least 15 min prior to each measurement, and N 2 gas flowed over the solution surfaces throughout each measurement. The titrant solution was also deaerated and then stored carefully to minimize the dissolution of atmospheric C O 2 .
Potentiometric selectivity coefficients ( K a c e t a t e , j pot ) with respect to potential interfering ions (j) were determined using the separate solution method ( a i = a j = 10 2.05 M ). The solution concentrations were determined by calculating the equilibrium concentrations that would provide the same anion activity as a 10 2 M sodium acetate solution. The experimental slopes, which were obtained from the potentiometric calibrations, were used for all calculations. The anions included in the selectivity determinations were: F , H P O 4 2 , H2PO4,SO42−, H C O 3 , formate, lactate, pivalate, benzoate, B r , N O 3 , I , and S C N . Sodium salts were used to prepare the solutions; all solutions, except for H C O 3 , were deaerated by bubbling N 2 gas through the solution for at least 15 min prior to each measurement, and N 2 gas flowed over the solution surfaces during each measurement to reduce the dissolution of atmospheric C O 2 . The potentials were measured for at least 7 min while stirring the solution.

3. Results and Discussion

3.1. Receptors, Membranes, and Electrode Bodies

Three out of the four receptors (AC, MC5, and MC12) included in this study had similar binding constants (Table A1) for acetate but not for the other carboxylates as a result of the receptors’ divergent structures. The fourth receptor (MC9) had the highest binding constants for all of the carboxylates included in this study. The binding constants for acetate were around three orders of magnitude greater for the receptors in this study than those previously reported by Amemiya et al. for their porphyrin-derived receptors [37]. A previous study [30] showed that the binding constants of the macrocyclic receptors, which were determined in 99.5 %: 0.5 % (w/w) dimethyl sulfoxide (DMSO)- d 6 : H 2 O , were not indicative of the selectivity of the membranes that incorporated those receptors when used for measurements in aqueous solutions. Acetate was chosen as the primary analyte for this study, since it was the target analyte in the two previous studies [30,31], which made the comparison of results easier. Clearly, factors other than the ion–ionophore binding constants affect the selectivity of the membrane, and some of these factors can be tweaked while others cannot. Membrane composition is one factor that can be altered with relative ease, but is subject to limitations and/or requires compromises to some of the response characteristics of the sensor. In particular, the plasticizer, which typically makes up a large part of the membrane’s mass, can be substituted. The two plasticizers that were used in this study (DOS and o-NPOE) have very different dielectric constants ( ε r 4 and ε r 24 , respectively [38,39]). DOS and o-NPOE are consequently considered to be better for targeting mono- and divalent ions, respectively [39,40]. Several different membrane compositions were tested in this study, and the final membrane cocktail compositions are presented in Table 1. The same basic membrane composition that had been used in two previous studies [30,31] was used as the starting point in this study with each of the plasticizers. MC9, which was available in sufficient quantities, was later used to prepare membranes with compositions where the concentrations of the ionophore and the anion exchanger were varied.
Two different types of electrode bodies with different shell materials were chosen as a result of dramatic differences observed in the potentiometric responses of some PVC-shelled electrodes. These observations were made when comparing different batches of commercial PVC rods. Plasticized PVC membranes adhere strongly to the PVC shells, which is why PVC-shelled electrodes can be used to make rugged sensors. However, the potentiometric response of the sensor may be affected by the partial dissolution of the shell by the solvent that is used in the membrane cocktail. For example, membrane matrices with reduced diffusion coefficients (e.g., due to a higher concentration of PVC) are known to have some benefits [41]. Reducing the concentration of the plasticizer (at least in the case of DOS) in PVC-based membranes and/or inclusion of certain compounds in PVC-based membranes have also been shown to reduce water uptake [42]. Layers or pockets of water at the substrate–solid-contact and/or solid-contact–membrane interface cause drifts in the potentiometric response as accumulated ions are exchanged with the sample [42], which can be a problem depending on the sensor structure (e.g., membrane thickness and composition) and application [43]. Commercially available PVC may also contain additives such as dyes, thermal stabilizers, and UV stabilizers, but the identities and concentrations of such compounds are usually not disclosed by the manufacturer. It was decided that electrodes with a shell material possessing greater chemical resistance were to be included in this study for comparison. PCTFE is one such material, but one disadvantage of PCTFE and similar materials is that the membranes do not adhere to them as well as they do to PVC. However, the membranes adhere well enough for use in the laboratory, and PCTFE shells are unlikely to affect the potentiometric response of the sensor by altering the membrane composition.

3.2. Minimizing the Effects of Dissolved CO2 and Chloride Leakage from the Reference Electrode

Some suggestions for improvements to the experimental protocol for the characterization of the sensor prototypes were discussed in a previous study [30]. One of the issues was that C l leaching from the reference electrodes was suspected of affecting the responses of the MC5 sensors in particular. This issue manifested itself in the potentiometric calibrations as lower slopes, narrower linear ranges, and detection limits that did not reach as low of concentrations as the other membranes. The pH sensitivity measurements were also affected, as there was a constant downward slope beyond the point where the solution pH should have significantly affected the activity of acetate. The determination of selectivity coefficients would also have been affected to some degree. It was decided that the concentration of the bridge electrolyte in the reference electrodes would be decreased to 0.1 M in this study to reduce the rate at which C l leached into the samples. Replacing K C l with another salt was also considered, but all suitable candidates contained anions that would have interfered with the sensors as much as C l or even more. Greater care was also taken to address the dissolution of atmospheric C O 2 , which introduces interfering ions that are also capable of altering the solution pH in the absence of a buffer. This was speculated to have been a possible contributing factor to some of the deviations that were observed in the responses of some membranes towards the end of the pH sensitivity measurements (i.e., above pH 9). Therefore, sample solutions were, whenever practically feasible, deaerated and covered with a N 2 atmosphere as a precaution.

3.3. Electrochemical Impedance Spectroscopy
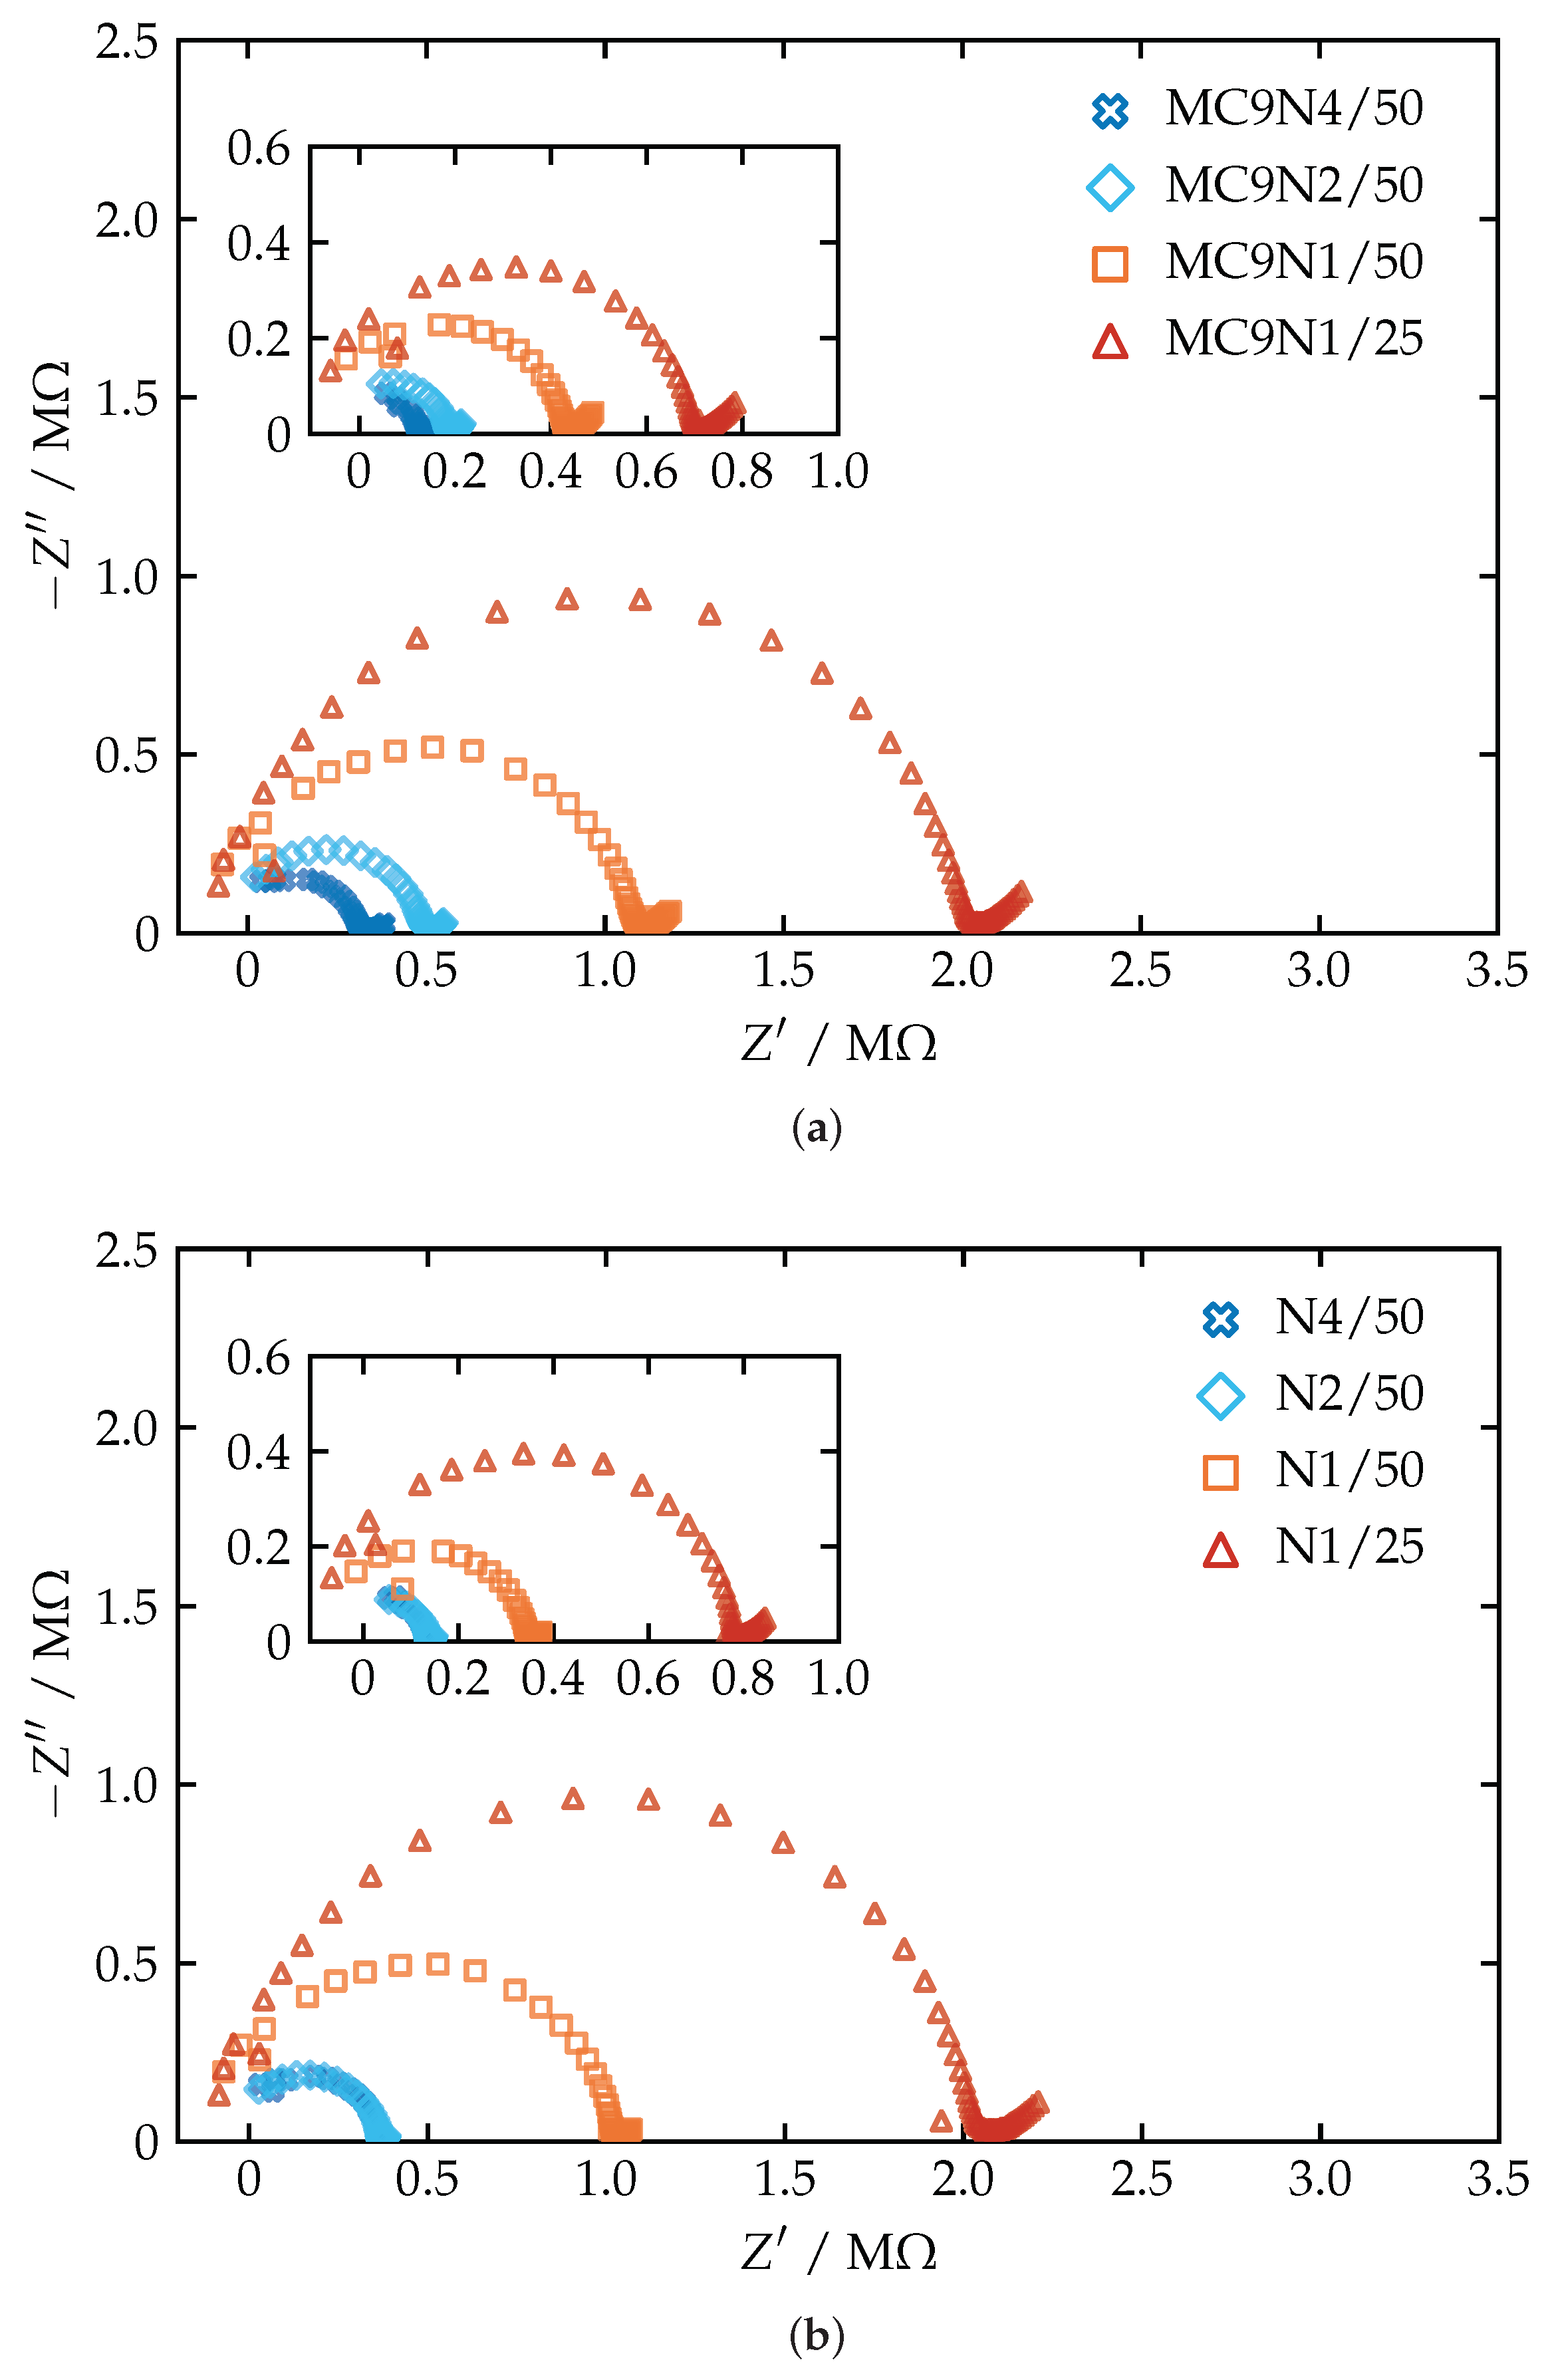
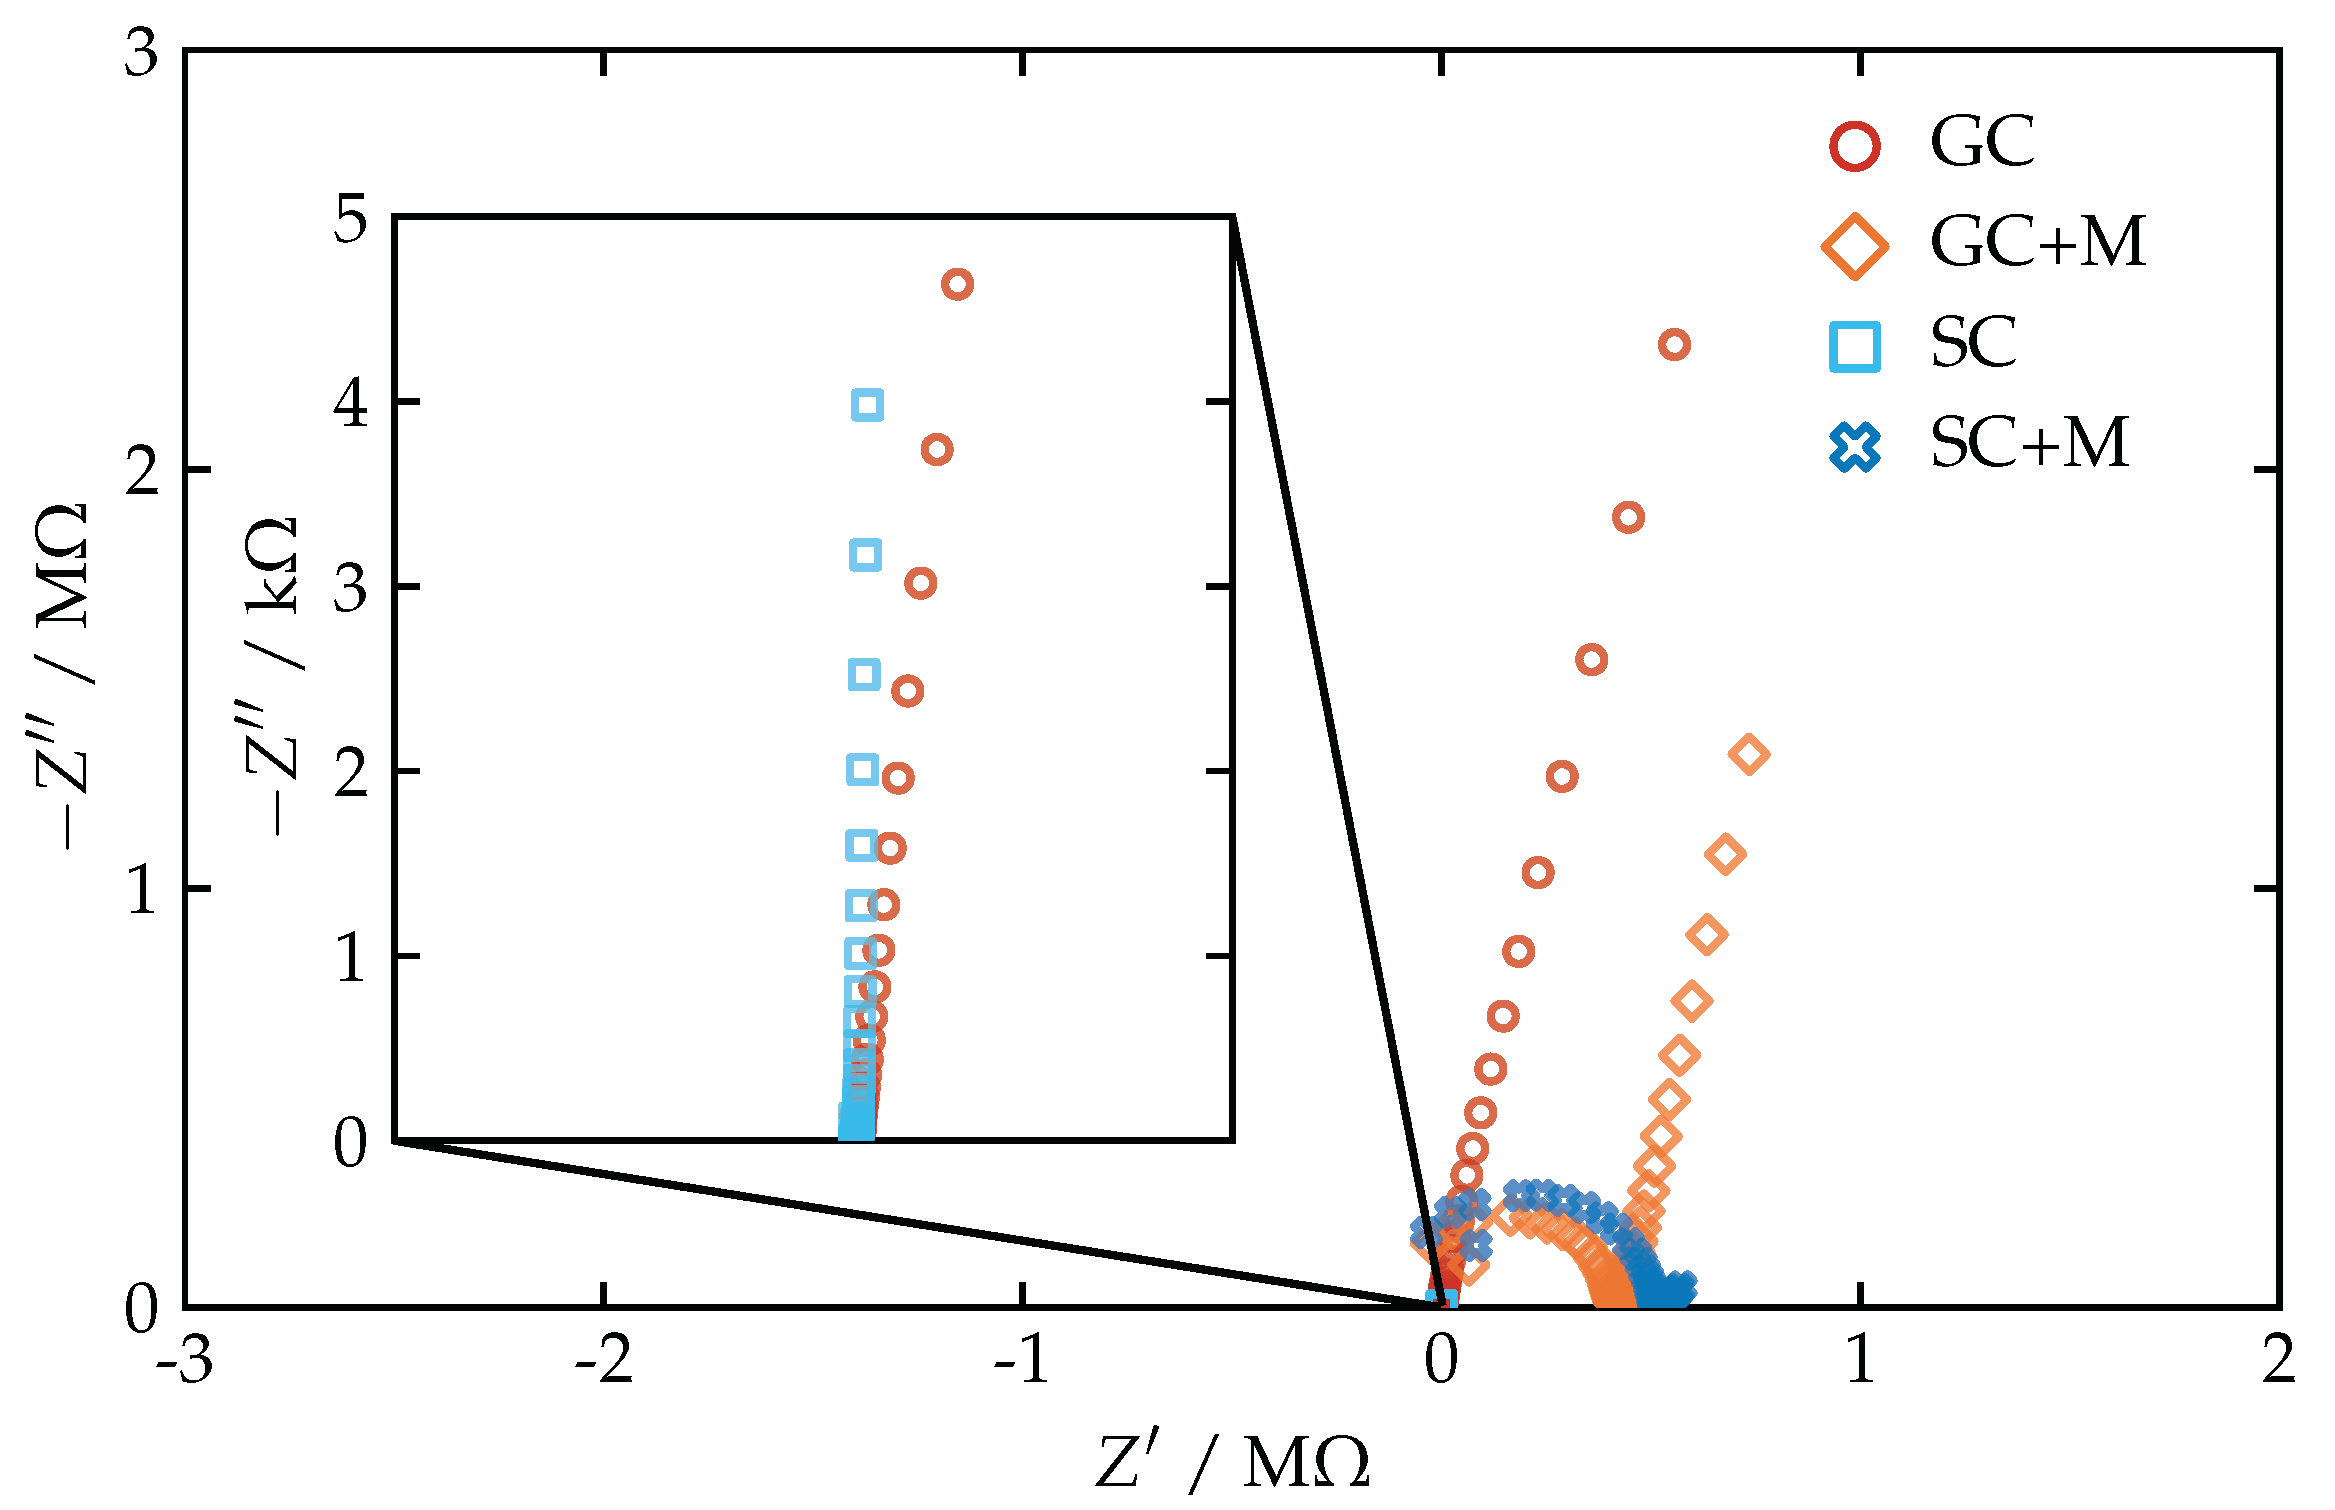
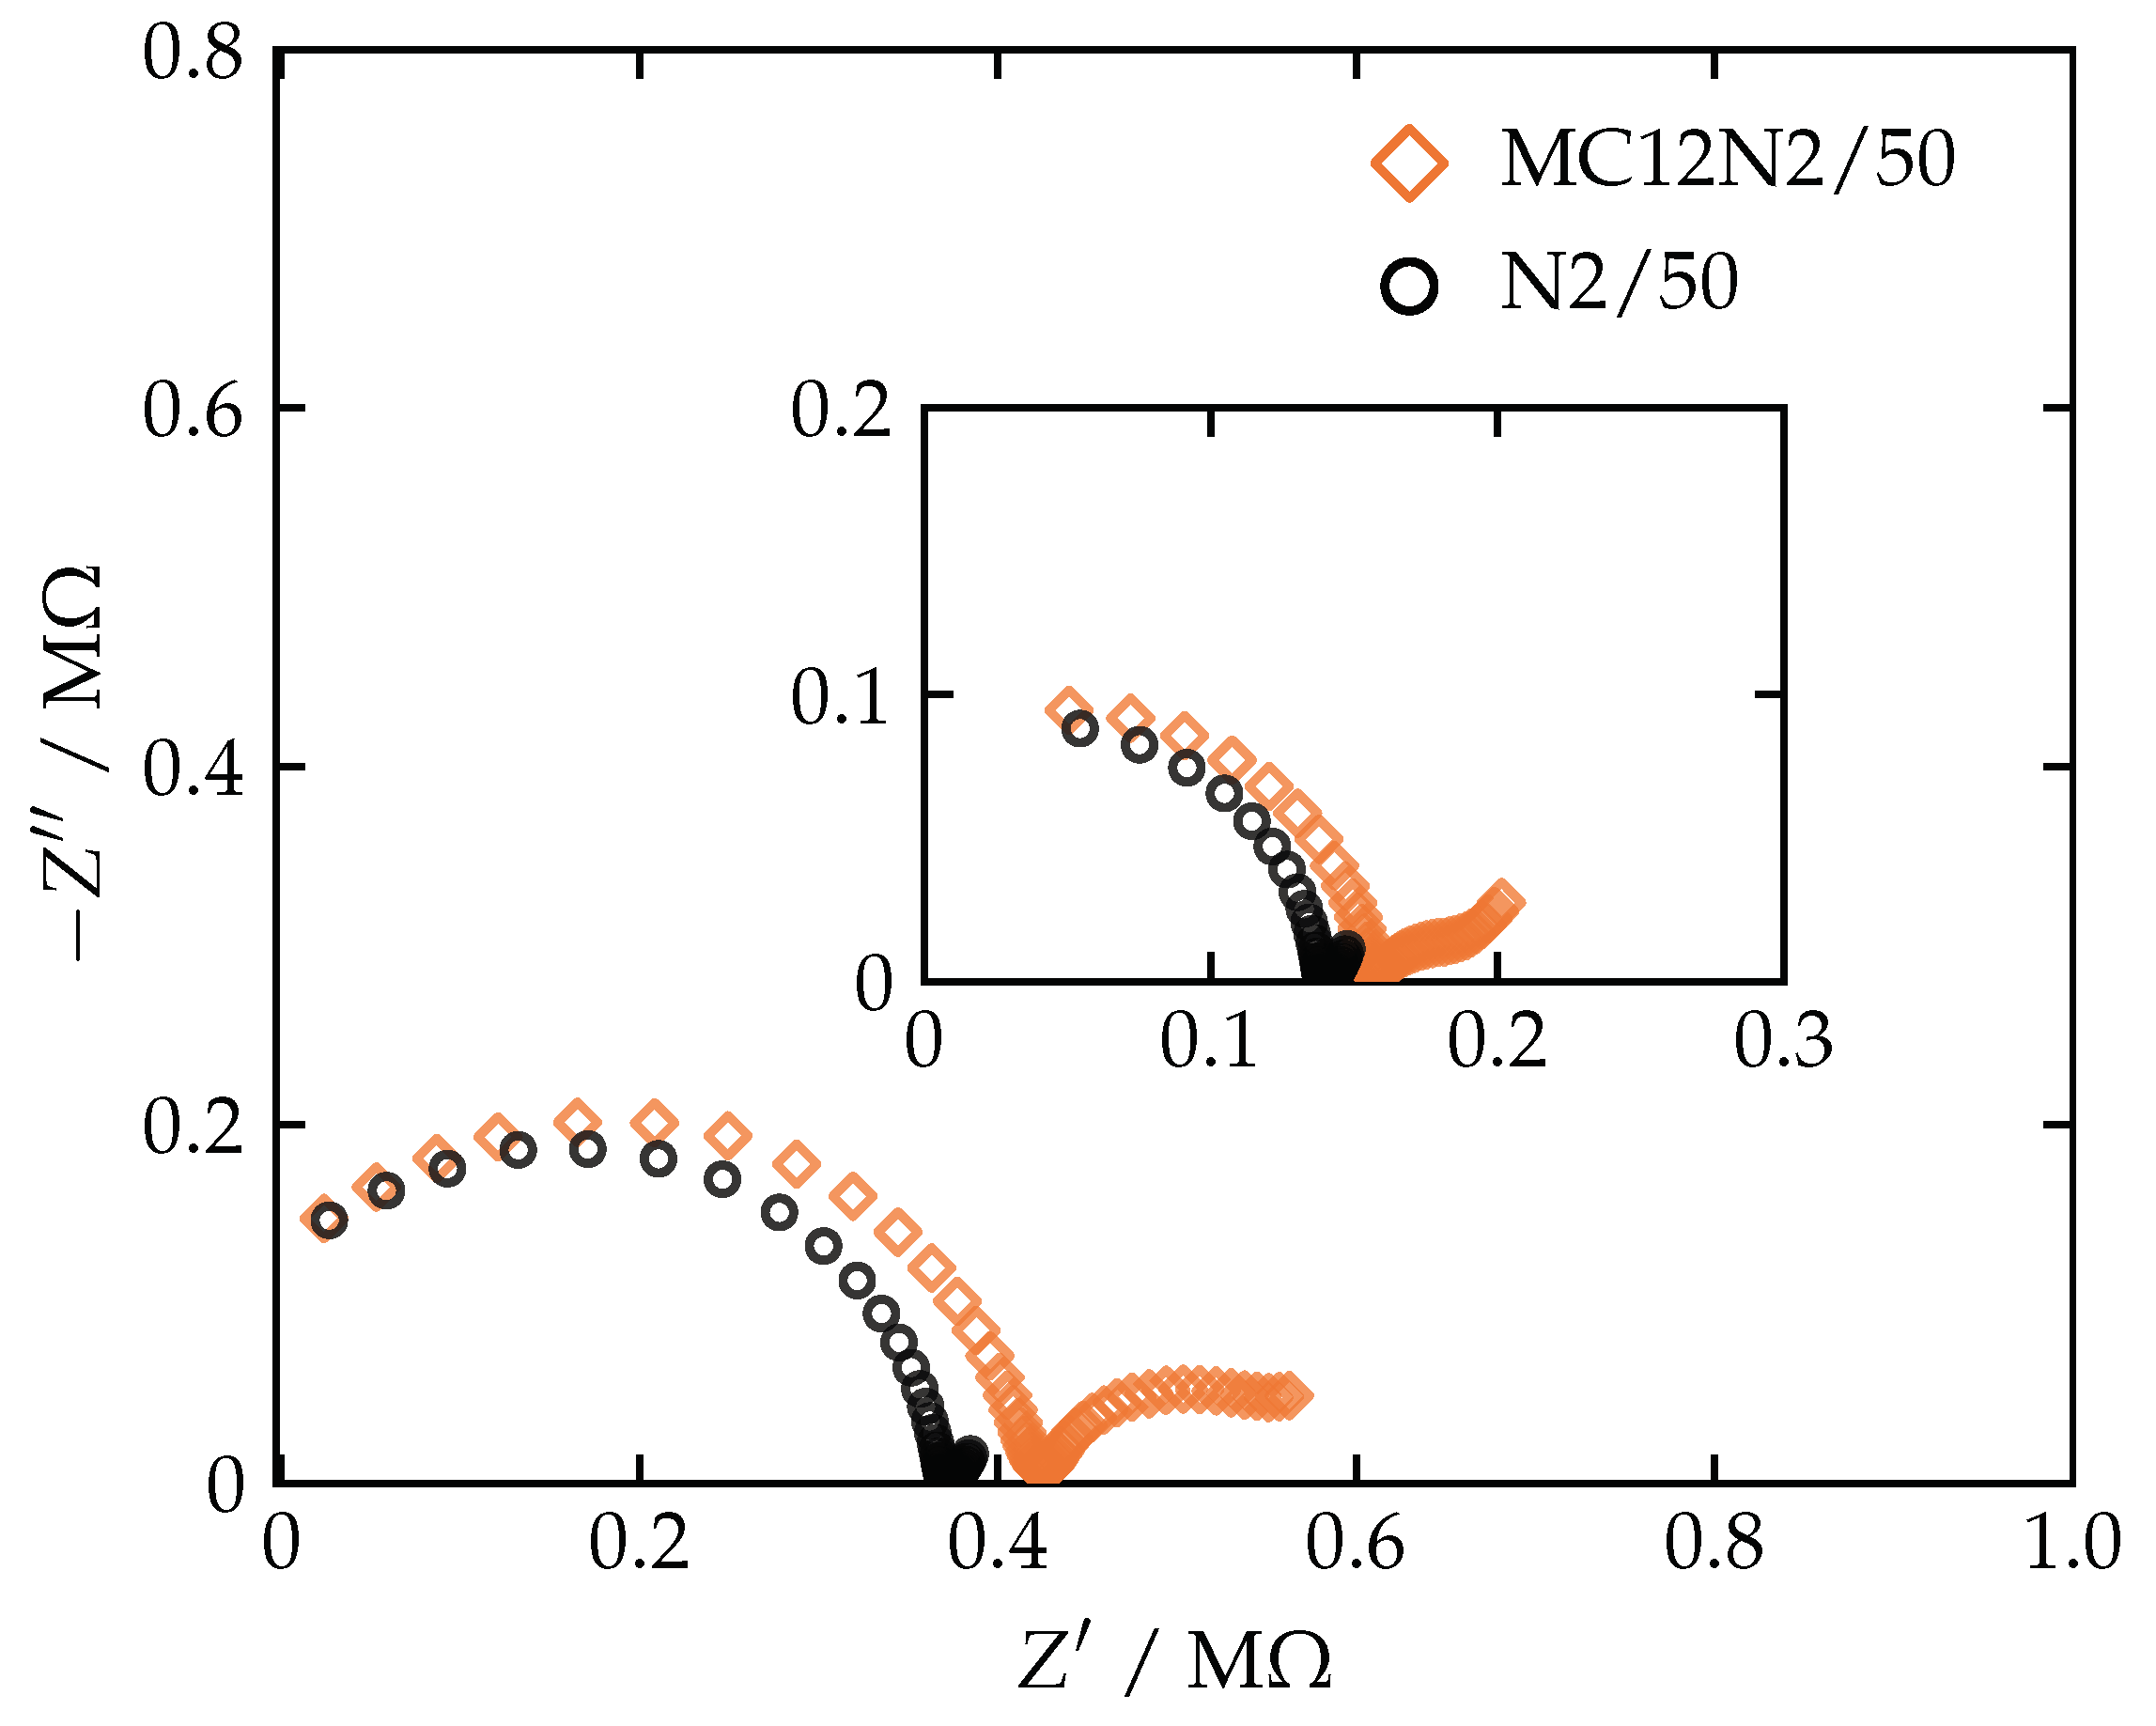
The first measurements performed with the newly prepared sensors were to record their impedance spectra (s Figure 2, Figure A1 and Figure A2). EIS was used together with visual inspection to perform quality control prior to beginning the more time-consuming potentiometric measurements. The spectra showed that the layer of PEDOT:Cl, which functioned as the ion-to-electron transducer, had a sufficiently high redox capacitance in all of the sensors. A small redox capacitance would have resulted in large imaginary impedances in the form of either near vertical lines or large semicircles (Figure A3) that dominated the spectra starting at ever higher frequencies as the redox capacitance decreased.
The bulk resistance and geometric capacitance of the membranes (Table A2), which gave rise to the high-frequency semicircle, were of typical magnitudes given the membrane geometries and membrane matrices. The membranes plasticized with DOS had greater bulk resistances than the membranes plasticized with o-NPOE. The geometric capacitances were greater with the membranes that were plasticized with o-NPOE than those with DOS, which was due to the greater dielectric constant of o-NPOE (Table A2). The sensors that were prepared with PCTFE-shelled electrodes exhibited lower membrane bulk resistances than when prepared with PVC-shelled electrodes, which is explained partially by the different thicknesses of the membranes. The membranes on the PCTFE-shelled sensors had a thickness of approximately 150 μ m , while the thicknesses of the membranes on the PVC-shelled sensors were approximately 300 μ m based on measurements made with a digital caliper. The concentration of PVC in the membranes could have increased during the drop-casting process if the PVC shells were partially dissolved by the solvent in the membrane cocktails, which would have, e.g., reduced the mobility of ions and ion—ionophore complexes through the membrane [41,44].
The membrane bulk conductivity and dielectric constant were estimated based on the high-frequency semicircle portion of the spectra (Table A2). The estimated values were comparable to previously reported values for PVC-based membranes plasticized with either DOS or o-NPOE [38,45]. The lower conductivity of the membranes on the PVC-shelled sensors compared to those on the PCTFE-shelled sensors supported the notion of a higher concentration of PVC in the membranes of the PVC-shelled sensors. According to the results of Dulic et al. [38], the dielectric constant of the DOS-plasticized and the o-NPOE-plasticized membranes could be expected to increase and decrease, respectively, when the concentration of PVC is increased. The dielectric constant of the DOS-plasticized membranes was indeed greater for the PVC-shelled sensors than for the PCTFE-shelled sensors. Contrary to expectations, the o-NPOE-plasticized membranes on the PVC-shelled sensors also had greater dielectric constants than those on the PCTFE-shelled sensors. The influence of membrane thickness on the dielectric constant of the membrane was then studied using CWEs with membranes of different thicknesses. The concentration of the plasticizer should be lower at the membrane surface than in the bulk of the membrane, since the plasticizer is leached out into the aqueous solution over time. Consequently, thicker membranes, which have a greater ratio of volume to surface area, should retain a higher dielectric constant after similar exposure to aqueous solutions. The results showed that the thicker membranes did indeed retain a higher dielectric constant than the thinner membranes (Table A4). However, the greater membrane thickness still does not sufficiently explain the greater dielectric constants of the o-NPOE-plasticized membranes on the PVC-shelled sensors. The increase of the dielectric constant could have been due to the presence of some compound other than PVC that originated from the PVC shell. Both the bulk conductivity and the dielectric constant of the membranes on the PCTFE-shelled sensors increased with increasing anion exchanger concentration (Table A2). The membrane bulk conductivity of the membranes on the PVC-shelled sensors also increased with increasing anion exchanger concentration, but the dielectric constant did not change much except for the deviations observed with the N1/50 and MC9N1/50 membranes.
The impedance spectra of the sensors with DOS and either MC5, MC9, or MC12 (Figure A1a) were similar both in this study and a previous study [30]. Changing the plasticizer from DOS to o-NPOE decreased the membrane bulk resistance, which made the low-frequency impedance characteristics related to charge and mass transfer more visible in Figure A1b compared to Figure A1a. Membranes with MC5 and DOS had previously [30] been noted to exhibit impedances that suggested slower ion-transfer kinetics than the other macrocyclic receptors, and the current results with both another plasticizer and another electrode shell material support that interpretation. The impedances caused by the slower ion-transfer kinetics were more prominent in the impedance spectra of the MC5N2/50 membrane due to the reduced membrane bulk resistance. Some differences could be seen when comparing the spectra of the AC and o-NPOE sensors from this study (Figure A1b) and those from a previous study [31], but the overall shapes of the spectra were similar. The membrane bulk resistances were smaller in the sensors from this study than in those from the previous study [31], which may stem from differences in membrane thicknesses and possibly also the condition of the batches of chemicals used to prepare the membranes. The frequency range used in this study did not go as low (100 M Hz versus 10 M Hz ), which explains the absence of more prominent features related to diffusion that become dominant at low frequencies.

3.4. Potentiometric Calibration

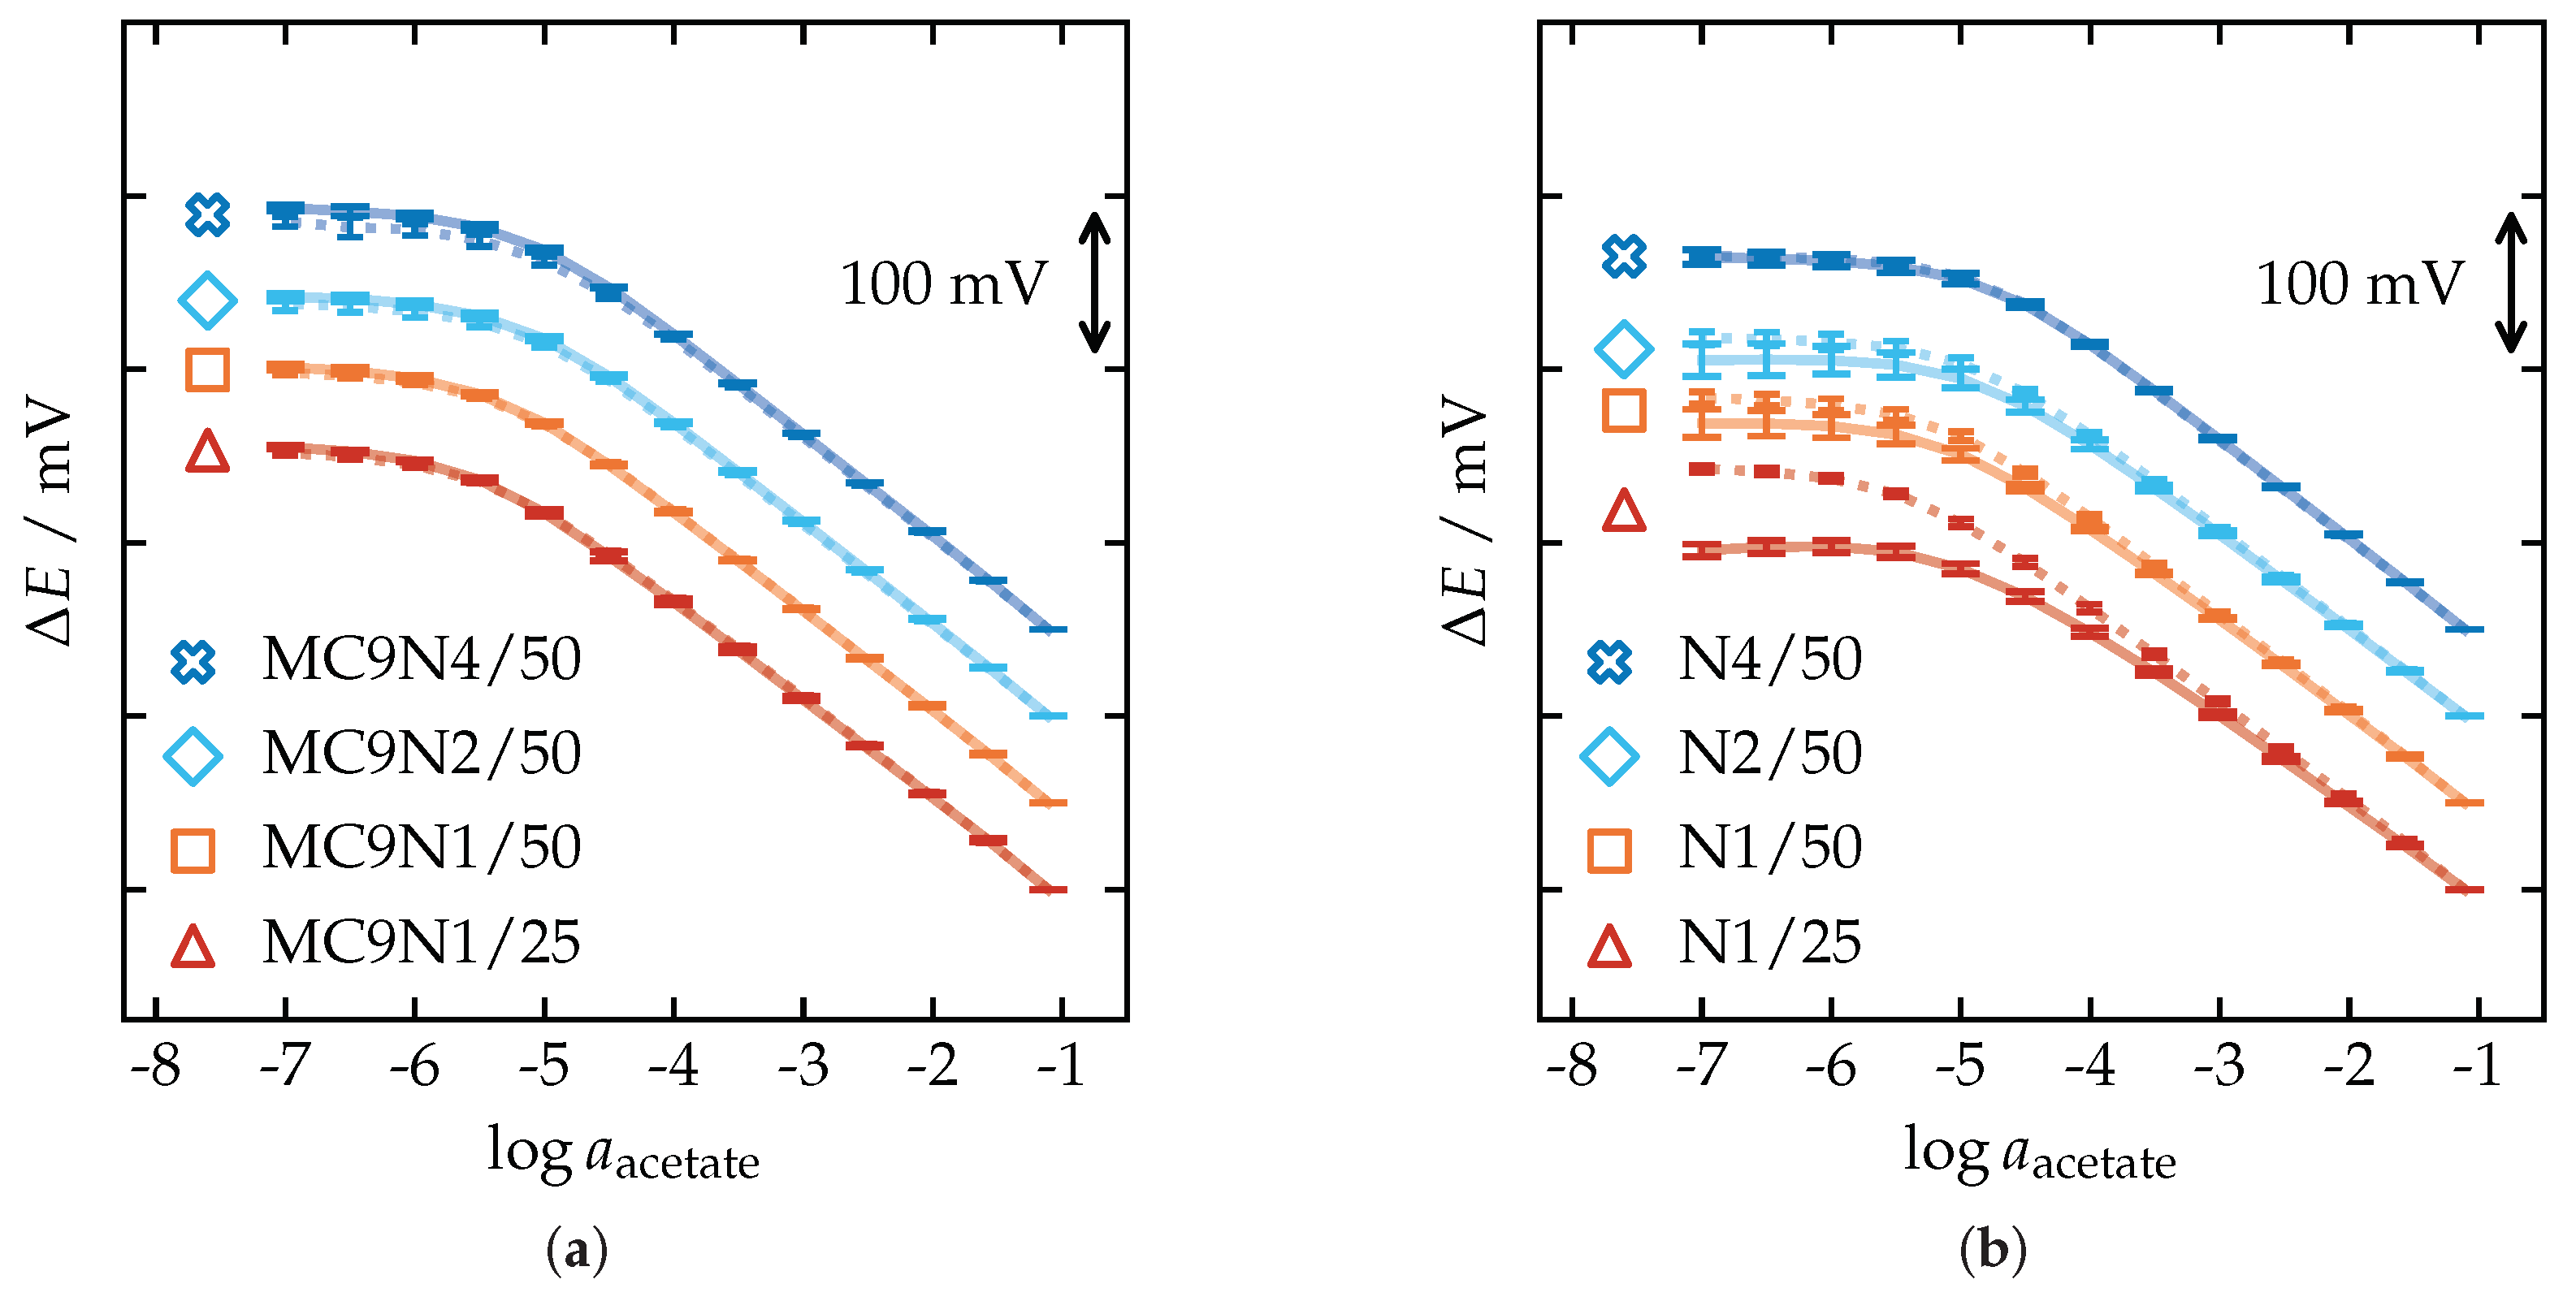
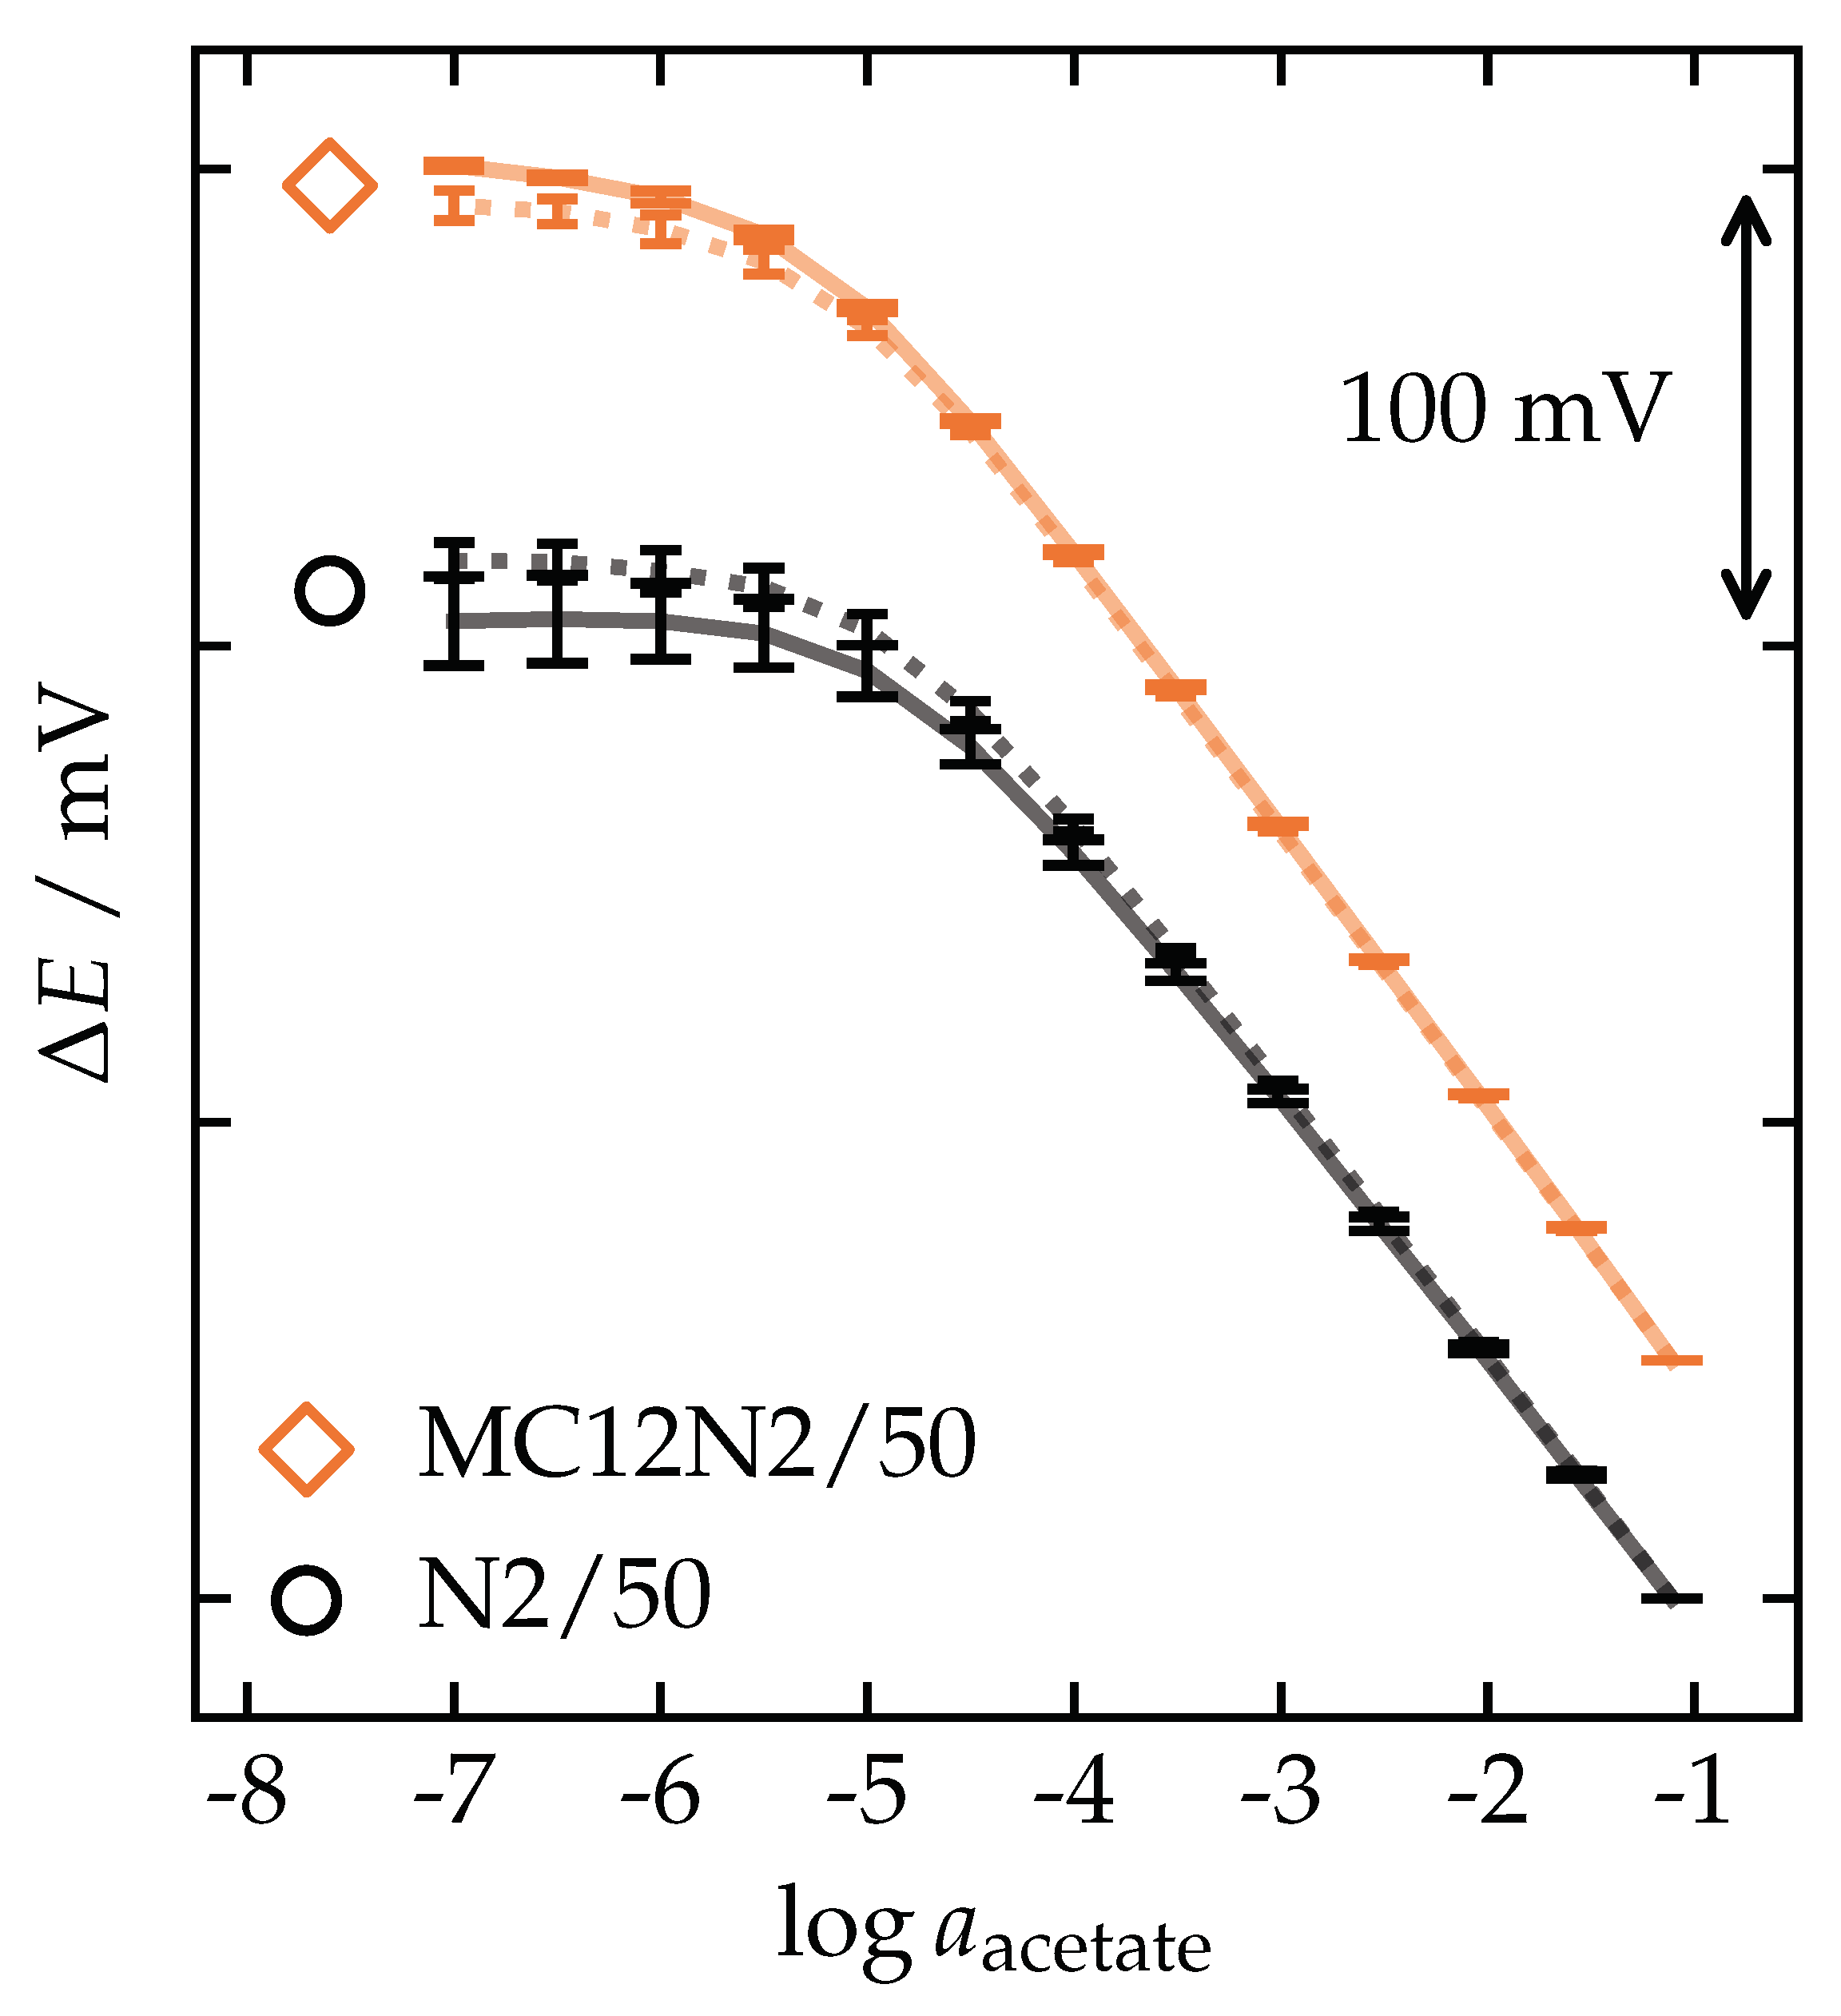
Calibration plots are presented in Figure A4 and Figure A5, while the tabulated averages and standard deviations of the response characteristics determined from the calibrations are presented in Table A5 and Table A6, respectively. The MC12N2/50 sensors (Figure 3) exhibited the best overall characteristics of all the membrane compositions that were tested. The slope, linear range, and detection limit of the MC12N2/50 sensors (Table 2) were as good as or better than some of the previously reported sensors [37,46,47].
The initial set of sensors, which were prepared with DOS as the plasticizer, showed (Figure A4a) the same pattern of larger macrocycles, providing better characteristics than those seen in a previous study [30]. The AC sensors were comparable to the MC9 sensors or slightly sub-Nernstian, but closer to Nernstian than the MC5 and control sensors. Changing the plasticizer from DOS to o-NPOE resulted in improved or similar response characteristics for most of the membranes (Figure A4b). The AC sensors became comparable to the MC9 sensors or better. The MC5 sensors were an exception, as the linear range instead became narrower. The limit of detection also deteriorated for the PVC-shelled MC5 sensors, as can be seen in the responses to activities below 10 4 M . These disparities could not be explained by, e.g., their sensitivity to C l , since the more sensitive PCTFE-shelled sensors performed better.
The series of control sensors with o-NPOE-plasticized membranes and varying concentrations of anion exchanger exhibited a pattern of increasing disparity between sensors prepared with PVC- and PCTFE-shelled electrodes, as the concentration of the anion exchanger was reduced (Figure A5). However, such disparities were not exhibited by the sensors that contained the ionophore (MC9). Decreasing the concentration of the ionophore and/or anion exchanger resulted in slightly lower slopes and improved detection limits, and a wider linear range was attained at the lowest tested concentrations of the ionophore.
Comparison of the results from this study with those from the two previous studies [30,31] showed clear improvements. The slopes of the PVC-shelled AC sensors with o-NPOE-plasticized membranes improved from sub-Nernstian to near-Nernstian, and the detection limits also improved. The response characteristics improved across the board for the PVC-shelled sensors with DOS-plasticized membranes incorporating the macrocyclic receptors. These improvements are attributed to the use of a less concentrated bridge electrolyte in the reference electrode.

3.5. Potentiometric pH Sensitivity

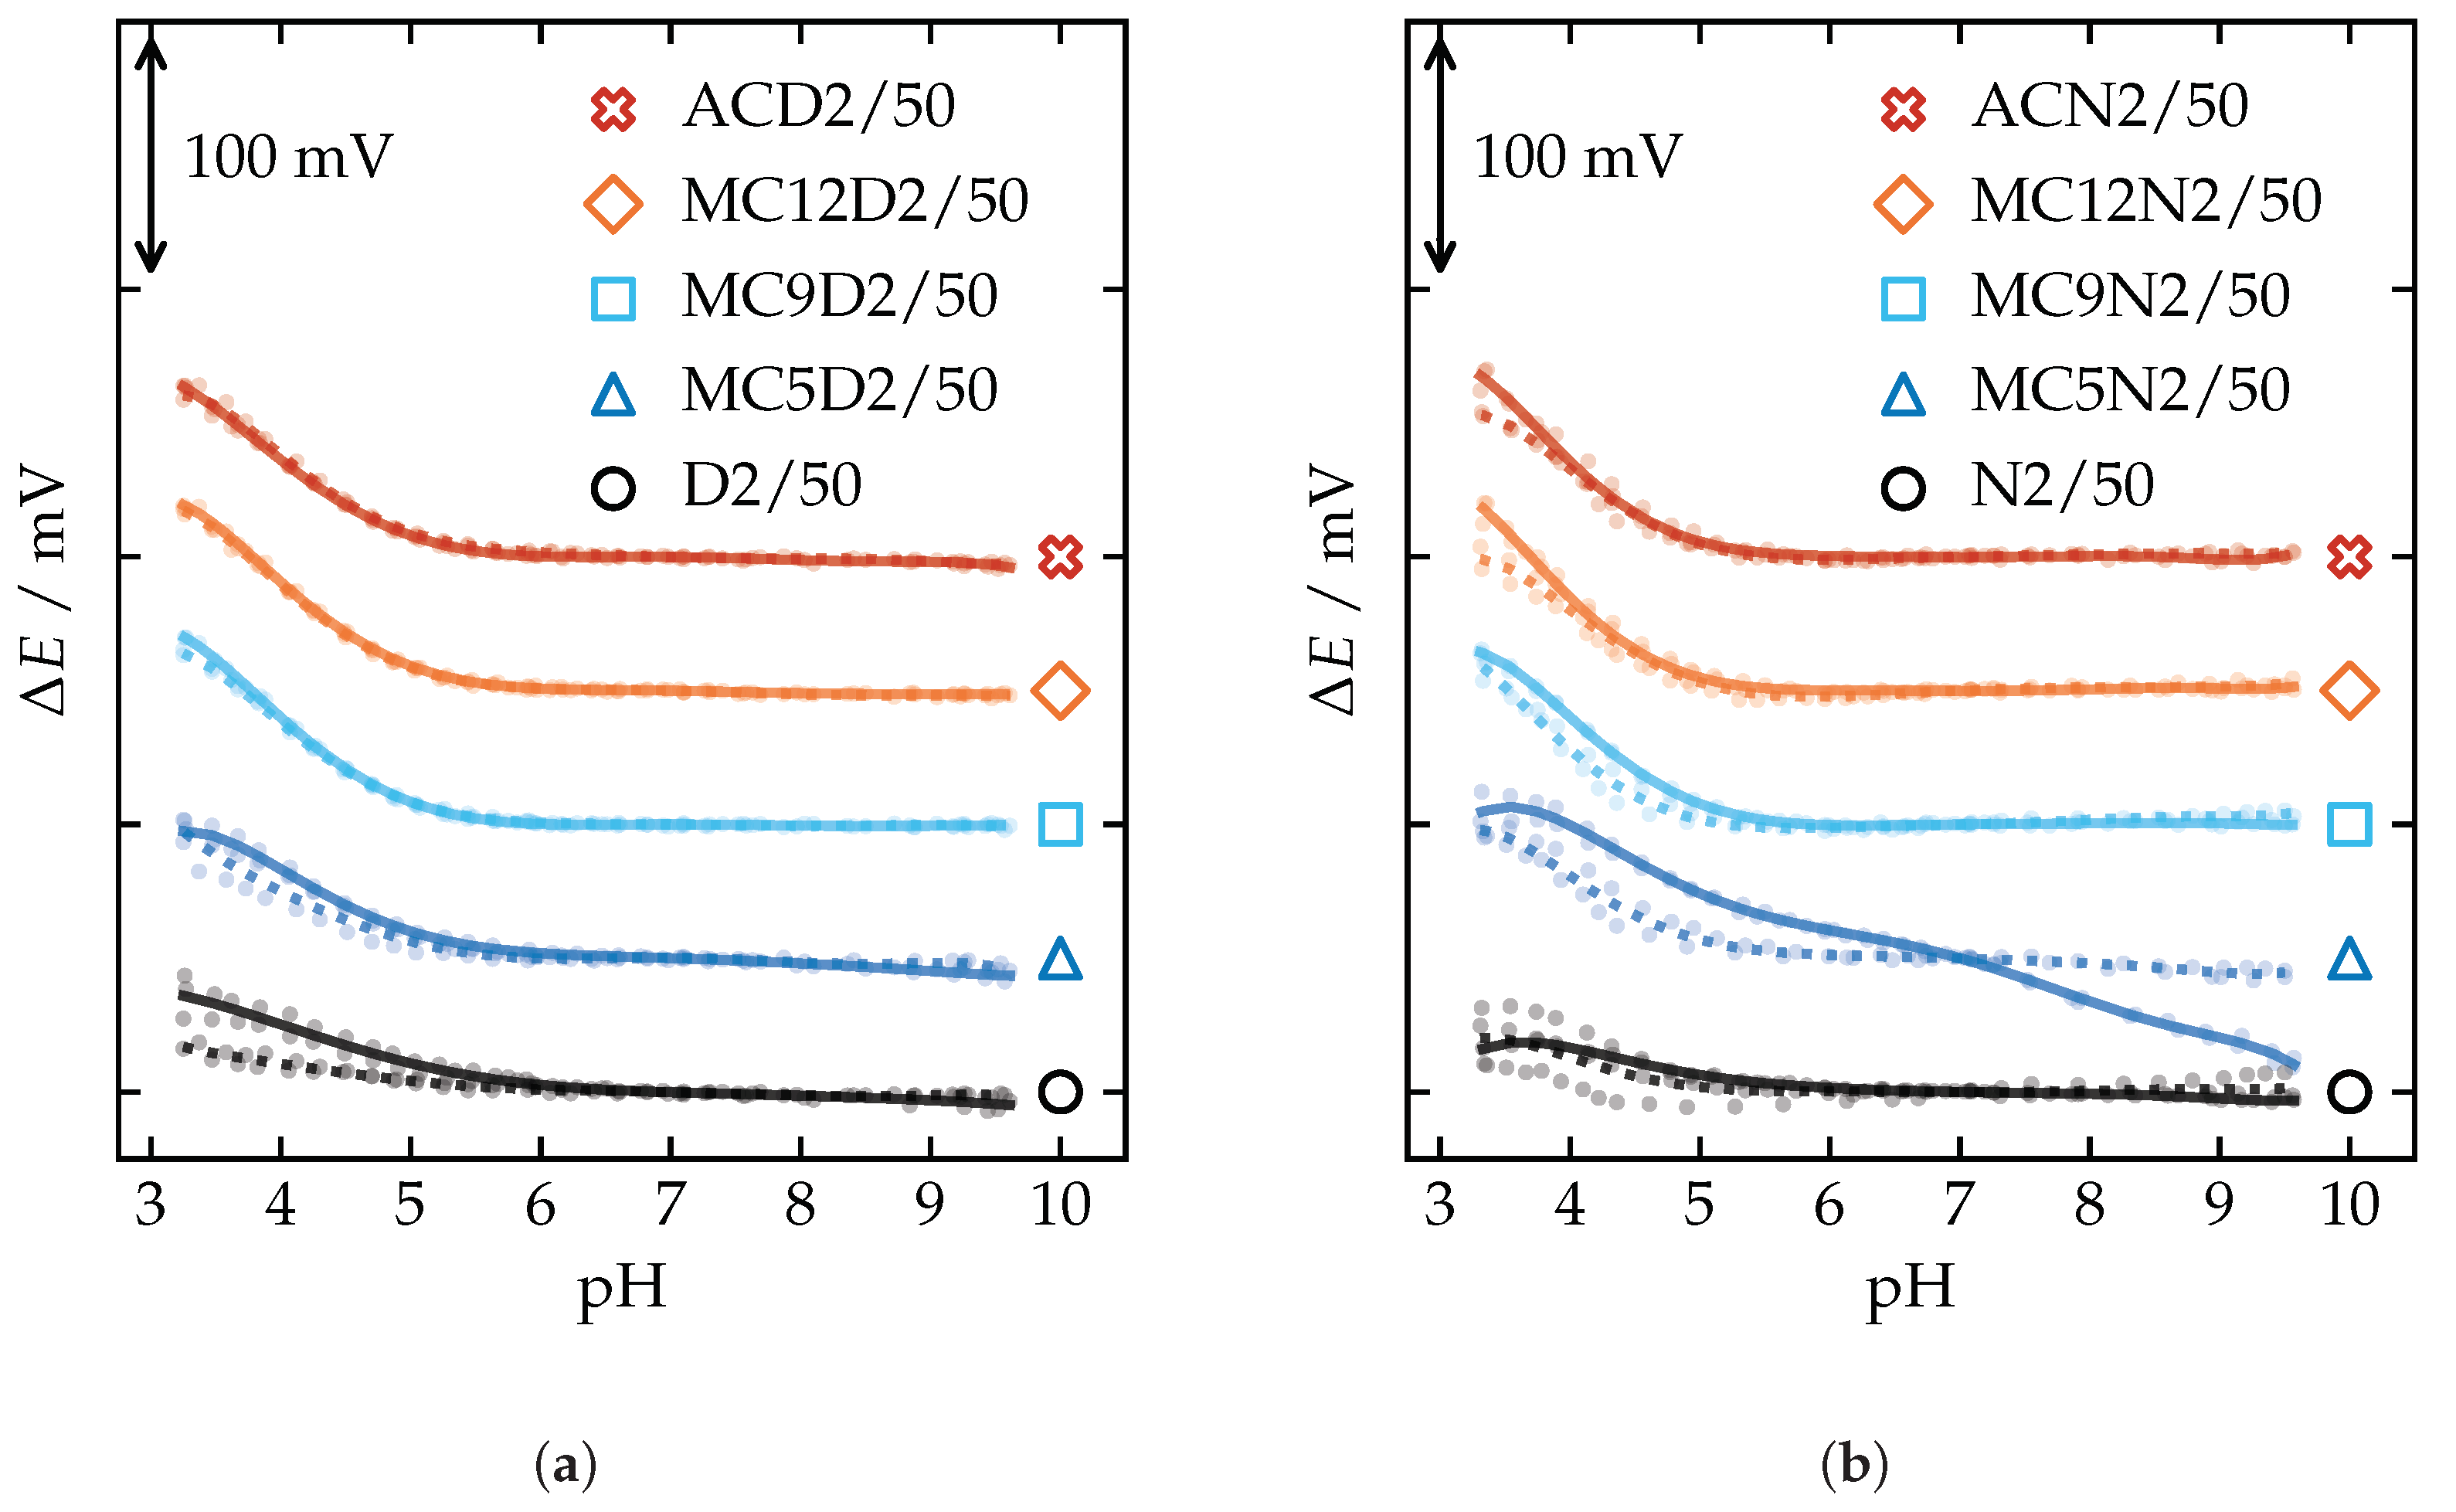
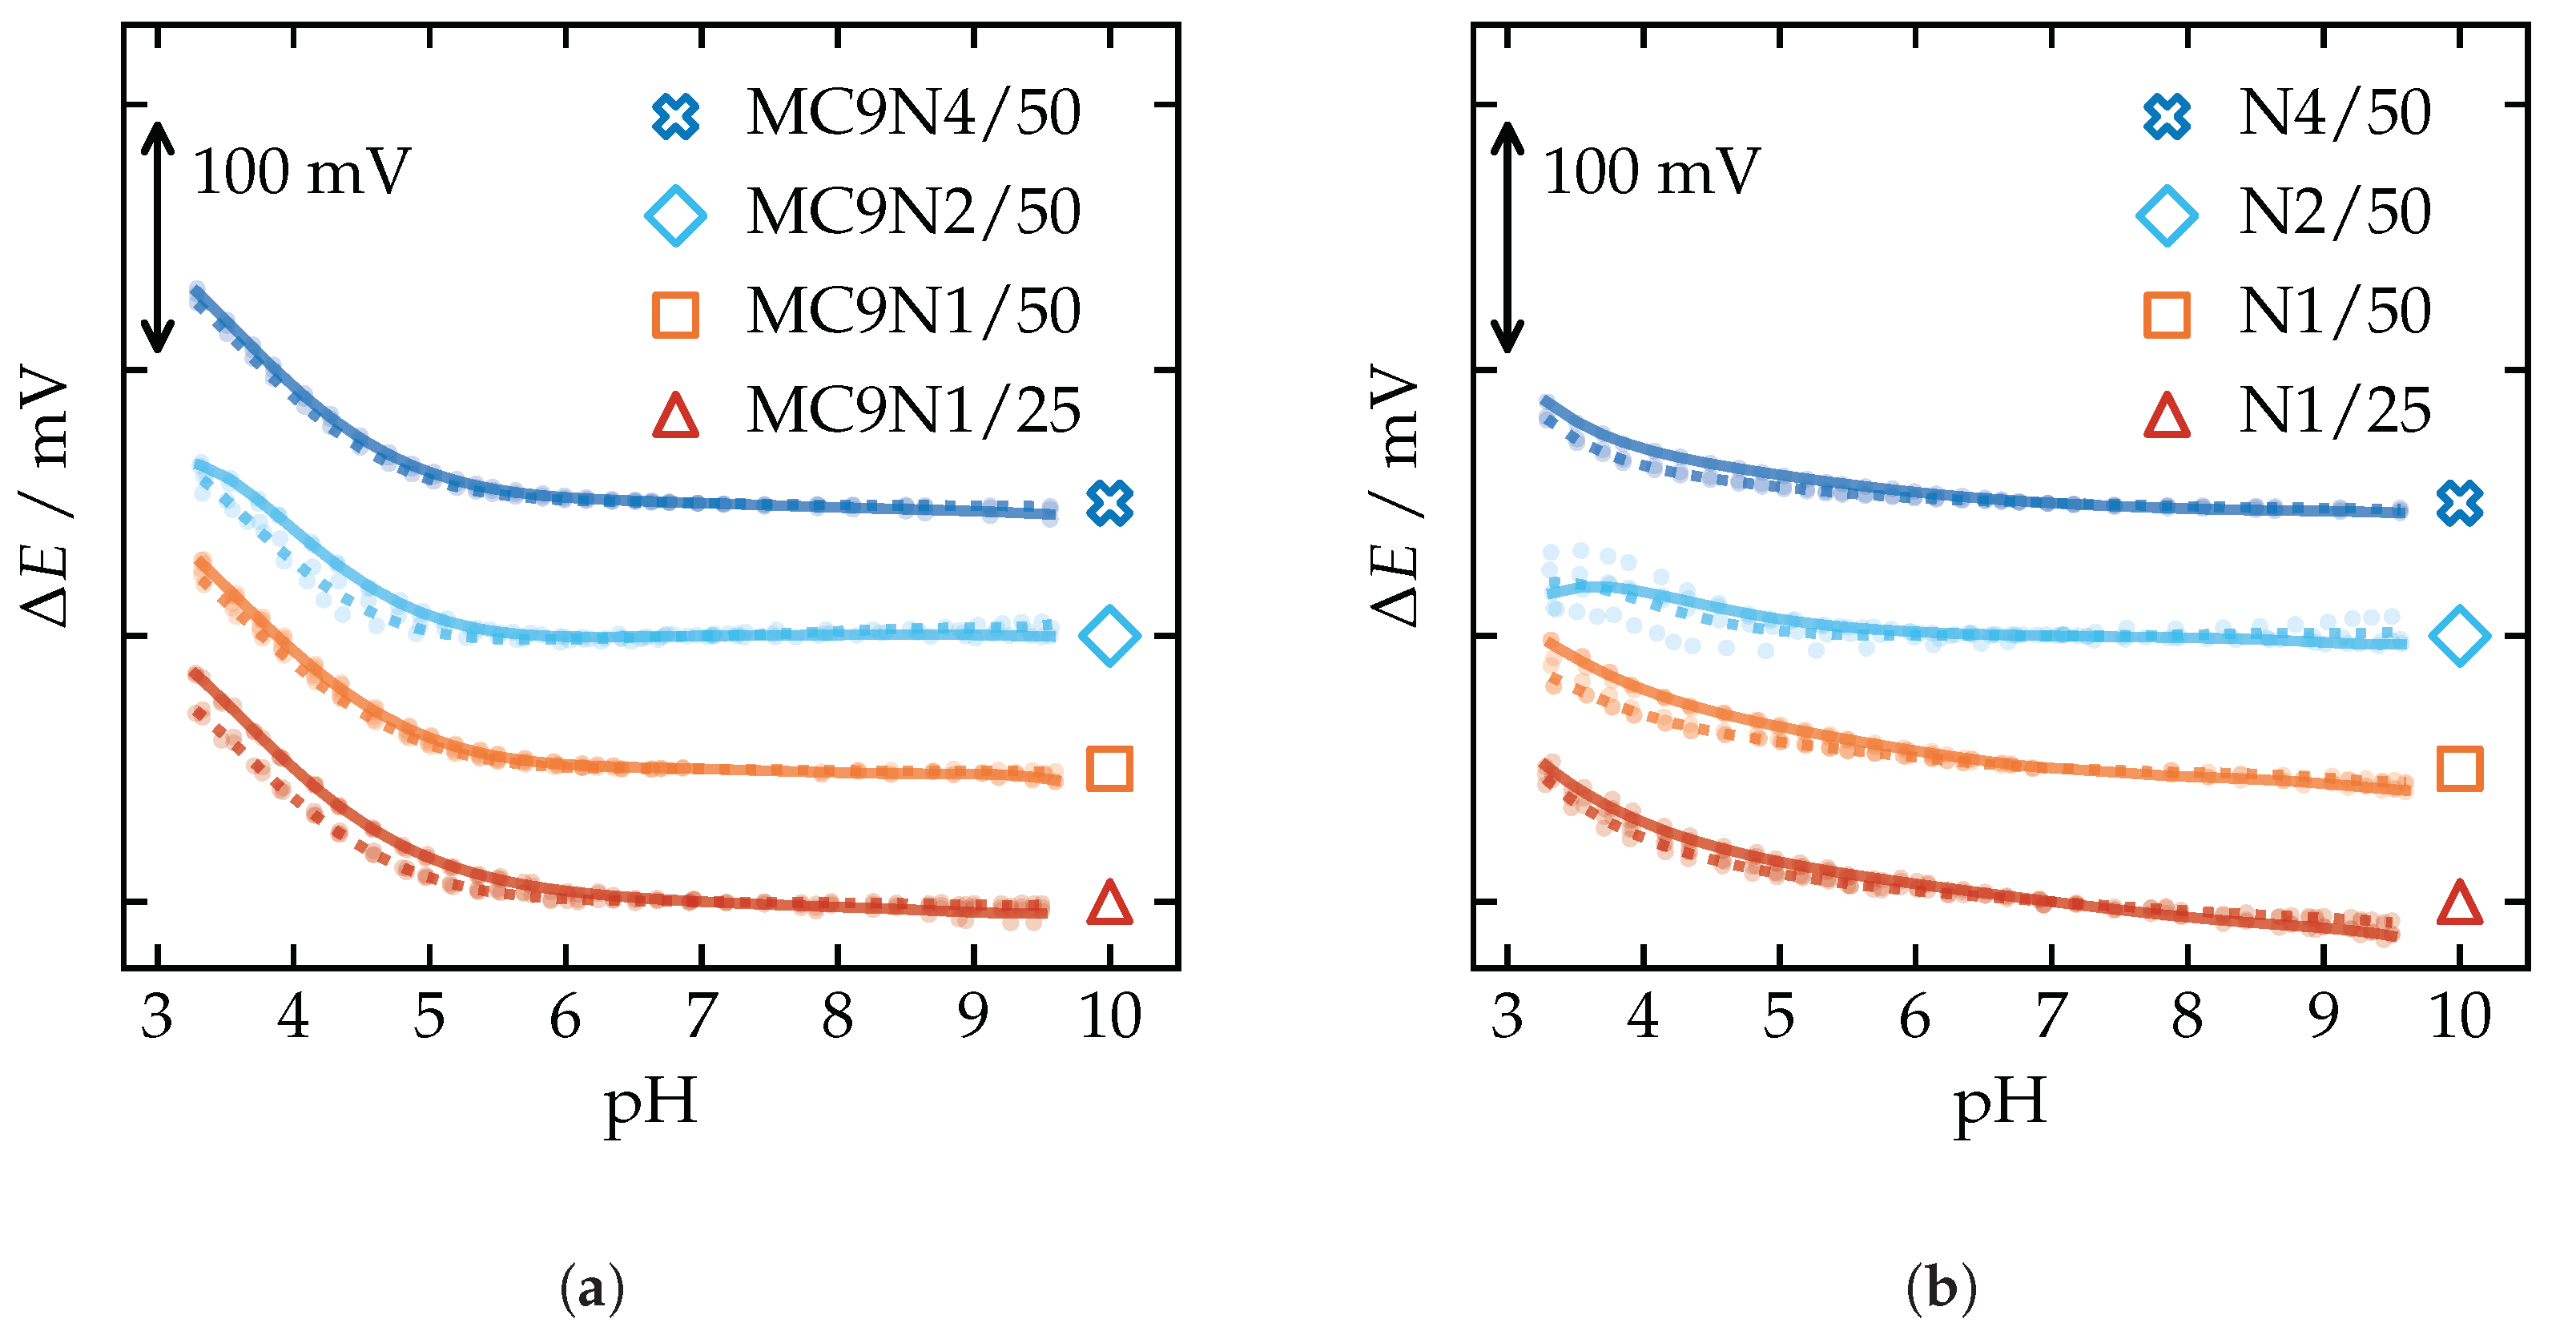
As expected, the deprotonation of acetic acid ( pKa = 4.76 ) increased the activity of acetate and caused the decrease in potential observed between approximately pH 3 and 7 (Figure 4). The declines in potentials that had previously been seen above pH 7 with the macrocyclic receptors with DOS-plasticized membranes [30] were now absent (Figure A6a). Almost all of the sensors with o-NPOE-plasticized membranes were also devoid of undesirable pH dependencies. However, the PVC-shelled MC5 sensors exhibited declines in potentials throughout the measurements. Curiously enough, the PCTFE-shelled sensors with the same membrane did not exhibit the same phenomenon, and neither did the controls regardless of the shell material. This result suggests that some interaction involving MC5, o-NPOE, and some component from the PVC shell influenced the response. The influence of C l can still be seen in the responses (i.e., lower slope) of the control and MC5 sensors at low pH, where the acetate activity is lower. The sensors prepared with o-NPOE and various concentrations of MC9 did not exhibit any obvious pH dependency (Figure A7a). However, there were some minor differences in the responses of PVC- and PCTFE-shelled sensors below pH 6.
The changes in solution pH also affect the inside of the membrane. This is because, in spite of the negligibly small concentration of solvated protons inside the membrane, their thermodynamic activity (in terms of chemical potential or pHabs value [48]) in the membrane is the same as in the solution. This change of pHabs inside the membrane is not expected to markedly affect the membrane components because those do not have suitable acid–base properties. However, it may affect the carboxylates. Even when the solution pH is, e.g., 2–4 units higher than the pKa of the respective acid, it may partially migrate into the nonpolar membrane as neutral acid because the nonpolar medium makes such acids weaker, and the same thermodynamic activity of protons is sufficient to keep them protonated in the membrane. This might explain why, in many cases, even at pH values as high as 7–9, there is still a slight decrease of Δ E upon increase of pH.

3.6. Potentiometric Selectivity

Sensors incorporating MC12 were shown again [30] to be the most selective towards acetate overall when compared to sensors with any of the other receptors included in this study (s Table A7, Table A9, and Table A11). The MC12N2/50 sensors (Table 3) were less affected by the interference caused by Cl, NO3, formate, and lactate than the sensors reported by Amemiya et al., but were more susceptible to interference from HCO3, I, SCN,and benzoate [37].
o-NPOE proved to be a better choice than DOS as the plasticizer for all of the receptors except MC5, which became more susceptible to interference, unlike the other receptors. The macrocyclic receptors did maintain the overall trend of improved discrimination of interfering ions, as the size of the macrocycle’s cavity increased when using DOS as the plasticizer [30], and this pattern became more pronounced when using o-NPOE. The selectivity coefficients of AC with o-NPOE improved or remained the same for the most part, but the selectivity coefficients for F, HPO42−, SO42−, and Cl were higher than previously [31] by approximately 0.1–0.6 logarithmic units in this study. The PVC- and PCTFE-shelled sensors with DOS-plasticized membranes exhibited minor differences in selectivity regardless of the ionophore (or lack thereof), with HPO42− being the only exception for MC5. However, several larger differences in selectivity could be observed between the PVC- and PCTFE-shelled sensors when o-NPOE was used as the plasticizer and either MC5 or MC12 was used as the ionophore. Sensors with either MC9 or AC in their o-NPOE-plasticized membranes were affected much less by the material of the electrode body.
Decreasing the concentration of the ionophore (MC9) and/or the anion exchanger resulted in improved selectivity toward acetate (Table A11). Discrimination of interferents improved primarily for the more hydrophilic F, HPO42−, H2PO4, and SO42−, but the PVC-shelled sensors also showed greater improvement in the discrimination of the more lipophilic Br, NO3, I, and SCN than their PCTFE-shelled counterparts did. The differences in selectivity between PVC- and PCTFE-shelled sensors were minor when the concentration of MC9 was 2 wt.%, while MC5 and MC12 showed larger differences at the same concentration. Reducing the concentration of MC9 and/or the anion exchanger resulted in larger differences in selectivity between the PVC- and PCTFE-shelled sensors. The selectivity of the control sensors followed the Hofmeister series for the most part, regardless of membrane composition.
Overall, the sensors incorporating any of the ionophores exhibited selectivity for carboxylates in general. For the most part, the sensors in this study were less selective for acetate than previously reported sensors based on derivatives of porphyrin or uranyl salophene [37,46,47,49]. While the sensors’ selectivity for acetate was modest, selectivity for more lipophilic carboxylates, e.g., benzoate, was good.

4. Conclusions

The selectivity of the sensors incorporating the macrocyclic receptors was shown to follow a trend of macrocyclic receptors with larger cavities producing more selective sensors for acetate, in good agreement with a preliminary study [30]. It was shown that this trend held true with both of the plasticizers that were tested in this study. Sensors incorporating the acyclic receptor (AC) performed, in many cases, similarly to sensors incorporating either of the two larger macrocyclic receptors (MC9 or MC12). However, the sensors incorporating either MC9 or MC12 discriminated the more hydrophilic interfering ions more strongly than sensors incorporating AC. o-NPOE-plasticized membranes containing MC12 produced the best sensors overall. The sensors’ selectivity for acetate was modest, but they were clearly selective for carboxylates. Consequently, the sensors could be used for more lipophilic carboxylates like benzoate. Most of the sensors prepared with o-NPOE as the plasticizer performed better than or as well as the sensors prepared with DOS in terms of slope, detection limit, and selectivity. However, the sensors incorporating MC5 performed worse when prepared with o-NPOE: Linear ranges became narrower, the limits of detection worsened, and roughly half of the selectivity coefficients worsened.
The results show that electrode shells made from PVC can significantly influence the response characteristics of anion-selective SC-ISEs. The bulk dielectric constant was estimated for each membrane based on the recorded impedance spectra. Elevated dielectric constants were observed for o-NPOE-plasticized membranes when drop-cast onto PVC-shelled electrode bodies. The results could not be explained by an increase in the PVC content of the membrane due to partial dissolution of the electrode body during drop-casting or by differences in leakage of the plasticizer resulting from different membrane thicknesses. o-NPOE-plasticized membranes containing the MC5 ionophore produced anomalous behavior during pH sensitivity measurements when those membranes were drop-cast onto PVC-shelled electrode bodies. Since the exact composition of the commercial PVC shells is not known, it can only be speculated at this point that some component (e.g., plasticizer, additive) of the PVC shell dissolved into the plasticized PVC anion-selective membrane and interfered with the anion recognition process. PVC- and PCTFE-shelled sensors with o-NPOE-plasticized membranes exhibited larger differences in selectivity when either MC5 or MC12 were used as the ionophore.
Varying the concentration of the ionophore (MC9) and/or the anion exchanger (TDMACl) showed several important effects. First, reducing the concentration of the anion exchanger improved selectivity, extended the linear range, and improved the detection limit. Second, the concentration of the ionophore made little difference within the range that was tested (1–4 wt . % ), but as long as the ionophore was present in the membrane, the aforementioned response characteristics were improved further. Third, disparities between the responses of the PVC- and the PCTFE-shelled sensors grew as the concentrations of the ionophore and/or the anion exchanger were reduced. These differences were particularly apparent for the control sensors in the calibration measurements when measuring activities below 10 4 M and for the ion-selective sensors in the selectivity measurements involving the most lipophilic interfering anions ( B r , N O 3 , I , and S C N ).

Author Contributions

Conceptualization, methodology, supervision, project administration, and funding acquisition were performed by I.L. and J.B. Investigation, data curation, and formal analysis related to receptors were performed by M.I. and S.A.K. Investigation, data curation, formal analysis, and visualization related to sensors were performed by I.S. and V.Y. Writing (original draft preparation) was performed by V.Y. Writing (review and editing) was performed by I.L., I.S., J.B., M.I., S.A.K., and V.Y. All authors have read and agreed to the published version of the manuscript.

Funding

This work is part of the activities of the Johan Gadolin Process Chemistry Center (PCC) at Åbo Akademi University (ÅAU). Financial support from the Magnus Ehrnrooth Foundation and ÅAU is gratefully acknowledged by V.Y. The work at the University of Tartu was funded by the Estonian Research Council grant (PRG690) and by the EMPIR program (project 17FUN09 “UnipHied”, www.uniphied.eu) co-financed by the Participating States and from the European Union’s Horizon 2020 research and innovation programme.

Conflicts of Interest

The authors declare no conflict of interest.

Abbreviations

The following abbreviations are used in this manuscript:
ACAcyclic receptor
CWECoated wire electrode
DMSODimethyl sulfoxide
DOSBis(2-ethylhexyl) sebacate
EDOT3,4-ethylenedioxythiophene
EISElectrochemical impedance spectroscopy
HMWHigh molecular weight
GCGlassy carbon
ISEIon-selective electrode
ISMIon-selective membrane
MC5Macrocyclic receptor with five methylene units in the linker
MC9Macrocyclic receptor with nine methylene units in the linker
MC12Macrocyclic receptor with twelve methylene units in the linker
OCPOpen-circuit potential
o-NPOE2-nitrophenyl octyl ether
PCTFEPoly(chlorotrifluoroethylene)
PEDOTPoly(3,4-ethylenedioxythiophene)
PVCPoly(vinyl chloride)
RMSRoot mean square
SC-ISESolid-contact ion-selective electrode
TDMAClTridodecylmethylammonium chloride
THFTetrahydrofuran

Appendix A

Appendix A.1. Receptor Binding Constants

Table A1. Binding constants that have been published previously for the receptors and the monocarboxylates that were included in this study [28,30]. The binding constants were determined using 99.5 %: 0.5 % (w/w) dimethyl sulfoxide (DMSO)- d 6 : H 2 O as the solvent system. See Figure 1 for receptor structures.
Ion log K ass
ACMC5MC9MC12
P i v O 5.394.935.825.40
A c O 4.985.005.695.00
B z O 4.204.174.954.41
L a c O 3.833.364.073.62
H C O 2 3.634.064.593.86

Appendix A.2. Electrochemical Impedance Spectroscopy

Figure A1. Impedance spectra of sensors with membranes containing 2 wt . % ionophore, 50 mol . % (relative to the ionophore) tridodecylmethylammonium chloride (TDMACl), and either (a) DOS or (b) o-NPOE as the plasticizer. PVC-shelled sensors are shown in the main plots and PCTFE-shelled sensors in the insets. Measurements were performed in 10 1 M sodium acetate with the parameters f = 100   m Hz 100   k Hz , E d c = 0   V vs . OCP , and Δ E a c = 100   mV (root mean square—RMS). See Table 1 for membrane compositions.
Chemosensors 09 00004 g0a1
Figure A2. Impedance spectra of (a) sensors incorporating MC9 and (b) control sensors. The membranes were all plasticized with 2-nitrophenyl octyl ether (o-NPOE). PVC-shelled sensors are shown in the main plots and PCTFE-shelled sensors in the insets. Measurements were performed in 10 1 M sodium acetate with the parameters f = 100   m Hz 100   k Hz , E d c = 0   V vs . OCP , and Δ E a c = 100   m V ( RMS ) . See Table 1 for membrane compositions.
Chemosensors 09 00004 g0a2
Table A2. Average membrane bulk resistance ( R b ), geometric capacitance ( C g ), conductivity ( σ ), and dielectric constant ( ε r ) of the sensors. The membrane thicknesses were approximately 300 μ m and 150 μ m for the PVC-shelled and the PCTFE-shelled sensors, respectively. The number of measurements and the number of sensors were n = 1 and k = 2 , respectively, unless noted otherwise. See Table A3 for standard deviations. See Table 1 for membrane compositions.
Membrane R b (M Ω ) C g (pF) σ ( μ S m 1 ) ε r
PVCPCTFEPVCPCTFEPVCPCTFEPVCPCTFE
N1/252.0 a 0.8 a 11.1 a 11.3 a 7.4 a 12.6 a 18.9 a 12.8 a
N1/501.0 a 0.3 a 9.5 a 12.7 a 14.9 a 29.5 a 16.1 a 14.4 a
N2/500.40.111.314.239.572.719.116.1
D2/506.84.85.96.02.22.19.96.8
N4/500.4 a 0.1 a 11.4 a 14.8 a 42.2 a 78.0 a 19.3 a 16.7 a
MC5N2/500.60.211.114.127.045.918.816.0
MC5D2/508.14.86.26.41.92.110.57.2
MC9N1/252.0 a 0.7 a 11.2 a 12.1 a 7.7 a 13.6 a 18.9 a 13.7 a
MC9N1/501.0 a 0.4 a 9.6 a 12.2 a 15.0 a 24.0 a 16.2 a 13.8 a
MC9N2/500.50.211.813.731.452.319.915.6
MC9D2/505.53.16.16.42.73.210.37.3
MC9N4/500.3 a 0.1 a 12.0 a 14.7 a 50.0 a 84.3 a 20.3 a 16.7 a
MC12N2/500.40.211.614.534.966.419.616.4
MC12D2/505.73.16.36.42.63.210.77.3
ACN2/500.70.311.212.521.637.218.914.1
ACD2/509.34.26.26.21.62.410.57.0
a n = 1, k = 3.
Table A3. Standard deviations for the average membrane bulk resistance ( R b ), geometric capacitance ( C g ), conductivity ( σ ), and dielectric constant ( ε r ) of the sensors in Table A2. The number of measurements and the number of sensors were n = 1 and k = 2 , respectively, unless noted otherwise. See Table 1 for membrane compositions.
MembraneSD of R b (M Ω )SD of C g (pF)SD of σ ( μ S m 1 )SD of ε r
PVCPCTFEPVCPCTFEPVCPCTFEPVCPCTFE
N1/250.1 a <0.1 a 0.3 a 0.3 a 0.2 a 0.7 a 0.5 a 0.4 a
N1/50<0.1 a <0.1 a 0.6 a 0.2 a 0.7 a 0.7 a 0.9 a 0.2 a
N2/50<0.1<0.10.90.11.70.21.50.2
D2/500.30.50.60.20.10.21.00.2
N4/50<0.1 a <0.1 a 0.2 a 0.5 a 1.3 a 2.6 a 0.4 a 0.6 a
MC5N2/50<0.1<0.10.10.40.21.10.10.4
MC5D2/500.10.40.60.1<0.10.21.10.2
MC9N1/250.2 a <0.1 a <0.1 a 0.1 a 0.9 a 0.8 a <0.1 a 0.1 a
MC9N1/500.1 a <0.1 a 0.4 a 0.4 a 1.0 a 1.5 a 0.7 a 0.4 a
MC9N2/50<0.1<0.10.10.41.32.20.20.5
MC9D2/500.40.10.7<0.10.20.11.2<0.1
MC9N4/50<0.1 a <0.1 a 0.3 a 0.2 a 2.0 a 3.7 a 0.4 a 0.3 a
MC12N2/50<0.1<0.11.0<0.11.33.01.6<0.1
MC12D2/500.20.20.5<0.10.10.20.8<0.1
ACN2/50<0.1<0.10.70.10.60.41.20.1
ACD2/50<0.1<0.10.30.2<0.1<0.10.50.2
a n = 1, k = 3.
Figure A3. Impedance spectra of the following PCTFE-shelled electrodes: bare glassy carbon (GC), glassy carbon with a membrane (GC+M), glassy carbon with PEDOT:Cl as a solid contact (SC), and glassy carbon with both PEDOT:Cl as a solid contact and a membrane (SC+M). The electrodes with membranes were prepared by drop-casting 40 μ L of the MC9N1/50 membrane cocktail. The solid contacts were identical to the solid contacts used throughout the rest of this study. The redox capacitances of the PEDOT:Cl layer and the bare glassy carbon were approximately 400 μ F and 1 μ F , respectively. See Table 1 for the composition of the MC9N1/50 membrane.
Chemosensors 09 00004 g0a3
Table A4. The membrane bulk resistance ( R b ), geometric capacitance ( C g ), conductivity ( σ ), and dielectric constant ( ε r ) of coated wire electrodes (CWEs) with MC9N1/25 membranes of different thicknesses (L). The number of measurements and the number of sensors were n = 1 and k = 3 , respectively, unless noted otherwise. Measurements were performed in 10 1 M sodium acetate with the parameters f = 100   m Hz 100   k Hz , E d c = 0   V vs . OCP , and Δ E a c = 100   m V ( RMS ) . See Table 1 for the composition of the MC9N1/25 membrane.
L ( μ m ) R b (M Ω ) C g (pF) σ ( μ S m 1 ) ε r
100 0.6 0.1 a 17.0 2.0 a 12.1 0.9 a 12.7 0.2 a
150 0.8 0.0 a 11.4 0.2 a 13.1 0.9 a 13.5 0.3 a
240 1.2 0.1 a 8.8 0.2 a 12.9 0.8 a 15.8 0.7 a
270 1.3 0.0 a 7.9 0.2 a 13.6 0.4 a 16.1 0.5 a
300 2.1 0.2 b , c 11.2 1.2 b , c 7.2 0.4 b , c 19.0 1.4 b , c
a PCTFE-shelled electrode (d = 6.35 mm). b PVC-shelled electrode (d = 8.5 mm). c n = 1, k = 4.

Appendix A.3. Potentiometric Calibrations
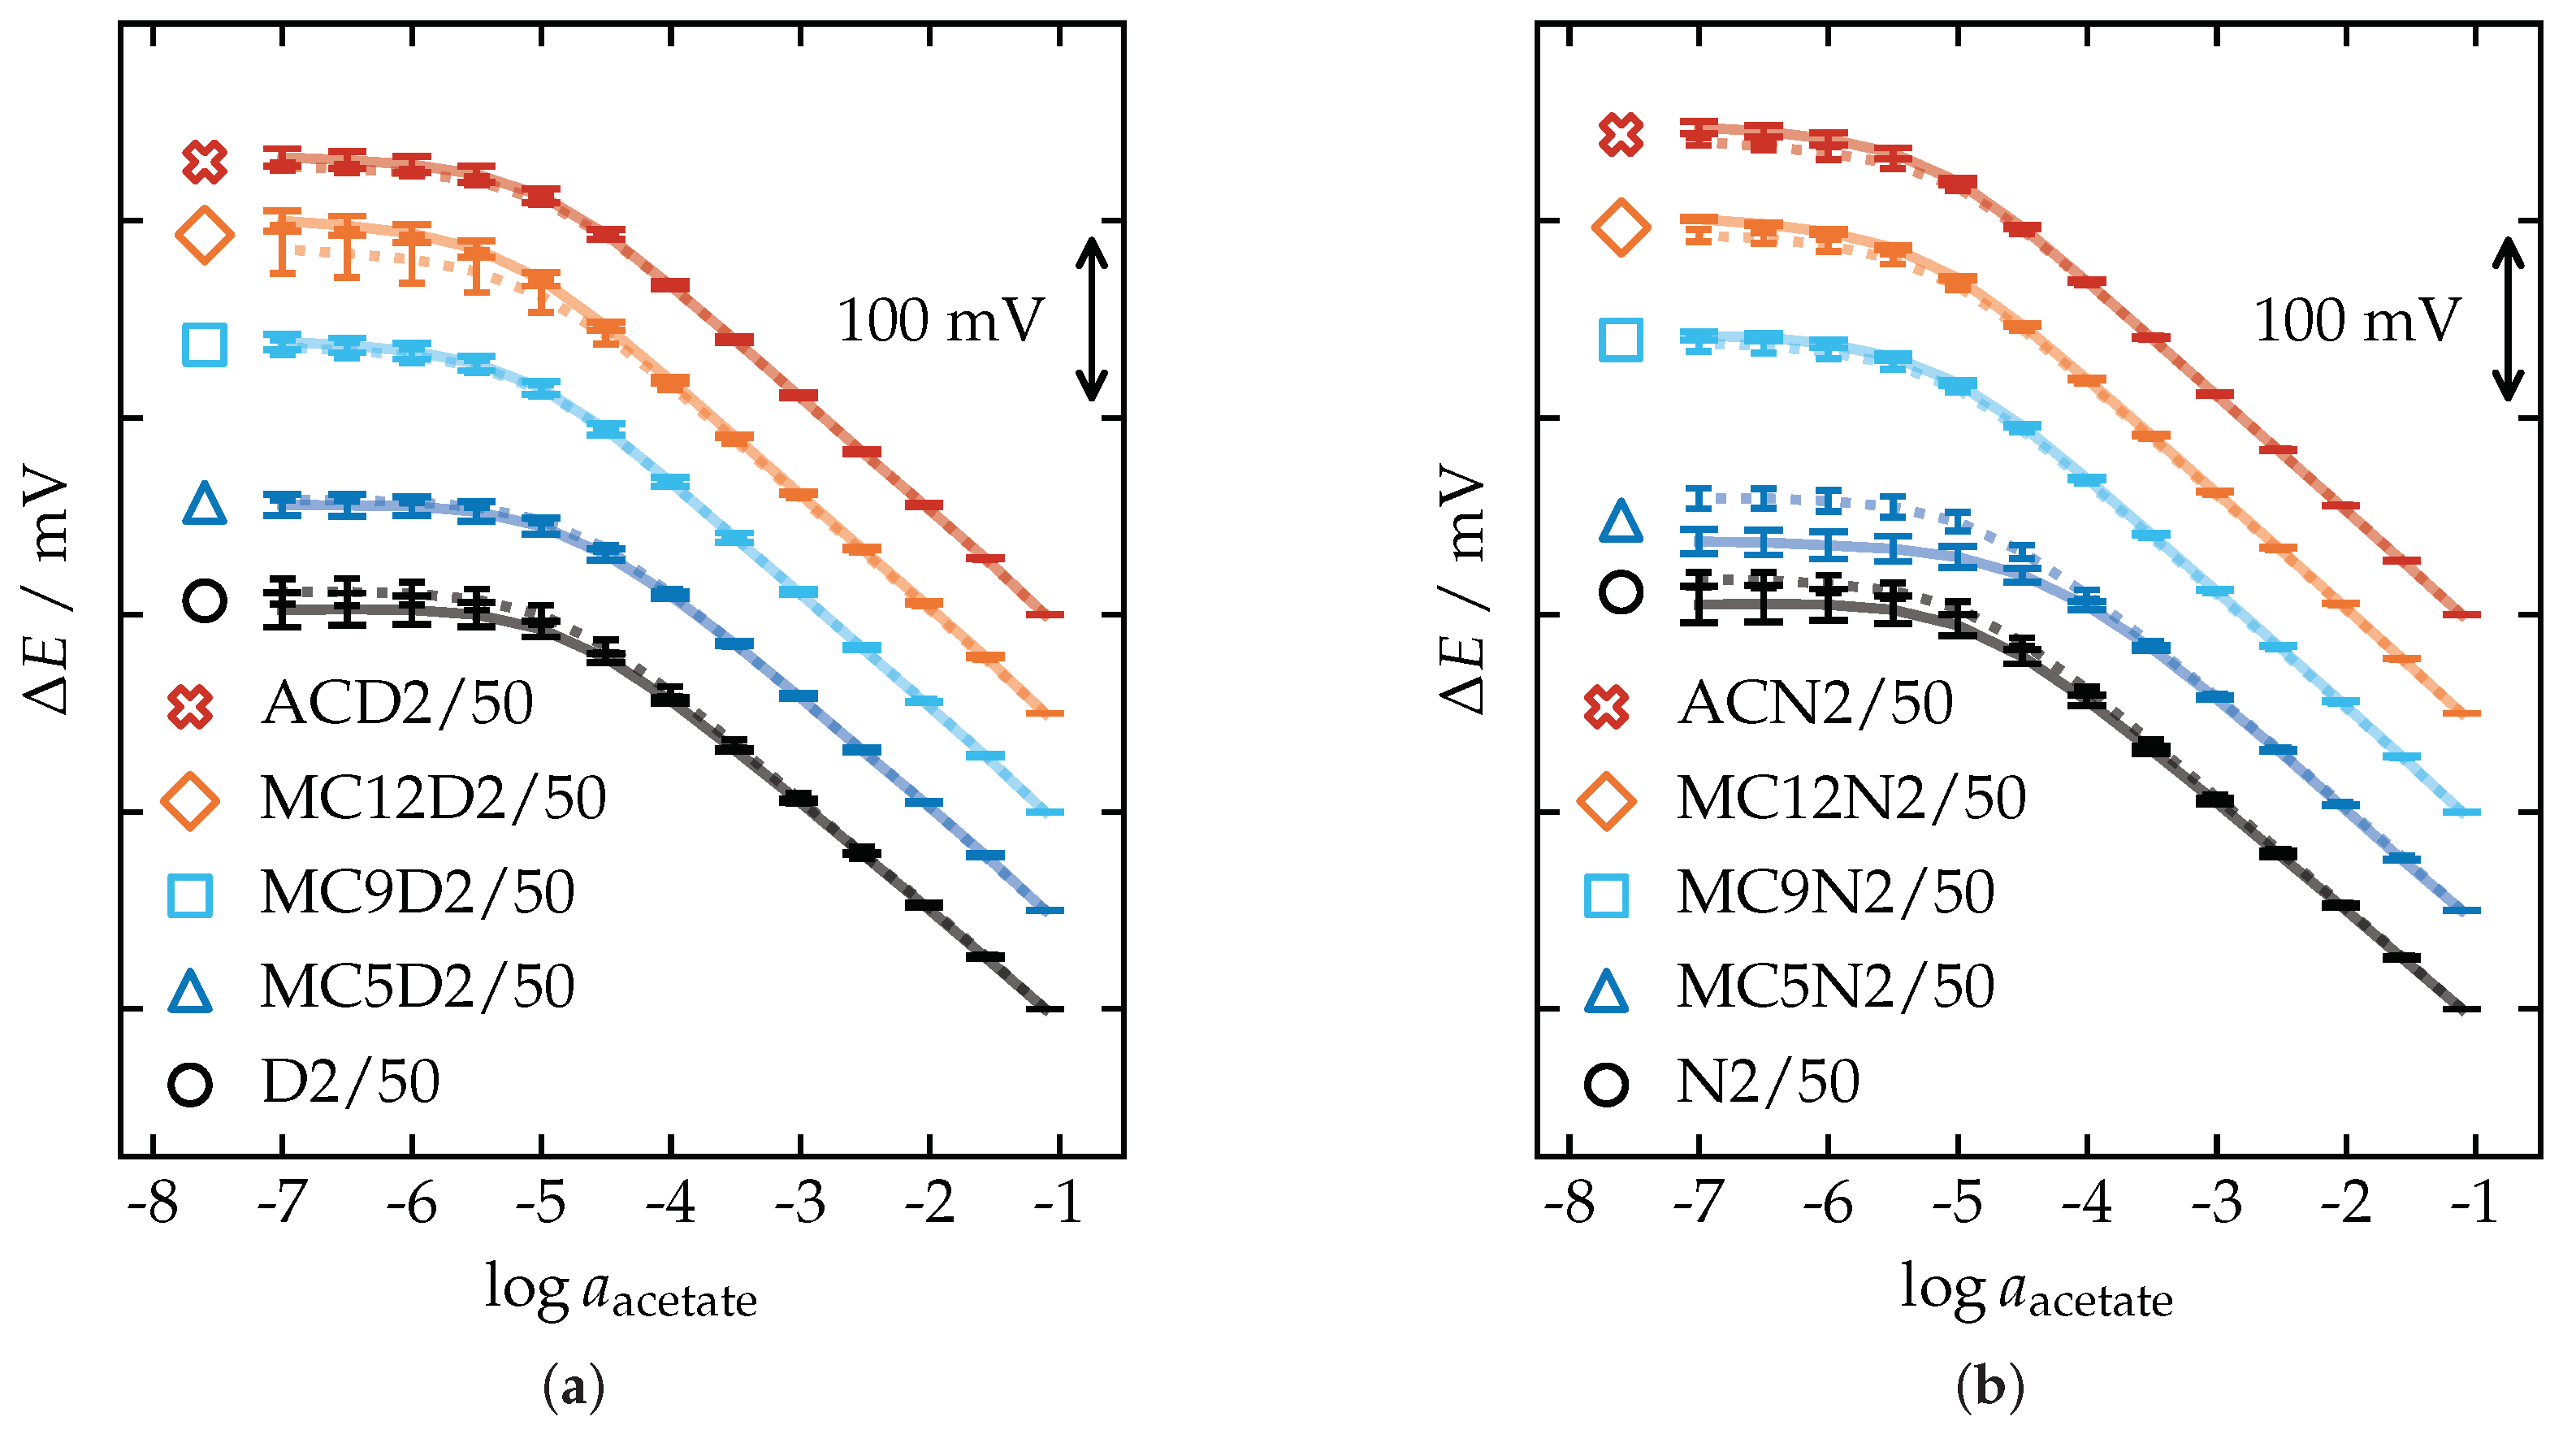
Figure A4. Potentiometric calibrations of sensors with membranes containing 2 wt . % ionophore, 50 mol . % (relative to the ionophore) TDMACl, and either (a) DOS or (b) o-NPOE as the plasticizer. Potentials have been adjusted to separate membranes and so that each sensor in a group starts at the same potential at log a = 1.11 . Error bars express standard deviations. PVC- and PCTFE-shelled sensors are shown as solid lines with wide error bars and dotted lines with narrow error bars, respectively. See Table 1 for membrane compositions.
Chemosensors 09 00004 g0a4
Figure A5. Potentiometric calibrations of (a) sensors incorporating MC9 and (b) control sensors. The membranes were all plasticized with o-NPOE. Potentials have been adjusted to separate membranes and so that each sensor in a group starts at the same potential at log a = 1.11 . Error bars express standard deviations. PVC- and PCTFE-shelled sensors are shown as solid lines with wide error bars and dotted lines with narrow error bars, respectively. See Table 1 for membrane compositions.
Chemosensors 09 00004 g0a5
Table A5. Averages of the response characteristics determined from potentiometric calibrations. All linear regressions had an R 2 0.999 . The number of measurements and the number of sensors were n = 2 and k = 2 , respectively, unless noted otherwise. See Table A6 for standard deviations. See Table 1 for membrane compositions.
MembraneSlope (mV/dec) log a LLL a log a LOD b
PVCPCTFEPVCPCTFEPVCPCTFE
N1/25−51.51 c −55.50 c −3.92 c −4.50 c −4.90 c −5.44 c
N1/50−54.68 c −56.76 c −3.92 c −4.00 c −5.08 c −5.20 c
N2/50−54.23−56.13−4.00−4.00−4.87−4.97
D2/50−54.44−55.55 d −3.88−4.00 d −4.82−4.90 d
N4/50−56.84 c −56.78 c −4.00 c −4.00 c −4.86 c −4.88 c
MC5N2/50−55.98−55.82−3.51−3.88−4.44−4.83
MC5D2/50−55.59−55.60−3.88−4.00−4.77−4.82
MC9N1/25−56.58 c −56.99 c −4.50 c −4.50 c −5.56 c −5.48 c
MC9N1/50−57.37 c −57.58 c −4.50 c −4.50 c −5.44 c −5.38 c
MC9N2/50−58.37−57.81−4.00−4.00−5.22−5.20
MC9D2/50−57.64−57.51−4.00−4.00−5.21−5.17
MC9N4/50−58.66 c −57.84 c −4.00 c −4.00 c −5.22 c −5.15 c
MC12N2/50−58.55−58.01−4.00−4.00−5.37−5.27
MC12D2/50−58.15−57.55−4.00−3.88−5.38−5.19
ACN2/50−58.43−58.30−4.00−4.00−5.32−5.21
ACD2/50−57.57−57.56−4.00−4.00−5.11−5.03
a Lower limit of linearity. b Limit of detection. c n = 2, k = 3. d n = 2, k = 1.
Table A6. Pooled standard deviations or standard deviations for the average response characteristics in Table A5. All linear regressions had an R 2 0.999 . The number of measurements and the number of sensors were n = 2 and k = 2 , respectively, unless noted otherwise. See Table 1 for membrane compositions.
MembraneSD of Slope (mV/dec)SD of log a LLL a SD of log a LOD b
PVCPCTFEPVCPCTFEPVCPCTFE
N1/250.69 d 0.81 d 0.20 d c , d 0.07 d 0.08 d
N1/500.40 d 0.56 d 0.20 d c , d 0.15 d 0.02 d
N2/500.820.43 c c 0.100.04
D2/500.211.15 e0.25 c , e 0.140.04 e
N4/500.33 d 0.10 d c , d c , d 0.05 d 0.04 d
MC5N2/500.490.35 c 0.250.090.07
MC5D2/500.550.770.25 c 0.100.04
MC9N1/250.91 d 0.62 d c , d c , d 0.07 d 0.06 d
MC9N1/500.31 d 0.26 d c , d c , d 0.03 d 0.02 d
MC9N2/500.190.20 c c 0.020.05
MC9D2/500.980.75 c c 0.040.04
MC9N4/500.05 d 0.10 d c , d c , d 0.03 d 0.04 d
MC12N2/500.210.13 c c 0.010.04
MC12D2/500.600.67 c 0.250.070.20
ACN2/500.250.38 c c 0.040.02
ACD2/500.800.61 c c 0.050.02
a Lower limit of linearity. b Limit of detection. c All sensors reached the same lower limit of linearity without R2 dropping below 0.999. d n = 2, k = 3. d n = 2, k = 1.

Appendix A.4. pH Sensitivity

Figure A6. pH sensitivity of sensors with membranes containing 2 wt . % ionophore, 50 mol . % (relative to the ionophore) TDMACl, and either (a) DOS or (b) o-NPOE as the plasticizer. Polynomials ( n = 7 ) fitted to the results of PVC- and PCTFE-shelled sensors are shown as solid and dotted lines, respectively. Measurements were performed in 10 2 M acetic acid titrated with a mixture of 0.25 M NaOH and 10 2 M sodium acetate. See Table 1 for membrane compositions.
Chemosensors 09 00004 g0a6
Figure A7. pH sensitivity of (a) sensors incorporating MC9 and (b) control sensors. The membranes were all plasticized with o-NPOE. Polynomials ( n = 7 ) fitted to the results of PVC- and PCTFE-shelled sensors are shown as solid and dotted lines, respectively. Measurements were performed in 10 2 M acetic acid titrated with a mixture of 0.25 M NaOH and 10 2 M sodium acetate. See Table 1 for membrane compositions.
Chemosensors 09 00004 g0a7

Appendix A.5. Selectivity Coefficients

Table A7. Average potentiometric selectivity coefficients determined with the separate solution method ( a i = a j = 10 2.05   M ) for sensors with membranes containing 2 wt . % ionophore, 50 mol . % (relative to the ionophore) TDMACl, and DOS as the plasticizer. The number of measurements and the number of sensors were n = 1 and k = 2 , respectively, unless noted otherwise. See Table A8 for standard deviations. See Table 1 for membrane compositions.
Ion, j log K acetate , j pot
D2/50MC5D2/50MC9D2/50MC12D2/50ACD2/50
PVCPCTFEPVCPCTFEPVCPCTFEPVCPCTFEPVCPCTFE
F −0.35−0.14 a −1.15−1.19−2.03−2.01−2.28−2.21−1.51−1.49
H P O 4 2 −0.140.00 a −1.49−1.18−1.11−1.02−1.63−1.67−0.67−0.61
H 2 P O 4 0.090.25 a −0.89−0.91−0.69−0.58−1.32−1.20−0.73−0.66
S O 4 2 0.170.32 a −0.60−0.58−0.29−0.16−0.81−0.740.290.35
H C O 3 0.420.43 a 0.580.720.300.31−0.08−0.100.120.15
H C O 2 0.430.47 a 0.190.130.140.19−0.20−0.23−0.19−0.21
L a c O 0.490.52 a −0.11−0.10−0.25−0.23−0.27−0.26−0.35−0.31
P i v O 1.441.44 a 1.641.720.981.001.101.111.481.50
C l 1.521.50 a 0.920.98−0.58−0.54−0.83−0.80−0.19−0.09
B z O 2.862.80 a 2.602.772.162.242.062.122.172.22
B r 2.922.89 a 1.591.680.240.31−0.030.020.230.32
N O 3 3.633.62 a 1.101.040.660.770.180.250.200.24
I 5.004.95 a 2.232.271.461.581.021.140.961.03
S C N 5.645.58 a 2.262.321.271.401.111.261.201.28
a n = 1, k = 1.
Table A8. Standard deviations for the average selectivity coefficients in Table A7. The number of measurements and the number of sensors were n = 1 and k = 2 , respectively, unless noted otherwise. See Table 1 for membrane compositions.
Ion, jSD of log K acetate , j pot
D2/50MC5D2/50MC9D2/50MC12D2/50ACD2/50
PVCPCTFEPVCPCTFEPVCPCTFEPVCPCTFEPVCPCTFE
F 0.01 a 0.040.090.070.090.080.060.150.03
H P O 4 2 0.01 a 0.050.050.030.030.030.120.020.02
H 2 P O 4 0.03 a 0.020.030.040.020.050.020.070.02
S O 4 2 0.06 a 0.100.180.030.050.020.070.030.02
H C O 3 <0.01 a 0.070.070.01<0.010.02<0.01<0.010.01
H C O 2 0.01 a 0.080.01<0.010.040.04<0.010.040.01
L a c O <0.01 a 0.030.010.020.010.010.020.020.01
P i v O 0.02 a 0.010.060.010.01<0.01<0.010.01<0.01
C l 0.04 a 0.010.010.010.040.05<0.010.020.01
B z O 0.06 a 0.020.040.020.070.020.030.010.01
B r 0.05 a 0.010.010.040.060.050.030.040.02
N O 3 0.04 a 0.030.060.050.090.040.020.030.02
I 0.08 a <0.010.070.020.020.040.01<0.010.01
S C N 0.10 a 0.020.100.010.020.030.01<0.01<0.01
a n = 1, k = 1.
Table A9. Average potentiometric selectivity coefficients determined with the separate solution method ( a i = a j = 10 2.05   M ) for sensors with membranes containing 2 wt . % ionophore, 50 mol . % (relative to the ionophore) TDMACl, and o-NPOE as the plasticizer. The number of measurements and the number of sensors were n = 1 and k = 2 , respectively. See Table A10 for standard deviations. See Table 1 for membrane compositions.
Ion, j log K acetate , j pot
N2/50MC5N2/50MC9N2/50MC12N2/50ACN2/50
PVCPCTFEPVCPCTFEPVCPCTFEPVCPCTFEPVCPCTFE
F −0.84−0.61−0.82−1.24−2.14−2.23−2.35−2.42−1.86−1.97
H P O 4 2 −0.55−0.39−0.57−0.61−1.78−1.78−2.39−2.10−1.32−1.32
H 2 P O 4 −0.36−0.14−0.73−1.13−1.32−1.24−2.17−1.88−1.42−1.38
S O 4 2 −0.21−0.04−0.010.33−0.94−0.85−1.68−1.11−0.30−0.24
H C O 3 0.180.280.710.600.220.23−0.06−0.02−0.33−0.27
H C O 2 0.600.660.280.330.250.26−0.16−0.14−0.26−0.24
L a c O 0.640.70−0.18−0.15−0.31−0.30−0.33−0.32−0.48−0.41
P i v O 1.271.281.391.480.960.961.081.141.291.28
C l 1.711.691.041.14−0.80−0.83−1.03−1.04−0.40−0.46
B z O 2.832.762.462.652.042.121.912.052.032.07
B r 3.253.301.791.910.090.14−0.17−0.000.010.03
N O 3 4.214.221.211.370.800.940.220.450.240.29
I 5.615.572.492.641.481.681.041.440.840.89
S C N 6.206.072.562.671.001.181.011.520.961.01
Table A10. Standard deviations for the average selectivity coefficients in Table A9. The number of measurements and the number of sensors were n = 1 and k = 2 , respectively. See Table 1 for membrane compositions.
Ion, jSD of log K acetate , j pot
N2/50MC5N2/50MC9N2/50MC12N2/50ACN2/50
PVCPCTFEPVCPCTFEPVCPCTFEPVCPCTFEPVCPCTFE
F <0.010.010.33<0.010.010.02<0.010.040.050.02
H P O 4 2 0.020.020.220.050.030.030.010.010.010.02
H 2 P O 4 0.040.020.090.060.020.030.02<0.010.030.01
S O 4 2 0.040.030.010.040.020.050.04<0.01<0.010.02
H C O 3 0.060.030.030.040.040.020.040.010.010.03
H C O 2 0.050.020.010.040.040.020.040.02<0.010.04
L a c O 0.060.010.030.01<0.010.010.020.010.020.14
P i v O 0.020.06<0.01<0.010.010.010.010.010.020.01
C l 0.050.050.01<0.01<0.010.020.010.020.010.01
B z O 0.030.020.010.010.020.010.020.020.010.02
B r <0.010.01<0.010.030.010.020.03<0.010.03<0.01
N O 3 0.030.010.020.040.030.010.010.010.02<0.01
I 0.060.020.060.040.030.010.020.010.030.02
S C N 0.080.030.020.050.040.010.010.040.010.02
Table A11. Average potentiometric selectivity coefficients determined with the separate solution method ( a i = a j = 10 2.05   M ) for sensors with membranes incorporating MC9 and plasticized with o-NPOE. The number of measurements and the number of sensors were n = 1 and k = 3 , respectively. See Table A12 for standard deviations. See Table 1 for membrane compositions.
Ion, j log K acetate , j pot
N4/50MC9N4/50N1/50MC9N1/50N1/25MC9N1/25
PVCPCTFEPVCPCTFEPVCPCTFEPVCPCTFEPVCPCTFEPVCPCTFE
F −0.44−0.44−2.22−2.29−1.21−1.09−2.33−2.37−0.56−1.16−2.05−2.26
H P O 4 2 −0.19−0.22−1.47−1.46−1.20−0.89−2.11−2.03−1.06−1.61−2.29−2.27
H 2 P O 4 0.110.12−0.97−0.88−0.94−0.65−1.68−1.55−1.52−1.25−1.95−1.72
S O 4 2 0.150.17−0.55−0.46−0.78−0.56−1.29−1.12−1.29−1.04−1.64−1.36
H C O 3 0.430.440.280.380.200.080.170.180.520.150.310.19
H C O 2 0.710.710.250.360.620.660.170.230.510.660.150.24
L a c O 0.730.77−0.28−0.180.690.74−0.29−0.300.520.71−0.31−0.31
P i v O 1.331.350.940.971.311.331.010.991.151.240.970.97
C l 1.751.78−0.79−0.801.721.78−0.85−0.851.521.74−0.94−0.86
B z O 2.862.892.112.182.812.811.992.132.682.771.802.12
B r 3.213.290.180.223.223.33−0.020.123.173.35−0.220.12
N O 3 4.104.170.890.984.154.230.650.894.194.330.430.91
I 5.425.521.611.705.515.541.321.615.655.711.111.62
S C N 5.996.051.171.246.116.070.881.126.276.270.641.10
Table A12. Standard deviations for the average selectivity coefficients in Table A11. The number of measurements and the number of sensors were n = 1 and k = 3 , respectively. See Table 1 for membrane compositions.
Ion, jSD of log K acetate , j pot
N4/50MC9N4/50N1/50MC9N1/50N1/25MC9N1/25
PVCPCTFEPVCPCTFEPVCPCTFEPVCPCTFEPVCPCTFEPVCPCTFE
F 0.010.020.010.020.020.010.020.020.100.160.070.02
H P O 4 2 0.030.030.010.010.03<0.010.020.010.100.070.010.02
H 2 P O 4 0.040.030.010.020.070.020.010.020.100.060.030.01
S O 4 2 0.050.040.020.030.020.010.010.020.040.060.040.02
H C O 3 0.040.010.010.020.140.010.010.010.270.260.080.03
H C O 2 0.030.020.01<0.01<0.01<0.010.01<0.010.020.030.04<0.01
L a c O 0.040.020.010.010.010.010.010.010.030.040.040.01
P i v O 0.030.030.020.020.010.020.02<0.010.040.010.050.01
C l 0.030.040.030.030.010.020.030.010.050.040.030.01
B z O 0.030.030.030.020.010.010.010.010.090.020.040.01
B r 0.030.040.010.020.010.01<0.010.010.120.020.050.01
N O 3 0.020.050.020.020.010.010.020.010.140.030.050.01
I 0.020.040.010.010.010.020.020.010.170.030.050.01
S C N 0.020.050.010.020.010.020.020.010.180.030.050.01

References

  1. Scholz, F. From the Leiden jar to the discovery of the glass electrode by Max Cremer. J. Solid State Electrochem. 2011, 15, 5–14. [Google Scholar] [CrossRef]
  2. Cardoso, R.M.; Kalinke, C.; Rocha, R.G.; dos Santos, P.a.L.; Rocha, D.P.; Oliveira, P.R.; Janegitz, B.C.; Bonacin, J.A.; Richter, E.M.; Muñoz, R.A. Additive-manufactured (3D-printed) electrochemical sensors: A critical review. Anal. Chim. Acta 2020, 1118, 73–91. [Google Scholar] [CrossRef] [PubMed]
  3. Bobacka, J.; Ivaska, A.; Lewenstam, A. Potentiometric ion sensors. Chem. Rev. 2008, 108, 329–351. [Google Scholar] [CrossRef] [PubMed]
  4. Haber, F.; Klemensiewicz, Z. Über elektrische Phasengrenzkräfte. Z. Phys. Chem. 1909, 67U, 385–431. [Google Scholar] [CrossRef]
  5. Eisenman, G.; Rudin, D.O.; Casby, J.U. Glass electrode for measuring sodium ion. Science 1957, 126, 831–834. [Google Scholar] [CrossRef]
  6. Frant, M.S.; Ross, J.W. Electrode for sensing fluoride ion activity in solution. Science 1966, 154, 1553–1555. [Google Scholar] [CrossRef]
  7. Ross, J.W. Calcium-selective electrode with liquid ion exchanger. Science 1967, 156, 1378–1379. [Google Scholar] [CrossRef]
  8. Bloch, R.; Shatkay, A.; Saroff, H. Fabrication and evaluation of membranes as specific electrodes for calcium ions. Biophys. J. 1967, 7, 865–877. [Google Scholar] [CrossRef] [Green Version]
  9. Pechenkina, I.; Mikhelson, K.N. Materials for the ionophore-based membranes for ion-selective electrodes: Problems and achievements. Russ. J. Electrochem. 2015, 51, 93–102. [Google Scholar] [CrossRef]
  10. Zdrachek, E.; Bakker, E. Potentiometric Sensing. Anal. Chem. 2019, 91, 2–26. [Google Scholar] [CrossRef] [Green Version]
  11. Bühlmann, P.; Pretsch, E.; Bakker, E. Carrier-based ion-selective electrodes and bulk optodes. 2. Ionophores for potentiometric and optical sensors. Chem. Rev. 1998, 98, 1593–1688. [Google Scholar] [CrossRef] [PubMed]
  12. Umezawa, Y.; Bühlmann, P.; Umezawa, K.; Tohda, K.; Amemiya, S. Potentiometric selectivity coefficients of ion-selective electrodes. Part I. Inorganic cations (technical report). Pure Appl. Chem. 2000, 72, 1851–2082. [Google Scholar] [CrossRef]
  13. Umezawa, Y.; Umezawa, K.; Bühlmann, P.; Hamada, N.; Aoki, H.; Nakanishi, J.; Sato, M.; Xiao, K.P.; Nishimura, Y. Potentiometric selectivity coefficients of ion-selective electrodes. Part II. Inorganic anions (IUPAC Technical Report). Pure Appl. Chem. 2002, 74, 923–994. [Google Scholar] [CrossRef] [Green Version]
  14. Umezawa, Y.; Bühlmann, P.; Umezawa, K.; Hamada, N. Potentiometric selectivity coefficients of ion-selective electrodes. Part III. Organic ions (IUPAC Technical Report). Pure Appl. Chem. 2002, 74, 995–1099. [Google Scholar] [CrossRef]
  15. Gale, P.A. Anion receptor chemistry: Highlights from 1999. Coord. Chem. Rev. 2001, 213, 79–128. [Google Scholar] [CrossRef]
  16. Gale, P.A. Anion and ion-pair receptor chemistry: Highlights from 2000 and 2001. Coord. Chem. Rev. 2003, 240, 191–221. [Google Scholar] [CrossRef]
  17. Gale, P.A.; Quesada, R. Anion coordination and anion-templated assembly: Highlights from 2002 to 2004. Coord. Chem. Rev. 2006, 250, 3219–3244. [Google Scholar] [CrossRef]
  18. Gale, P.A.; García-Garrido, S.E.; Garric, J. Anion receptors based on organic frameworks: Highlights from 2005 and 2006. Chem. Soc. Rev. 2008, 37, 151–190. [Google Scholar] [CrossRef]
  19. Caltagirone, C.; Gale, P.A. Anion receptor chemistry: Highlights from 2007. Chem. Soc. Rev. 2009, 38, 520–563. [Google Scholar] [CrossRef]
  20. Gale, P.A. Anion receptor chemistry: Highlights from 2008 and 2009. Chem. Soc. Rev. 2010, 39, 3746–3771. [Google Scholar] [CrossRef] [Green Version]
  21. Wenzel, M.; Hiscock, J.R.; Gale, P.A. Anion receptor chemistry: Highlights from 2010. Chem. Soc. Rev. 2012, 41, 480–520. [Google Scholar] [CrossRef] [PubMed]
  22. Gale, P.A.; Busschaert, N.; Haynes, C.J.; Karagiannidis, L.E.; Kirby, I.L. Anion receptor chemistry: Highlights from 2011 and 2012. Chem. Soc. Rev. 2014, 43, 205–241. [Google Scholar] [CrossRef] [PubMed] [Green Version]
  23. Kadam, S.A.; Martin, K.; Haav, K.; Toom, L.; Mayeux, C.; Pung, A.; Gale, P.A.; Hiscock, J.R.; Brooks, S.J.; Kirby, I.L.; et al. Towards the Discrimination of Carboxylates by Hydrogen-Bond Donor Anion Receptors. Chem.-Eur. J. 2015, 21, 5145–5160. [Google Scholar] [CrossRef] [PubMed]
  24. Gale, P.A.; Howe, E.N.; Wu, X. Anion receptor chemistry. Chem 2016, 1, 351–422. [Google Scholar] [CrossRef] [Green Version]
  25. Gale, P.A.; Howe, E.N.; Wu, X.; Spooner, M.J. Anion receptor chemistry: Highlights from 2016. Coord. Chem. Rev. 2018, 375, 333–372. [Google Scholar] [CrossRef]
  26. Chen, L.; Berry, S.N.; Wu, X.; Howe, E.N.; Gale, P.A. Advances in Anion Receptor Chemistry. Chem 2020, 6, 61–141. [Google Scholar] [CrossRef]
  27. Kadam, S.A.; Haav, K.; Toom, L.; Pung, A.; Mayeux, C.; Leito, I. Multidentate Anion Receptors for Binding Glyphosate Dianion: Structure and Affinity. Eur. J. Org. Chem. 2017, 2017, 1396–1406. [Google Scholar] [CrossRef]
  28. Martin, K.; Nõges, J.; Haav, K.; Kadam, S.A.; Pung, A.; Leito, I. Exploring selectivity of 22 acyclic urea-, carbazole- and indolocarbazole-based receptors towards 11 monocarboxylates. Eur. J. Org. Chem. 2017, 2017, 5231–5237. [Google Scholar] [CrossRef]
  29. Tshepelevitsh, S.; Kadam, S.A.; Darnell, A.; Bobacka, J.; Rüütel, A.; Haljasorg, T.; Leito, I. LogP Determination for Highly Lipophilic Hydrogen Bonding Anion Receptor Molecules. Anal. Chim. Acta 2020, 1132, 123–133. [Google Scholar] [CrossRef]
  30. Rüütel, A.; Yrjänä, V.; Kadam, S.A.; Saar, I.; Ilisson, M.; Darnell, A.; Haav, K.; Haljasorg, T.; Toom, L.; Bobacka, J.; et al. Design, synthesis and application of carbazole macrocycles in anion sensors. Beilstein J. Org. Chem. 2020, 16, 1901–1914. [Google Scholar] [CrossRef]
  31. Martin, K.; Kadam, S.A.; Mattinen, U.; Bobacka, J.; Leito, I. Solid-contact Acetate-selective Electrode Based on a 1,3-bis(carbazolyl)urea-ionophore. Electroanalysis 2019, 31, 1061–1066. [Google Scholar] [CrossRef]
  32. MacInnes, D.A. The Principles of Electrochemistry; Dover: Mineola, NY, USA, 1961. [Google Scholar]
  33. Dahlgren, B. ChemPy: A package useful for chemistry written in Python. J. Open Source Softw. 2018, 3, 565. [Google Scholar] [CrossRef]
  34. Debye, P.; Hückel, E. The theory of electrolytes. I. Freezing point depression and related phenomena [Zur Theorie der Elektrolyte. I. Gefrierpunktserniedrigung und verwandte Erscheinungen]. Phys. Z. 1923, 24, 185–206, Translated and typeset by Michael J. Braus (2020). [Google Scholar]
  35. Koch, S.; Graves, C.; Vels Hansen, K.; DTU Energy. Elchemea Analytical. Available online: https://www.elchemea.com/ (accessed on 9 November 2020).
  36. Bobacka, J.; Ivaska, A.; Lewenstam, A. Plasticizer-free all-solid-state potassium-selective electrode based on poly (3-octylthiophene) and valinomycin. Anal. Chim. Acta 1999, 385, 195–202. [Google Scholar] [CrossRef]
  37. Amemiya, S.; Bühlmann, P.; Umezawa, Y.; Jagessar, R.C.; Burns, D.H. An ion-selective electrode for acetate based on a urea-functionalized Porphyrin as a Hydrogen-Bonding Ionophore. Anal. Chem. 1999, 71, 1049–1054. [Google Scholar] [CrossRef]
  38. Dulic, N.; Horváth, L.; Horvai, G.; Tóth, K.; Pungor, E. Dielectric behavior of PVC membranes plasticized with dioctyl sebacate or o-nitrophenyl-octyl ether. Electroanalysis 1990, 2, 533–537. [Google Scholar] [CrossRef]
  39. Zhang, X.; Ju, H.; Wang, J. Electrochemical Sensors, Biosensors and Their Biomedical Applications; Academic Press: Cambridge, MA, USA, 2011. [Google Scholar]
  40. Mikhelson, K.N. Ion-Selective Electrodes; Springer: Berlin/Heidelberg, Germany, 2013; Volume 81. [Google Scholar]
  41. Szigeti, Z.; Vigassy, T.; Bakker, E.; Pretsch, E. Approaches to improving the lower detection limit of polymeric membrane ion-selective electrodes. Electroanalysis 2006, 18, 1254–1265. [Google Scholar] [CrossRef]
  42. Lindfors, T.; Sundfors, F.; Höfler, L.; Gyurcsányi, R.E. FTIR-ATR Study of Water Uptake and Diffusion Through Ion-Selective Membranes Based on Plasticized Poly(vinyl chloride). Electroanalysis 2009, 21, 1914–1922. [Google Scholar] [CrossRef]
  43. Hambly, B.; Guzinski, M.; Pendley, B.; Lindner, E. Evaluation, Pitfalls and Recommendations for the “Water Layer Test” for Solid Contact Ion-selective Electrodes. Electroanalysis 2020, 32, 781–791. [Google Scholar] [CrossRef]
  44. Janata, J. Principles of Chemical Sensors, 2nd ed.; Springer Science & Business Media: Berlin/Heidelberg, Germany, 2009. [Google Scholar]
  45. Horvai, G.; Graf, E.; Toth, K.; Pungor, E.; Buck, R.P. Plasticized poly (vinyl chloride) properties and characteristics of valinomycin electrodes. 1. High-frequency resistances and dielectric properties. Anal. Chem. 1986, 58, 2735–2740. [Google Scholar] [CrossRef]
  46. Antonisse, M.M.G.; Snellink-Ruël, B.H.M.; Ion, A.C.; Engbersen, J.F.J.; Reinhoudt, D.N. Synthesis of novel uranyl salophene derivatives and evaluation as sensing molecules in chemically modified field effect transistors (CHEMFETs). J. Chem. Soc. Perkin Trans. 2 1999, 6, 1211–1218. [Google Scholar] [CrossRef]
  47. Lee, H.K.; Song, K.; Seo, H.R.; Jeon, S. Polymeric Acetate-Selective Electrodes Based on meso-(α, α, α, α)-Tetrakis-[(2-arylphenylurea) phenyl] porphyrins: Electormic and pH Effects. Bull. Korean Chem. Soc. 2002, 23, 1409–1412. [Google Scholar]
  48. Heering, A.; Stoica, D.; Camões, F.; Anes, B.; Nagy, D.; Nagyné Szilágyi, Z.; Quendera, R.; Ribeiro, L.; Bastkowski, F.; Born, R.; et al. Symmetric Potentiometric Cells for the Measurement of Unified pH Values. Symmetry 2020, 12, 1150. [Google Scholar] [CrossRef]
  49. Górski, Ł.; Mroczkiewicz, M.; Pietrzak, M.; Malinowska, E. Metalloporphyrin-based acetate-selective electrodes as detectors for enzymatic acetylcholine determination in flow-injection analysis system. Anal. Chim. Acta 2009, 644, 30–35. [Google Scholar] [CrossRef]
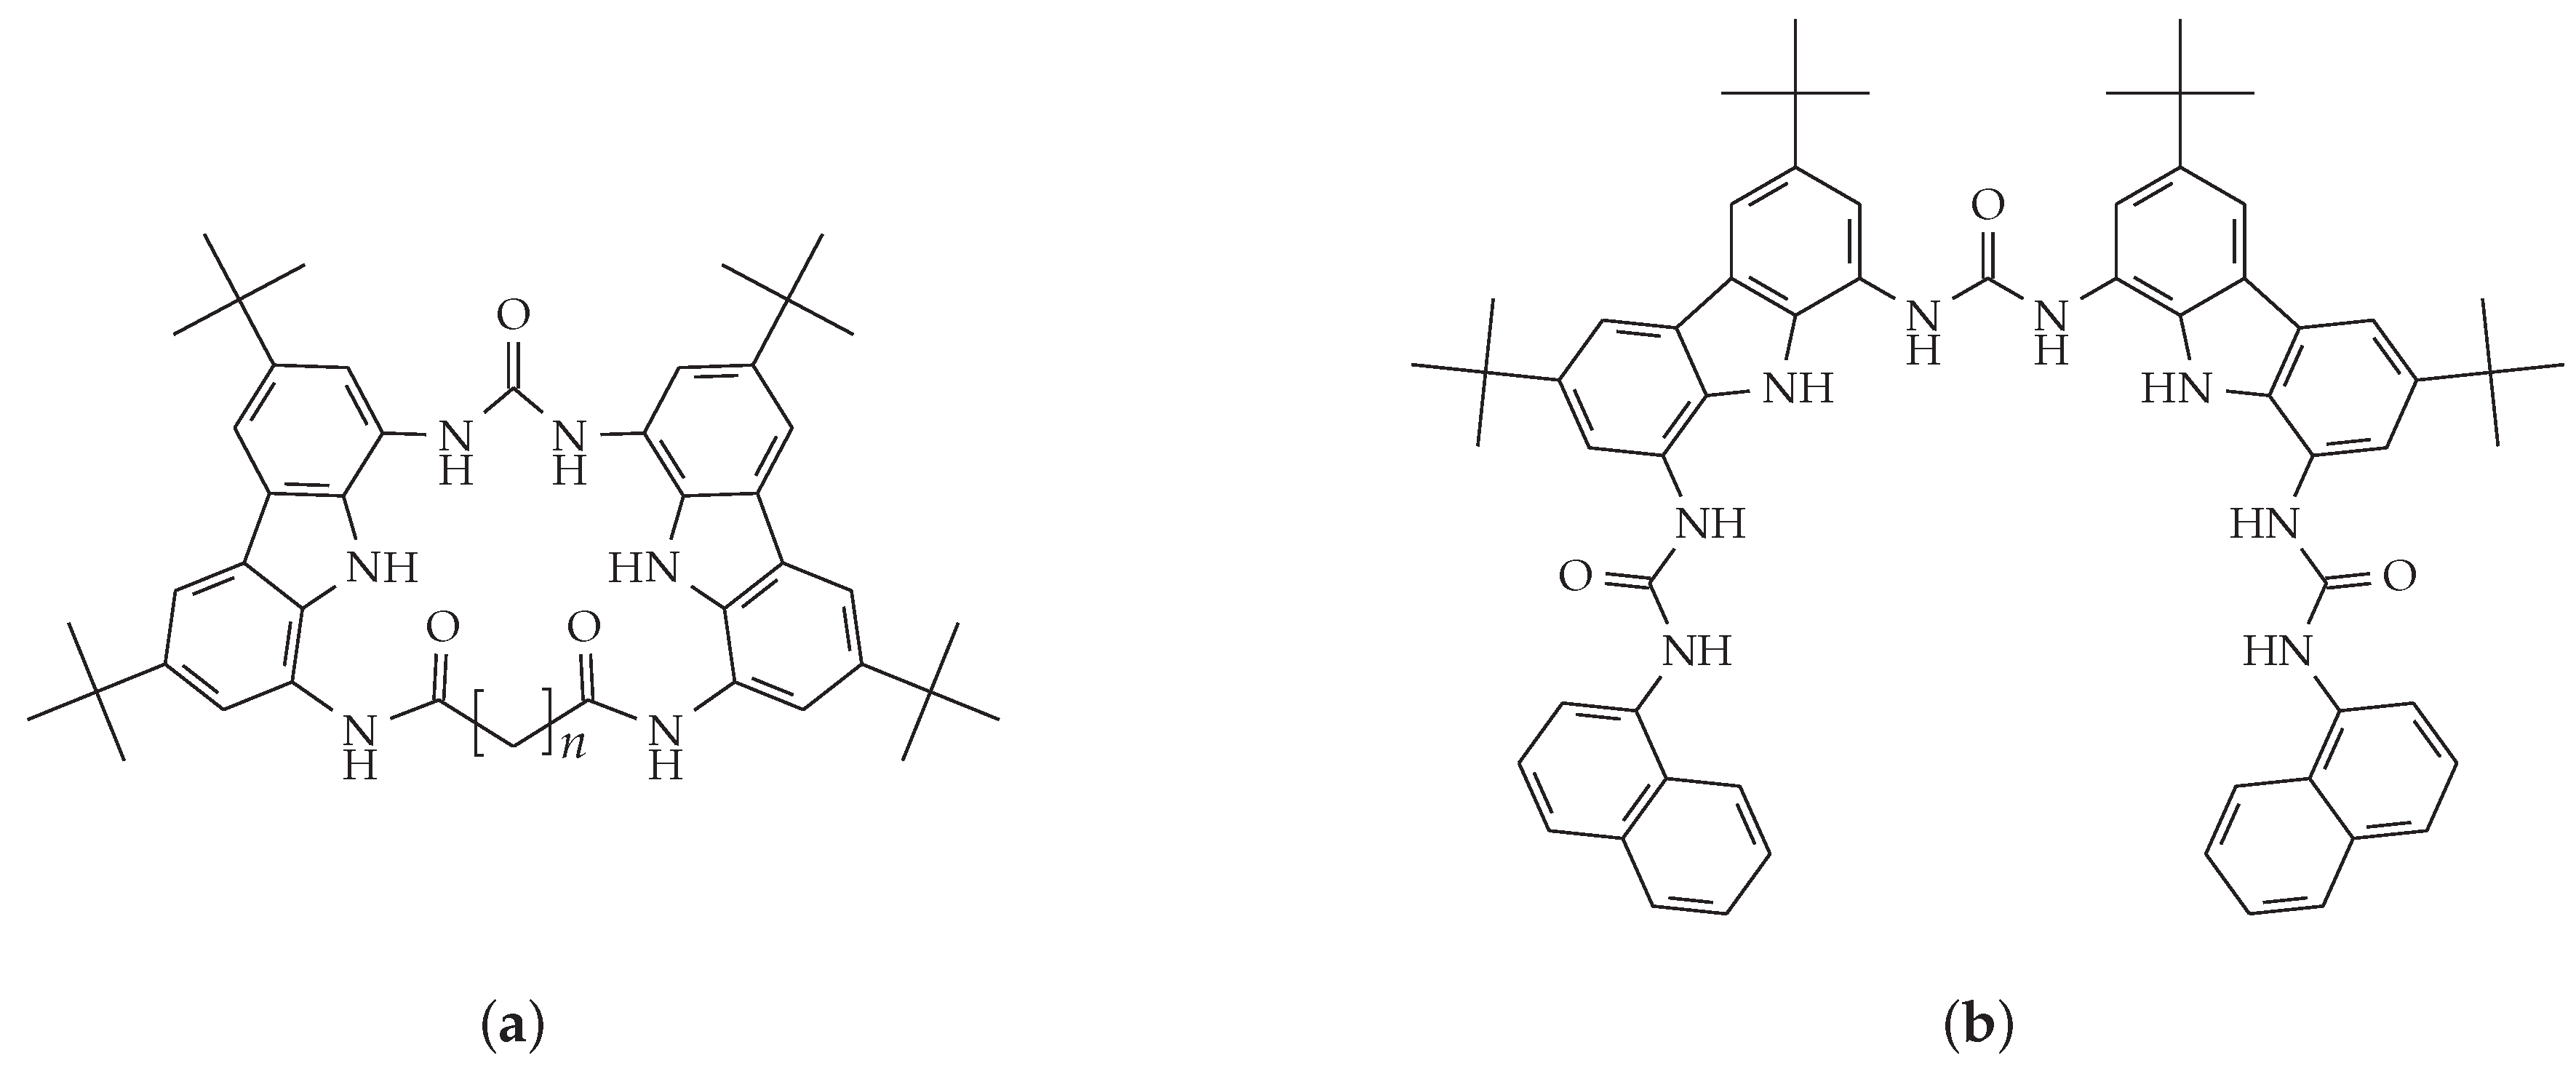
Figure 1. The ionophores included in this study: (a) macrocyclic receptors where n = 5, 9, or 12 (MC5, MC9, and MC12, respectively), and (b) an acyclic receptor (AC). See Table A1 for binding constants determined for some carboxylates.
Chemosensors 09 00004 g001
Figure 2. Impedance spectra of sensors with either the best-performing ion-selective membrane or its corresponding control membrane. PVC-shelled sensors are shown in the main plot and PCTFE-shelled sensors in the inset. Measurements were performed in 10 1 M sodium acetate with the parameters f = 100   m Hz 100   k Hz , E d c = 0   V vs . OCP , and Δ E a c = 100   m V ( RMS ) . See Table 1 for membrane compositions.
Chemosensors 09 00004 g002
Figure 3. Potentiometric calibrations of sensors with either the best-performing ion-selective membrane or its corresponding control membrane. Potentials have been adjusted to separate membranes and so that each sensor in a group starts at the same potential at log a = 1.11 . Error bars express standard deviations. PVC- and PCTFE-shelled sensors are shown as solid lines with wide error bars and dotted lines with narrow error bars, respectively. See Table 1 for membrane compositions.
Chemosensors 09 00004 g003
Figure 4. pH sensitivity of sensors with either the best-performing ion-selective membrane or its corresponding control membrane. Polynomials ( n = 7 ) fitted to the results of PVC- and PCTFE-shelled sensors are shown as solid and dotted lines, respectively. Measurements were performed in 10 2 M acetic acid titrated with a mixture of 0.25 M NaOH and 10 2 M sodium acetate. See Table 1 for membrane compositions.
Chemosensors 09 00004 g004
Table 1. Compositions of the membrane cocktails. Membranes are labeled according to the format W X Y / Z , where W is the ionophore (absent for controls), X is the plasticizer (D for DOS and N for o-NPOE), Y is the intended mass percentage (dry mass) of the ionophore, and Z is the intended ratio ( mol . % ) of anion exchanger to ionophore. See Figure 1 for ionophores.
Membrane wt . % (Total Mass) mol . %
IonophoreTDMAClPVCDOSo-NPOETHFAnion Exchanger: Ionophore
N1/25 0.035.67 11.3182.99
N1/50 0.065.66 11.2483.04
N2/50 0.115.48 11.3983.02
D2/50 0.125.6111.27 83.00
N4/50 0.235.59 11.1982.98
MC5N2/500.340.135.48 11.1082.9452.24
MC5D2/500.340.125.4211.13 82.9949.26
MC9N1/250.170.035.60 11.2682.9327.72
MC9N1/500.170.065.58 11.2282.9749.57
MC9N2/500.340.125.42 11.2082.9349.31
MC9D2/500.340.125.4811.07 82.9852.16
MC9N4/500.680.235.51 10.8582.7250.05
MC12N2/500.330.125.34 11.2682.9553.53
MC12D2/500.330.115.3311.23 83.0049.66
ACN2/500.340.105.56 11.0482.9649.62
ACD2/500.340.105.4511.12 83.0049.62
Table 2. Averages of the response characteristics determined from potentiometric calibrations of sensors with either the best-performing ion-selective membrane or its corresponding control membrane. All linear regressions had an R 2 0.999 . The number of measurements and the number of sensors were n = 2 and k = 2 , respectively, unless noted otherwise. See s Table A5 and Table A6 for averages and standard deviations, respectively, for all membranes. See Table 1 for membrane compositions.
Membrane Slope (mV/dec) log a LLL a log a LOD b
PVCPCTFEPVCPCTFEPVCPCTFE
N2/50−54.23−56.13−4.00−4.00−4.87−4.97
MC12N2/50−58.55−58.01−4.00−4.00−5.37−5.27
a Lower limit of linearity. b Limit of detection.
Table 3. Average potentiometric selectivity coefficients determined with the separate solution method ( a i = a j = 10 2.05   M ) for sensors with either the best-performing ion-selective membrane or its corresponding control membrane. The number of measurements and the number of sensors were n = 1 and k = 2 , respectively, unless noted otherwise. See Table A8 for standard deviations. See Table 1 for membrane compositions.
Ion, j log K acetate , j pot
N2/50MC12N2/50
PVCPCTFEPVCPCTFE
F −0.84−0.61−2.35−2.42
H P O 4 2 −0.55−0.39−2.39−2.10
H 2 P O 4 −0.36−0.14−2.17−1.88
S O 4 2 −0.21−0.04−1.68−1.11
H C O 3 0.180.28−0.06−0.02
H C O 2 0.600.66−0.16−0.14
L a c O 0.640.70−0.33−0.32
P i v O 1.271.281.081.14
C l 1.711.69−1.03−1.04
B z O 2.832.761.912.05
B r 3.253.30−0.17−0.00
N O 3 4.214.220.220.45
I 5.615.571.041.44
S C N 6.206.071.011.52
Publisher’s Note: MDPI stays neutral with regard to jurisdictional claims in published maps and institutional affiliations.