Abstract
As a hormone that determinates the level of fruit ripeness, ethylene concentration monitoring plays an important role in the agricultural field. One of the techniques that can be used to detect ethylene concentration is the sensing method. Zinc oxide (ZnO) is a multipurpose metal oxide semiconductor with a wide application in sensing area. Here, we use a ZnO-based flexible sensor to identify the presence of ethylene gas at certain concentrations. The as-synthesized ZnO layers were deposited on a polyethylene terephthalate-indium doped tin oxide (PET-ITO) flexible substrate using a simple electrochemical deposition method. To enhance the performance of the ethylene sensor, a small amount of silver (Ag) was added to the seeding solution. From the study, it was revealed that the ZnO-Ag layers were able to identify the presence of ethylene gas at the lowest concentration of 29 ppm. The most optimal result was obtained using 1 mM Ag. This layer demonstrated a response of 17.2% and 19.6% of ethylene gas at concentrations of 29 and 50 ppm, with recovery times of four and eight minutes, respectively.
1. Introduction
Ethylene is the smallest plant hormone that initiates fruit ripening. The presence of ethylene gas can accelerate and improve the appearance of fruit, which can increase the taste quality. The amount of ethylene released by plants can indicate the readiness level of fruit to be harvested. However, a high concentration of ethylene gas will cause the fruit to become overripe and reduce the selling price. Therefore, the ethylene gas concentration monitoring is important in order to determine the accurate harvest time of the fruits [1].
Metal oxides are promising active materials for many applications. Current progress in the preparation of metal oxides offers unique potentials function in new capabilities devices, for instance, wearable/flexible devices, smart textiles for well-being and health monitoring, or advanced sensing design, such as work functions, surface ionization, magnetic, self-heating, and Schottky-based devices [2]. Moreover, metal oxides have shown a remarkable application in gas sensing, such as CO, NO, as well as toluene gas [3,4,5].
Zinc oxide (ZnO) is a versatile n-type semiconductor with wide band-gap energy (3.37 eV at 300 K) and high exciton energy (60 meV) [6]. ZnO nanostructures have been utilized as several types of nanosensors. The ZnO’s sensing performance relies on its electrical properties which may change significantly in the presence of gas or chemical substances [7]. Based on this principle, different gas [8,9,10,11,12] and chemical sensors have been reported [13,14]. The interaction between ZnO and chemical gases, such as ethylene, may result in the electrical resistance value change of ZnO. However, the high working temperature of ZnO makes it difficult to work in ambient temperatures [15]. Moreover, ethylene is a non-polar molecule with the high activation energy for the reaction. The high dissociation bonds of C=C and C–H causes difficulty in ethylene’s bond breakage [16]. Various attempts have been carried out to improve the new device’s sensing performance, including decorating noble metal, doping proper element and introducing heterostructures [17].
The addition of noble metals, such as platinum (Pt) [18], palladium (Pd) [19], gold (Au) [20], and silver (Ag) [21,22], to the metal oxide structure can increase sensitivity and the selectivity. Weber et al. [19] has revealed that through spillover effect, Pd can easily enhance the response of ZnO NWs gas sensors. Pd is a well-known catalyst possessing H2 bond breaking abilities [19].
In our previous work, we have developed a ZnO-based sensor for ethylene gas which is used in high temperature (200 °C). However, this sensor has a very limited response to ethylene gas. In this study, we present a flexible ZnO sensor which is capable of detecting ethylene gas concentration at room temperature. The ZnO layer is prepared using a simple electrodeposition method. This method is selected due to its advantages of being relatively inexpensive and easy to control, making it possible to implement at a mass-production scale. The effect of silver addition on the sensor performance is also investigated.
2. Materials and Methods
Prior to the deposition process, 2 × 1.3 cm2 polyethylene terephthalate-indium doped tin oxide (PET-ITO) substrates (Solaronix, Aubonne, Switzerland) were firstly cleaned using an ultrasonic bath (Krisbow, Shanghai, China) in water and ethanol, consecutively. The ZnO precursor solution was prepared using an equimolar mixture of 0.2 M zinc nitrate tetrahydrate (Zn-nitrate, Zn(NO3)2·4H2O, Merck, Darmstadt, Germany) and hexamethylenetetramine (HMTA, C6H12N4, Merck, Darmstadt, Germany). The doping process was carried out by adding AgNO3 with the concentrations of 0.1, 0.5, 1, and 2 mM in the precursor, which are denoted as ZnO-Ag0.1, ZnO-Ag0.5, ZnO-Ag1, and ZnO-Ag2, respectively. The solutions were further aged for 2 h before deposition process on the PET-ITO substrate.
The electrodeposition process was conducted at 8–10 °C, by using voltage of 1.2 volts. The PET-ITO was placed in the anode position and dipped vertically in the precursor solution. The copper (Cu) electrode was used as the cathode. After 2 h, the PET-ITO substrates were removed from the solution, cleaned with demineralized water, and dried in air. The area of the ZnO-Ag sensing layer for each PET-ITO substrate was 1.3 × 1.3 cm2. The silver paste was drawn at the tip of the sensing layer and functioned as the electrode for the sensor. The schematic figure of the sensor device with the electrode and sensing layer is shown in Figure 1a, and the flexible ZnO-based ethylene sensor is presented in Figure 1b. The phase identification of the sample deposited on the glass substrate was investigated using X-ray diffractometer for thin films using Cu-Kα radiation (λ = 1.5406 Å) (XRD, Pan Analytical-Empyrean, Almelo, Netherlands) and Fourier transform infrared spectroscopy (FTIR, Bruker Alpha-T-Massachusetss, Billerica, MA, USA), while morphological and distributional observation was performed using scanning electron microscopy–energy-dispersive x-ray spectroscopy (SEM–EDS, Hitachi SU3500, Tokyo, Japan).
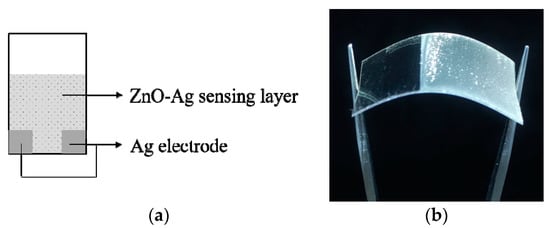
Figure 1.
ZnO-based ethylene sensor: (a) Schematic design; (b) Flexible sensor.
To measure gas-sensing properties, the test sample was placed in a sealed chamber. The resistance value of ZnO film (i.e., Ra) in air was measured thereafter. The ethylene gas was then injected into the sample chamber and the resistance of the sample in the presence of ethylene gas (i.e., Rg) was measured by Picotest M3500A digital multimeter. In this study, we use two different ethylene concentrations, i.e., 29 and 50 ppm. The schematic figure of sensor test system is presented in Figure 2. The sensor response (S) to ethylene gas is defined by Equation (1) [10].
S = ((Ra − Rg)/Ra) × 100%
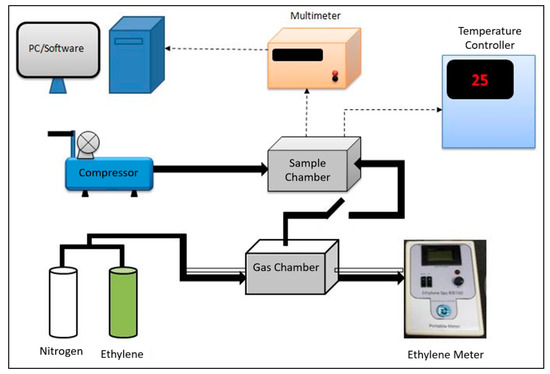
Figure 2.
Ethylene sensor performance testing scheme.
3. Results and Discussion
3.1. Structure and Morphologies of ZnO-Ag Layer
The structural information of the ZnO-Ag layers was analyzed using the XRD method. Figure 3 shows the diffraction patterns of the ZnO-Ag layers on top of the PET-ITO substrate. Based on the patterns, the ZnO peak was characterized at 2θ ~ 31.7°, 33.6°, and 34.6°, which correlates to the Miller index of (100), (111), and (002), respectively. The Ag peak was detected at 2θ ~37° which correlates to the Miller index of (111). As seen in the diffractogram, the addition of Ag in the layer changes the layer’s performance but does not increase the intensity of Ag in the pattern. Quantitative analysis was carried out to obtain the ZnO crystallite size in the sample. From the table, it can be seen that the addition of Ag in various concentrations did not have significant effect in the crystallite size. The ZnO-Ag layers have an average crystallite size of 44 ~ 47 nm. The crystallite size of the ZnO was calculated using the Debye-Scherrer method [23] (Equation (2)) and presented in Table 1.
D = (0.9λ)/β cosθ
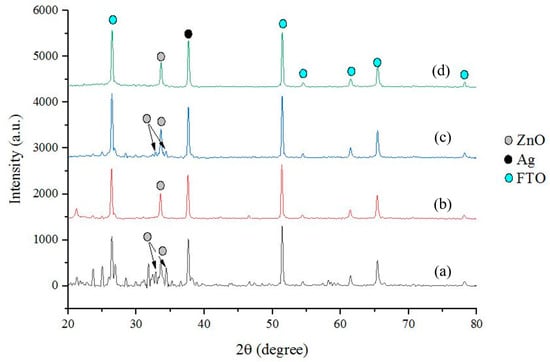
Figure 3.
Diffraction pattern of: (a) ZnO-Ag0.1; (b) ZnO-Ag0.5; (c) ZnO-Ag1; and (d) ZnO-Ag2.

Table 1.
The crystallite size of ZnO-Ag layers.
From the table, it can be seen that the addition of Ag in various concentrations do not have significant effect in the crystallite size. The ZnO-Ag layers have an average crystallite size of 44 ~ 47 nm.
The attachment of ZnO layer could lead to the development of cracks and buckles on flexible substrate. This buckling phenomena occurs due to the compressive strains, which resulted from the substrate contraction perpendicular to the tensile direction. For ZnO layer, the buckles were relatively small and cracked which points to good adhesion to the PET [24].
The addition of silver doping to the ZnO layer using the electrodeposition method allows for the occurrence of chemical bonds between ZnO and Ag. To observe this, characterization using Fourier transform infrared (FTIR) spectroscopy was carried out. The FTIR spectrum of the ZnO-Ag samples is presented in Figure 4.
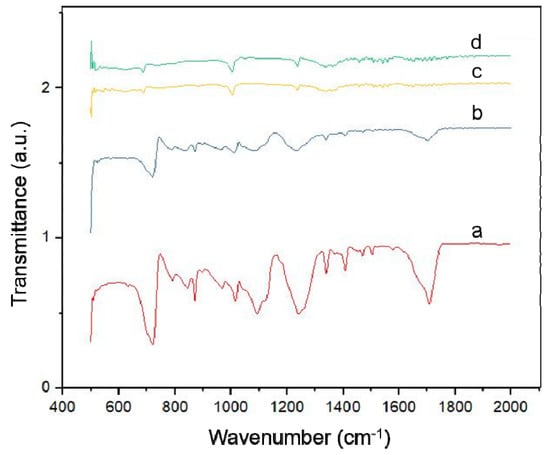
Figure 4.
FTIR spectra of: (a) ZnO-Ag0.1; (b) ZnO-Ag0.5; (c) ZnO-Ag1; and (d) ZnO-Ag2.
In Figure 4, it is observed that the Zn-O spectrum is assigned at 500 cm−1, whereas the peaks at 800 cm−1 and 1500 cm−1 are assigned to C-H, C-O-C and C-C-O groups from the PET substrate. At 1750 cm−1, a peak that represents the C=O group is also figured from the polyethylene substrate. Based on observations of the results of the FTIR above, one can see that there is no observed bond between ZnO and Ag, which indicates that ZnO and Ag do not bind chemically [25]. The absence of chemical bonds between ZnO-Ag indicates that Ag only physically binds with ZnO [26].
The morphology and the cross-sectional view of the ZnO-Ag layer were analyzed using SEM, as shown in Figure 5. From the images, it was observed that using electrodeposition, the as-deposited ZnO was grown in flakes structure, with a size range of 10–20 µm. The ZnO-Ag layers were evenly distributed on the substrates, with a thickness range of 18–52 µm. Clearer images of Ag in the ZnO layer are presented in Figures S1–S4. From the images, it is shown that Ag particles were spread on the surface of ZnO. The mapping of Ag particles in the layers can be found in the Figure S5.
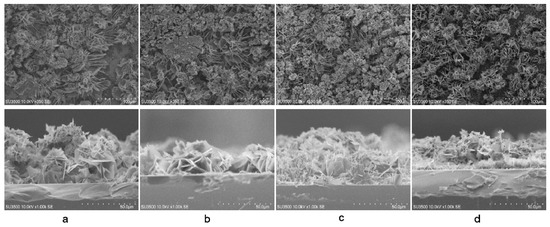
Figure 5.
Top view and cross-sectional image of: (a) ZnO-Ag0.1; (b) ZnO-Ag0.5; (c) ZnO-Ag1; and (d) ZnO-Ag2.
The amount of Ag on the surface of ZnO was observed using EDS. This observation was carried out to confirm the presence Ag on the surface of ZnO, as compared to the addition of concentration to the electrodeposition solution. Based on in Figure S5, it was observed that a greater Ag concentration in the solution will result in a higher peak of Ag in the EDS spectrum. As shown in the figure, it is confirmed that a greater Ag concentration in the electrodeposition solution will result in a greater the wt.% of the layer. In addition to Ag wt.%, it is necessary to investigate the distribution of Ag in the zinc oxide layer. This will affect the spillover effect on the adsorption process of ethylene and oxygen gas in the zinc oxide layer.
Figure 6 shows the SEM-EDS mapping image from the ZnO-Ag layers. It was observed that on ZnO samples with 0.1 mM Ag and 0.5 mM Ag (Figure 6a,b), the silver was spread evenly throughout the surface. On the ZnO layer with 1 mM Ag concentration, it was observed several spots of silver agglomerates in the layer. However, in a 2 mM Ag ZnO sample, the silver tends to agglomerate in the larger areas at the surface coverage. Hence, at this concentration, the distributions of the Ag particle in ZnO layer is worse compared to other concentrations. The series of SEM-EDS mapping for ZnO-Ag layers can be seen in Figure S6.
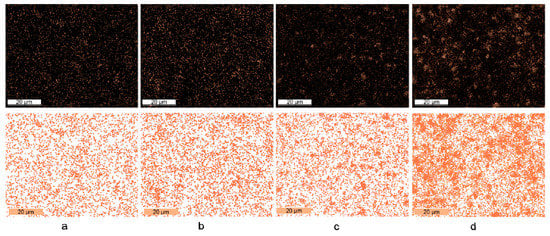
Figure 6.
Ag distribution on ZnO surface in: (a) ZnO-Ag0.1; (b) ZnO-Ag0.5; (c) ZnO-Ag1; and (d) ZnO-Ag2.
3.2. Sensor Response Test
Sensor testing was carried out using all ZnO samples with 29 and 50 ppm of ethylene gas. In this study, the lowest ethylene concentration that can be detected by the ZnO-Ag sensor is 29 ppm. Meanwhile, in our previous study, the lowest ethylene concentration that could be detected by ZnO sensor was 50 ppm, with the sensitivity of 2.4% at 200 °C [27]. Sensor response values for ZnO-Ag samples were found to escalate with the increase of Ag concentration. This is due to Ag doping in the material which facilitates the transfer of electrons from the valence band to the conduction band when a reaction occurs between the layer and ethylene gas. However, the ZnO layer with 2 mM Ag doping has shown a decline response. This is due to the conductive properties of Ag which lowered the electrical resistance of the layer. Hence, the change in resistance value becomes insignificant when the layer is exposed to ethylene gas. The graphical sensor response test can be seen in Figure 7. The results of the sensor test response can be seen in Table 2.
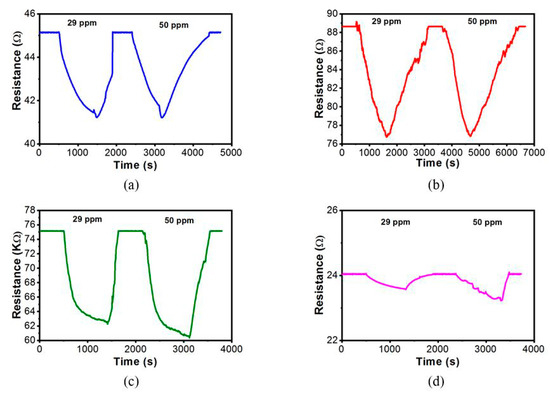
Figure 7.
Sensor response on ethylene gas for: (a) ZnO-Ag0.1, (b) ZnO-Ag0.5, (c) ZnO-Ag1, and (d) ZnO-Ag2.
Table 2.
Sensor response to ethylene gas.
In the previous work, Kumar et al. [28] and Majumdar et al. [29] have shown that crystallite size and crystallinity of the sensing layer have certain effect on the sensor’s performance. However, in this study, the ZnO-Ag layers had no significance difference in the crystallite size. Hence, the sensor performances are mainly dependent on the amount of Ag in the ZnO sensing layer.
These results indicate that the ethylene gas can be detected efficiently at room temperature using the ZnO-Ag sensor. After ethylene gas flowed for 15 min, the most significant decrease in resistance occurred in the 1 mM Ag sample reaching 14 KΩ, while the decrease in ZnO 2 mM sample resistance was only 0.5 Ω. Furthermore, the fastest recovery time occurred in the sample of 1 mM Ag, i.e., 4 min at 29 ppm ethylene gas exposure. Meanwhile, ZnO layer 0.5 mM Ag doping also showed a good sensor response. However, this layer has the slowest recovery time. This condition might have occurred due to the structure of the ZnO-Ag flake layer, which inhibits the release of adsorbed ethylene and prevents the ZnO recovery reactions with oxygen [30]. Furthermore, the addition of Ag to ZnO has been proven to lower the sensors’ working temperature, while increasing the sensitivity. The effect of gas concentration started to observe when the amount of Ag doping is 1 mM, as seen in Figure 8. Below that concentration, the presence of Ag in ZnO did not seem to affect to the change of gas concentration.
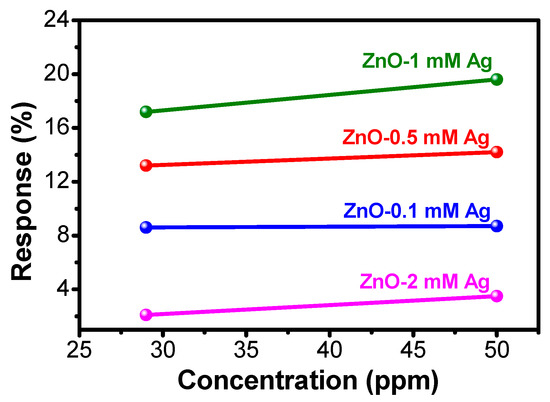
Figure 8.
Effect of ethylene concentration on the response value of all ZnO-Ag samples.
The adsorption of molecules and oxygen atoms on the surface of ZnO nanoparticles will produce a layer of depletion. A depletion layer forms when electrons were taken by oxygen from the conduction band of ZnO. By taking those electrons, the oxygen will be ionized into O−, O2−, or O2−. The depletion layer prevents electrons from moving, and hence increases the electrical resistance. The more oxygen adsorbed, the greater the thickness of the depletion layer which will increase of the initial resistance before ethylene gas is flowed [31]. The ethylene gas will be adsorbed chemically (chemisorption) by zinc oxide and react with oxygen ions and electrons will switch back the conduction band so that the depletion layer will be thinned out. This will cause a decrease in electrical resistance. The amount of oxygen adsorbed is influenced by the morphology, particle size, specific surface area, and active surface area [31]. An illustration for the ethylene sensing mechanism of the ZnO-Ag active layer is shown in Figure 9.
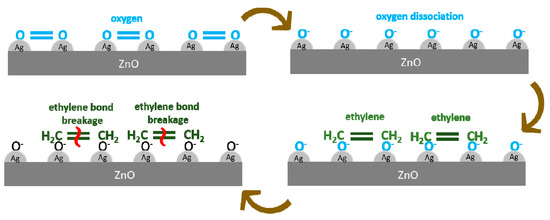
Figure 9.
Sensing mechanism illustration of ethylene detection by ZnO-Ag active layer.
Noble metals, such as Au and Ag, exhibit a surface plasmon resonance (SPR) phenomenon in the visible region due to the collective oscillations of their free electrons. The addition of Ag will generate an SPR phenomenon on the ZnO layer, which can accelerate the dissociation of O2 to O− on top of the layer. Thus, the oxygen ions will be more rapidly adsorbed on the surface of zinc oxide. When ethylene gas flows, silver will accelerate ethylene breakdown with the SPR phenomenon. Subsequently, the electron will return to the conduction band. Ethylene will react faster with oxygen ions, which are adsorbed on the zinc oxide surface [16].
The catalyst phenomenon that occurs in ZnO-Ag must be accompanied by a good dispersion of precious metals on the metal oxide surface [32]. The addition of Ag must be carried out evenly on the surface of ZnO, thus the transfer of oxygen ions to the surface of zinc oxide can be supported by spillover effects. In the ZnO sample with 2 mM Ag doping, the distribution layer was uneven or concentrated at one point, which results in the spillover effect that did not occur well. In addition, the conductive Ag properties caused a low initial resistance before ethylene gas flowed (R0). Consequently, the resistance changes that occur are not significant, which leads to a low sensor response in the ZnO 2 mM Ag sample.
4. Conclusions
In this study, a flexible room-temperature ethylene sensor has been successfully fabricated using a PET-ITO substrate. The sensing layers were made using ZnO-Ag layer, with various Ag concentrations. From the results, it was found that the optimum layer was made of ZnO with 1mM Ag doping. This layer demonstrated a response of 16.8% and 17.6% of ethylene gas at 29 and 50 ppm concentrations for 15 min exposure time, with recovery times of four and eight minutes, respectively.
Supplementary Materials
The following are available online at https://www.mdpi.com/2227-9040/8/1/2/s1, Figure S1: Morphological image of ZnO layer with the addition of 0.1 mM Ag. The white dots indicate Ag on the surface of ZnO layer, Figure S2: Morphological image of ZnO layer with the addition of 0.5 mM Ag. The white dots indicate Ag on the surface of ZnO layer, Figure S3: Morphological image of ZnO layer with the addition of 1 mM Ag. The white dots indicate Ag on the surface of ZnO layer, Figure S4: Morphological image of ZnO layer with the addition of 2 mM Ag. The white dots indicate Ag on the surface of ZnO layer, Figure S5: Energy-dispersive spectra for: (a) ZnO-Ag0.1; (b) ZnO-Ag0.5; (c) ZnO-Ag1; and (d) ZnO-Ag2, Figure S6: Elements distribution for: (a) ZnO-Ag0.1; (b) ZnO-Ag0.5; (c) ZnO-Ag1; and (d) ZnO-Ag2.
Author Contributions
A.S. was responsible for conceptualization, methodology, manuscript preparation, and project administration. D.F.F. contributed to the experimental laboratory work, integrity of the analytical data, and original manuscript preparation. N.H., L.U., and N.L.W.S. contributed to the experimental laboratory work, data management, data validation, visualization and data interpretation. B.Y. was responsible for conceptualization, supervision, and final manuscript revision. All authors have read and agreed to the published version of the manuscript.
Funding
This research was partly supported by the Ministry of Research, Technology, and Higher Education of Republic of Indonesia through Post-Doctoral Research Grant and Institut Teknologi Bandung (ITB).
Acknowledgments
The authors thank Karla Karmala from Departement of Metallurgical Engineering, Faculty of Engineering, Universitas Sultan Ageng Tirtayasa for sample preparations.
Conflicts of Interest
The authors declare no conflict of interest.
References
- Esser, B.; Schnorr, J.M.; Swager, T.M. Selective detection of ethylene gas using carbon nanotube-based devices: Utility in determination of fruit ripeness. Angew. Chem. Int. Ed. 2012, 51, 5752–5756. [Google Scholar] [CrossRef] [PubMed]
- Comini, E. Metal oxide nanowire chemical sensors: Innovation and quality of life. Mater. Today 2016, 19, 559–567. [Google Scholar] [CrossRef]
- Nugraha, A.; Saputro, A.G.; Agusta, M.K.; Yuliarto, B.; Dipojono, H.K.; Rusydi, F.; Maezono, R. Selectivity of CO and NO adsorption on ZnO (0002) surfaces: A DFT investigation. Appl. Surf. Sci. 2017, 410, 373–382. [Google Scholar] [CrossRef]
- Debataraja, A.; Muchtar, A.R.; Septiani, N.L.W.; Yuliarto, B.; Nugraha; Sunendar, B. High performance carbon monoxide sensor based on nano composite of SnO2-graphene. IEEE Sens. J. 2017, 17, 8297–8305. [Google Scholar] [CrossRef]
- Septiani, N.L.W.; Yuliarto, B.; Nugraha; Dipojono, H.K. Multiwalled carbon nanotubes–zinc oxide nanocomposites as low temperature toluene gas sensor. Appl. Phys. A 2017, 123, 166. [Google Scholar] [CrossRef]
- Galstyan, V.; Comini, E.; Baratto, C.; Faglia, G.; Sberveglieri, G. Nanostructured ZnO chemical gas sensors. Ceram. Int. 2015, 41, 14239–14244. [Google Scholar] [CrossRef]
- Celik-Butler, Z.; Hamid, H.M.A. ZnO nano-sensors and nano-energy harvesters. In Proceedings of the 2017 IEEE Sensors, Glasgow, UK, 29 October–1 November 2017; pp. 1–3. [Google Scholar]
- Acharyya, D.; Bhattacharyya, P. Alcohol sensing performance of ZnO hexagonal nanotubes at low temperatures: A qualitative understanding. Sens. Actuators B Chem. 2016, 228, 373–386. [Google Scholar] [CrossRef]
- Biasotto, G.; Ranieri, M.G.A.; Foschini, C.; Simões, A.Z.; Longo, E.; Zaghete, M.A. Gas sensor applications of zinc oxide thin film grown by the polymeric precursor method. Ceram. Int. 2014, 40, 14991–14996. [Google Scholar] [CrossRef]
- Gurav, K.V.; Deshmukh, P.R.; Lokhande, C.D. LPG sensing properties of Pd-sensitized vertically aligned ZnO nanorods. Sens. Actuators B Chem. 2011, 151, 365–369. [Google Scholar] [CrossRef]
- Rout, C.S.; Raju, A.R.; Govindaraj, A.; Rao, C.N.R. Hydrogen sensors based on ZnO nanoparticles. Solid State Commun. 2006, 138, 136–138. [Google Scholar] [CrossRef]
- Zheng, Z.Q.; Yao, J.D.; Wang, B.; Yang, G.W. Light-controlling, flexible and transparent ethanol gas sensor based on ZnO nanoparticles for wearable devices. Sci. Rep. 2015, 5, 11070. [Google Scholar] [CrossRef] [PubMed]
- Wang, Z.; Zhan, X.; Wang, Y.; Muhammad, S.; Huang, Y.; He, J. A flexible UV nanosensor based on reduced graphene oxide decorated ZnO nanostructures. Nanoscale 2012, 4, 2678. [Google Scholar] [CrossRef] [PubMed]
- Yang, H.; Ye, Q.; Zeng, R.; Zhang, J.; Yue, L.; Xu, M.; Qiu, Z.; Wu, D. Stable and fast-response capacitive humidity sensors based on a ZnO nanopowder/PVP-RGO multilayer. Sensors. 2017, 17, 2415. [Google Scholar] [CrossRef] [PubMed]
- Kumar, R.; Al-Dossary, O.; Kumar, G.; Umar, A. Zinc oxide nanostructures for NO2 gas–sensor applications: A review. Nano-Micro Lett. 2015, 7, 97–120. [Google Scholar] [CrossRef]
- Liang, X.; Wang, P.; Li, M.; Zhang, Q.; Wang, Z.; Dai, Y.; Zhang, X.; Liu, Y.; Whangbo, M.; Huang, B. Adsorption of gaseous ethylene via induced polarization on plasmonic photocatalyst Ag/AgCl/TiO2 and subsequent photodegradation. Appl. Catal. B Environ. 2018, 220, 356–361. [Google Scholar] [CrossRef]
- Qu, Z.; Fu, Y.; Yu, B.; Deng, P.; Xing, L.; Xue, X. High and fast H2S response of NiO/ZnO nanowire nanogenerator as aself-powered gas sensor. Sens. Actuators B Chem. 2016, 222, 78–86. [Google Scholar] [CrossRef]
- Shim, J.C.; Chung, G.S. Fabrication and Characterization of Pt/ZnO NO Sensor Integrated SiC Micro Heater. In Proceedings of the 2010 IEEE Sensors, Kona, HI, USA, 1–4 November 2010; pp. 350–353. [Google Scholar]
- Weber, M.; Kim, J.Y.; Lee, J.H.; Kim, J.H.; Iatsunskyi, I.; Coy, E.; Miele, P.; Bechelany, M.; Kim, S.S. Highly Efficient Hydrogen Sensors Based on Pd Nanoparticles Supported on Boron Nitride Coated ZnO Nanowires. J. Mater. Chem. A 2019, 7, 8107. [Google Scholar] [CrossRef]
- Deshwal, M.; Aurora, A. Enhanced acetone detection using Au doped ZnO thin film sensor. J. Mater. Sci. Mater. Electron. 2018, 29, 15315–15320. [Google Scholar] [CrossRef]
- Lupan, O.; Cretu, V.; Postica, V.; Ahmadi, M.; Cuenya, B.R.; Chow, L.; Tiginyanu, I.; Viana, B.; Pauporte, T.; Adelung, R. Silver-doped zinc oxide single nanowire multifunctional nanosensor with a significant enhancement in response. Sens. Actuators B Chem. 2016, 233, 893–903. [Google Scholar] [CrossRef]
- Yin, Z.; Wang, X.; Sun, F.; Tong, X.; Zhu, C.; Lv, Q.; Ye, D.; Wang, S.; Luo, W.; Huang, Y.A. Aligned hierarchical Ag/ZnO nano-heterostructure arrays via electrohydrodynamic nanowire template for enhanced gas-sensing properties. Sci. Rep. 2017, 7, 12206. [Google Scholar] [CrossRef]
- Narayanan, G.N.; Ganesh, R.S.; Karthigeyan, A. Effect of annealing temperature on structural, optical and electrical properties of hydrothermal assisted zinc oxide nanorods. Thin Solid Films 2016, 598, 39–45. [Google Scholar] [CrossRef]
- Chawla, V.; Ruoho, M.; Weber, M.; Chaaya, A.A.; Taylor, A.A.; Charmette, C.; Miele, P.; Bechelany, M.; Michler, J.; Utke, I. Fracture Mechanics and Oxygen Gas Barrier Properties of Al2O3/ZnO Nanolaminates on PET Deposited by Atomic Layer Deposition. Nanomaterials 2019, 9, 88. [Google Scholar] [CrossRef] [PubMed]
- Saoud, K.; Alsoubaihi, R.; Bensalah, N.; Bora, T.; Bertino, M.; Dutta, J. Synthesis of supported silver nano-spheres on zinc oxide nanorods for visible light photocatalytic applications. Mater. Res. Bull. 2015, 63, 134–140. [Google Scholar] [CrossRef]
- Wang, T.; Bristowe, P.D. Controlling Ag diffusion in ZnO by donor doping: A first principles study. Acta Mater. 2017, 137, 115–122. [Google Scholar] [CrossRef]
- Sholehah, A.; Pusparasmi, D.A.; Yuliarto, B. The application of zinc oxide layer as ethylene sensor. IOP Conf. Ser. Mater. Sci. Eng. 2019, 541, 012051. [Google Scholar] [CrossRef]
- Kumara, E.R.; Kamzin, A.S.; Janani, K. Effect of annealing on particle size, microstructure and gas sensing properties of Mn substituted CoFe2O4 nanoparticles. J. Magn. Magnet. Mater. 2016, 417, 122–129. [Google Scholar] [CrossRef]
- Majumdar, S. The Effects of crystallite size, surface area and morphology on the sensing properties of nanocrystalline SnO2 based system. Ceram. Int. 2015, 41, 14350–14358. [Google Scholar] [CrossRef]
- Krivec, M.; Gunnigle, G.M.; Abram, A.; Maier, D.; Waldner, R.; Gostner, J.M.; Überall, F.; Leitner, R. Quantitative ethylene measurements with MOx chemiresistive sensors at different relative air humidities. Sensors 2015, 15, 28088–28098. [Google Scholar] [CrossRef]
- Ding, J.; Zhu, J.; Yao, P.; Li, J.; Bi, H.; Wang, X. Synthesis of ZnO-Ag Hybrids and Their Gas-Sensing Performance toward Ethanol. Ind. Eng. Chem. Res. 2015, 54, 8947–8953. [Google Scholar] [CrossRef]
- Liu, C.; Kuang, Q.; Xie, Z.; Zheng, L. The effect of noble metal (Au, Pd and Pt) nanoparticles on the gas sensing performance of SnO2-based sensors: A case study on the {221} high-index faceted SnO2 octahedra. Cryst. Eng. Comm. 2015, 17, 6308–6313. [Google Scholar] [CrossRef]


© 2019 by the authors. Licensee MDPI, Basel, Switzerland. This article is an open access article distributed under the terms and conditions of the Creative Commons Attribution (CC BY) license (http://creativecommons.org/licenses/by/4.0/).