Article

An Innovative Real-Time Cell Viability Analysis: A Cutting-Edge Flexible Bioimpedance Sensor

by
Thien-Luan Phan
1,2,3,†,
Hsin-Yu Chou
4,5,†,
Hui-Xuan Huang
1,
Chia-Hung Kuo
6,
Congo Tak Shing Ching
1,5,7,* and
Hui-Min David Wang
1,5,8,9,10,*
1
Graduate Institute of Biomedical Engineering, National Chung Hsing University, Taichung 402, Taiwan
2
Department of Physic and Electronic Engineering, University of Science, Ho Chi Minh City 700000, Vietnam
3
Department of Physics and Electronic Engineering, Vietnam National University, Ho Chi Minh City 700000, Vietnam
4
Department of Materials Science and Engineering, National Chung Hsing University, Taichung 402, Taiwan
5
Ph.D. Program in Tissue Engineering and Regenerative Medicine, National Chung Hsing University, Taichung 402, Taiwan
6
Department of Seafood Science, National Kaohsiung University of Science and Technology, Kaohsiung 811, Taiwan
7
Department of Electrical Engineering, National Chi Nan University, Nantou 54561, Taiwan
8
Graduate Institute of Medicine, College of Medicine, Kaohsiung Medical University, Kaohsiung 807, Taiwan
9
Department of Medical Laboratory Science and Biotechnology, China Medical University, Taichung City 404, Taiwan
10
Center of Applied Nanomedicine, National Cheng Kung University, Tainan 701, Taiwan
*
Authors to whom correspondence should be addressed.
These authors contributed equally to this work.
Chemosensors 2025, 13(4), 132; https://doi.org/10.3390/chemosensors13040132
Submission received: 19 February 2025 / Revised: 20 March 2025 / Accepted: 29 March 2025 / Published: 6 April 2025

Abstract

:
There are many compounds used to treat cancer, but still, only 20% of proposed anticancer agents have been commercialized after clinical trials due to serious side effects and unsatisfactory results. To screen potential drugs precisely and quickly, this study develops a flexible bioimpedance sensor. The sensor positively detects the half maximal inhibitory concentration (IC50) of drugs in real time by analyzing phase angle changes during cell mortality. The best results are achieved using a probe separation of A12B34 at logarithmic frequencies of 163 Hz and 77.87 kHz. At these two frequencies, there is a linear relationship with the phase angle at 0% and 50% of the dead cells. Dividing the phase angle at the two frequencies shows a 17.98% change in the phase angle, which allows self-correction and insensitivity to the number of cells. A custom phase angle measurement device is developed for detection at 163 Hz and 77.87 kHz, respectively. This study develops a novel sensor that is precise and fast and allows high-throughput analysis to detect the inhibition of cancer in real time. This sensor is an alternative to traditional chemical detection methods because it is faster, cheaper, and more accurate.

1. Introduction

A cure for cancer is an ambitious goal, but according to the World Health Organization (WHO), cancer caused approximately 10 million deaths in 2020, accounting for about one-sixth of global mortality. This represented a 4.2% increase compared to the figures from 2018 [1,2,3]. It is projected that new cancer cases will rise by 60% over the next 20 years, with more than 80% of these cases occurring in developing countries, as predicted by the WHO. The high rates of cancer mortality and morbidity highlight the need for a drug screening model, including predictive flaws [4,5]. While numerous new drugs for cancer therapy have been identified in recent decades, the success rates remain low, and the cost of developing anticancer drugs continues to rise, while the mortality rate from cancer remains high [6]. A reliable and accurate screening method is essential for identifying the mechanisms of action of drugs, evaluating the effects of anticancer therapeutics in humans, and screening effective therapeutic agents. Cancers exhibit high mortality and morbidity rates due to metastasis or recurrence after treatment, and these types of cancer often display a high tolerance to conventional chemotherapy drugs [7,8,9,10,11,12]. In this study, a device was developed for real-time monitoring of cell survival rates, inspired by previous experiments [13]. The flexible bioimpedance sensor was employed to differentiate between living and dead cells. Although this method is less accurate than chemical methods, it offers several advantages, as presented in Table 1. The high mortality and morbidity rates associated with cancers are primarily attributed to metastasis or recurrence after treatment, with these types of cancer often demonstrating a high tolerance to conventional chemotherapy drugs. The inability to achieve uniform drug distribution after spreading to different parts of the body contributes to the emergence of drug resistance in cancer [14,15,16]. One crucial factor in cancer metastasis is circulating tumor cells (CTCs), which detach from the primary tumor and spread to other organs based on the microenvironment [17,18]. For instance, melanoma cancer cells easily metastasize in the lungs. Previous studies have indicated the accumulation of immune cells and significant inflammation before cancer dissemination [19,20], which facilitates the attachment and transfer of CTCs. Since both CTCs and immune cells are suspended in the bloodstream, the detection of suspended cells is a critical issue.
High-throughput screening is based on cell culture, utilizing micro-well plates as carriers, automated system operation, and a fast and sensitive detection method to interpret the measurement data rapidly. This enables the rapid screening of drugs or medical materials, facilitating their analysis and processing [21,22,23]. Through this method, candidate drugs can be quickly identified, and they can also be actively employed in the biocompatibility assessment of medical materials. In the past, the evaluation of cell survival/death primarily relied on optical microscope observation of changes in cell morphology, the MTT analysis method to assess cell viability, and even the utilization of fluorescent markers in the live/dead method [24]. These methods allow for the exploration of information inside and outside the cell; however, they still have certain disadvantages, including being time-consuming and labor-intensive, requiring cell sacrifice, or lacking real-time measurement capabilities (Table 1). This study aims to address these limitations through the measurement of electrical impedance. Electrical impedance recently has shown incredible potential in monitoring and identifying samples in a controlled environment [25,26,27] such as cell culture. The characteristic response obtained from the existing electrical properties of the cell, such as impedance, admittance, phase angle, and frequency response, can be analyzed to differentiate between cell survival and death. This approach is a direct or indirect measurement tool widely utilized in biomedical research.
Table 1. Comparison of cell viability methods.
Cost 1Real-Time MonitoringExperiment DurationSacrificing Cells After the TestAgentsAdvantagesRef.
Traditional chemical method (MTT/MTS)0.1–1N/A2–4 hNecessaryMTT/MTSCheap and no equipment needed[10]
Flow cytometry1 2N/A30 mNecessaryFluorescent dyeMultiple experiments can be performed at the same time[28]
Flexible Bioimpedance SensorN/A3Yes1 mUnnecessaryNoneNarrated in the text
1 The cost required for each use (USD), not including the cost of the instrument. 2 The lowest cost; it may be more expensive depending on the fluorescent dye used. 3 The sensor costs 10 USD in small batches, but since it is not yet commercially available, the price is marked as N/A.
Developing a flexible device for sensing cell survival rates has always been a challenging goal for both the scientific and industrial communities. Previously, cells were either directly cultured on the sensor electrodes or embedded directly in the bottom of the microplate [29]. Although this design is effective, it may alter the cell’s original physiological characteristics and pose challenges in terms of manufacturing cost and user interface. Fernandez et al. [30] conducted a study on a flexible microfluidic sensor that has the capability to detect biomass and cell viability simultaneously. This technology differentiates between live and dead cells at a specific frequency. It represents a breakthrough in the design paradigm of conventional sensors, as it eliminates the need for cells to pass through the sensor via a channel in the microfluidic sensor. In practical applications, high-throughput screening requires collecting substantial data from a microplate, and the measurements must be performed in situ. However, the current sensor fails to meet these requirements [31,32]. This study presents the development of a non-microfluidic flexible cell viability sensor. The sensor can be uniformly stretched on the side of a microplate, allowing for the collection of extensive detection data using multi-point electrodes. This enables the assessment of the survival rate of individual cells within the same Petri dish, specifically targeting suspended cells in microwells. This novel approach overcomes the limitations of previous cell sensors and offers significant advancements in cell viability monitoring.

2. Materials and Methods

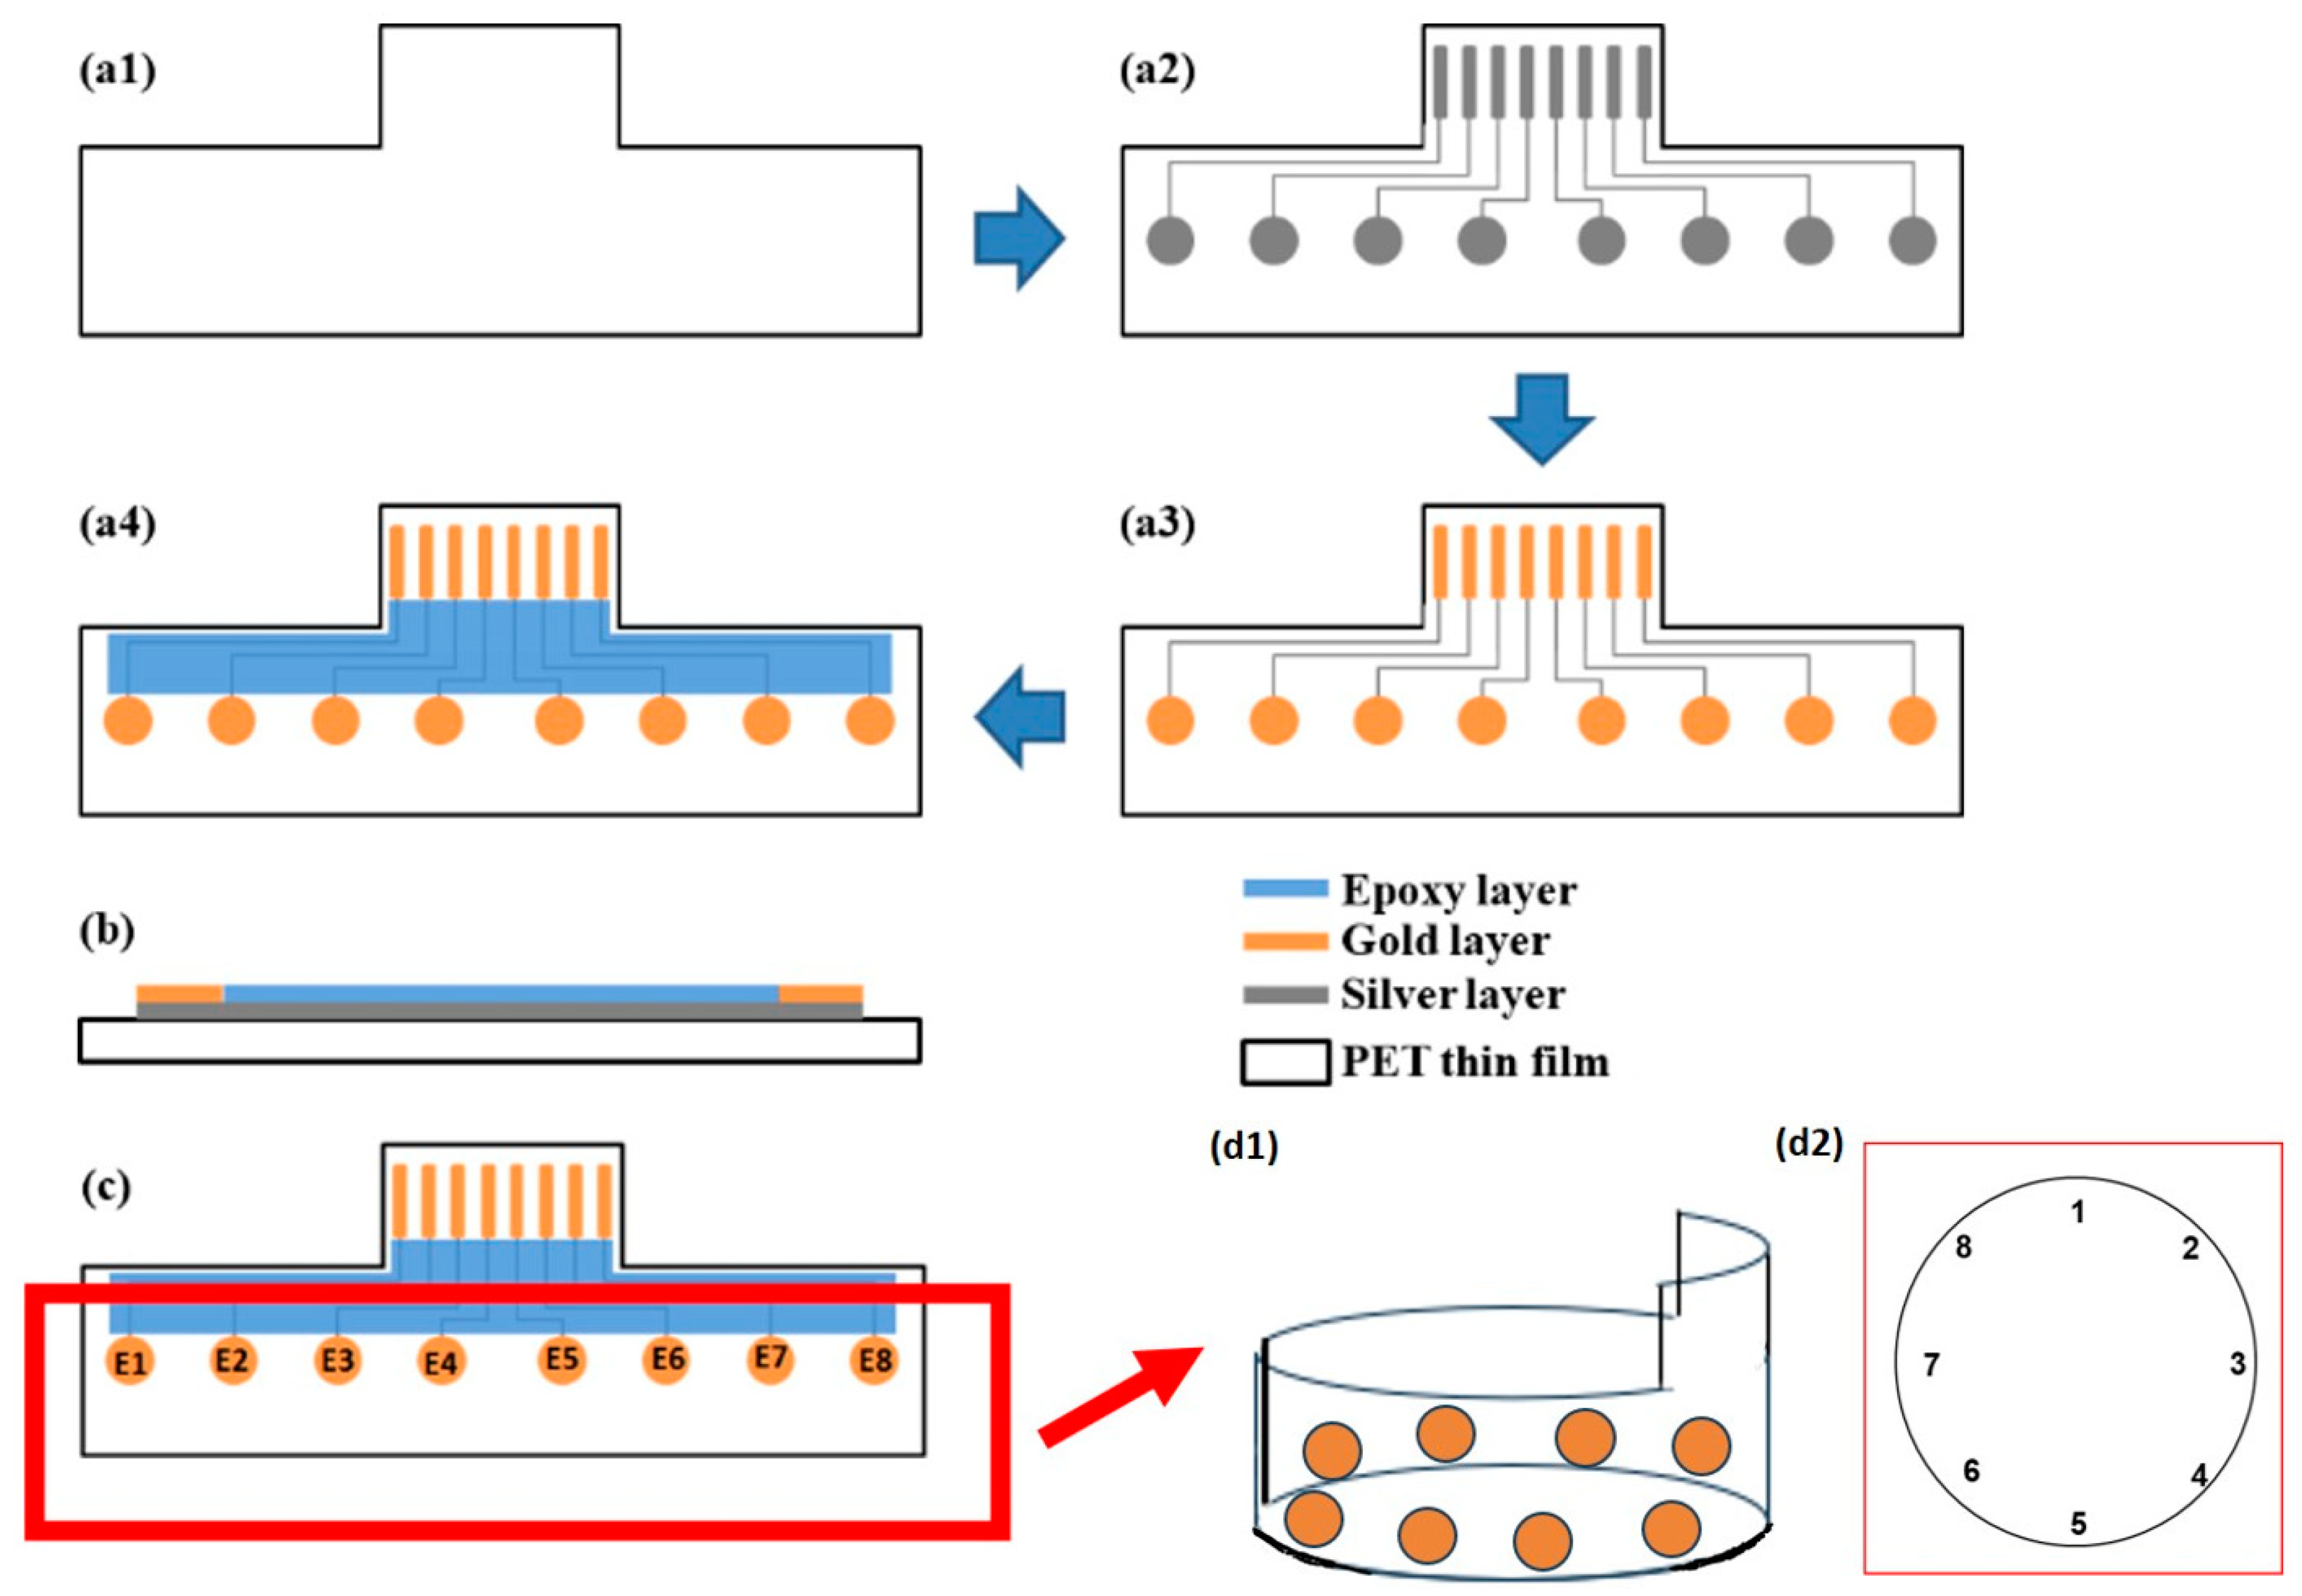
2.1. The Design of Flexible Bioimpedance Sensor

The sensor fabrication process utilized the screen-printing technique on PET film. The construction involved three layers. The bottom layer consisted of a silver layer serving as signal conduction lines (Figure 1a2). The middle layer employed gold particles (Figure 1a3) to create connection pins and sensing windows for sample measurement. The final layer utilized epoxy insulation to insulate the protected area of the conduction lines and form a testing well at the sensing windows. The transducers were constructed using the conventional screen-printing technique, with a screen mesh size of 390 counts per inch and a screen emulsion thickness of 25 μm. Each of the three layers was printed sequentially onto a transparent PETE sheet and allowed to dry at room temperature for 2 h. Before the screen-printing process, the PETE sheets underwent annealing at 80 °C for 1 h. The gold particles and silver paste were sourced from Advanced Conductive Materials (Atascadero, CA, USA), while the insulating paste (Polyurethane) was obtained from Measurement Group UK Ltd. (Hants, UK). The polyethylene terephthalate (PETE) sheet was purchased from 3M (Maplewood, MN, USA).

2.2. Circle Electrode Measurement Selection

In this experiment, a flexible bioimpedance sensor was applied to a 6-well cell culture plate (Thermo Scientific™ Nunc™ Cell-Culture Treated Multidishes, Cat. No. 140685, Waltham, MA, USA). Each well has a radius of 1.74 cm and a circumference of 10 cm. The sensing electrode was wrapped around the inner wall of the well, ensuring close contact between the sensor and the well surface. The gold electrodes extended from the sensor to the measurement device for impedance analysis. To prepare the measurement environment, 2 mL of culture medium was added to each well, allowing the suspended cells to distribute evenly. Before measurement, the plate was subjected to gentle shaking to ensure uniform suspension. The electrode arrangement naturally formed a circular shape along the well’s perimeter, which is reflected in the circular representation of the sensing area in Figure 1c,d. The measurement electrode pair was chosen based on the distances between electrodes. Based on the position of the electrode, measurements between pairs 1 and 2 and between 1 and 8 of the sensor should give the same value as for the pairs 1–3, 1–7, etc. For single electrode pair measurements, we used pairs 1–2, 1–3, 1–4, and 1–5, and in the same manner, two-, three-, and four-electrode combination pair measurements were investigated, including 12–34, 12–45, 12–56, 123–456, 123–567, and 1234–5678. By employing neighboring electrode pairs in the circular design, the method aims to achieve higher sensitivity to localized changes in impedance and mitigate edge effects from heterogeneous regions. This arrangement provides a more concentrated electric field path, enabling finer spatial resolution and improved signal interpretability compared to opposite-electrode measurements.

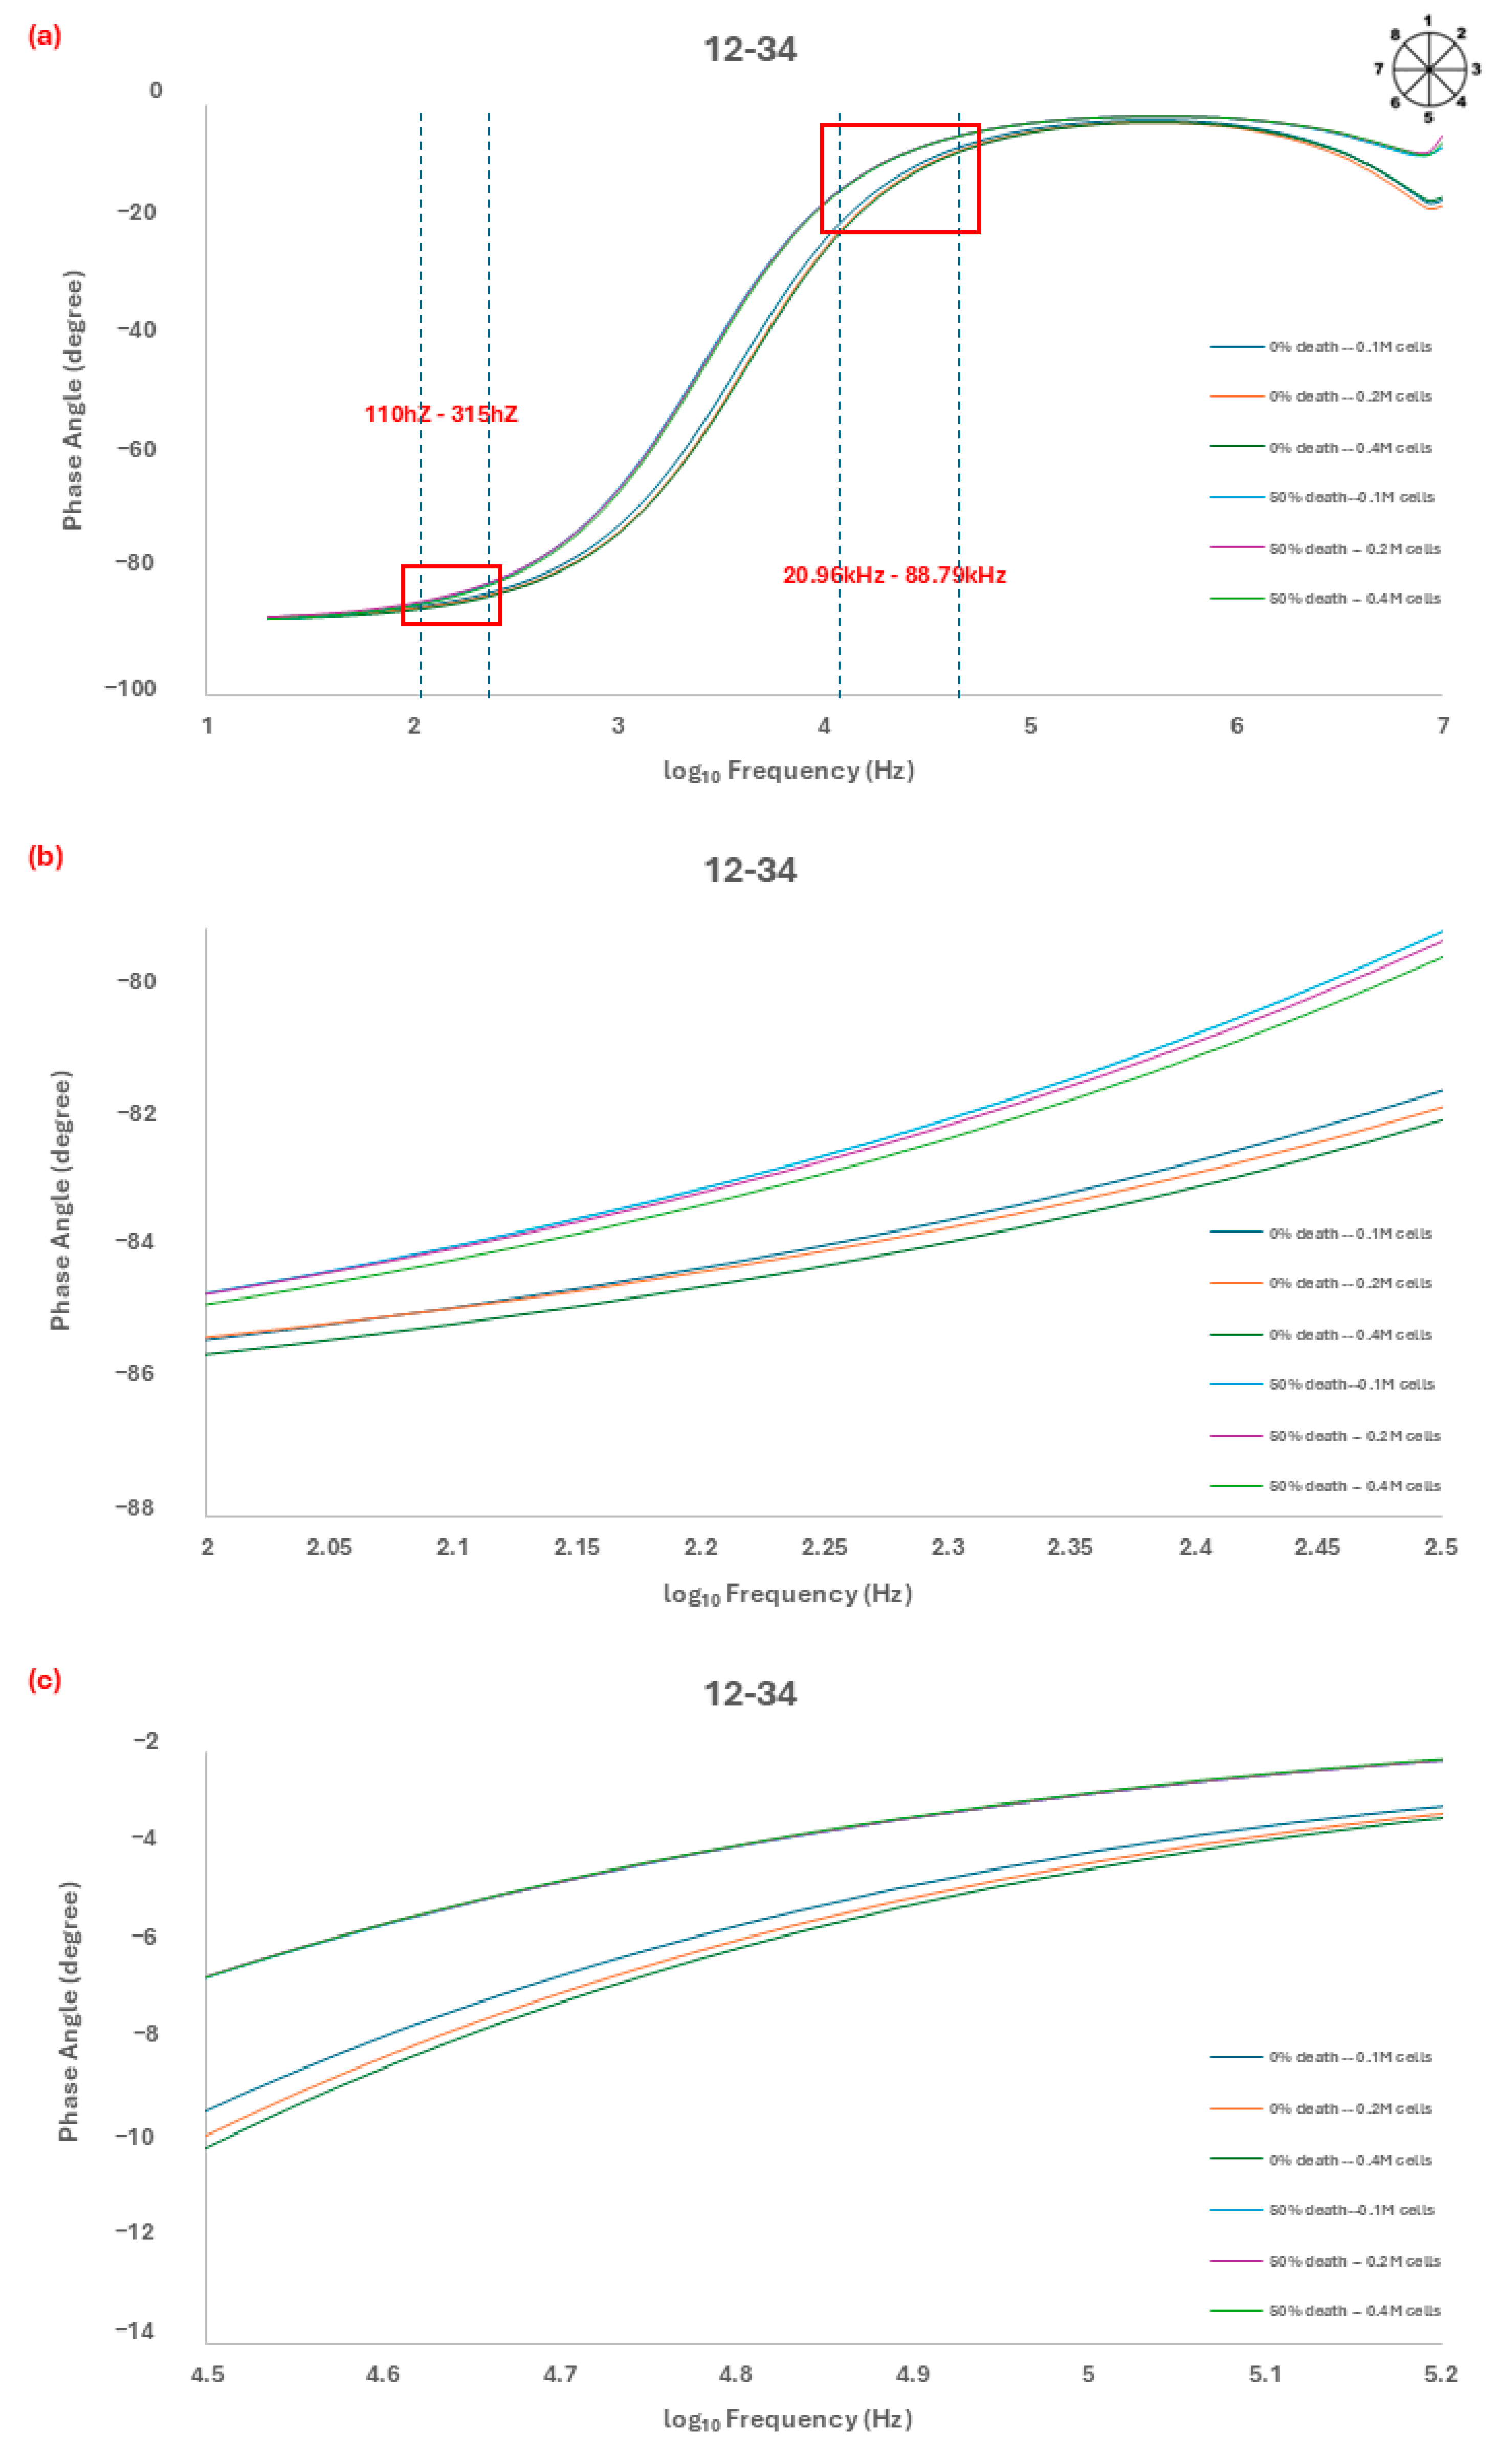
2.3. Phase Angle Measurement

The phase angle measurement was performed using a precision impedance analyzer WK6420 (Figure 1d). After immersing the sensor in the well and setting up the electrode combination, the WK6420 was connected to apply a voltage of 100 mV to the electrodes. It measured the phase angle shift between the input and the output sine wave with the frequency ranging from 20 Hz to 10 MHz. Different numbers 1 × 10⁵ to 4 × 10⁵ of either 0% or 50% death THP-1 cells were used for analysis.

2.4. Cells Cultures

Human peripheral blood monocyte THP-1 cells (ATCC number: TIB-202, American Type Culture Collection, Manassas, WV, USA) were used as target cells. THP-1 cells were cultured according to previous experiments [33] and maintained sterile to avoid irritation to differentiate into macrophages. The cells were cultured in RPMI 1640 (HyClone, Logan, UT, USA) supplemented with 10% fetal bovine serum (HyClone) in a 5% CO2 atmosphere at 37 °C. THP-1 cells are typically in suspension and settle at the bottom of the culture dish without adhering. The medium was changed every three days by carefully removing the upper two-thirds of the medium without disturbing the cells. Subculturing was performed weekly by centrifuging the cells at 700× g to obtain a cell pellet, gently resuspending the pellet, and transferring the cells to a new 6 cm culture dish for subsequent experiments.

2.5. Cell Population Preparation

After the cells were cultured stably, 1 × 10⁵ to 4 × 10⁵ THP-1 cells were carefully collected by using a spatula, and cells were centrifuged at 700× g. The cells were then re-suspended with phosphate-buffered saline (PBS, Gibco™, Thermo Fisher Scientific Inc., Waltham, MA, USA) to create the 0% death group. For the 50% death group, half of the cells were separated into a new Eppendorf tube and subjected to boiling water for 10 min. After the temperature dropped to 25 °C, these cells were combined with the remaining cells [34].

2.6. Portable Phase Angle Measurement Device

The portable device is composed of 5 circuits (Figure S1):
(a) A function generator generates a stable sine wave to change the frequency as desired.
(b) Filters consists of a high-pass filter, which ignores all direct current (DC) signals, and a 60 Hz notch filter that eliminates the 60 Hz powerband noises.
(c) A constant current source injects a current into the sample. It was chosen to make it easier to control the current passing through the sample and ensure safety for the user.
(d) An instrumentation amplifier collects the voltage different signal before and after the injected current has passed through the sample.
(e) An AD8302 gain phase detector compares the signal before and after passing through the sample and provides the phase difference and the gain difference as outputs.
The device was developed to measure phase angles and evaluate cell viability without the need for a sophisticated and expensive precision impedance analyzer.

2.7. Statistical Analysis

Linearity tests were performed for all the measurements to determine the characteristic curves and sensitivity of the method. Additionally, a self-normalization method was employed in this study. This involved calculating a ratio between measurements to eliminate any similarity noises in the sample measurement. This approach ensured that the final ratio output value reflected the input concentration.

3. Results

3.1. Linearity Test of the Measured Samples

Among the multiple electrode combinations that were measured, only the combination of 12–34 probes was able to differentiate between 0% and 50% death cells. The phase angle spectrum (Figure 2) exhibited a sequential change in the phase angle value, which correlated with the cell numbers and viability. As the cell numbers increased from 0.1 × 10⁶ to 0.4 × 10⁶, the phase angle value decreased, and at 0% death, the phase angle value was lower than that at 50% death.
The spectrum was recorded over a frequency range of 20 Hz to 10 MHz, and two specific frequency ranges (110 Hz to 315 Hz and 20.96 kHz to 88.79 kHz) were found to show the highest sensitivity for sensing and identifying the cell viability (Figure 2b,c).

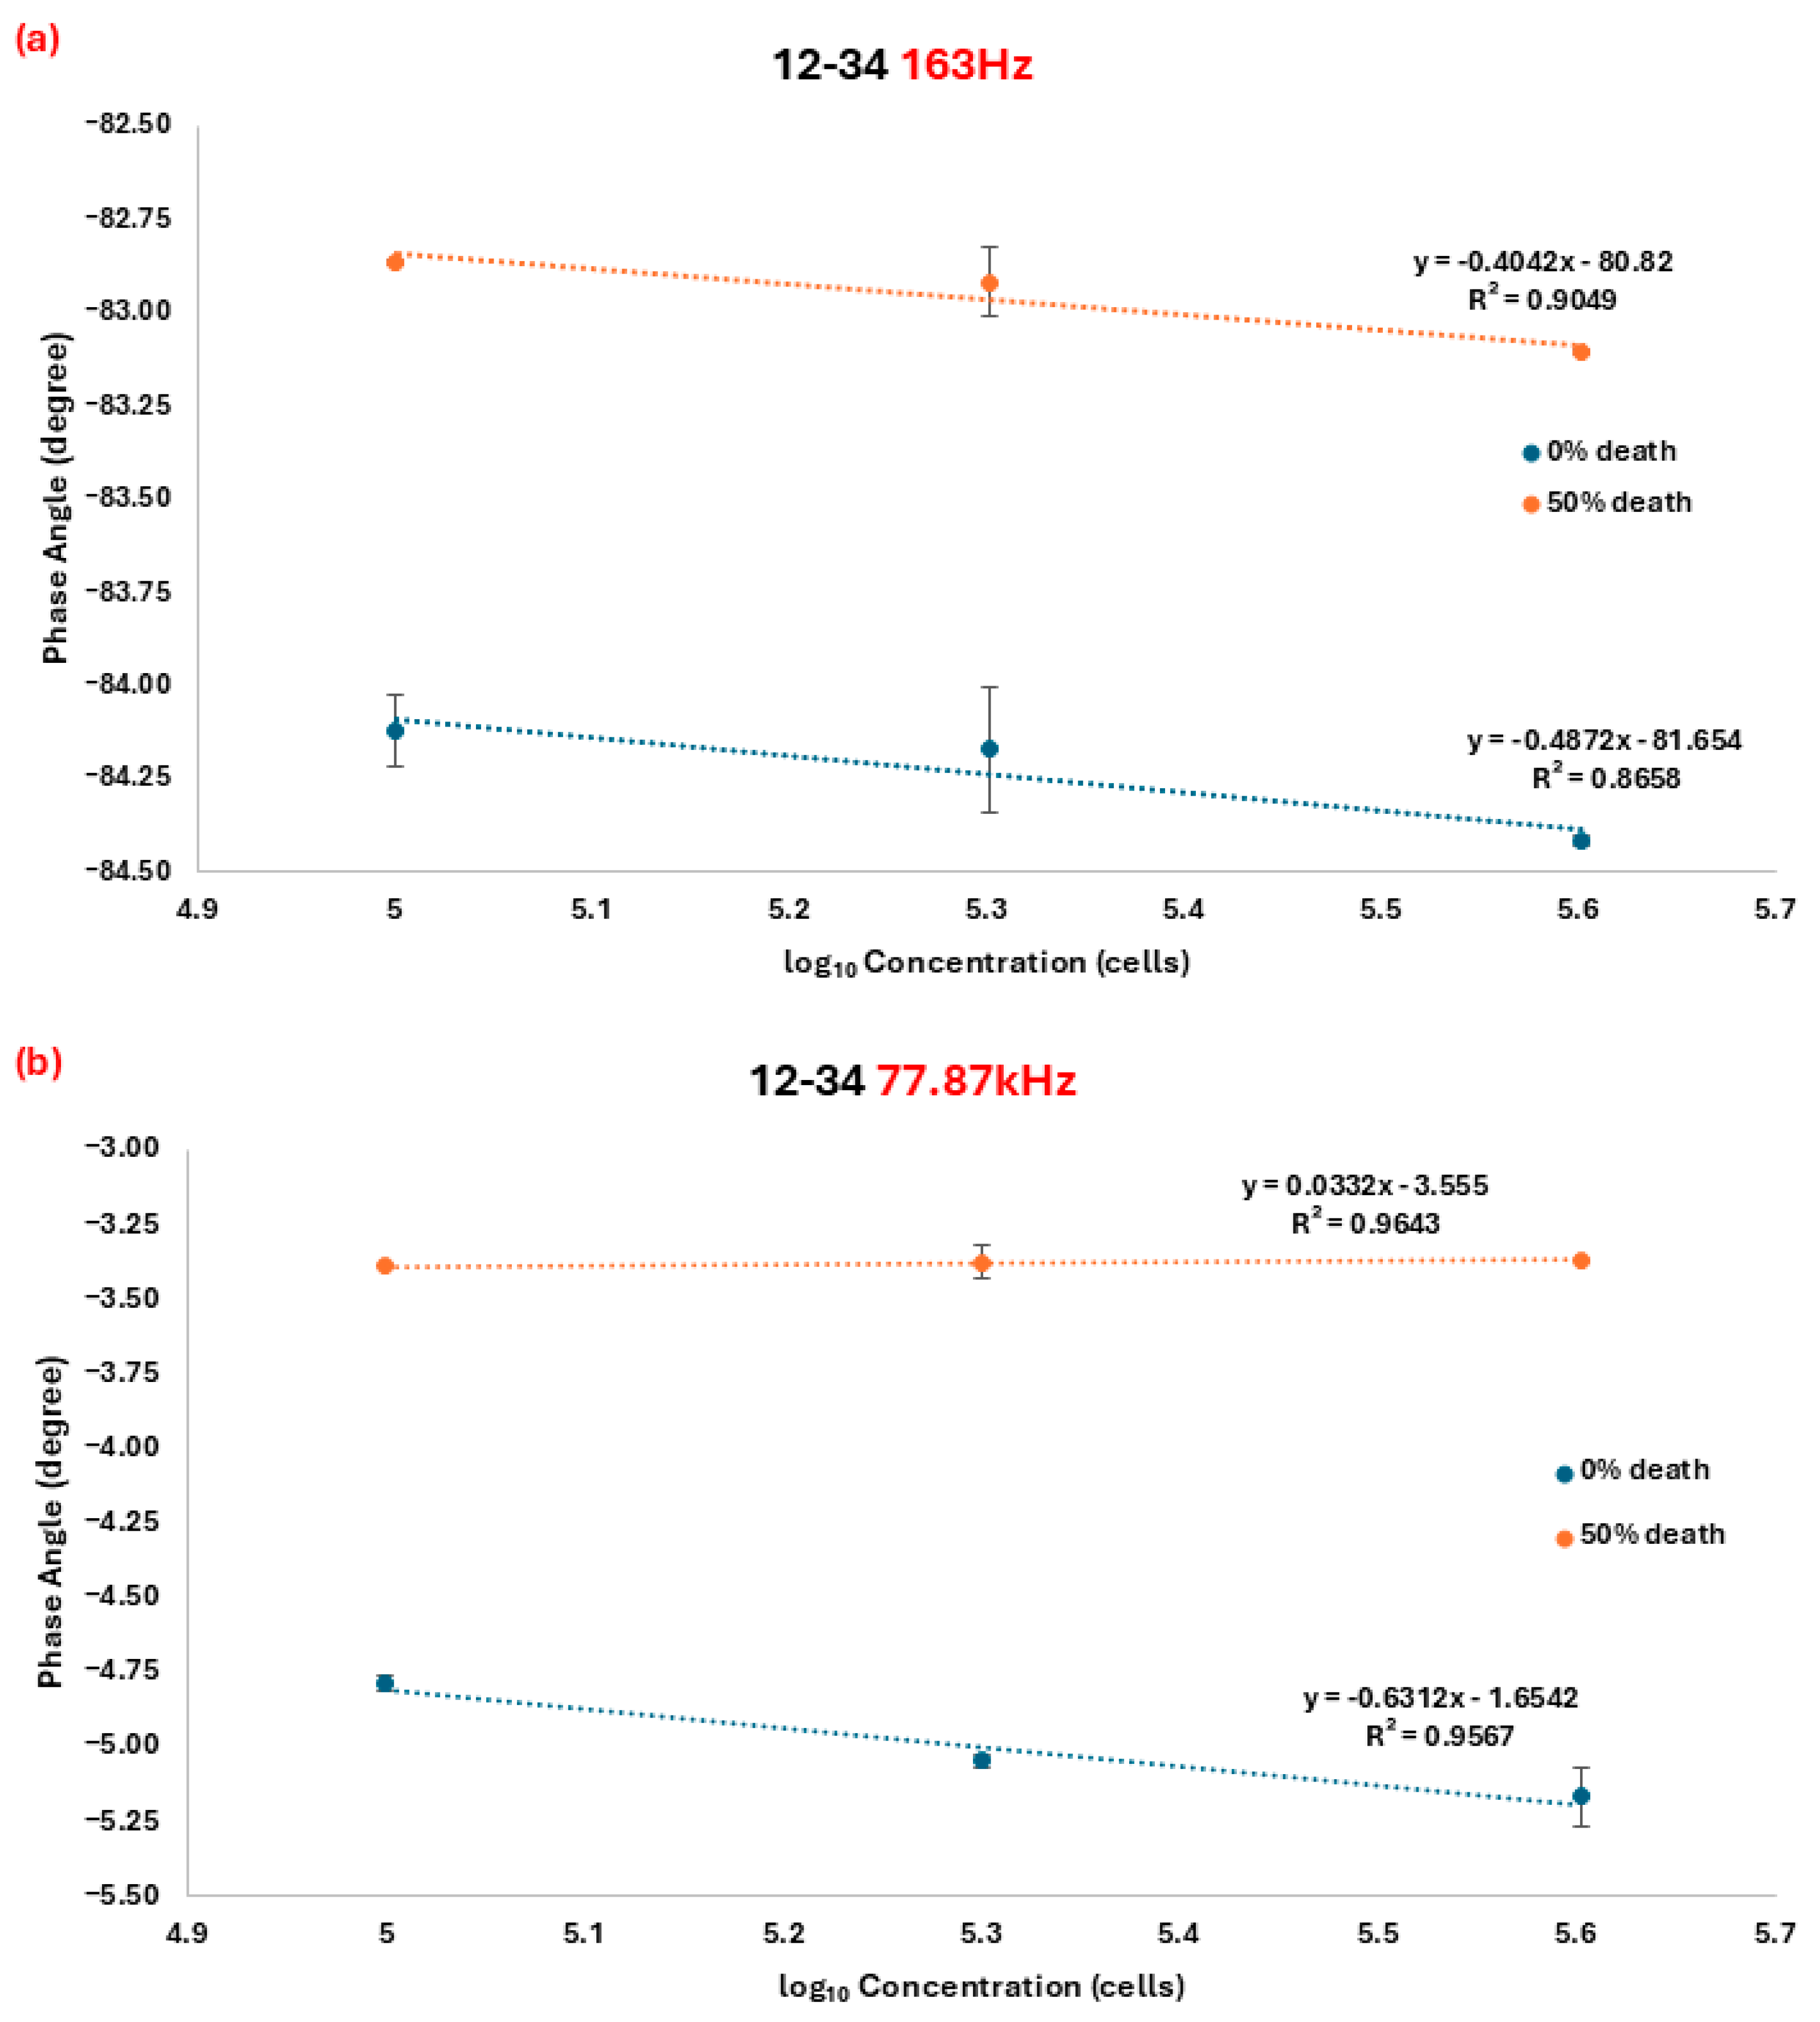
3.2. The Linear Characteristic of the Phase Angle Curve at Frequency 163 Hz

The first specific measurement range, between 110 Hz and 315 Hz (Figure 2b), showed a linear relationship between the phase angle value and the cell numbers across the frequency range. The correlation between the phase angle value and the cell viability demonstrated a high coefficient of determination (R2) greater than 0.85. Notably, the measuring frequency at 163 Hz exhibited the highest sensitivity characteristic, as determined by the slope of the fitting equation (Equation (1)) for 0% death cells and (Equation (2)) for 50% death cells (Figure 3a).
y = −0.4872x − 81.654
y = −0.4042x − 80.82
Y represents the phase angle shift corresponding to cell number x, with R2 values of 0.8658 and 0.9049, respectively. In Figure 3a, significant differences in the phase shift value between 0% and 50% death cells can be observed, indicating that the method can be utilized to distinguish cell viability, with the independent two-tailed t-test p-value between 0% and 50% death at each concentration from 0.1 × 10⁶ to 0.4 × 10⁶ being 0.00002, 0.0003, and 1.6 × 10⁻⁸ (p-value < 0.05), respectively.

3.3. The Linear Characteristic of the Phase Angle Curve at Frequency 77.78 kHz

Another characteristic frequency was found among the second specific measurement frequency range from 20.96 kHz to 88.79 kHz (Figure 2c). The fitting equations for 0% and 50% death cells are as follows (Equations (3) and (4)):
y = −0.6312x − 1.6542
y = 0.0332x − 3.555
where y represents the corresponding phase angle shift to cell number x. The R2 values were 0.9567 and 0.9643, respectively. Based on fitting equations 3 and 4, the lines intersect at approximately x ≈ 3.18, indicating that different cell numbers can be significantly distinguished at a frequency of 77.87 kHz, as low as 1513 cells (103.18 cells) (Figure 3b). Among the measurement range, the independent two-tailed t-test p-value between 0% and 50% death at each concentration from 0.1 × 10⁶ to 0.4 × 10⁶ is 1.2 × 10⁻⁷, 1.2 × 10⁻⁶, and 6.3 × 10⁻⁶ (p-value < 0.05), respectively, which confirmed the significant difference.

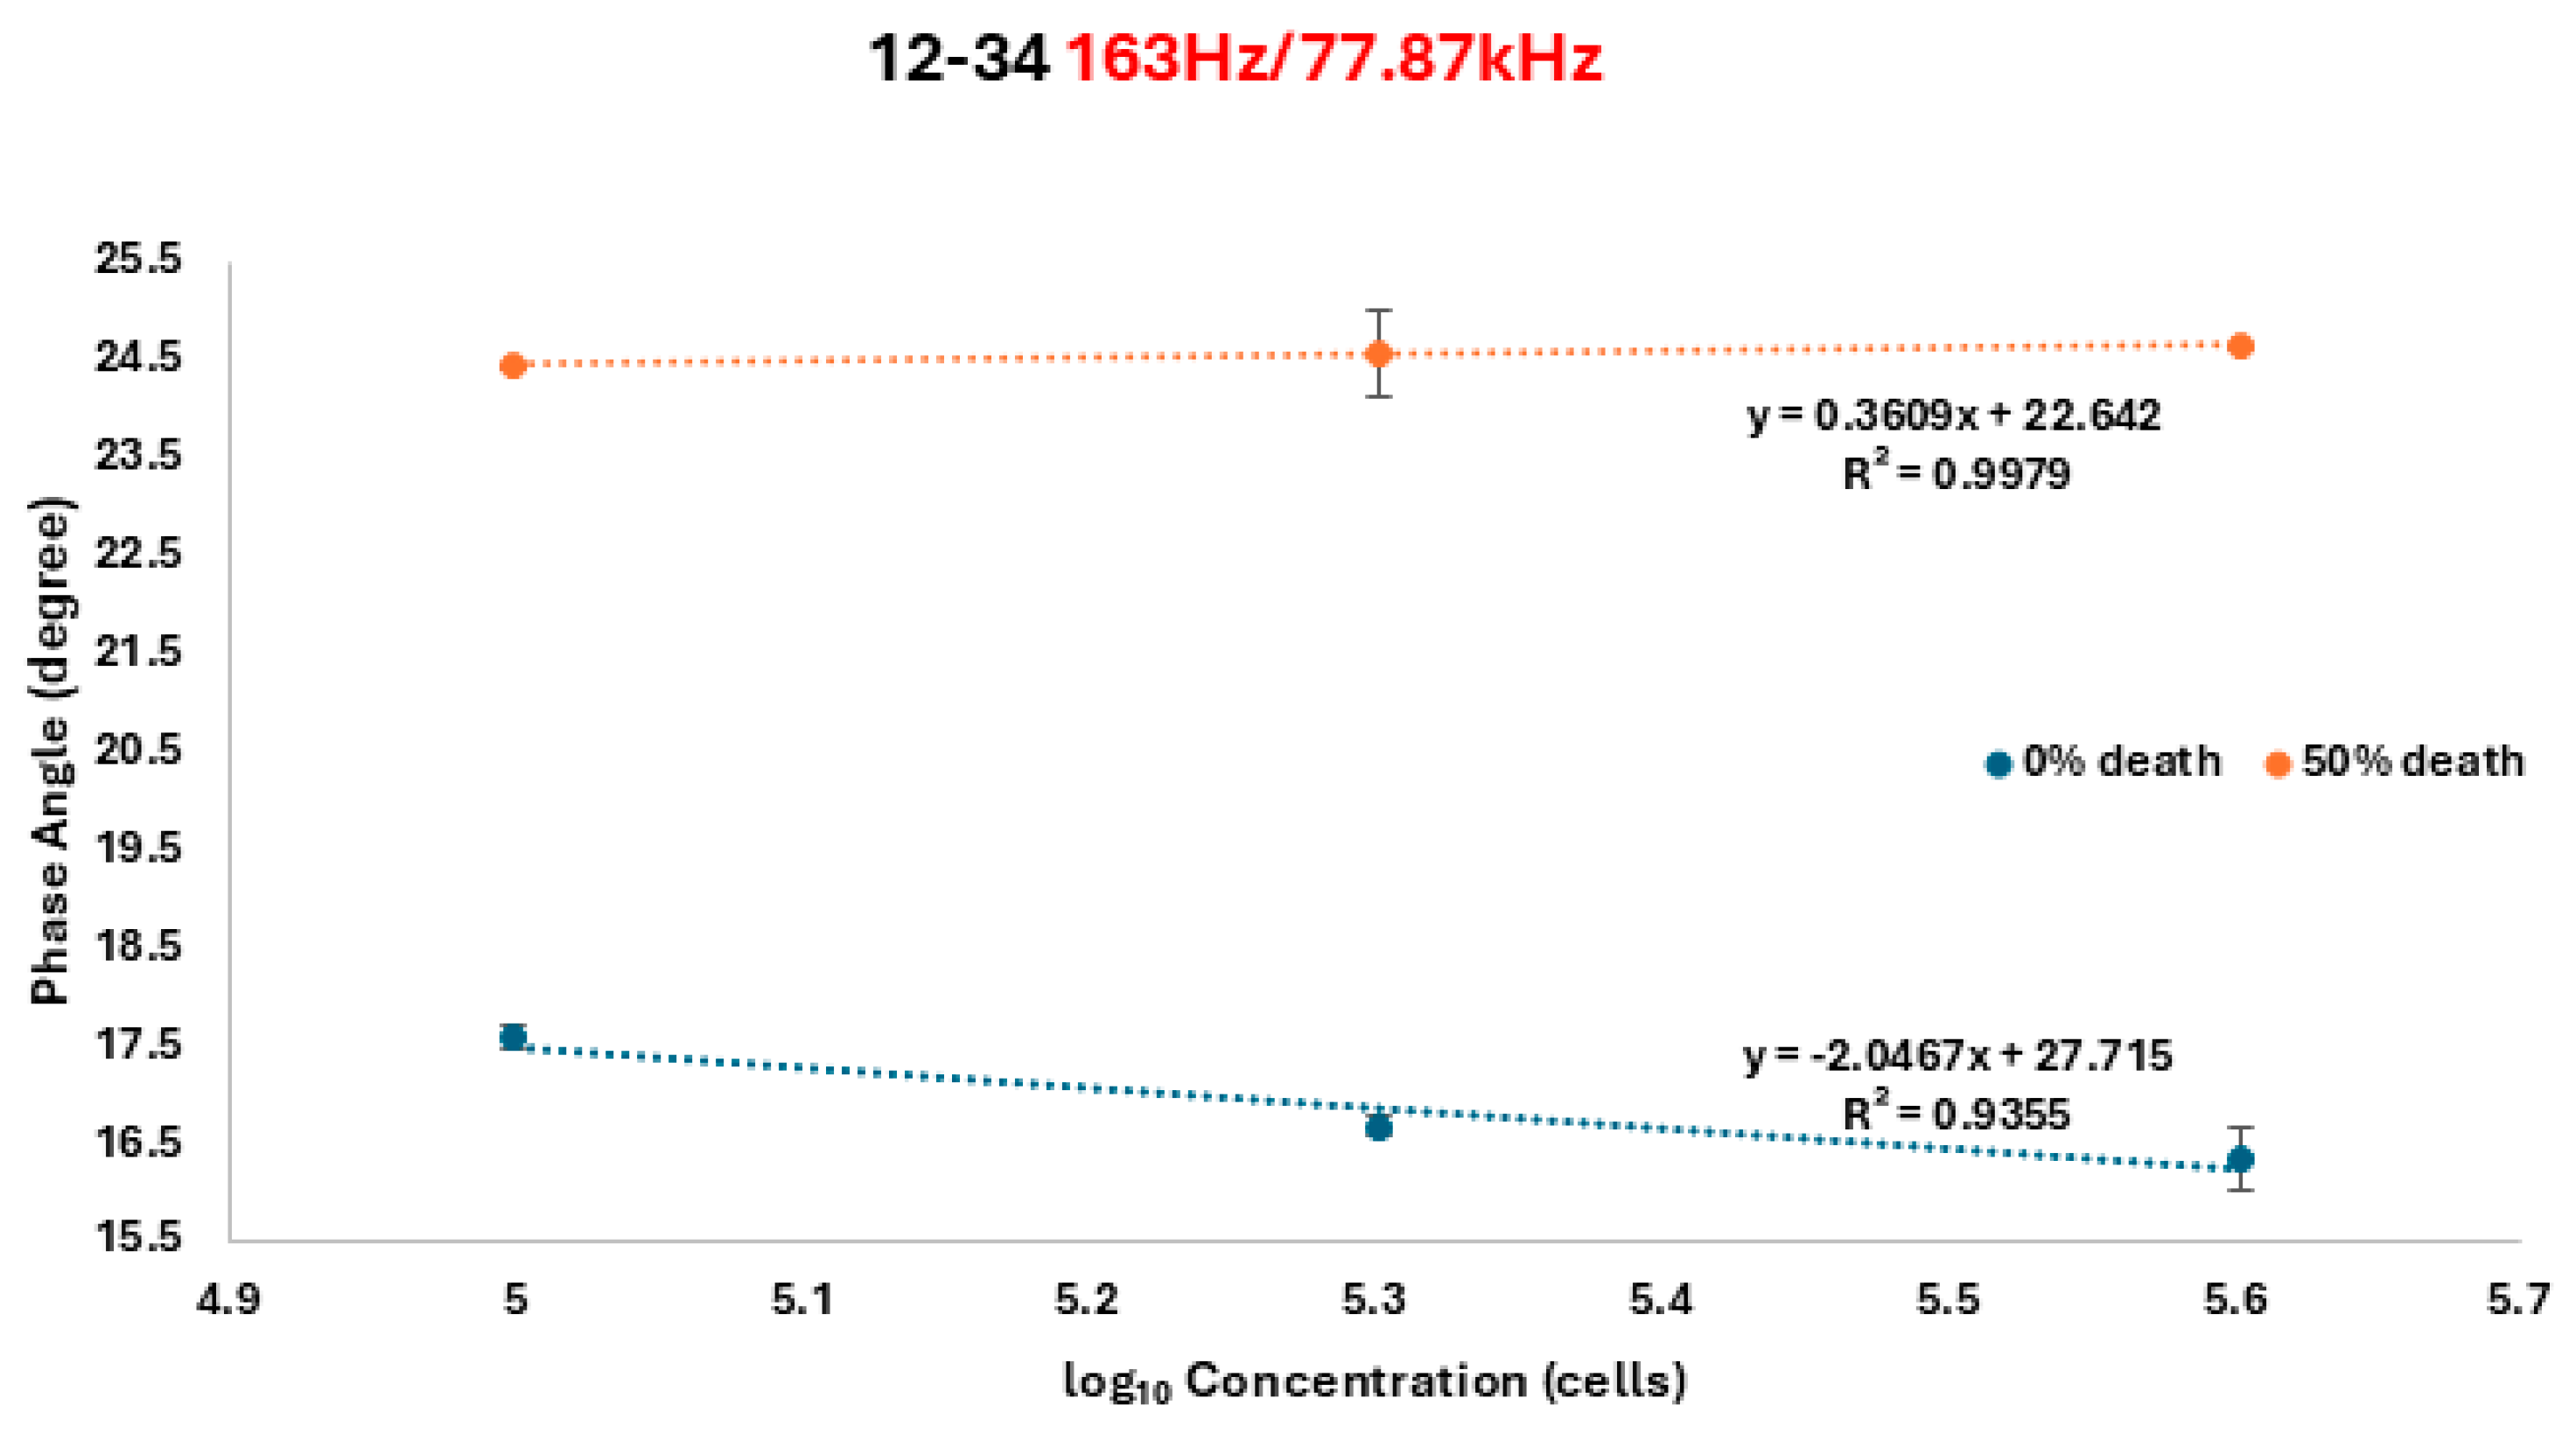
3.4. Self-Normalization Technique

The ratio between phase angle shift measurements at 163 Hz and 77.87 kHz was calculated, and the results are shown in Figure 4. The fitting equations are as follows:
y = −2.0467x + 27.715
y = 0.3609x + 22.642
For 0% death and 50% death cells, respectively, y represents the corresponding phase angle shift for the number of cells, x. The R2 values were 0.9355 for 0%-death-rate cells and 0.9979 for 50%-death-rate cells. The fitting equation indicates that the ratio measurement demonstrates a lower discrimination capability, thus improving the minimum identifiable cell numbers to approximately x ≈ 2.107 (approximately 128 cells). This ratio serves as a double assurance method for the developed biosensor.
An independent two-tailed t-test has also been performed, and the p-value confirmed the significant difference where the p-value between 0% and 50% death at each concentration from 0.1 × 10⁶ to 0.4 × 10⁶ is 7.8 × 10⁻⁸, 7.0 × 10⁻⁶, and 1.3 × 10⁻⁶, respectively.

3.5. Custom Phase Angle Measurement Device

The device was set to work from the range of 110 Hz up to 88 kHz. A constant current of 1 mA was injected into an RC circuit with R = 20 k Ohm and C = 0.1 µF. The AD8302 sensed the phase difference between the input and output signal, then gave out a voltage signal from 0 to 1.8 V, each 10 mV for 1 degree, with the resolution of 1 mV. The resulting measurement was shown in Figure 5. The highest error was found to be 2.30 degrees, which was an acceptable error percentage of approximately 2.7%; thus, it could be applied to the developed biosensor.

4. Discussion

Bioimpedance analysis is a method that involves the passage of low currents through an organism. By assessing the water content and cell membrane characteristics of the organism’s composition, it generates varying impedance values and phase angles for currents of different frequencies [35]. The variation in the phase angle was estimated using different model formulas to detect drug effectiveness in real time with high throughput. An impedance analyzer was utilized to measure the phase angle of cells with various densities and survival rates across frequencies ranging from 20 to 200,000. The specific frequency exhibiting the highest correlation was identified, and a regression curve was generated to examine the relationship between the phase angle change and the survival rates. For this purpose, a PCB board with a switchable circuit was designed. The screen-printed sensor (Figure 1), connected to the PCB board, was placed in a six-well cell culture dish containing suspension cells (THP-1). The circuit was then connected to the impedance analyzer to measure the cells’ phase angles at different current frequencies. Finally, an impedance analysis circuit for this specific frequency was constructed.
In the stage of drug development, the cell survival rate serves as the primary indicator for assessing early drug effects. Previously, chemical methods such as MTT and MTS were commonly employed as detection tools. However, these methods necessitated two to four hours of culturing time [36]. The time-consuming nature of these methods and the inability to reuse cells after testing contributed to the increased costs associated with high-throughput drug screening [37]. Therefore, a low-cost real-time observation system was developed to accelerate drug development. Additionally, this sensor allowed for continuous monitoring of cell conditions during culture, providing insights into drug mechanisms. Moreover, the time-dependent nature of drug analysis could be easily observed, eliminating the need for repeated experiments and reducing experimental variations and costs. Building upon the foundation established by Giaever and Keese [38], intact cells exhibit greater impedance and weaker current due to their hydrophobic properties, while damaged or dead cells show increased current due to compromised cell membranes. Previous studies have utilized impedance values to measure cell cytotoxicity [39]. In the present research work, we developed a measurement method based on changes in impedance values. The different survival states of cells affect the intensity of the current, resulting in a change in the phase angle. The sensor used in this study demonstrated a linear relationship in probe A12B34 at two specific frequencies. We assumed that the positions of A12B34 represent the two nearest probes, where the phase angle changes more noticeably, indicating significant differences in survival rates. Although other electrode pairs, such as 5–6 and 7–8 or 2–3 and 4–5, possess similar identical spatial positioning and relative distances to the pairs 1–2 and 3–4 along the circumference of the well, our experimental results demonstrated that the 1–2/3–4 electrode pair combination (A12B34) provided the most consistent and reliable measurements of cell viability. Several factors may account for this observation. First, minor variations in electrode contact with the inner wall of the well during sensor placement can introduce differences in signal stability, even among geometrically symmetrical electrode pairs. Second, local variations in the distribution of suspended cells and medium within the well may cause differences in the dielectric properties of the measurement environment, resulting in variations in impedance response. Third, electrode pairs positioned at different locations along the circular sensor may experience varying levels of electrical noise or differences in the strength of the detected signal due to subtle inconsistencies in manufacturing or placement.
Based on these considerations and repeated experimental validation, the 1–2 and 3–4 electrode pairs were selected as the optimal configuration for this study. This pair demonstrated the highest sensitivity and linearity at the characteristic frequencies of 163 Hz and 77.87 kHz, enabling accurate differentiation between viable and non-viable cell populations. Further investigations are planned to optimize the performance and reliability of other electrode pair combinations in future studies.
The flexible bioimpedance sensor developed in this study offers several advantages over commercially available impedance-based cell analyzers, such as xCELLigence. Firstly, the sensor uses neighboring electrode pairs arranged in a circular design for dual-frequency phase angle analysis, which enhances sensitivity to localized impedance changes and minimizes edge effects from heterogeneous regions. Additionally, the self-calibration feature compensates for cell density variations, thereby improving overall measurement accuracy. Secondly, unlike xCELLigence, which primarily relies on adherent cells cultured on fixed electrode surfaces, our sensor is specifically designed for real-time monitoring of suspended cells, broadening its application scope. Additionally, our system incorporates a portable phase angle measurement device, reducing instrument costs while improving accessibility. This makes it particularly suitable for resource-limited settings and point-of-care applications. These features position our sensor as a valuable complement to traditional impedance analyzers, with promising applications in high-throughput drug screening and real-time cell viability monitoring.
Data analysis successfully identified a specific frequency band for detecting cell survival rates. Two parallel regression curves were observed when the phase angle was analyzed at frequencies of 163 Hz and 77.87 kHz. This finding suggests that the impedance values are inconsistent with those of living cells after cell death, resulting in a change in the phase angle that can be used to distinguish cell death. Changing the number of cells at a single frequency affects the phase angle value, as shown in Figure 2 and Figure 3. By applying self-correction, we can mitigate the impact of cell condition and impedance values caused by the chemical properties of the treatment drug.
In the present study, THP-1 cells were chosen as the target cells for developing this system due to several factors. Firstly, THP-1 cells are of the suspended cell type [40], making them well-suited for application in microfluidic channels and potential integration with emerging technologies such as organ-on-a-chip, which aim to simulate the flow of cells in the bloodstream. Secondly, in the field of drug development, anti-cancer drugs receive extensive research attention [41] and significant investment, making them a key focus of the investigation. However, anti-cancer drugs are associated with high costs and long development cycles. Furthermore, cancer metastasis poses a significant challenge. Generally, the five-year survival rate for early-stage (first and second phase) cancer can exceed 80%, but for late-stage (fourth phase) cancer, the rate drops to approximately 20%, even with the utilization of expensive immune therapy and targeted therapy drugs [42]. CTCs are a major contributor to cancer metastasis, and the use of suspended cells allows for the study of CTC behavior in subsequent development. Thirdly, THP-1 cells, being monocytes, can differentiate into M1 and M2 macrophages when stimulated by the environment. This system can be used to observe whether the cells undergo differentiation. Fortunately, based on the experimental results, we did not observe differentiation in THP-1 cells, confirming the stability and safety of the system. Lastly, cell therapy and immunotherapy have emerged as promising approaches in recent years. This system serves as an affordable and flexible device for initial drug screening, reducing costs and facilitating future drug development.

5. Conclusions

In this study, a rapid, and adaptable sensor was developed to detect cell mortality using THP-1 suspension cells as the target. The sensor enables self-calibration at two specific frequencies, 163 Hz and 77.78 kHz, and utilizes the corrected phase angle autologous change rate to monitor cell death. In conclusion, this sensor has the potential to reduce costs in the early stages of drug development and find applications in various biomedical engineering fields.

Supplementary Materials

The following supporting information can be downloaded at: https://www.mdpi.com/article/10.3390/chemosensors13040132/s1, Figure S1: The portable device composed of 5 circuits. (a) Function genera-tor (b) Filters (c) Constant (d) Instrumentation Amplifier (e) AD8302 gain phase detector.

Author Contributions

Conceptualization, H.-M.D.W. and C.T.S.C.; methodology, H.-Y.C.; software, T.-L.P.; validation, H.-Y.C. and H.-X.H.; formal analysis, T.-L.P., H.-X.H. and C.T.S.C.; investigation, H.-Y.C. and C.-H.K.; resources, H.-M.D.W. and C.T.S.C.; data curation, T.-L.P.; writing original draft preparation, T.-L.P. and H.-Y.C.; writing—review and editing, H.-M.D.W. and C.T.S.C.; visualization, H.-X.H.; supervision, H.-M.D.W.; project administration, C.T.S.C.; funding acquisition, H.-M.D.W. All authors have read and agreed to the published version of the manuscript.

Funding

This work was supported by the National Science and Technology Council (Taiwan, R.O.C.) under Grant Nos. NSTC 112-2811-E-005-013- MY3. This work was also supported by the National Science and Technology Council Grants (113-2221-E-005-011-; 112-2221-E-005-042-) in Taiwan. This work was carried out with funding support in part by the Ph.D. Program in Tissue Engineering and Regenerative Medicine of National Chung Hsing University and National Health Research Institutes.

Institutional Review Board Statement

Not applicable.

Informed Consent Statement

Not applicable.

Data Availability Statement

Data could be shared upon reasonable request.

Conflicts of Interest

The authors declare no conflicts of interest.

References

  1. Ferlay, J.; Ervik, M.; Lam, F.; Colombet, M.; Mery, L.; Piñeros, M.; Znaor, A.; Soerjomataram, I.; Bray, F. Global Cancer Observatory: Cancer Today; International Agency for Research on Cancer: Lyon, France, 2018. [Google Scholar]
  2. World Health Organization. WHO Report on Cancer: Setting Priorities, Investing Wisely and Providing Care for All; WHO: Geneva, Switzerland, 2020. [Google Scholar]
  3. Bray, F.; Ferlay, J.; Soerjomataram, I.; Siegel, R.L.; Torre, L.A.; Jemal, A. Global cancer statistics 2018: GLOBOCAN estimates of incidence and mortality worldwide for 36 cancers in 185 countries. CA A Cancer J. Clin. 2018, 68, 394–424. [Google Scholar] [CrossRef] [PubMed]
  4. Chi, C.-W.; Ahmed, A.R.; Dereli-Korkut, Z.; Wang, S. Microfluidic cell chips for high-throughput drug screening. Bioanalysis 2016, 8, 921–937. [Google Scholar] [CrossRef] [PubMed]
  5. Shinn, P.; Chen, L.; Ferrer, M.; Itkin, Z.; Klumpp-Thomas, C.; McKnight, C.; Michael, S.; Mierzwa, T.; Thomas, C.; Wilson, K. High-throughput screening for drug combinations. In Bioinformatics and Drug Discovery; Humana Press: New York, NY, USA, 2019; pp. 11–35. [Google Scholar]
  6. Prasad, V.; Mailankody, S. Research and development spending to bring a single cancer drug to market and revenues after approval. JAMA Intern. Med. 2017, 177, 1569–1575. [Google Scholar] [CrossRef] [PubMed]
  7. Dewan, B.; Chaudhary, S.; Singh, D.; Yadav, M. Label-free detection of breast cancer cell lines using dopingless heterojunction TFET considering non-ideal hybridization issue. Mater. Sci. Eng. B 2024, 302, 117192. [Google Scholar] [CrossRef]
  8. Singh, T.A.; Sadhukhan, P.; Ghosh, N.; Thakur, N.; Sharma, A.; Tejwan, N.; Pabbathi, A.; Das, J.; Sil, P.C. Targeted delivery of rutin into breast cancer cells via using phenylboronic acid functionalized MgO nanoparticles. Mater. Sci. Eng. B 2023, 296, 116623. [Google Scholar] [CrossRef]
  9. Rubinstein, W.S.; Patriotis, C.; Dickherber, A.; Han, P.K.; Katki, H.A.; LeeVan, E.; Minasian, L.M. Cancer screening with multicancer detection tests: A translational science review. CA A Cancer J. Clin. 2024, 74, 368–382. [Google Scholar] [CrossRef]
  10. Wu, K.-J.; Ho, S.-H.; Dong, J.-Y.; Fu, L.; Wang, S.-P.; Liu, H.; Wu, C.; Leung, C.-H.; Wang, H.-M.D.; Ma, D.-L. Aliphatic group-tethered iridium complex as a theranostic agent against malignant melanoma metastasis. ACS Appl. Bio Mater. 2020, 3, 2017–2027. [Google Scholar] [CrossRef]
  11. Sanginario, A.; Miccoli, B.; Demarchi, D. Carbon Nanotubes as an Effective Opportunity for Cancer Diagnosis and Treatment. Biosensors 2017, 7, 9. [Google Scholar] [CrossRef]
  12. Mdlovu, N.V.; Lin, K.-S.; Chen, Y.; Juang, R.-S.; Chang, T.-W.; Mdlovu, N.B. Formulation and characterization of multifunctional polymer modified-iron oxide magnetic nanocarrier for doxorubicin delivery. J. Taiwan. Inst. Chem. Eng. 2019, 104, 260–272. [Google Scholar] [CrossRef]
  13. Ching, C.T.S.; Sun, T.P.; Huang, S.H.; Shieh, H.L.; Chen, C.Y. A Mediated Glucose Biosensor Incorporated with Reverse Iontophoresis Function for Noninvasive Glucose Monitoring. Ann. Biomed. Eng. 2010, 38, 1548–1555. [Google Scholar] [CrossRef]
  14. Yuan, R.Y.K.; Hou, Y.; Sun, W.; Yu, J.; Liu, X.; Niu, Y.N.; Lu, J.J.; Chen, X.P. Natural products to prevent drug resistance in cancer chemotherapy: A review. Ann. N. Y. Acad. Sci. 2017, 1401, 19–27. [Google Scholar] [CrossRef] [PubMed]
  15. Velusamy, P.; Srinivasa, C.M.; Kumar, G.V.; Qurishi, Y.; Su, C.H.; Gopinath, S.C.B. A pH stimuli thiol modified mesoporous silica nanoparticles: Doxorubicin carrier for cancer therapy. J. Taiwan Inst. Chem. Eng. 2018, 87, 264–271. [Google Scholar] [CrossRef]
  16. Dong, X.L.; Bai, X.P.; Ni, J.; Zhang, H.; Duan, W.; Graham, P.; Li, Y. Exosomes and breast cancer drug resistance. Cell Death Dis. 2020, 11, 987. [Google Scholar] [CrossRef] [PubMed]
  17. Ghobashy, M.M.; Alkhursani, S.A.; Alqahtani, H.A.; El-damhougy, T.K.; Madani, M. Gold nanoparticles in microelectronics advancements and biomedical applications. Mater. Sci. Eng. B 2024, 301, 117191. [Google Scholar] [CrossRef]
  18. Paoletti, C.; Hayes, D.F. Circulating tumor cells. Nov. Biomark. Contin. Breast Cancer 2016, 882, 235–258. [Google Scholar]
  19. Peinado, H.; Aleckovic, M.; Lavotshkin, S.; Matei, I.; Costa-Silva, B.; Moreno-Bueno, G.; Hergueta-Redondo, M.; Williams, C.; García-Santos, G.; Ghajar, C.M.; et al. Melanoma exosomes educate bone marrow progenitor cells toward a pro-metastatic phenotype through MET. Nat. Med. 2012, 18, 883. [Google Scholar] [CrossRef]
  20. Gowda, R.; Robertson, B.M.; Iyer, S.; Barry, J.; Dinavahi, S.S.; Robertson, G.P. The role of exosomes in metastasis and progression of melanoma. Cancer Treat. Rev. 2020, 85, 101975. [Google Scholar] [CrossRef]
  21. Du, Y.; Yu, D.-G.; Yi, T. Electrospun nanofibers as chemosensors for detecting environmental pollutants: A review. Chemosensors 2023, 11, 208. [Google Scholar] [CrossRef]
  22. Altzis, D.; Tsiasioti, A.; Zacharis, C.K.; Tzanavaras, P.D. Speciation of iron using desferal via simple pH change and a single calibration curve: High-throughput optical sensor based on 96-well plates and an overhead book scanner as detector. Chemosensors 2023, 11, 577. [Google Scholar] [CrossRef]
  23. Ma, Y.; Hou, M.; Yang, L.; Gao, J.; Zhang, G.; Guo, R.; Guo, S. Combinatorial Material Strategy: Parallel Synthesis and High-Throughput Screening of WO3 Nanoplates Decorated with Noble Metals for VOCs Sensor. Chemosensors 2023, 11, 239. [Google Scholar] [CrossRef]
  24. Gonçalves, J.M.; Gonçalves, J.N.; Sousa, L.F.; Rodrigues, L.R.; Correia-de-Sá, P.; Coutinho, P.J.; Castanheira, E.M.; Oliveira, R.; Dias, A.M. 2, 4, 5-Triaminopyrimidines as blue fluorescent probes for cell viability monitoring: Synthesis, photophysical properties, and microscopy applications. Org. Biomol. Chem. 2024, 22, 2252–2263. [Google Scholar] [PubMed]
  25. Ching, C.T.S.; Wang, C.-K.; Tang, P.-C.; Ha, M.-K.; Li, C.; Chiu, H.-N.; Yao, F.Y.-D.; Nhan, N.C.; Hieu, N.V.; Phan, T.-L. Bioimpedance-Measurement-Based Non-Invasive Method for In Ovo Chicken Egg Sexing. Biosensors 2023, 13, 440. [Google Scholar] [CrossRef]
  26. Phan, T.L.; Van Hieu, N.; Li, T.S.; Tsao, K.; Ching CT, S. Noninvasive and real-time in vivo characterization of Inflammation skin. A feasibility of animal study. Skin Res. Technol. 2021, 27, 846–853. [Google Scholar] [CrossRef] [PubMed]
  27. Ching, C.T.S.; Lee, P.-Y.; Van Hieu, N.; Chou, H.-H.; Yao, F.Y.-D.; Cheng, S.-Y.; Lin, Y.-K.; Phan, T.L. Real-time, Economical Identification of Microplastics Using Impedance-based Interdigital Array Microelectrodes and k-Nearest Neighbor Model. Biotechnol. Bioprocess. Eng. 2023, 28, 459–466. [Google Scholar] [CrossRef]
  28. Liu, S.; Pang, H.; Wang, C.; Wang, Z.; Wang, M.; Zhang, Y.; Zhang, W.; Sui, Z. Rapid and accurate quantification of viable Bifidobacterium cells in milk powder with a propidium monoazide-antibiotic fluorescence in situ hybridization-flow cytometry method. J. Dairy Sci. 2024, 107, 7678–7690. [Google Scholar] [CrossRef]
  29. Kieninger, J.; Tamari, Y.; Enderle, B.; Jobst, G.; Sandvik, J.A.; Pettersen, E.O.; Urban, G.A. Sensor Access to the Cellular Microenvironment Using the Sensing Cell Culture Flask. Biosensors 2018, 8, 44. [Google Scholar] [CrossRef]
  30. Fernandez, R.E.; Lebiga, E.; Koklu, A.; Sabuncu, A.C.; Beskok, A. Flexible Bioimpedance Sensor for Label-Free Detection of Cell Viability and Biomass. IEEE Trans. Nanobiosci. 2015, 14, 700–706. [Google Scholar] [CrossRef]
  31. Ayala-Mendivil, N.; Calixto-Romo, M.D.; Amaya-Delgado, L.; Casas-Godoy, L.; Sandoval, G. High Throughput Screening: Developed Techniques for Cellulolytic and Xylanolytic Activities Assay. Comb. Chem. High. Throughput Scr. 2016, 19, 627–635. [Google Scholar] [CrossRef]
  32. Li, X.; Feng, H.; Li, Z.; Shi, Y.; Tian, J.; Zhao, C.; Yu, M.; Liu, Z.; Li, H.; Shi, B.; et al. High-Throughput Identification and Screening of Single Microbial Cells by Nanobowl Array. ACS Appl. Mater. Interfaces 2019, 11, 44933–44940. [Google Scholar] [CrossRef]
  33. Lee, C.-C.; Chen, Y.-T.; Chiu, C.-C.; Liao, W.-T.; Liu, Y.-C.; Wang, H.-M.D. Polygonum cuspidatum extracts as bioactive antioxidaion, anti-tyrosinase, immune stimulation and anticancer agents. J. Biosci. Bioeng. 2015, 119, 464–469. [Google Scholar]
  34. Ledwith, R.; Stobernack, T.; Bergert, A.; Bahl, A.; Pink, M.; Haase, A.; Dumit, V.I. Towards characterization of cell culture conditions for reliable proteomic analysis: In vitro studies on A549, differentiated THP-1, and NR8383 cell lines. Arch. Toxicol. 2024, 98, 4021–4031. [Google Scholar] [CrossRef] [PubMed]
  35. Ching, C.T.S.; Chen, Y.C.; Lu, L.H.; Hsieh, P.F.; Hsiao, C.S.; Sun, T.P.; Shieh, H.L.; Chang, K.M. Characterization of the Muscle Electrical Properties in Low Back Pain Patients by Electrical Impedance Myography. PLoS ONE 2013, 8, e61639. [Google Scholar] [CrossRef] [PubMed]
  36. Hosseininasab, S.S.; Naderifar, M.; Akbarizadeh, M.R.; Hashemi, N.; Ghaderi, M.; Pajavand, H.; Satarzadeh, N.; Dousari, A.S. Synthesized arsenic nanoparticles and their high potential in biomedical applications: A review. Biotechnol. Bioeng. 2024, 121, 2050–2056. [Google Scholar] [CrossRef] [PubMed]
  37. Giacomotto, J.; Ségalat, L. High-throughput screening and small animal models, where are we? Br. J. Pharmacol. 2010, 160, 204–216. [Google Scholar] [CrossRef]
  38. Giaever, I.; Keese, C.R. Monitoring fibroblast behavior in tissue culture with an applied electric field. Proc. Natl. Acad. Sci. USA 1984, 81, 3761–3764. [Google Scholar] [CrossRef]
  39. Caviglia, C.; Zór, K.; Canepa, S.; Carminati, M.; Larsen, L.B.; Raiteri, R.; Andresen, T.L.; Heiskanen, A.; Emnéus, J. Interdependence of initial cell density, drug concentration and exposure time revealed by real-time impedance spectroscopic cytotoxicity assay. Analyst 2015, 140, 3623–3629. [Google Scholar] [CrossRef]
  40. Cheng, B.; Chen, H.C.; Chou, I.W.; Tang, T.W.H.; Hsieh, P.C.H. Harnessing the early post-injury inflammatory responses for cardiac regeneration. J. Biomed. Sci. 2017, 24, 7. [Google Scholar] [CrossRef]
  41. Alemayehu, D.; Emir, B.; Gaffney, M. Interface Between Regulation and Statistics in Drug Development; CRC Press: Boca Raton, FL, USA, 2020. [Google Scholar]
  42. Galle, P.; Finn, R.S.; Mitchell, C.R.; Ndirangu, K.; Ramji, Z.; Redhead, G.S.; Pinato, D.J. Treatment-emergent antidrug antibodies related to PD-1, PD-L1, or CTLA-4 inhibitors across tumor types: A systematic review. J. Immunother. Cancer 2024, 12, e008266. [Google Scholar] [CrossRef]
Figure 1. Preparation of flexible cell viability sensor: (a1a4) Top views. (a1) PET thin film. (a2) Screen-printing of the silver layer. (a3) Screen-printing of the gold layer. (a4) Screen-printing of the epoxy layer. (b) Side view. (c) Electrode pair. (d1) The probe was bent and placed inside a 6-well hole with a circumference of 10 cm, forming a circular shape along the inner wall, which resulted in the (d2) sensing point arrangement.
Chemosensors 13 00132 g001
Figure 2. (a) Analysis by probe 12–34 showed a change in the phase angle at different numbers of cells (0% death and 50% death), and we observed the most regular changes at 110 Hz~315 Hz and 20.86 kHz~88.79 kHz. The linear characteristic of the phase angle curve at a frequency of (b) 163 Hz and (c) 77.78 kHz. The linear characteristic refers to the phase angle variations analyzed using dashed trend lines at 163 Hz and 77.78 kHz. The intersections of these trend lines exhibit a linear relationship, enabling differentiation between cell conditions. This approach ensures that the phase angle shift consistently correlates with cell mortality and density, validating the dual-frequency measurement method.
Chemosensors 13 00132 g002
Figure 3. Regression curve of the phase angle and the number of cells in the 0% and 50% cell death group at a frequency of (a) 163 Hz and (b) 77.78 kHz. All measurements were performed in triplicate to ensure reliability and reproducibility. Data points represent the mean values.
Chemosensors 13 00132 g003
Figure 4. Self-calibrated situation after we divided the phase angles at frequencies 163 Hz and 77.78 kHz by using an A12B34 probe. All measurements were performed in triplicate to ensure reliability and reproducibility. Data points represent the mean values.
Chemosensors 13 00132 g004
Figure 5. Phase shift measurement with the developed device.
Chemosensors 13 00132 g005
Disclaimer/Publisher’s Note: The statements, opinions and data contained in all publications are solely those of the individual author(s) and contributor(s) and not of MDPI and/or the editor(s). MDPI and/or the editor(s) disclaim responsibility for any injury to people or property resulting from any ideas, methods, instructions or products referred to in the content.

