Abstract
This paper presents a low-cost wireless prototype designed for point-of-care DNA sensing based on square wave voltammetry (SWV) measurements. Unlike other designs found in the literature, this prototype employs dedicated ADC and DAC components to reduce noise and allows for lower voltage steps in SWV scans. On-board signal processing makes the device suitable for use by inexperienced end-users. The prototype transmits data via Bluetooth Low-Energy (BLE) to a mobile app, which records the measurements on a cloud platform. The prototype was employed to detect a 23-base single-stranded DNA (ssDNA) sequence, within the range of 1 nM to 10 nM. The results obtained with the prototype showed good agreement when compared to a commercial electrochemical analyzer. This study demonstrates the feasibility of using such a device for DNA sensing, highlighting its potential for broader biosensing applications.
1. Introduction
Square wave voltammetry (SWV) is one of the fastest and most sensitive pulse voltammetric techniques. Unlike cyclic voltammetry (CV), SWV is able to easily distinguish between capacitive and Faradic currents [1], making it particularly attractive for electroanalytical applications. Biosensors based on SWV have been used for clinical diagnosis, environmental monitoring, and food safety assessment. The high sensitivity and selectivity achieved by biosensors based on SWV measurements allow the detection of tiny concentrations of biomarkers of certain diseases and pathogens. Some examples of applications include enzymatic studies [2], dopamine detection [3], C-reactive protein detection [4], and the detection of sulfonamide compounds [5], among others.
In modern societies, there is a progressive aging of the population and an increase in people with chronic diseases that require follow-up care. In this context, home health care is becoming increasingly relevant. In recent years, wireless sensors and smart wearables for point-of-care testing (PoCT) have attracted significant interest [6,7]. Developing low-cost, wireless-connected sensors capable of quantitatively measuring biomarkers is essential. To this end, electrochemical sensors based on low-cost potentiostats, assisted by microcontrollers and Bluetooth or NFC connectivity with smartphones, have been developed [8,9]. However, SWV is often not included among the electrochemical techniques that support these low-cost PoCT devices.
As a proof of concept, in this paper a low-cost device enabling SWV measurements has been designed and integrated within an electrochemical deoxyribonucleic acid (DNA) sensing system. The developed prototype can be controlled via USB from a PC or wirelessly via Bluetooth from a mobile app. This reduces the number of electronic components, such as displays or keyboards, and therefore the cost of the device, improving ease of use. Additionally, the device is well-suited for future PoCT applications.
Electrochemical DNA sensors have gained significant attention due to their sensitivity, selectivity, and ability to provide rapid and reliable quantification of specific DNA sequences [10]. These biosensors utilize the unique properties of electrochemical transduction to convert DNA hybridization events into measurable electrical signals [11]. The approach here used is based on utilizing redox-labelled (commonly methylene blue or ferrocene) oligonucleotides, complementary to the target DNA sequence, as a capture probe, immobilized onto an interrogating electrode. Signalling in this class of biosensors is generally driven by the changes in the redox label position that occurs during the hybridization between the capture probe and the target sequence [12]. This position shift alters the efficiency of the electron transfer between the covalently attached redox label and the interrogating electrode, which is typically monitored using SWV. This sensing approach is versatile, capable of quantifying not only DNA sequences but also microRNAs (miRNAs), a class of small, non-coding RNA molecules that play a critical role in the regulation of gene expression and are emerging as important biomarkers for various diagnostic applications [13]. The integration of the DNA sensor with a low-cost measurement device further enhances the accessibility and practicality of this technology, making it especially valuable for resource-limited settings.
This study demonstrates the feasibility of using this device as a proof-of-concept through the detection of a 23-base DNA sequence equivalent to the RNA sequence of miRNA-29c, underscoring its potential for broader DNA and miRNA sensing applications [14].
Square Wave Voltammetry Principles
Square wave voltammetry, together with normal and differential pulse voltammetry, is an electrochemical technique specifically used to reduce the capacitive background current of the working electrode [15,16,17]. Simultaneously, it aims to optimize the signal-to-noise ratio of the Faradic currents associated with oxidation and reduction processes.
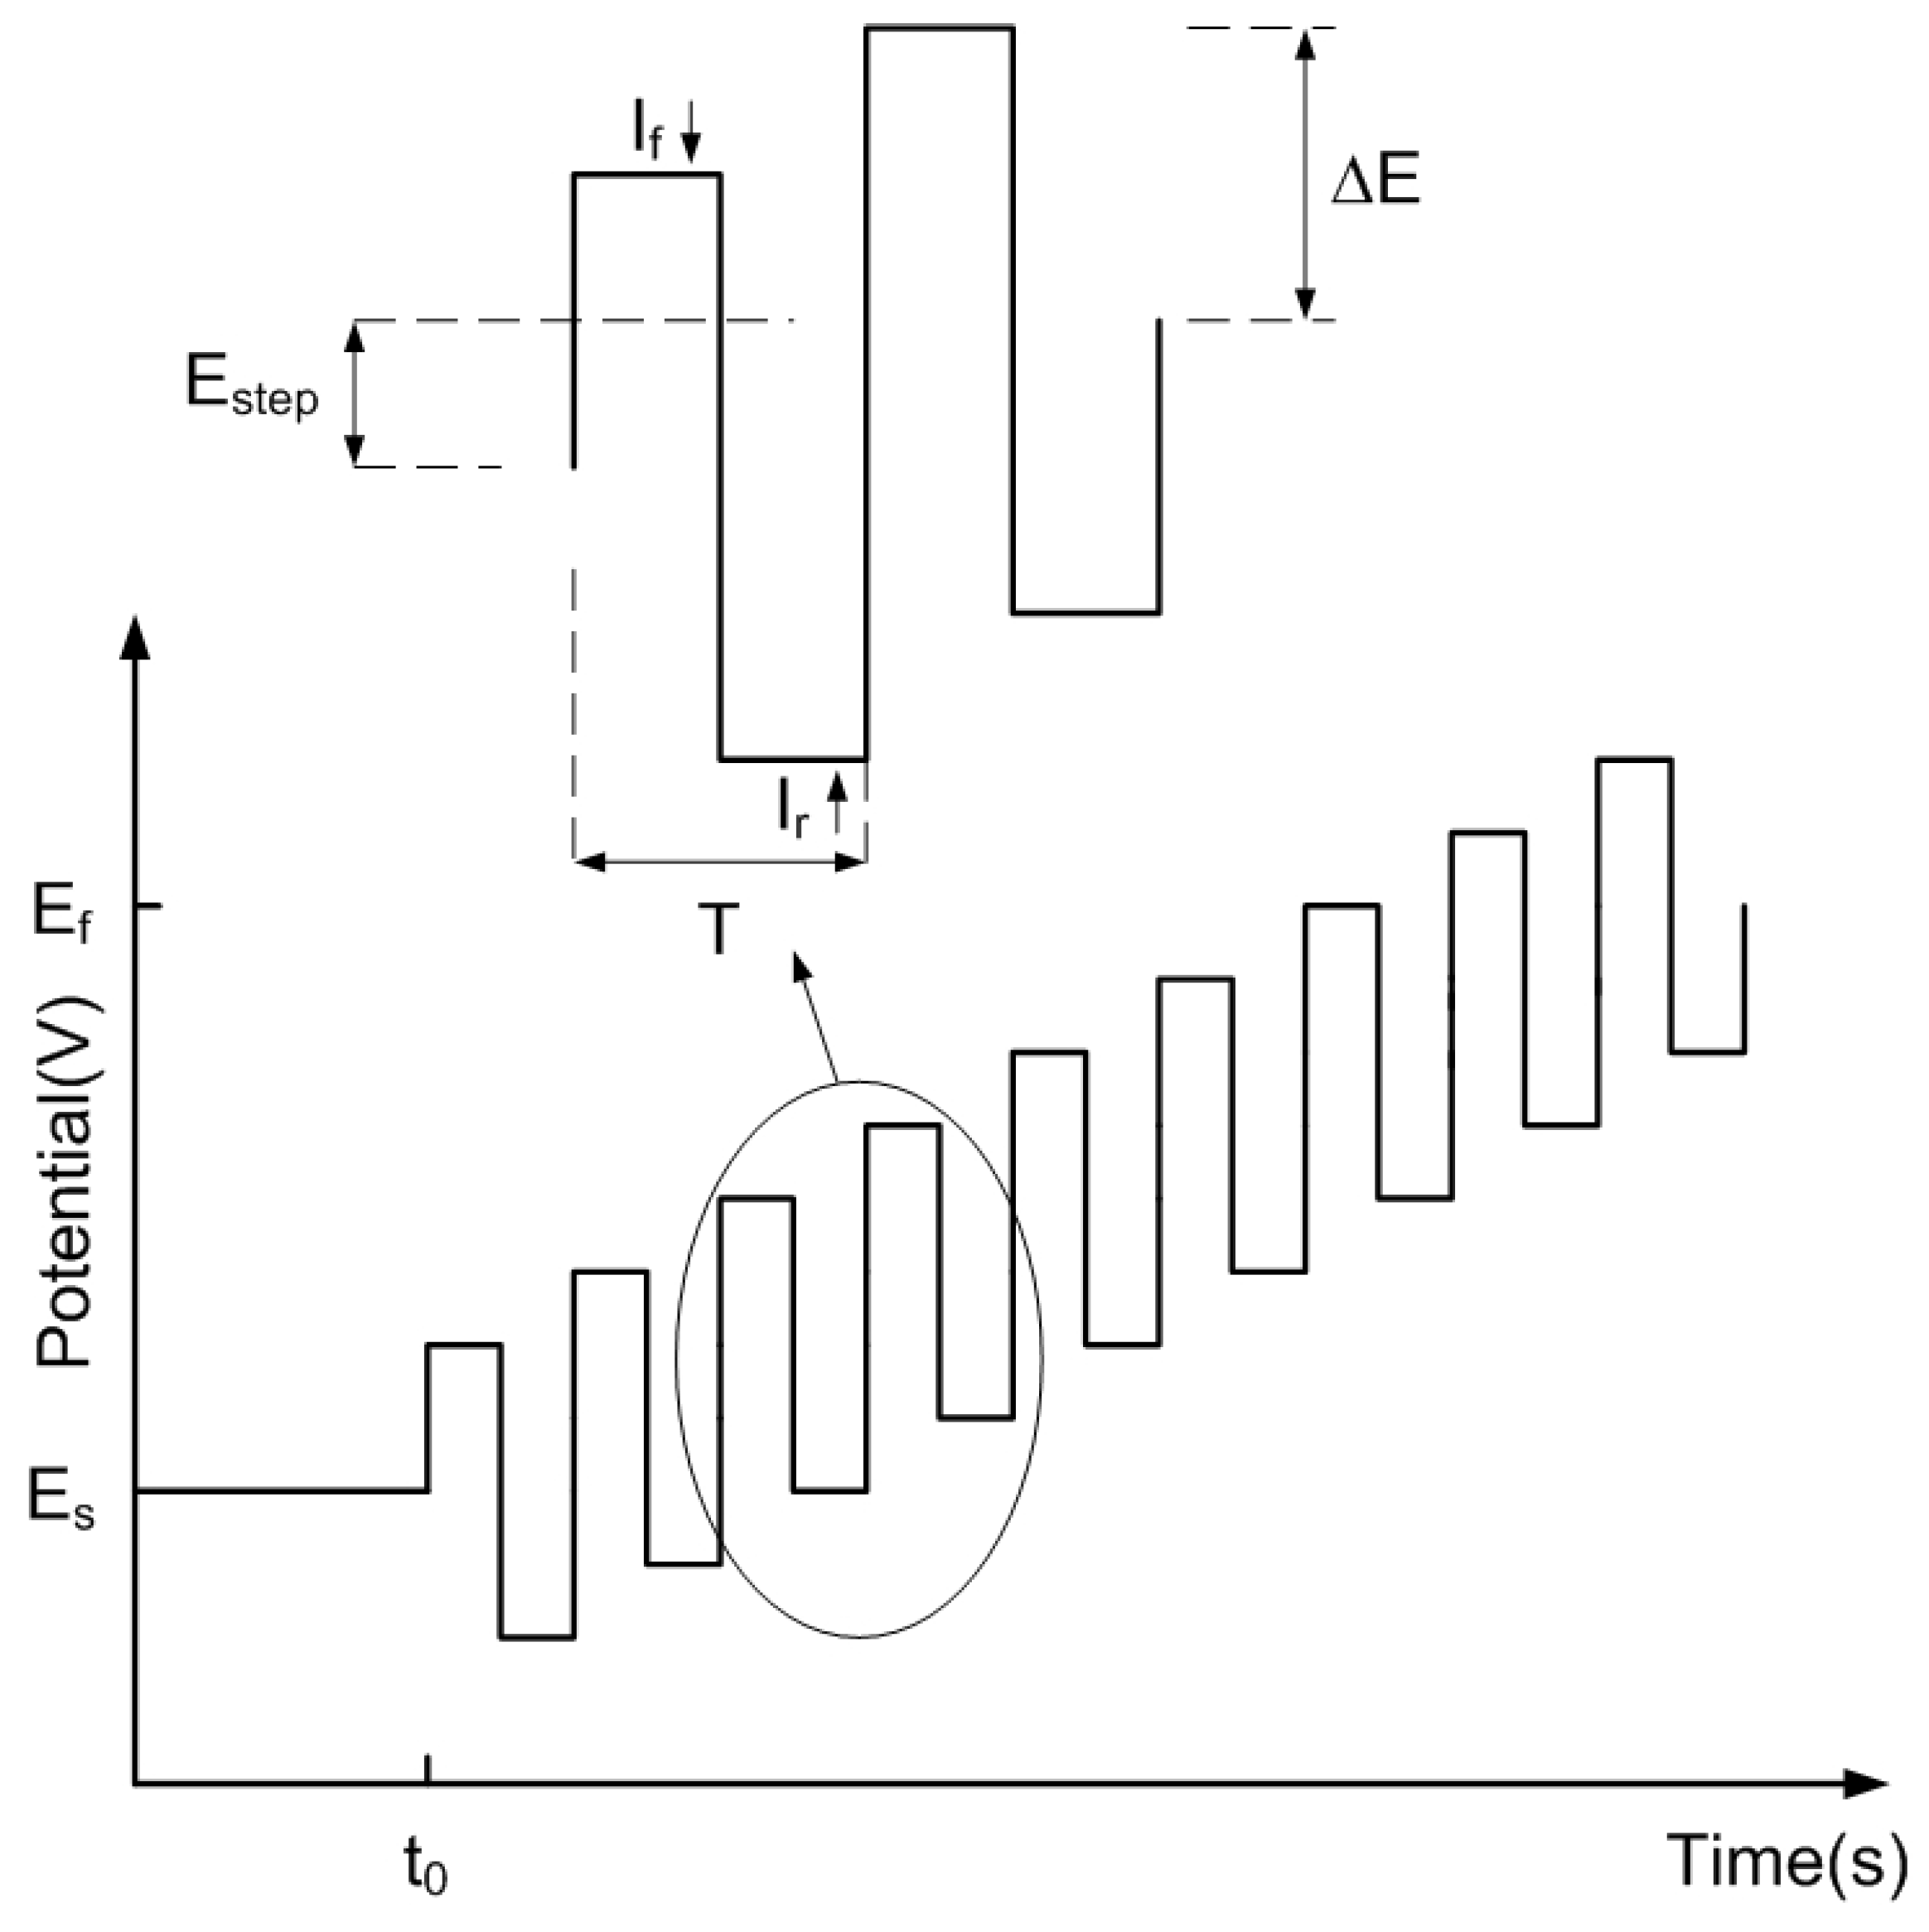
The excitation signal in SWV is a rectangular pulse train whose potential level increases linearly at each step during the course of the sweep. Consequently, in each of these steps, the working electrode undergoes two pulses: one with a forward potential and another with a reverse potential. A schema of the excitation waveform is shown in Figure 1, where denotes the pulse amplitude, is the potential at each step, and T is the period of the square waveform (the inverse is the frequency ). The currents are measured at the end of the forward () and reverse (or backward) () pulses and the signal is obtained from the resulting differential current (). The plot of the differential current as a function of the potential is known as SW voltammogram and is shown in Figure 2. It is usually a bell-shaped curve whose position and height can be precisely determined. This measurement takes place after an initial time (), before which the working electrode is biased at a potential at which the redox reaction does not take place.

Figure 1.
Potential applied in SWV, where and are the initial and final potentials, respectively. A detail of the pulses is shown in the inset.

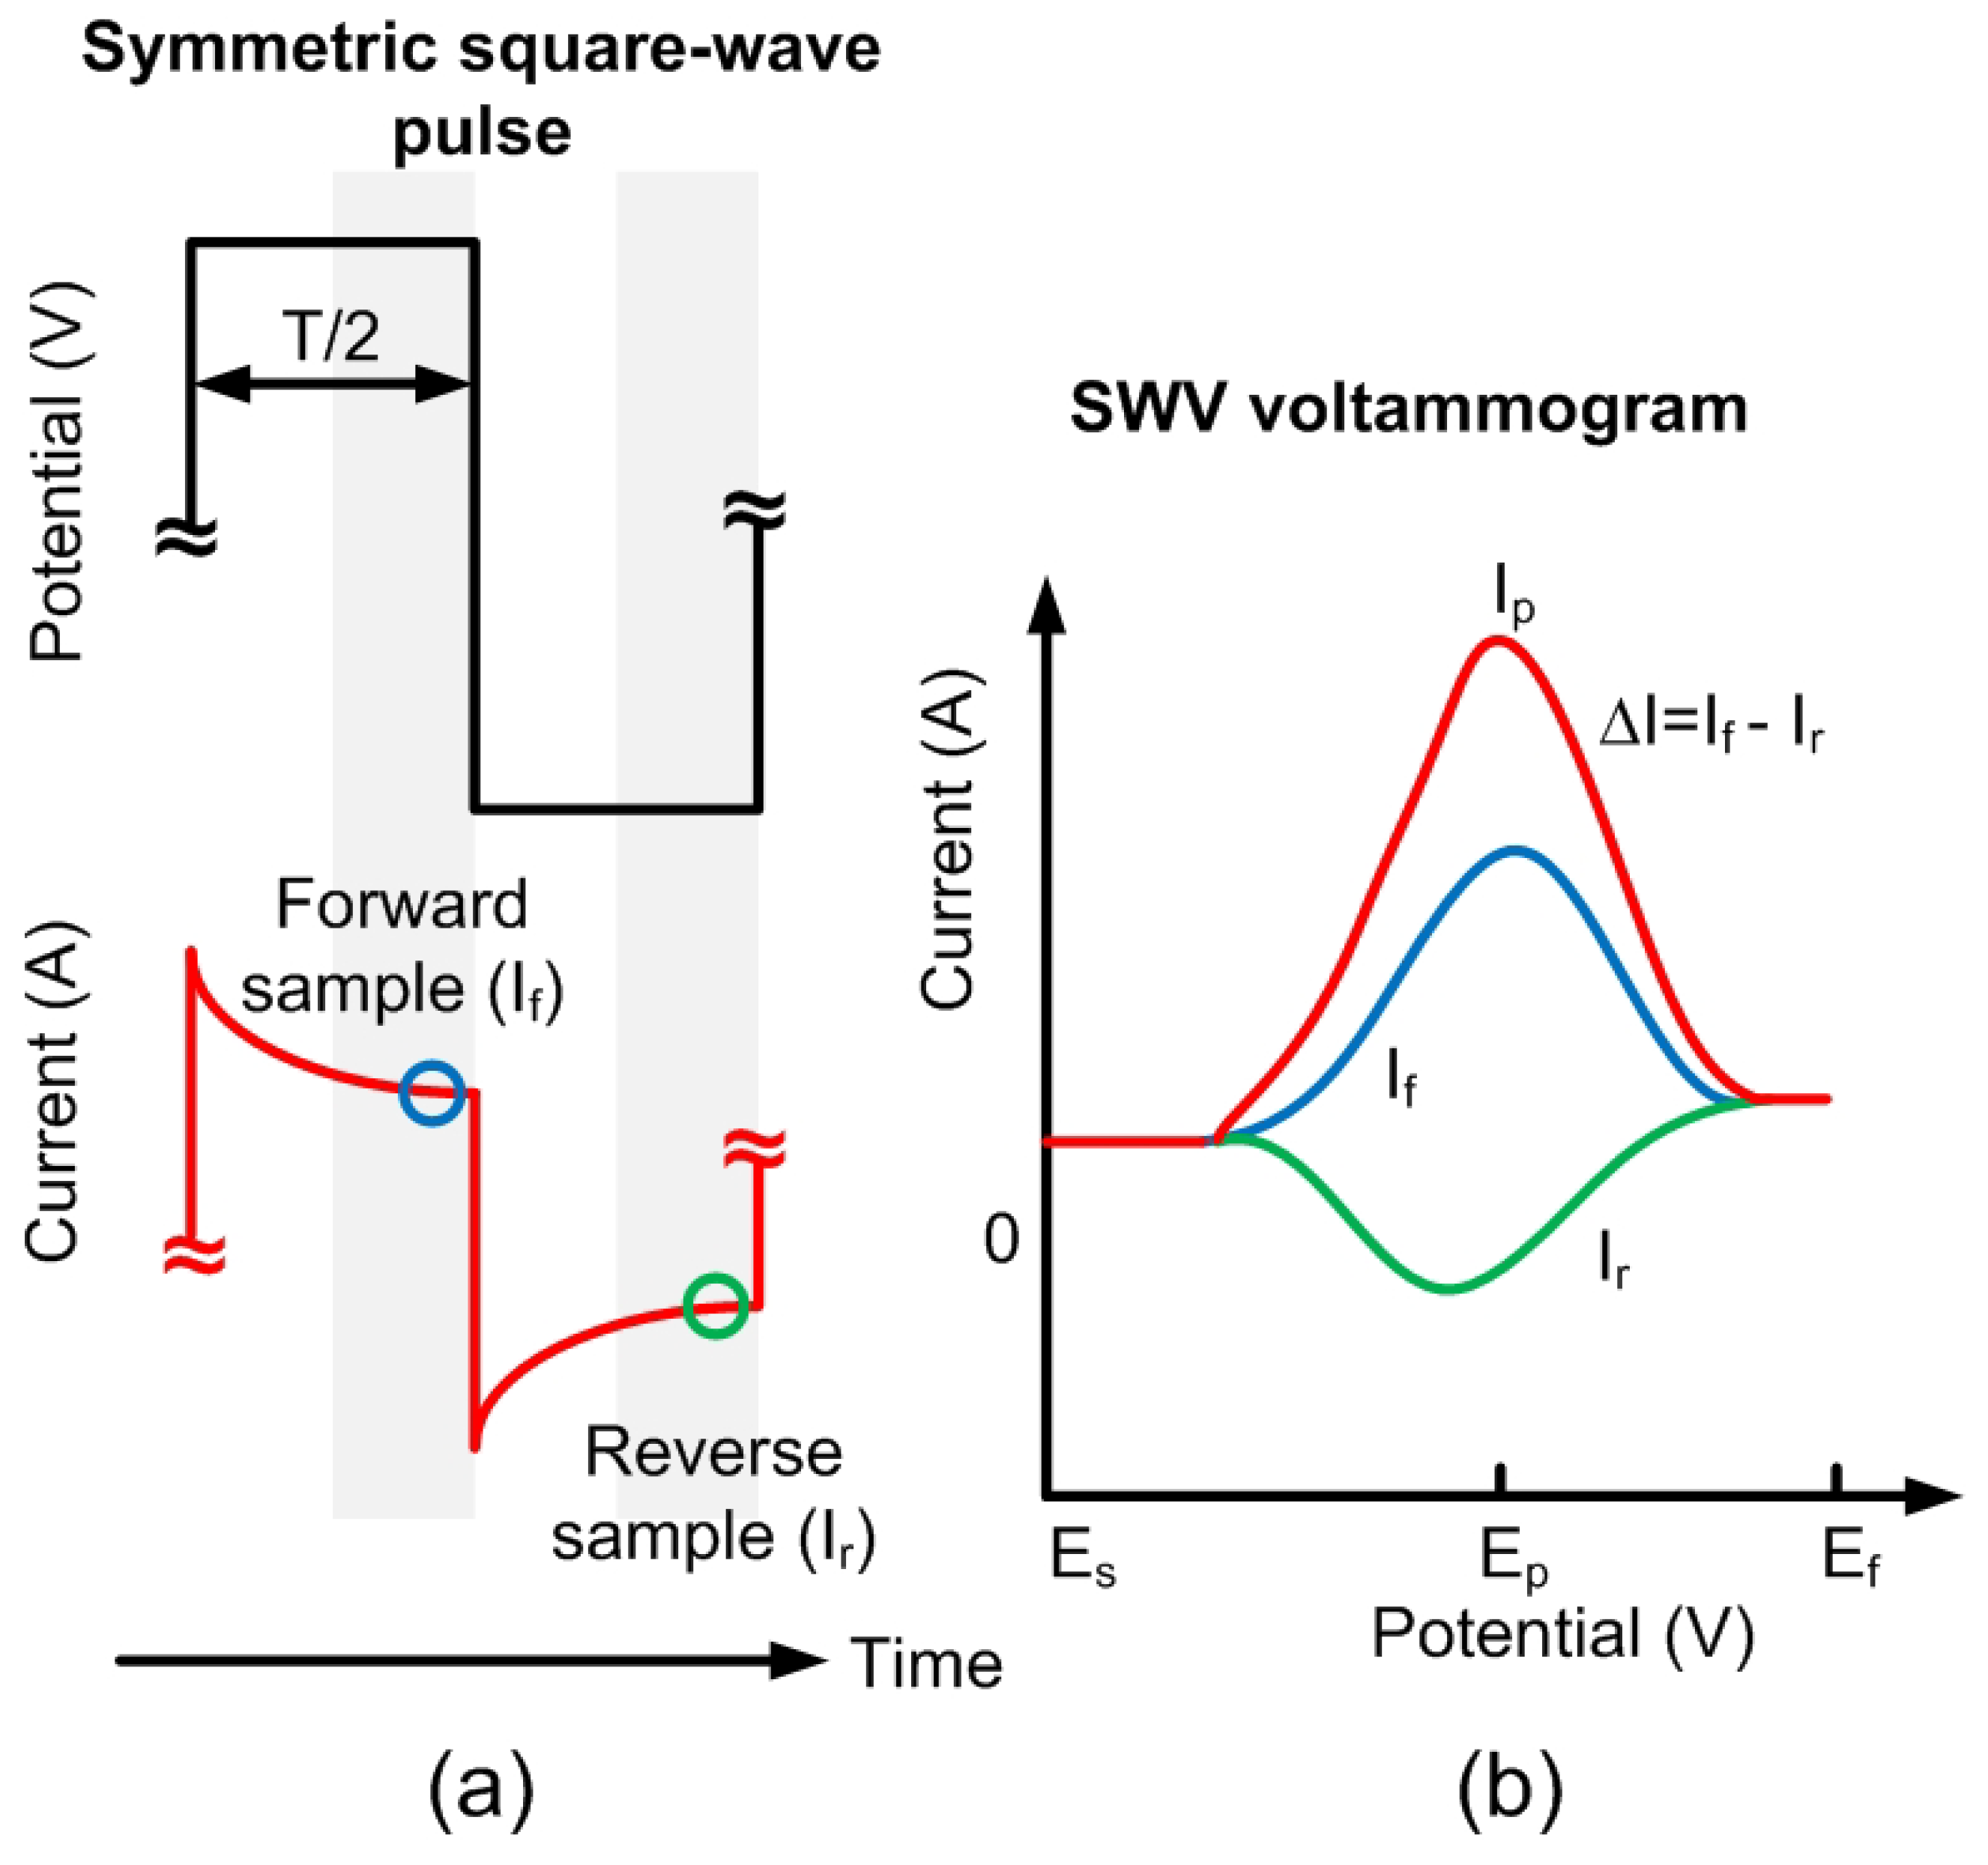
Figure 2.
(a) Schematic of the square wave pulse: Current is sampled at the end of the forward and reverse pulses. (b) Square wave voltammetry (SWV) voltammogram: This graph shows the currents of both pulses and the difference () between them as a function of the potential. The peak difference, , occurs at the potential .
Cyclic voltammetry (CV) is a widely used electrochemical technique for studying redox (reduction-oxidation) reactions and the electrochemical properties of compounds. In the CV technique, the working electrode potential varies linearly with time. But one of the differences between CV and SWV is the speed of the techniques or scan rates, due to the rapid change between potentials in SWV. Faster scan rates are typically used compared to CV. Therefore, data can be acquired faster in SWV than in CV. In CV, slower scan rates are often used to obtain voltammograms with sufficient detail. This rapid sweep can have a significant impact on the implementation of the measurement system, especially if it uses low-cost and low-power microcontrollers. The capacitive background in CV can hide redox reactions at low concentrations. SWV is better for detecting these levels because it reduces this background. It uses two current sampling points to minimize capacitive current effects.
Digital-to-analog converters (DACs) of at least 12 bits are required to generate the excitation waveform in SWV with sufficient voltage resolution. However, most microcontrollers do not incorporate DACs with these features, and those that do usually have 8 bits. Because the measurement is based on the difference between two currents, high-resolution, low-noise analog-to-digital converters (ADCs) are needed. ADCs integrated into microcontrollers are typically based on successive approximation register (SAR) ADCs that have between 10 and 12 bits. However, the internal noise of digital circuits is coupled, reducing their signal-to-noise ratio and the number of effective bits. Therefore, to achieve the required resolution and minimize noise interference, it is essential to use both external DACs and ADCs. External ADCs based on sigma-delta converters, such as those used in this work, have a large number of bits (typically up to 24 bits). However, the requirement for scanning speeds of 50 Hz or higher is compromised by the maximum number of bits, which in practice is limited to approximately 18. Therefore, the introduction of these elements adds a certain degree of hardware complexity relative to the simpler potentiostat designs typically developed for chronoamperometry or CV applications.
The differential SW voltammogram presents a clearly defined peak, while the derivative of the forward and reverse currents have a waveform (see Figure 2) that is sometimes not so suitable for interpreting the results. The peak-like shape of the differential SW voltammogram is advantageous in an analytical context because it offers easily measurable parameters, such as the peak height () and peak potential position (), thus improving the resolution of the technique [17].
For this reason, SWV is utilized as an electrochemical measurement technique in various research domains [2,3,4,5,18].
The potential step ( is a parameter that determines the voltage resolution of the voltammograms. It depends on the number of bits of the digital-to-analogue converter (DAC) used in the potentiostat, so it also influences the acquisition time. The amplitude of the square wave, , is another essential parameter that allows the tuning of SWV. It has an effect on two of the main characteristics of the voltammogram: background signal and signal-to-noise ratio of the resulting peaks. As previously mentioned, both forward and reverse current pulses combine Faradic and capacitive currents. Reducing the amplitude is beneficial for improving the capacitive background correction, as it decreases the difference between the capacitive components of the forward and background currents. However, this improvement results in reduced peak intensities. While large amplitudes provide improved peak intensities, they also produce larger background currents, broader peaks, and consequently shifts of the peak relative to the expected position. Therefore, the use of inappropriate amplitudes can result in inaccurate outcomes.
The frequency and the potential step are two parameters that directly affect the speed of data recording. The overall scan rate is defined as and determines the overall time of the experiment, the expansion of the diffusion layer, and the rate of the diffusion [17]. Increasing the frequency not only reduces the acquisition time, but in general, also improves peak intensity. Nevertheless, in diffusion-limited experiments, the use of excessively high frequencies can cause peak broadening and distortion [19]. Hence, for most applications, the frequency is usually within the range of tens of Hz.
Specialized equipment capable of generating and detecting square waves is necessary, and nowadays it is easy to find the appropriate instrumentation on the market to perform this type of measurement. However, in point of care diagnostics, this instrumentation is not useful because of its high cost.
2. Materials and Methods
2.1. Materials and Reagents
- Components and reagents: All chemicals were purchased from Sigma–Aldrich Co. and used as received, unless otherwise noted. All aqueous solutions were prepared using Milli–Q water (from a Milli–Q Direct purification system, resistivity = 18 M). A phosphate buffer saline solution (1X PBS) containing 137 mM sodium chloride, 2.7 mM potassium chloride, and 10 mM phosphate buffer was prepared by dissolving five tablets in 1 L of Milli–Q water. HPLC-purified oligonucleotides were purchased from Biosearch Technologies (UK). Upon receipt, the oligonucleotides were dissolved in TE buffer (10 mM Tris, 0.1 mM EDTA, pH = 8, obtained from Integrated DNA Technologies, Inc., Leuven, Belgium) at a concentration of 100 M and then aliquoted and stored at −20 °C. Table 1 shows the sequences of oligonucleotides.
 Table 1. Sequences of oligonucleotides.
 - Electrochemical cell: Electrochemical measurements are performed at room temperature using simultaneously an IVIUM CompactStat potentiostat (Ivium Technologies, Netherlands) and the low-cost prototype proposed in this work using a three-electrode cell system containing a platinum counter electrode, an Ag/AgCl reference electrode (TianjinAida Co., Tianjin, China), and a gold rod electrode (2 mm diameter, CH Instruments, Inc., Austin, TX, USA) as the working electrode.
- DNA sensor fabrication: The gold electrodes were first cleaned by immersing them in a freshly prepared piranha’s solution (1:3, 30% and concentrated , respectively) for 5 min, followed by rinsing with deionized water. The electrodes were then subjected to an electrochemical pretreatment consisting of varying the electrode potential with respect to that of the Ag/AgCl reference electrode in cycles between −0.1 and 1.6 V, at a scan rate of 0.1 for 40 scans in a 0.5 M solution. Then, the electrodes were rinsed with deionized water and dried using pure nitrogen gas [20]. For capture probe immobilization, an aliquot of the capture probe is thawed and reduced with a 100-fold molar excess of tris(2–carboxyethyl) phosphine (TCEP) for 1 h at room temperature in the dark. The reduced probe was diluted to a final concentration of 1 M in PBS, and the cleaned gold electrodes were incubated in this solution for 2 h in a humid chamber. Following this, the electrodes were rinsed with Milli–Q water and incubated overnight at room temperature in a freshly prepared 1 mM solution of 6–mercaptohexanol (MCH) in PBS. After a final rinse with Milli–Q water, the electrodes were ready for biosensing measurements [21].
2.2. Measurement Method: Signal Processing
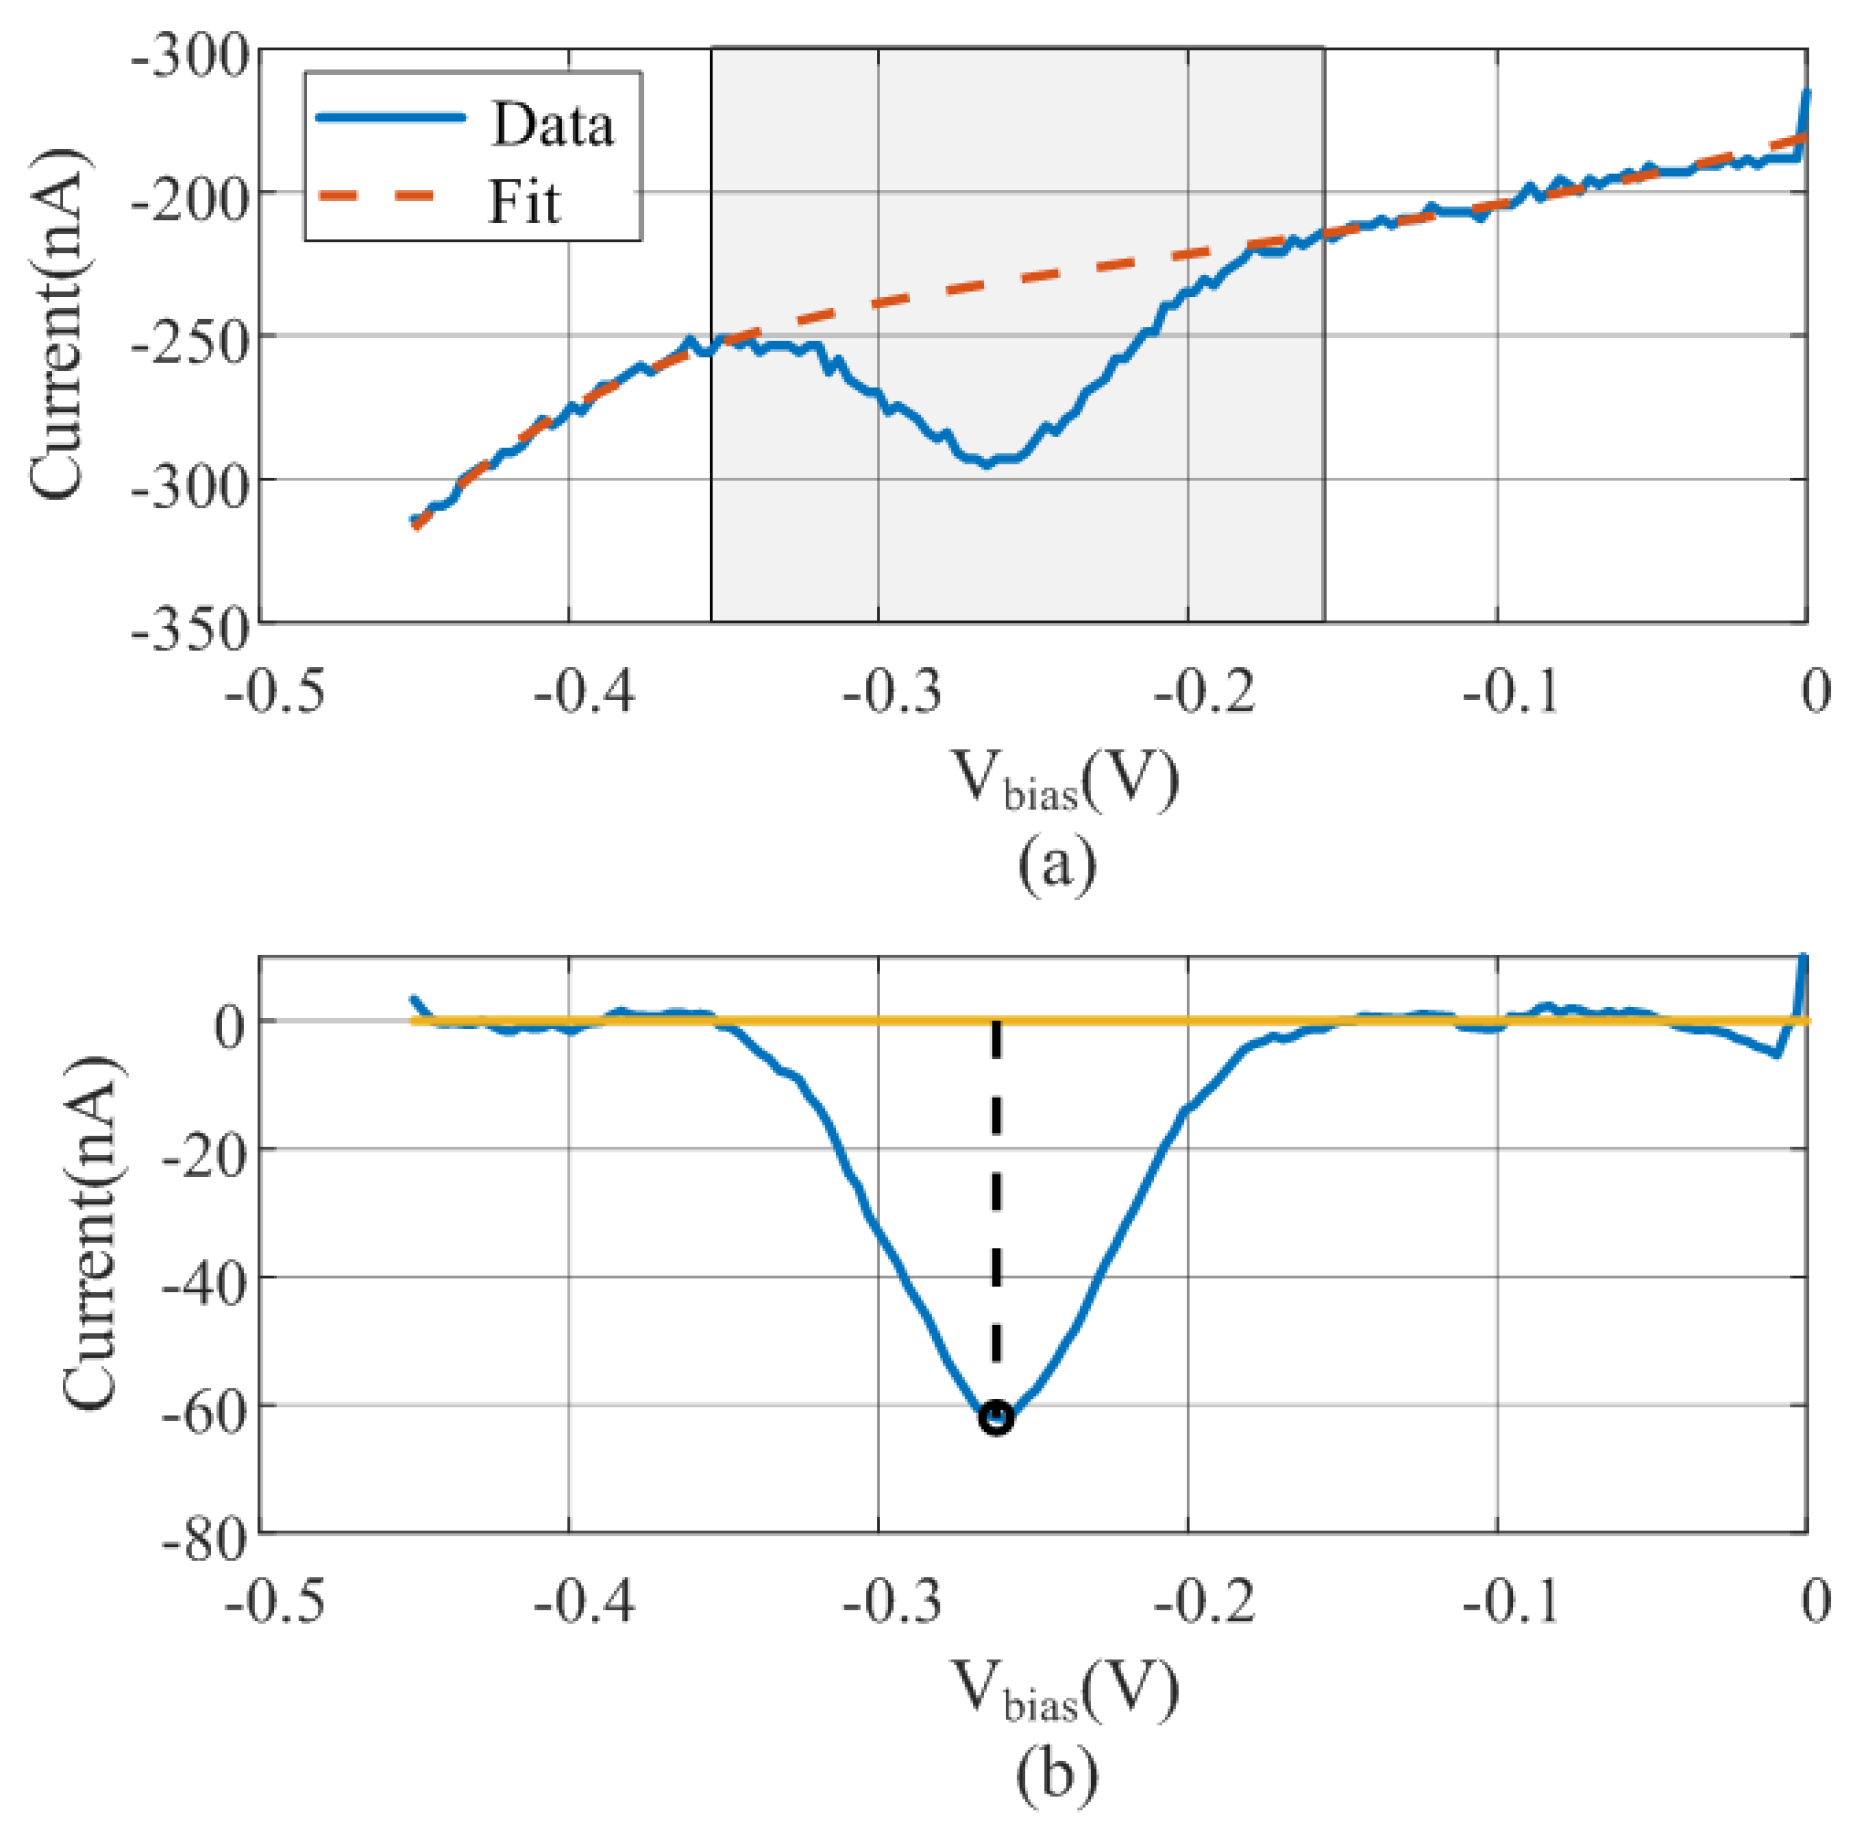
It is essential to be able to automatically estimate the baseline on PoC devices that are intended for end users who lack knowledge of the instrument. To this end, a method based on non-linear baseline estimation is here proposed. The procedure involves fitting a polynomial of a specified order to the data curve, excluding the window that contains the minimum (see Figure 3). The width of this exclusion window is set at approximately 0.2 V around the peak, which corresponds to the region with the largest current variation. The fitting is performed using least-squares regression, which determines the best-fitting curve for the set of data points by minimizing the sum of the squares of the residuals. The polynomial regression model using matrix notation is given by:
where is the vector of measurements at the selected points within the selected bias range , is a vector of random error, and X is the Vandermonde matrix [22]:
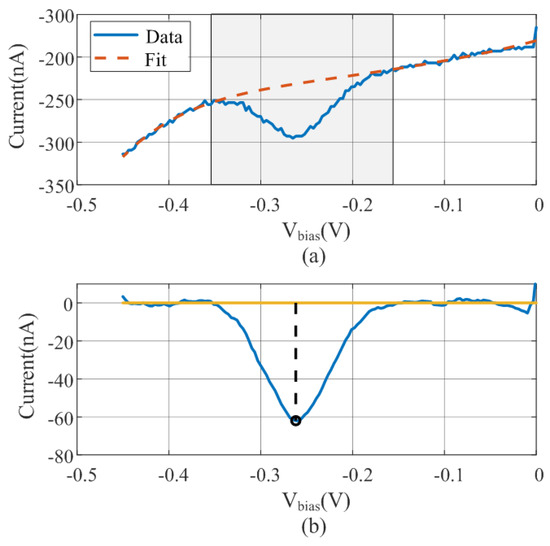
Figure 3.
(a) Polynomial regression of the measured data (solid line) excluding the shadow region. (b) Smoothing with the moving average filter and baseline subtraction and peak estimation data.
The vector of estimated polynomial regression coefficient is obtained using the pseudo-inverse of the matrix X [22]:
For the matrix to be invertible, the number of points (N) must exceed the polynomial’s order (M). Since X is a Vandermonde matrix, its invertibility condition will be guaranteed in case all the values of are different.
The baseline is estimated from the fifth-order polynomial fit using the entire bias range and is subtracted from the measured data. As a preliminary step to peak searching, a moving average filter is applied to smooth the curve and remove noise. A flowchart diagram is shown in Figure 4. An example illustrating the operation of the algorithm with measured data is depicted in Figure 3. Figure 3a shows the raw data and the fitted polynomial using the points outside the windows. The result of the baseline subtraction and the noise reduction achieved by smoothing with the moving averaging filter is shown in Figure 3b. The minimum obtained is also highlighted in this figure.
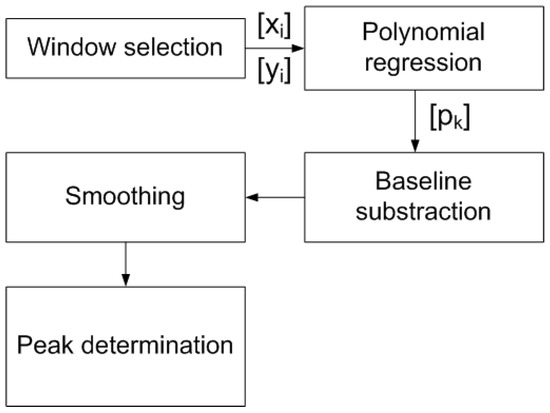
Figure 4.
Flowchart of signal processing applied to the measured data to determine the peak height after subtracting the baseline estimated by polynomial regression from points outside the peak region.
2.3. DNA Quantification Using SWV
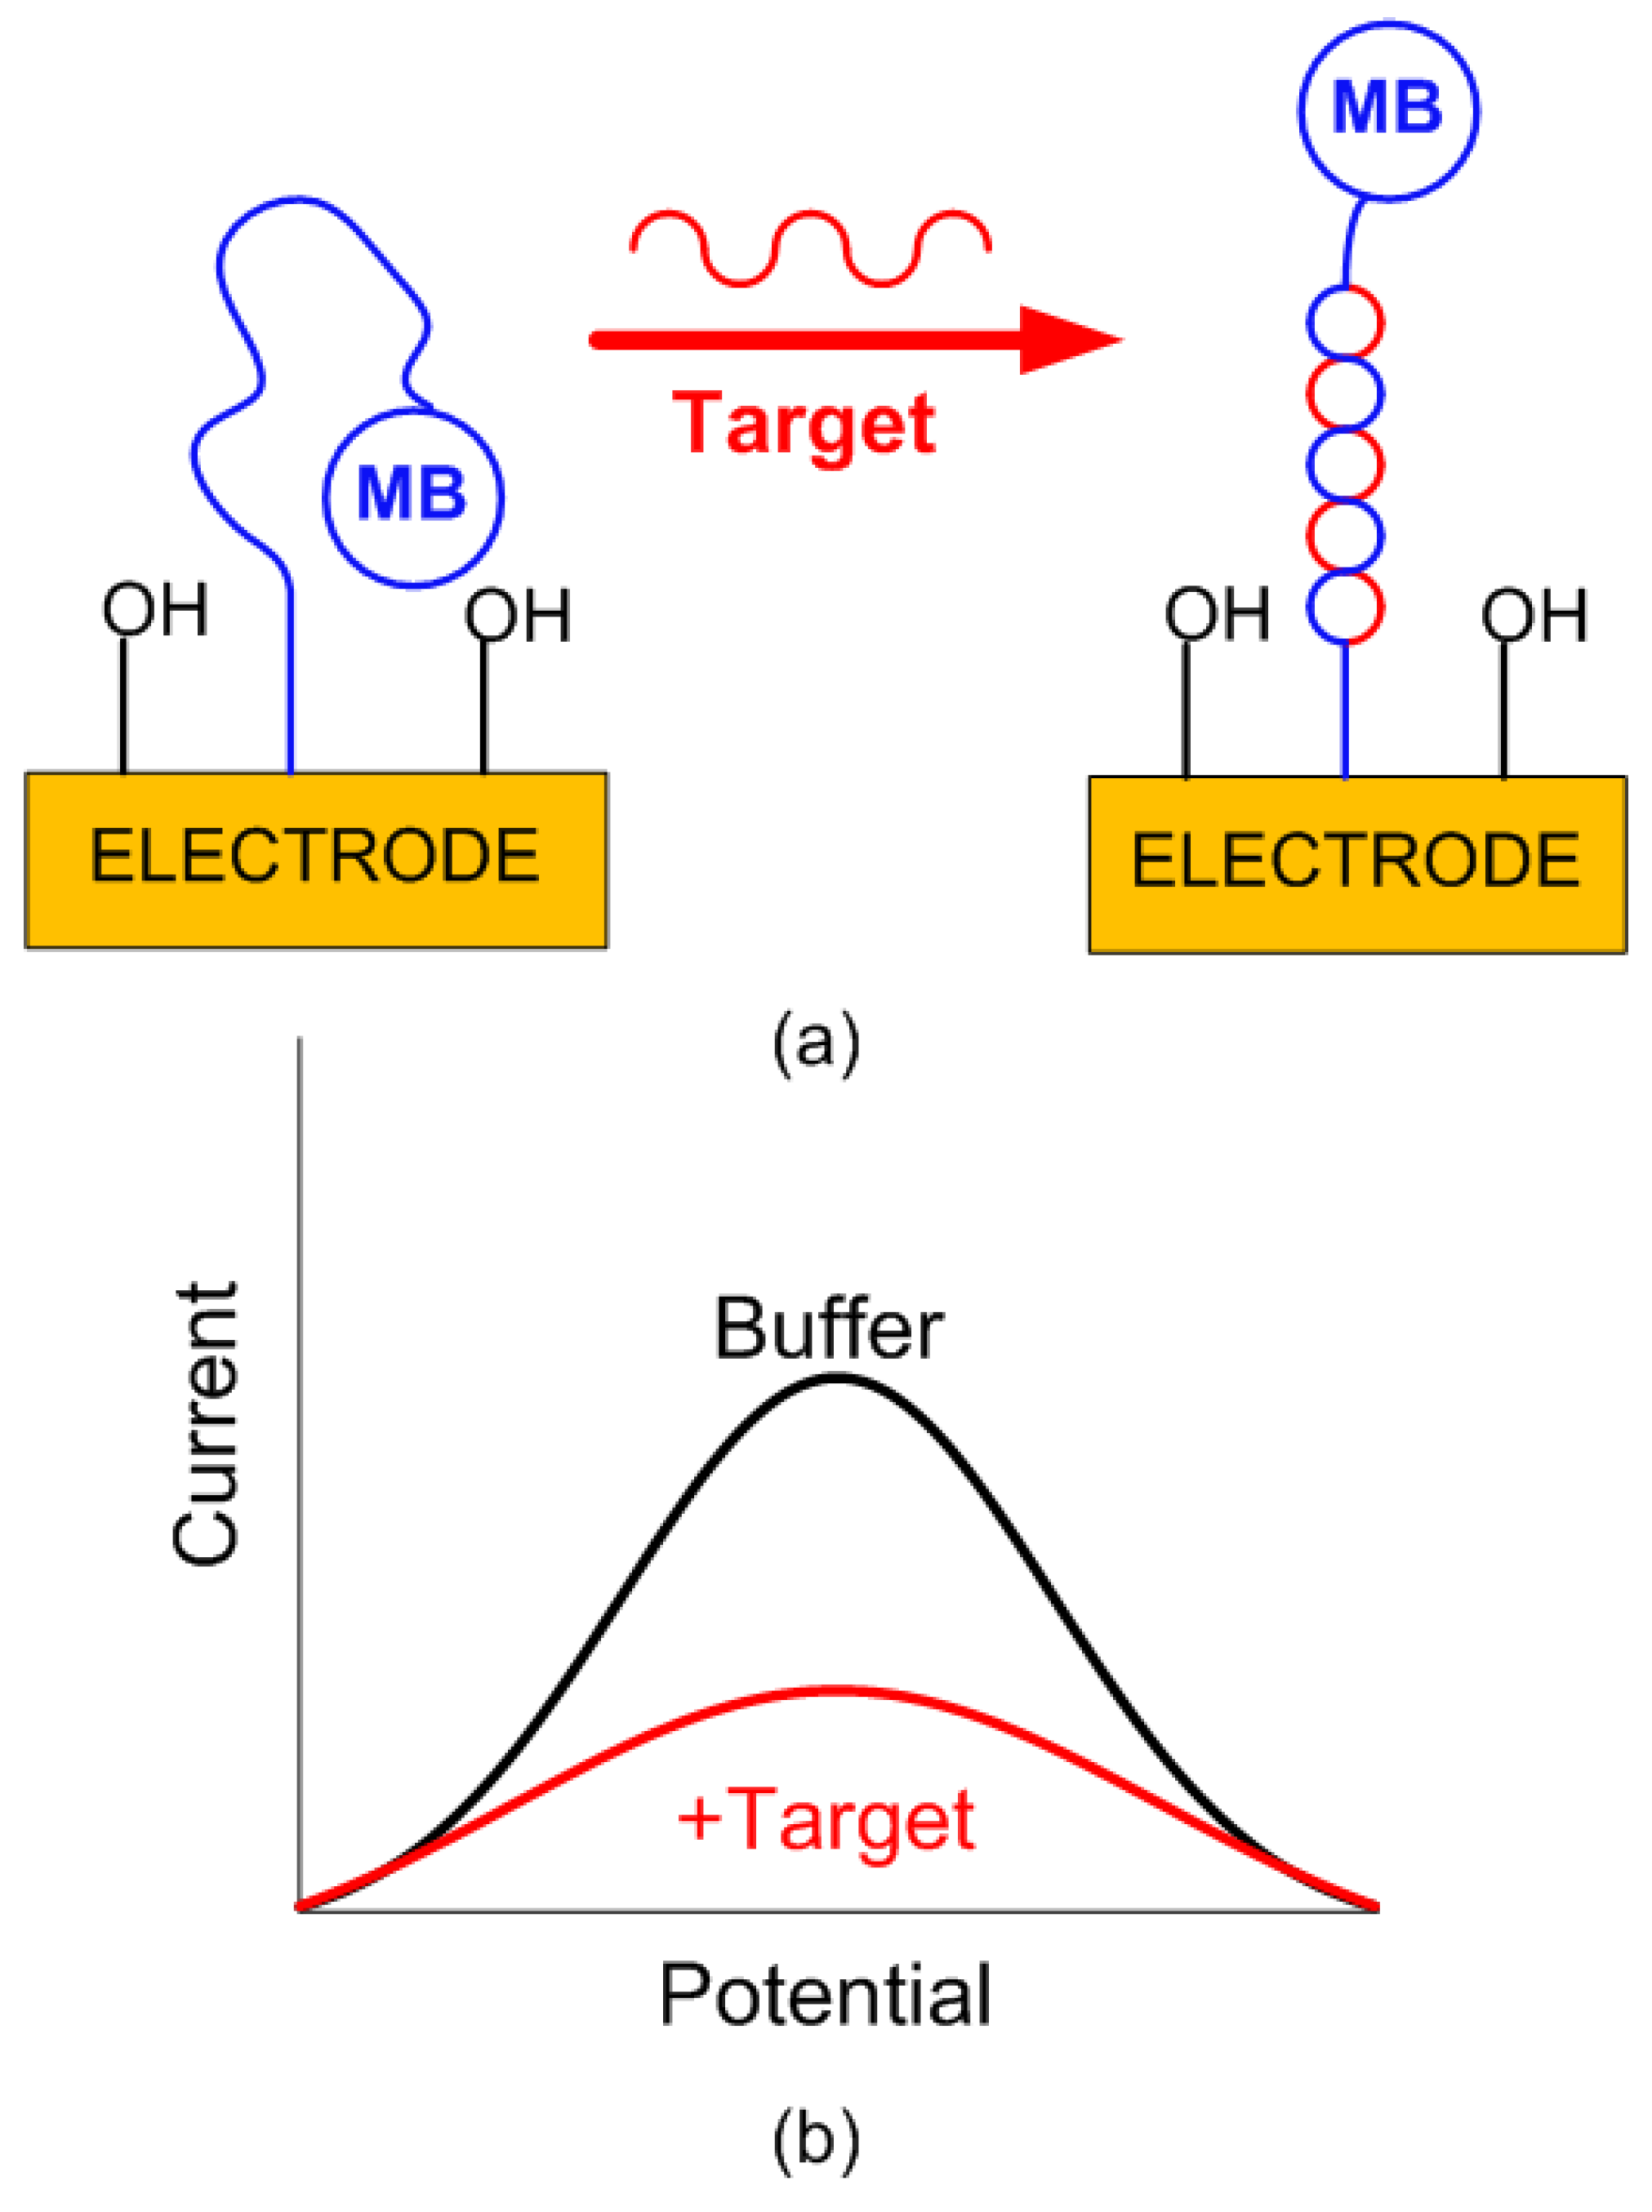
Differential measurement strategies are employed to reduce the drift (i.e., a gradual decrease in signal over time) in long-term measurements. However, reproducible sensors are required to perform background correction. Electrochemical DNA sensors are a type of biosensor that leverage the principles of electrochemistry to detect specific DNA sequences. These sensors generally consist of a DNA probe immobilized on the surface of an electrode. When the target DNA sequence complementary to the immobilized capture probe is present, it hybridizes with the probe, causing a measurable change in the electrochemical signal. This change is often detected using a redox-active tag, such as methylene blue. The signal generation is shown schematically in Figure 5. Specifically in this work, the sensing strategy is based on immobilizing a thiolated methylene blue-tagged capture probe (complementary to the target) on the gold electrode surface. Without the target, the probe adopts a conformation that keeps the redox tag near the electrode, generating a strong Faradic current measurable by square wave voltammetry (SWV). When the target is present, hybridization occurs, causing the redox tag to move away from the electrode, which leads to a significant current reduction proportional to the target concentration [23].
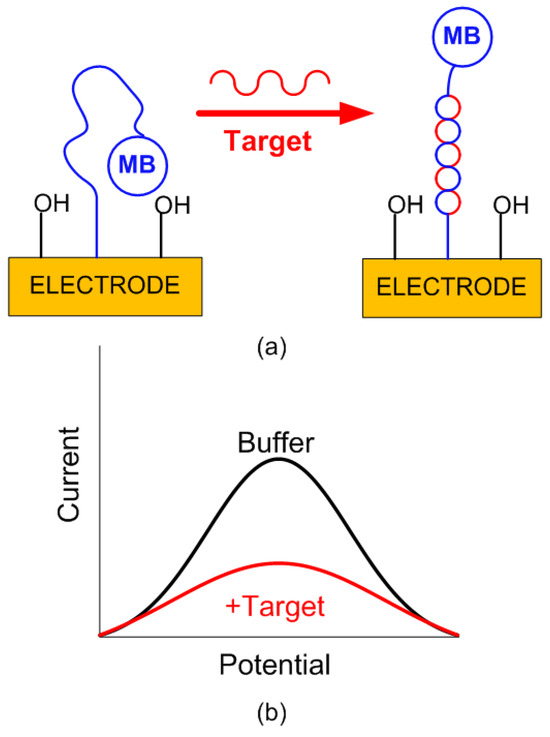
Figure 5.
(a) Signal generation in an electrochemical DNA sensor. The initial E-DNA sensor consisted of a redox-tagged DNA linked to an interrogating electrode. In the absence of a target, the redox tag remains close to the electrode, facilitating efficient electron transfer (eT) and producing a significant, easily detectable Faradaic current. When hybridization with a target occurs, the redox tag is displaced from the electrode, hindering the signaling current. (b) Current difference as a function of potential for a buffer solution and target DNA. Optimal results depend on the proper choice of square wave frequency.
Electrochemical DNA sensors are highly sensitive and selective [12], making them suitable for applications in clinical diagnostics, environmental monitoring, and biological research [24].
2.4. System Description
2.4.1. System Overview
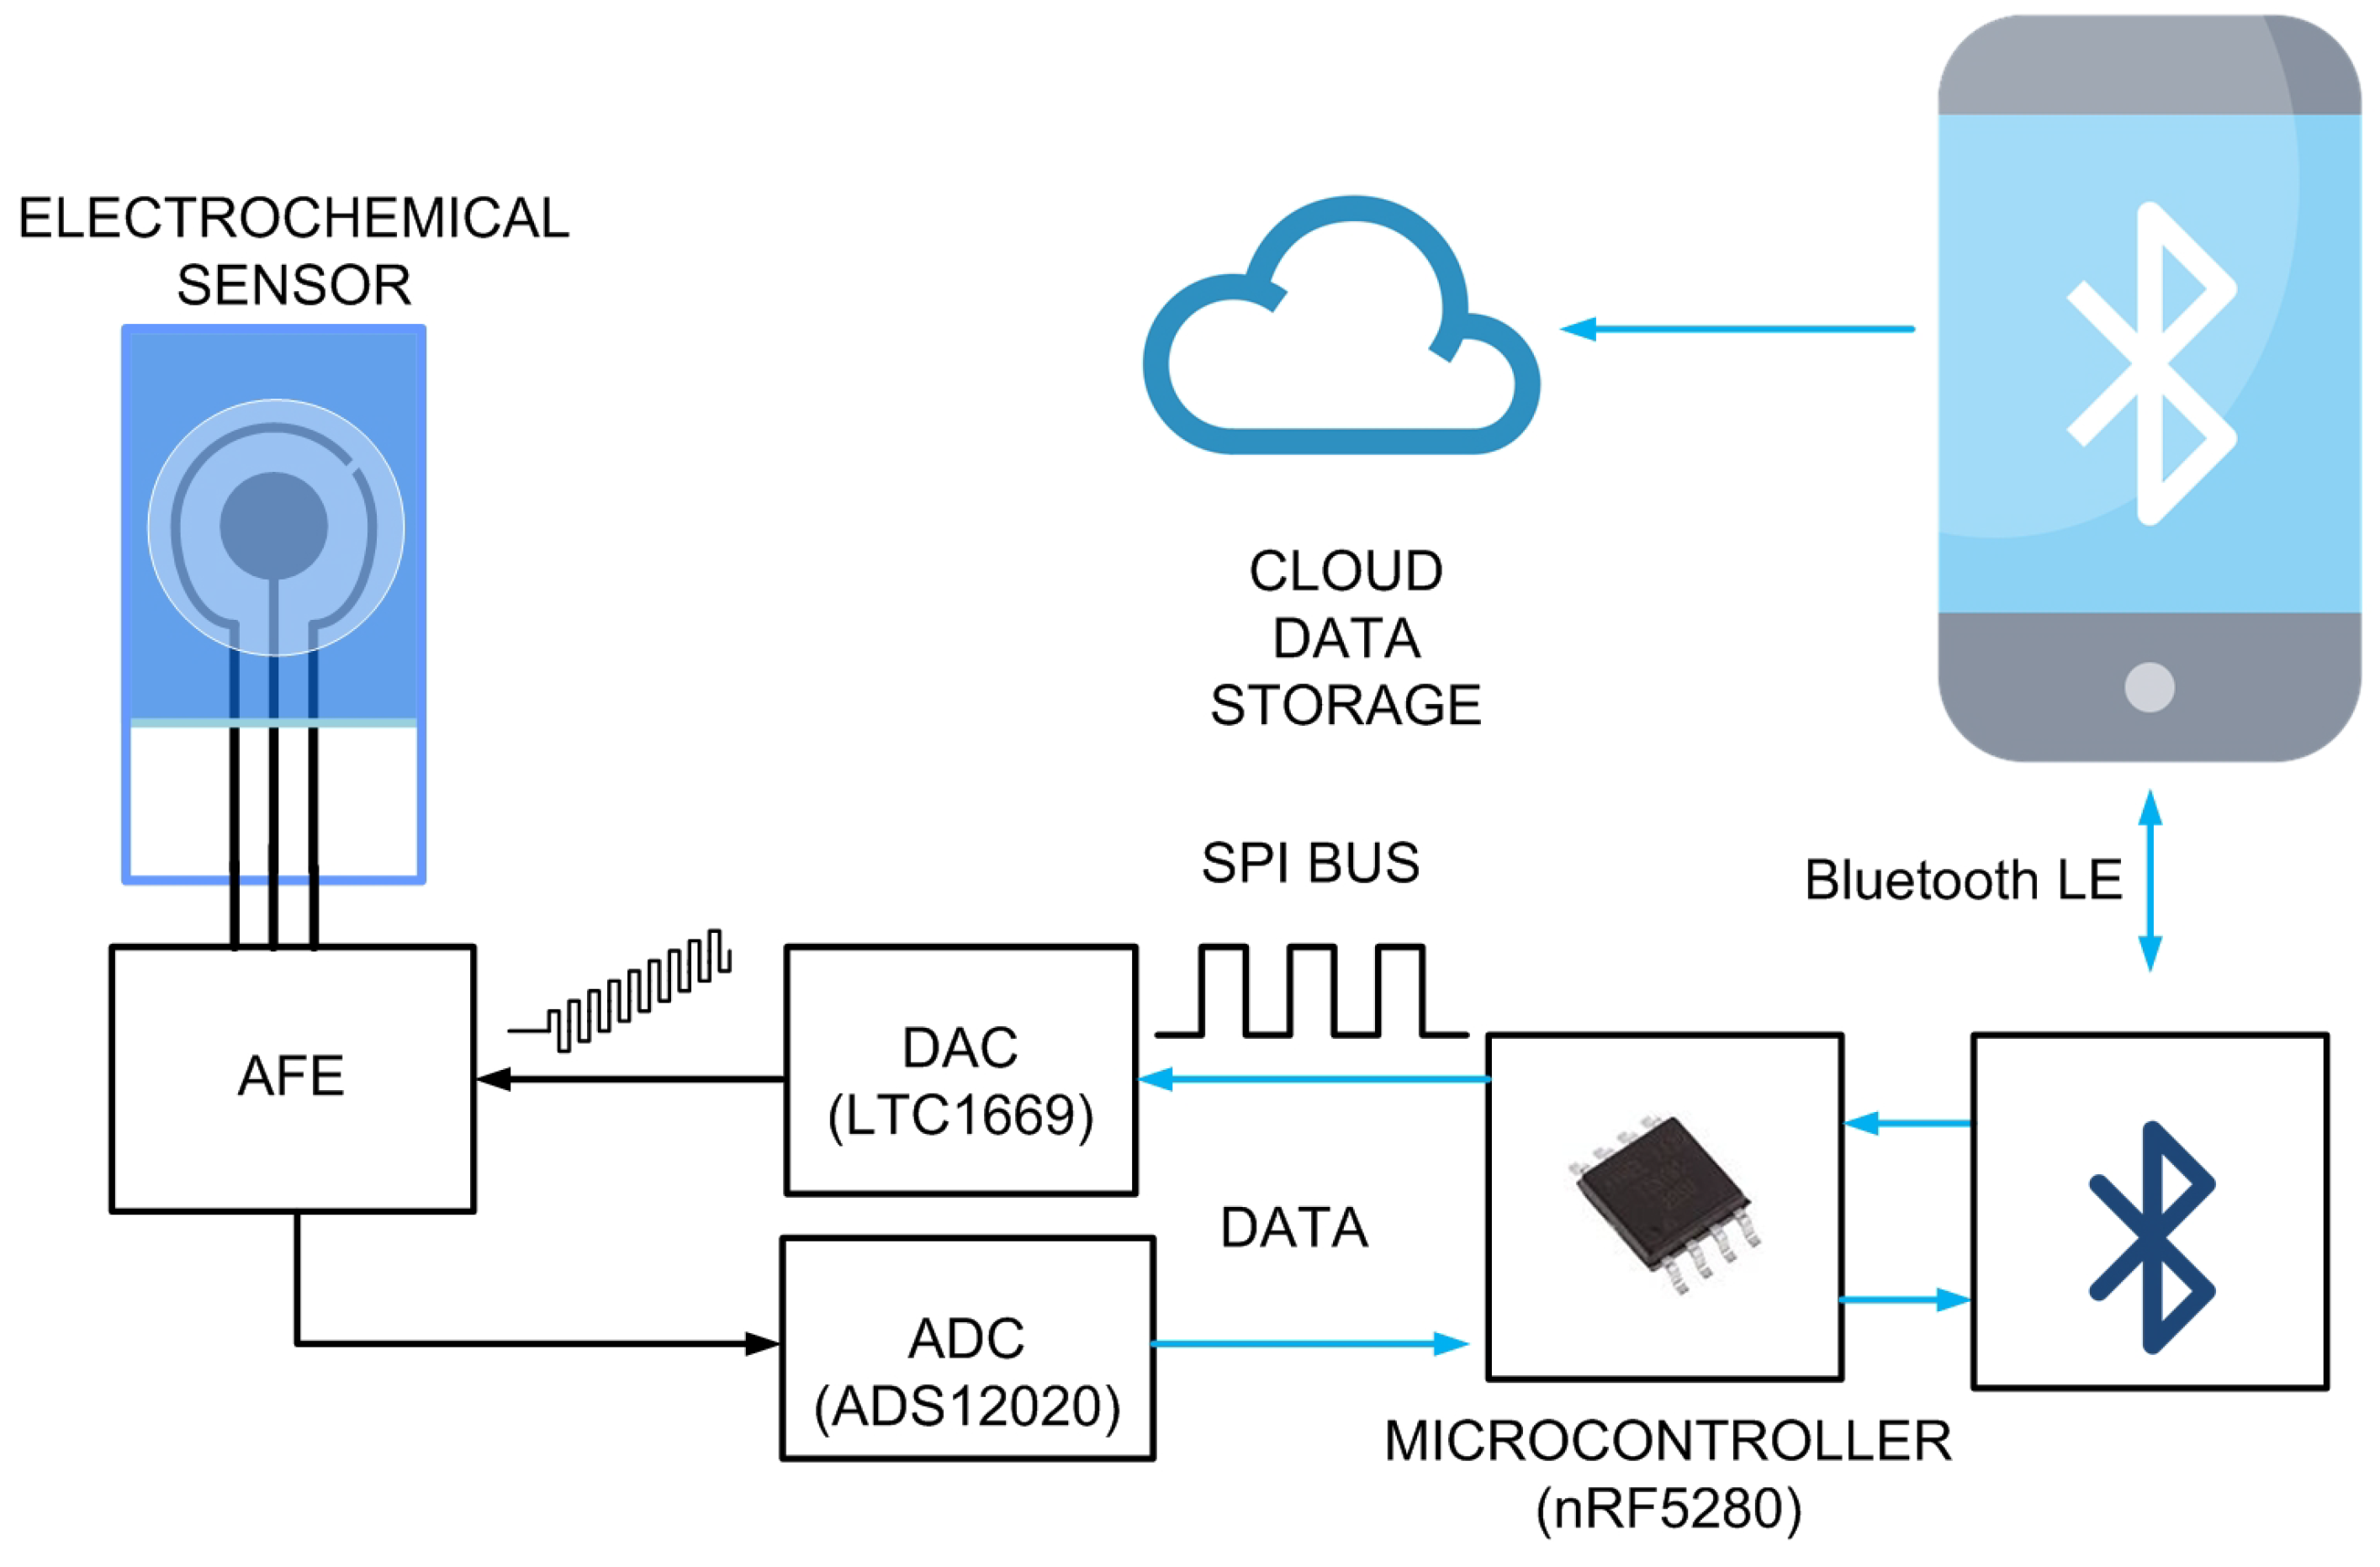
Figure 6 shows a block-of-diagram of the proposed system. It consists of an electrochemical cell (sensor), an analogue front-end (AFE) that is carried to bias the sensor and measure the current, a digital-to-analogue converter (DAC) that generates the square wave waveform, an analogue-to-digital converter (ADC) that measures the output of the trans-impedance amplifier integrated into the AFE, and a microcontroller. To enable wireless capability, the Seeed Studio XIAO nRF52840 module is used, which integrates an ultra-low-power Bluetooth 5.0 board based on the Nordic nRF52840 integrated circuit and an onboard ceramic antenna. The Bluetooth transceiver has a 4.8 mA peak current in transmission (at 0 dBm) and a 4.6 mA peak current in reception. The overall XIAO BLE achieves a peak current consumption of 30 mA when the Bluetooth transceiver is transmitting at 8 dBm. The module has a standby power consumption of 5 A. The system uses the internal Bluetooth microcontroller, making an additional one unnecessary, thus reducing the cost. It is an ARM Cortex-M4 32-bit processor that can run at up to 64 MHz, sufficient for the required computational load. These features make the XIAO BLE a more power-efficient choice for this prototype compared to other popular wireless platforms, such as the ESP32 modules, which can consume up to 130 mA when using Bluetooth. However, this microcontroller does not have a DAC; therefore, an external 12-bit rail-to-rail DAC is used (LTC1659 from Analog Devices, Wilmington, MA, USA). This DAC is characterized for low-power operation (<240 A), low differential non-linearity (<±0.5 LSB), and a fairly fast settling time of 14 s. The 12-bit resolution allows one to perform potential steps () of up to 0.6 mV with enough resolution to determine the position of the current peak in SWV. Although the microcontroller has a 12-bit ADC, in order to improve the ADC’s resolution and reduce the noise in the conversion, an external 24-bit, low-noise ADC has been used (ADC1220 from Texas Instruments Inc., Dallas, TX, USA). The ADC1220 employs a delta-sigma modulation method. This type of ADC is known for its high resolution and accuracy, making it suitable for precision measurements. This ADC has an internal reference of 2.4048 V with a drift of 5 ppm/. While the sample rate of the ADC1220 can be configured up to 2 kSPS, in this work it is reduced to 300 SPS, which is sufficient to achieve sweep rates in SWV up to 100 Hz. The ADC1220 has four input channels. It can be configured to use either two differential inputs or four single-ended inputs. However, in this work, only one single-ended input is used. The additional channels are used to implement dual-channel potentiostats. The regulated 3.3V of the XIAO module powers the rest of the electronic components. A proof-of-concept prototype is manufactured using a standard FR4 printed circuit board (PCB) with a substrate thickness of 0.8 mm, a relative permittivity of 4.7, and a loss tangent () of 0.02. The copper metallization layer is 35 m thick (conductivity S/m).
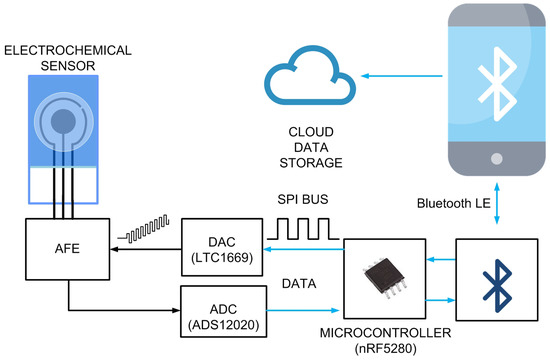
Figure 6.
Schema of the proposed system. The microcontroller configures the DAC to generate the SWV waveform. For each pulse step, the forward and reverse currents at the output of the analog front end (AFE) are measured by the ADC. Communication between the ADC and the DAC with the microcontroller is done through the serial peripheral interface (SPI) bus. Once the scan is completed and the measurements are processed, the peak current is determined. The microcontroller then transmits the processed information to the mobile device via Bluetooth Low Energy (BLE). The results are subsequently uploaded to a cloud database. The system is controlled by the mobile app through BLE.
The board can be powered directly from the universal serial bus (USB) or by a 3.7 V lithium-ion polymer battery connected to the XIAO BLE module. The lithium-ion battery can be recharged by the internal battery management chip (BQ25101, from Texas Instruments Inc., USA) when connected via USB. A 3.7 V, 1000 mAh battery is sufficient for operation and typically allows more than 5000 SWV acquisitions. Other XIAO modules from Seeed Studio can also be used as they are compatible (e.g., XIAO SAMD21 or XIAO ESP32S3). For instance, the XIAO ESP32S3 allows the system to give 2.4 GHz WIFI connectivity, although the current consumption is higher than that of the XIAO BLE module (up to 130 mA when using Bluetooth). A photograph of the manufacture board prototype is shown in Figure 7.
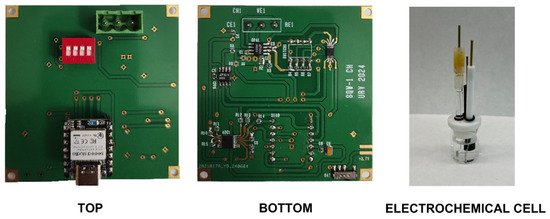
Figure 7.
Photograph of the prototype board and the electrochemical cell used in the experiments.
2.4.2. Analog Front-End
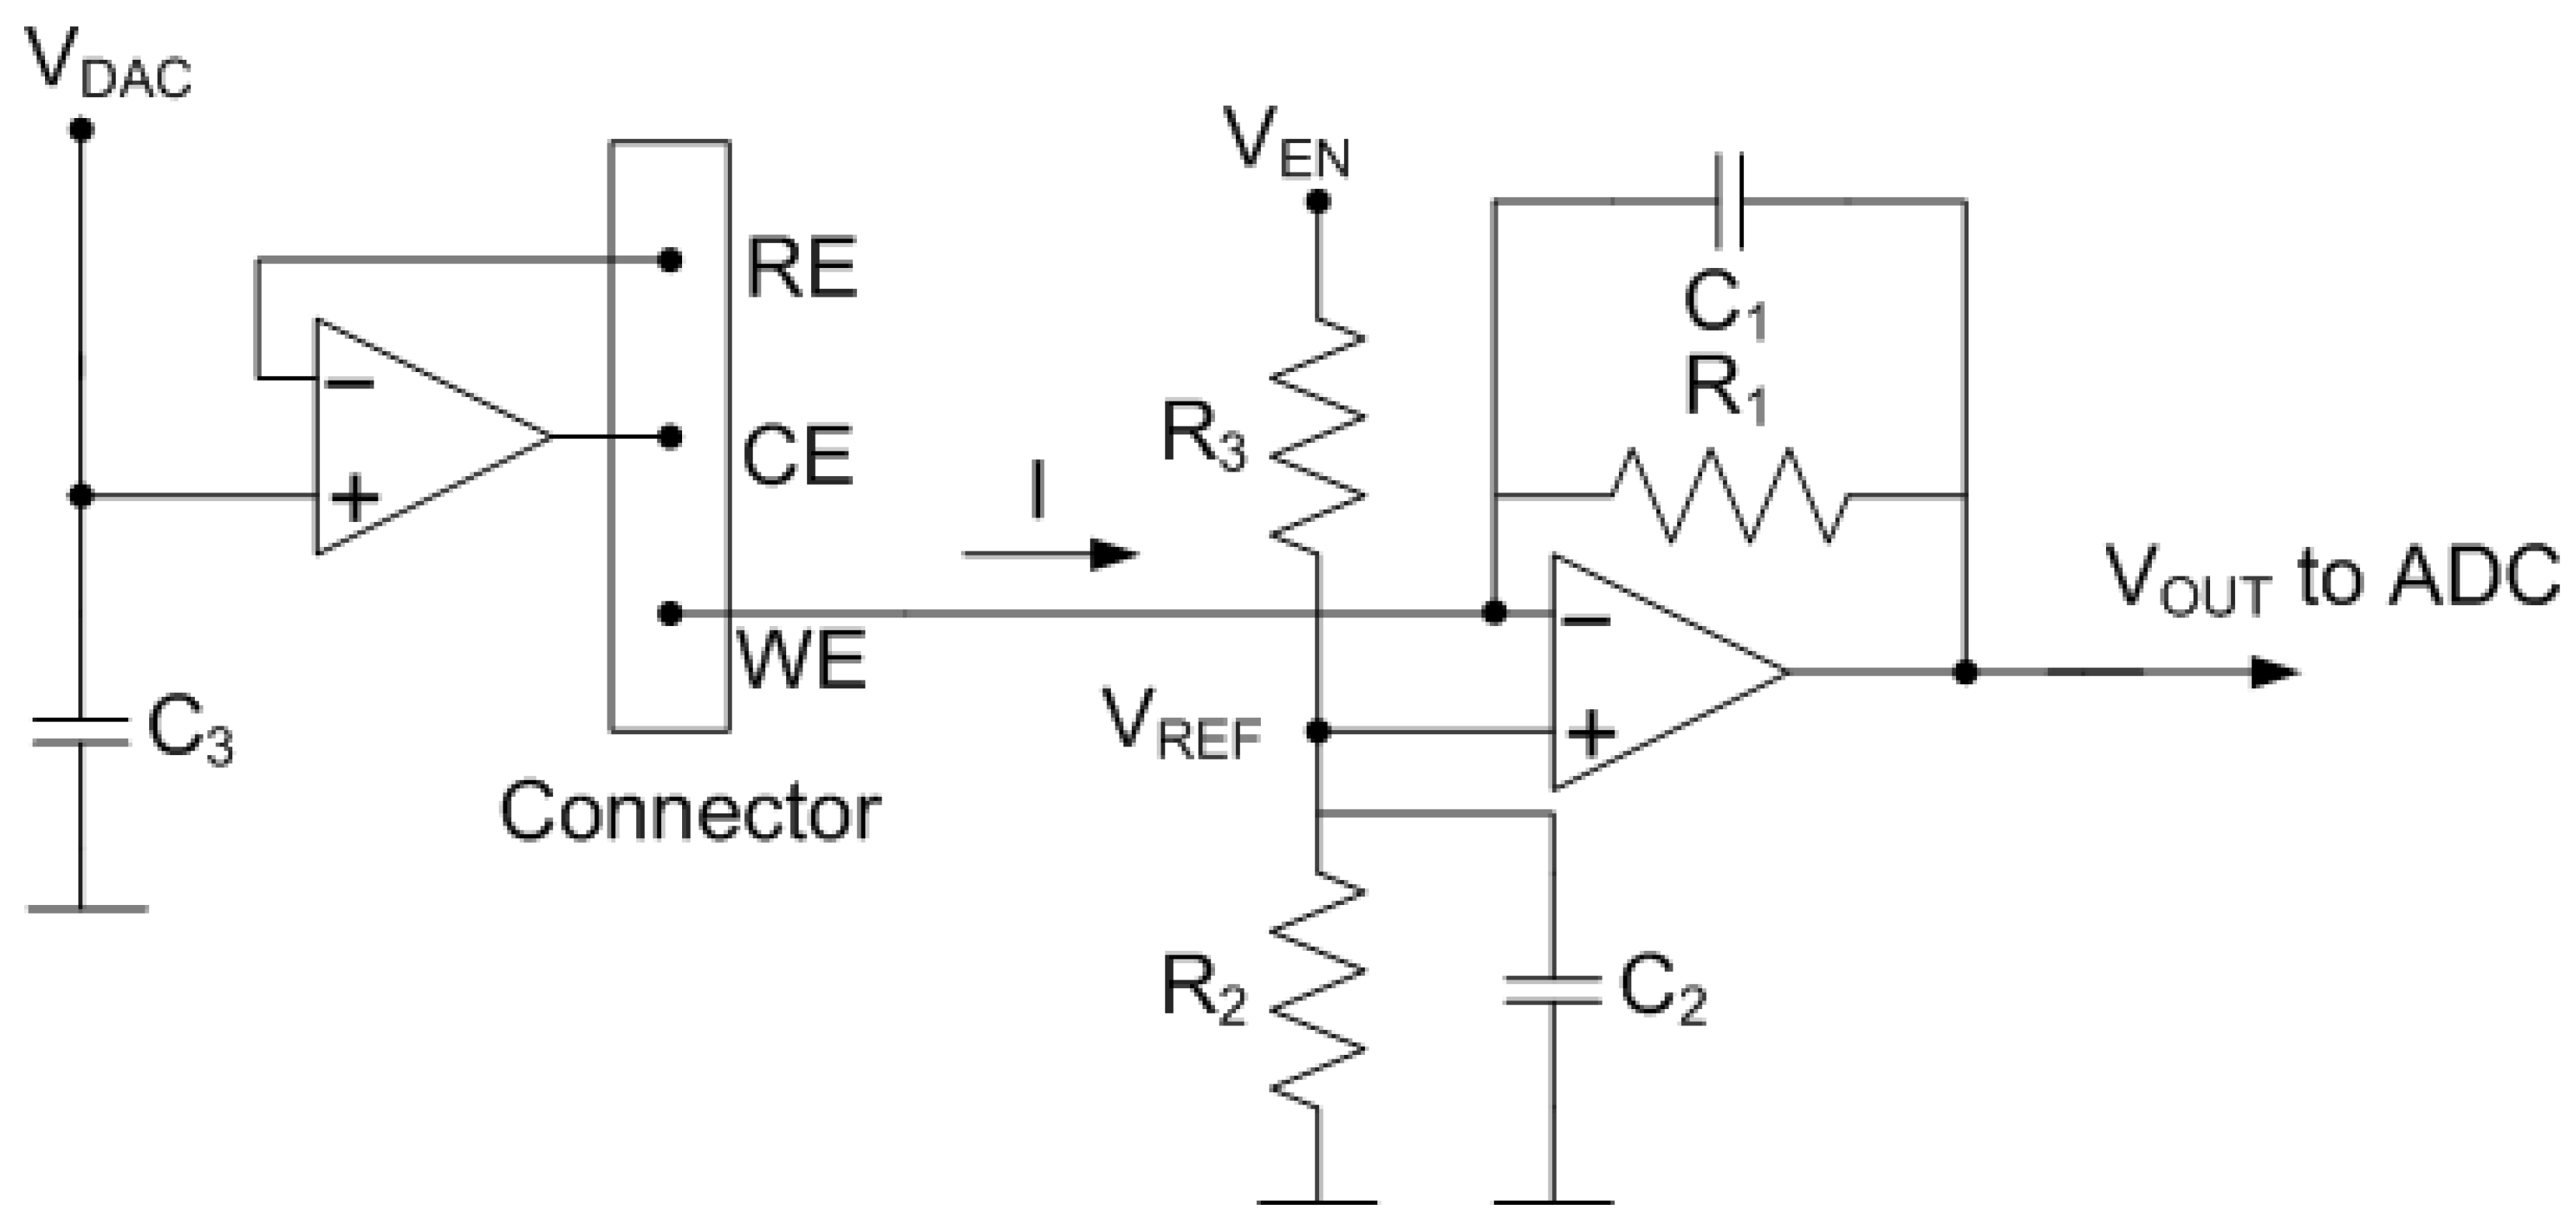
The Analog front-end (AFE), which interacts directly with the electrochemical cell, includes a potentiostat [25,26,27,28], consisting of two operational amplifiers (OpAmp) with simple biasing that allow minimizing their power consumption [29] (see Figure 8). The reference electrode voltage is adjustable from the DAC output (). In turn, the working electrode is fixed to a obtained from a resistive voltage divider connected to a digital output of the microcontroller . The second OpAmp is configured as a transimpedance amplifier (TIA). The TIA amplifies the current flowing between the CE and WE electrodes through the feedback resistance, , and converts it into an output voltage, . The advantages of this design based on OpAmps are the negligible input current, the high input impedance, and the low input offset voltage. In this work, a low-noise rail-to-rail CMOS dual OpAmp OPA2314 from Texas Instruments Inc., USA is selected. Its specifications include the following: 3 MHz gain-bandwidth product, 0.2 pA input bias current, 150 A current per channel, and operating voltages starting at 1.8 V. The DAC output () and the digital output () are triggered by the microcontroller at the same time. Bypass capacitors and of value 10 nF have been included to filter noise from the supply. is a feedback capacitor whose function is to low-pass filter the signal to reduce noise at the output. The cut-off frequency of the filter is calculated using the following expression:
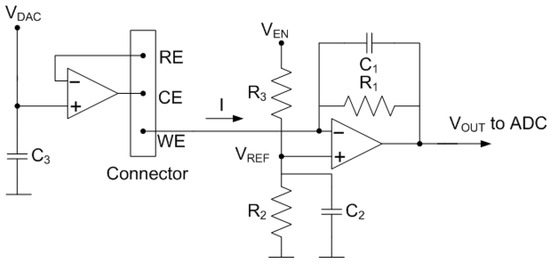
Figure 8.
Schema of the potentiostat used in the system.
Its value is selected to allow the frequency components of interest (typically 100 Hz) to pass while reducing high-frequency noise. The measured current through the working electrode I is obtained from the measured output voltage (neglecting the effect of input current and voltage offset in the TIA):
where is the voltage at the positive input of the TIA, which is equal to the WE potential since the OpAmp works in linear mode. The output voltage is discretized with a 24-bit analog-to-digital converter. The device can perform conversions at data rates up to 2000 samples-per-second (SPS) with single-cycle settling. Both the ADC and the DAC are controlled by the microcontroller via a serial peripheral interface (SPI) bus.
Table 2 summarizes the main components, including their current consumption and cost. The approximate total cost of the components for the manufacture of the prototype is USD 32. This cost is reduced by approximately 75% when ordering components in larger quantities (thousands).
Table 2.
Components.
The potentiostat can be configured to perform any of the following amperometric techniques: chronoamperometry, CV, and SWV. In the latter, the variable bias between the electrodes is obtained by programming the DAC output :
where is the voltage at the digital output of the microcontroller used to activate the bias in the potentiostat. In the prototype, we have selected . The feedback resistance, , can be chosen using a CMOS multiplexer (AD907 from Analog Devces, Wilmington, MA, USA) from four possible values (), depending on the required current range.
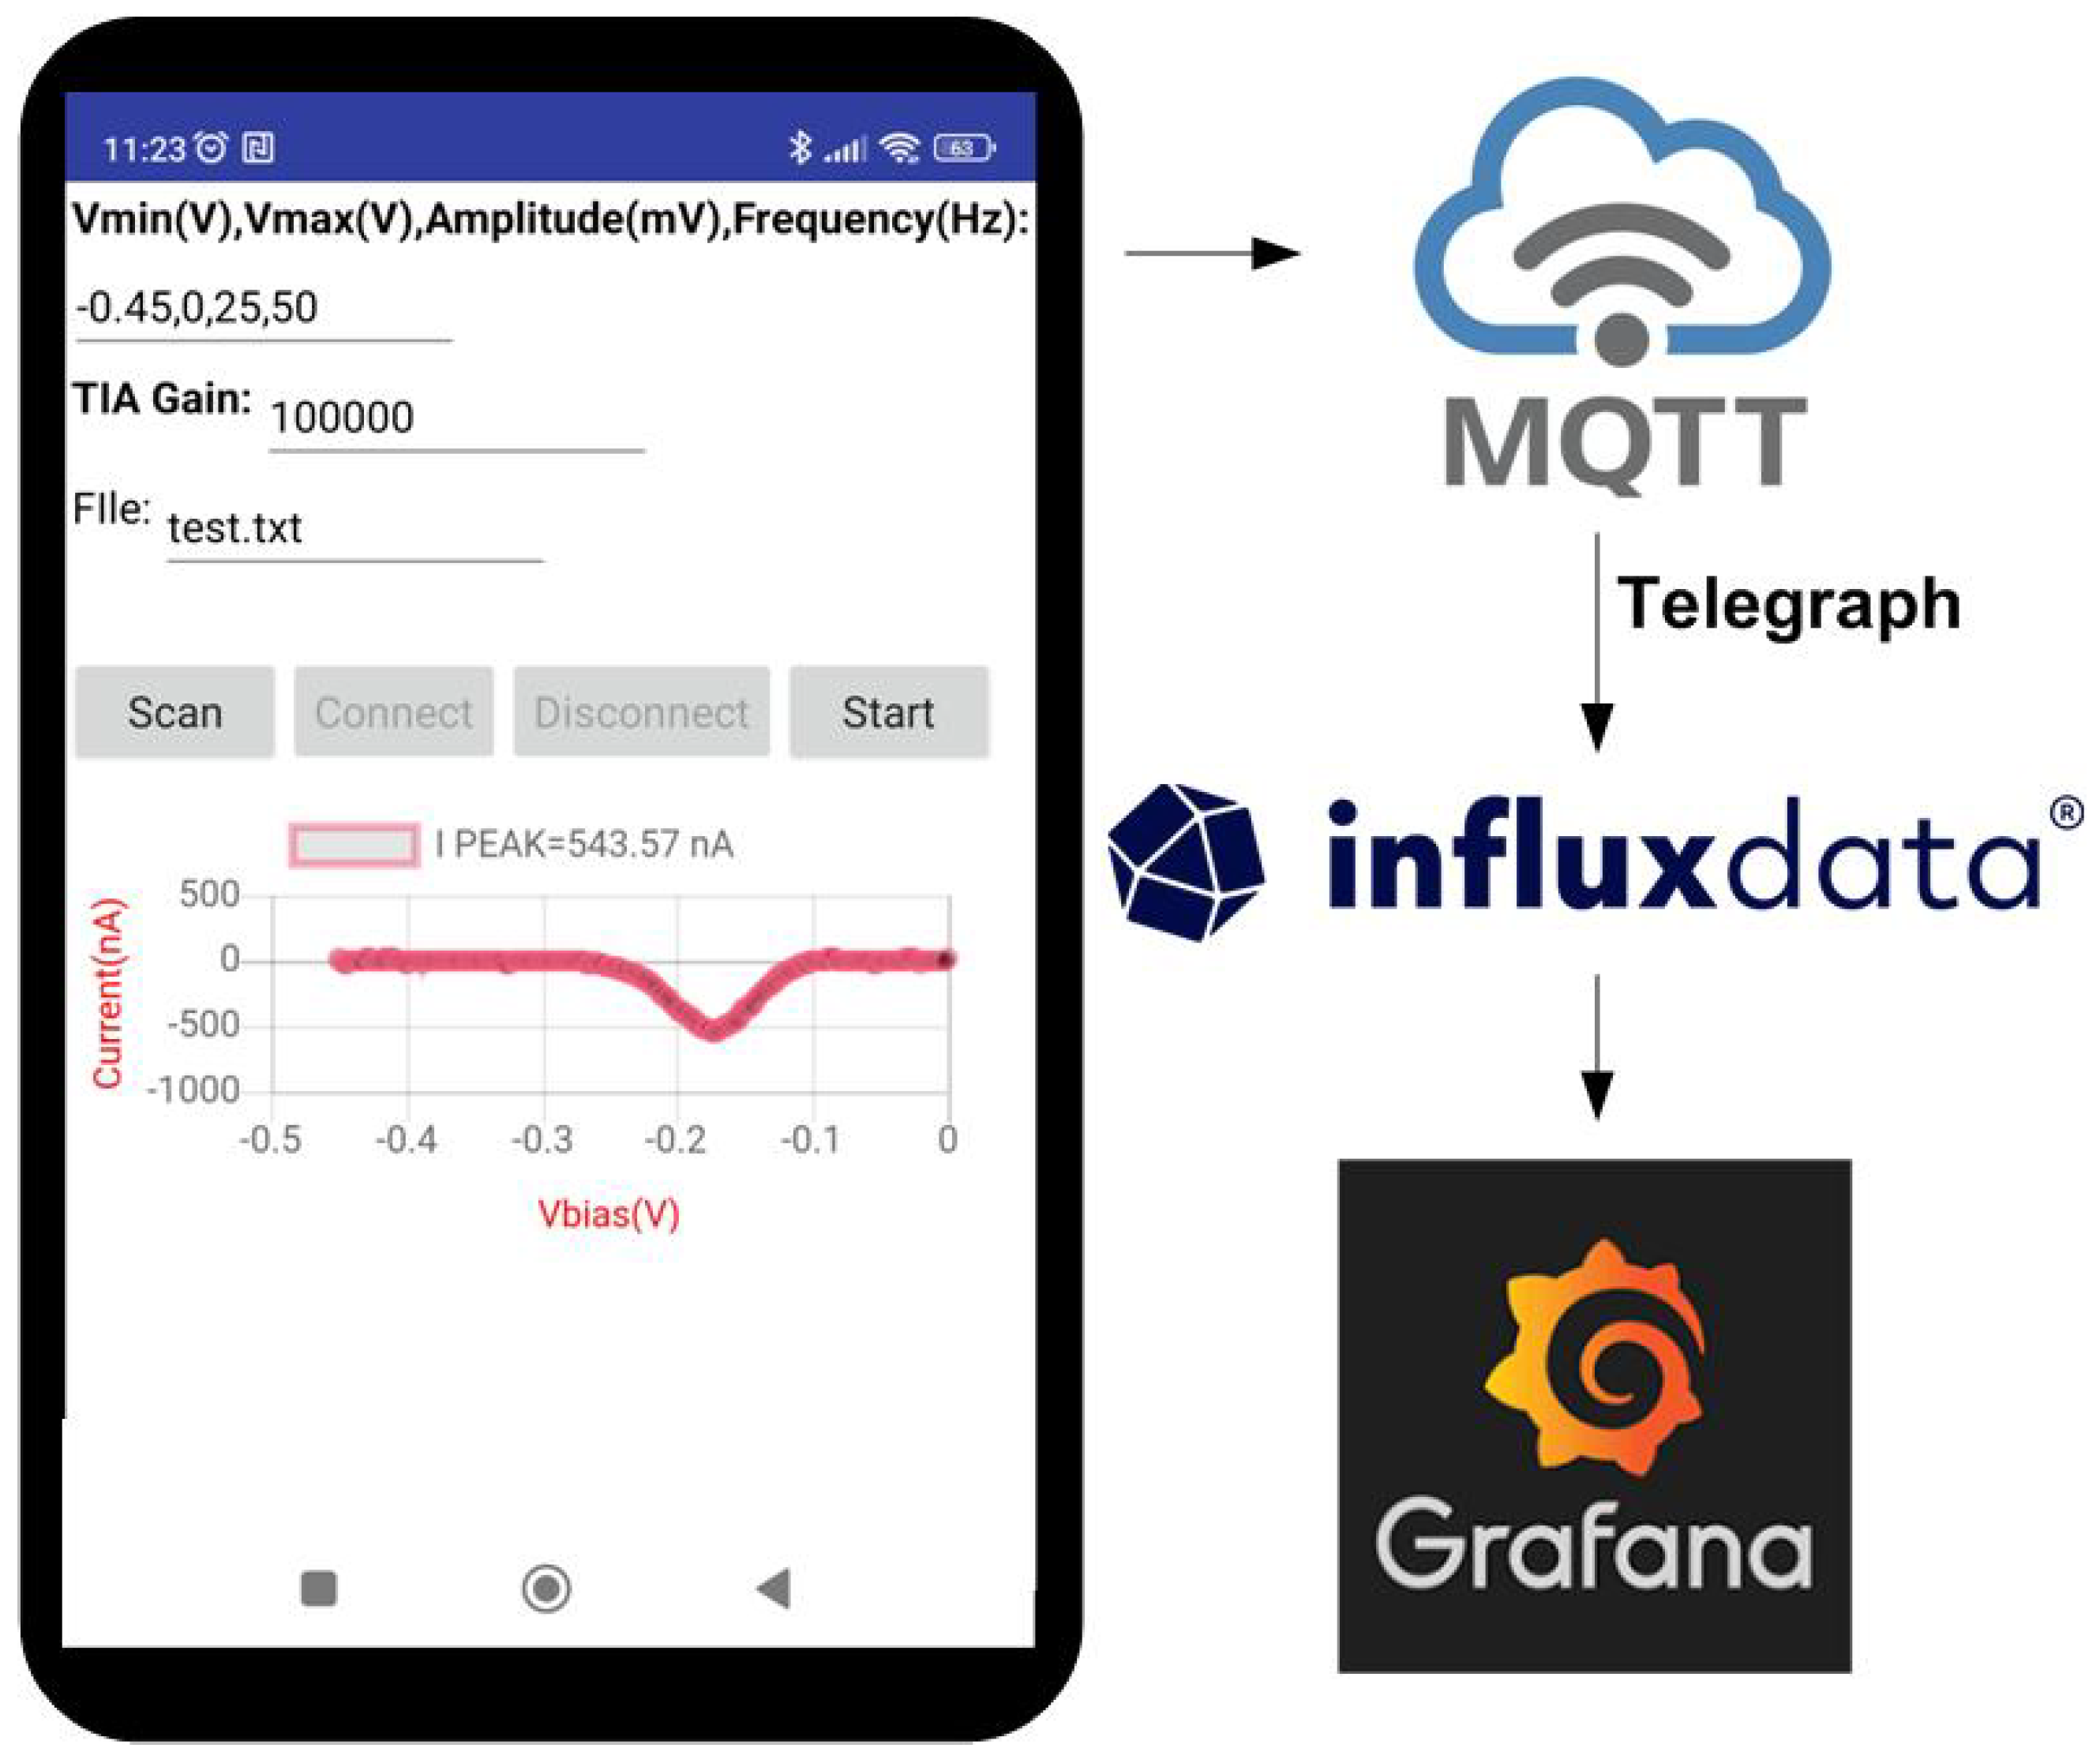
The designed board can be controlled via a universal serial bus (USB) from MATLAB or Python from a personal computer, or Bluetooth Low Energy from the smartphone. An Android app is developed to read the data, perform the calibration, and send the measured data by MQTT to a broker (see screenshot of a simple test app developed for Android in Figure 9). A number is used to identify the load cell. One topic is used for each load cell, and two subtopics were defined: one for the calibration parameters and the other for the measured data. The data are stored in a database. To this end, an influx DB database was chosen. The Grafana dashboard was chosen for data visualization. Telegraph server is used to subscribe to MQTT topics and store the data in the Influx database. A block diagram is shown in Figure 9. By using this structure, high scalable and configurable systems can be created without the need to program complicated back-end platforms.
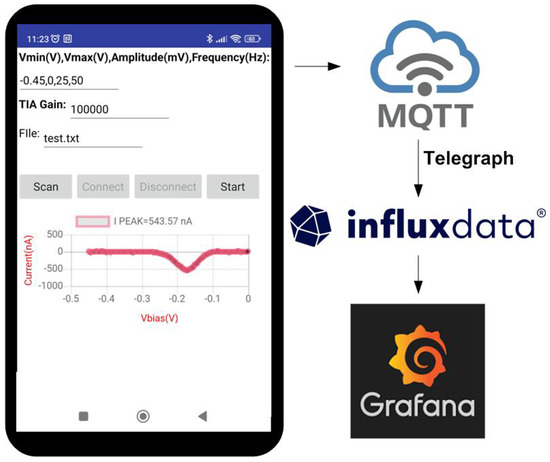
Figure 9.
Screenshot of a testing mobile app developed for Android.
3. Results and Discussion
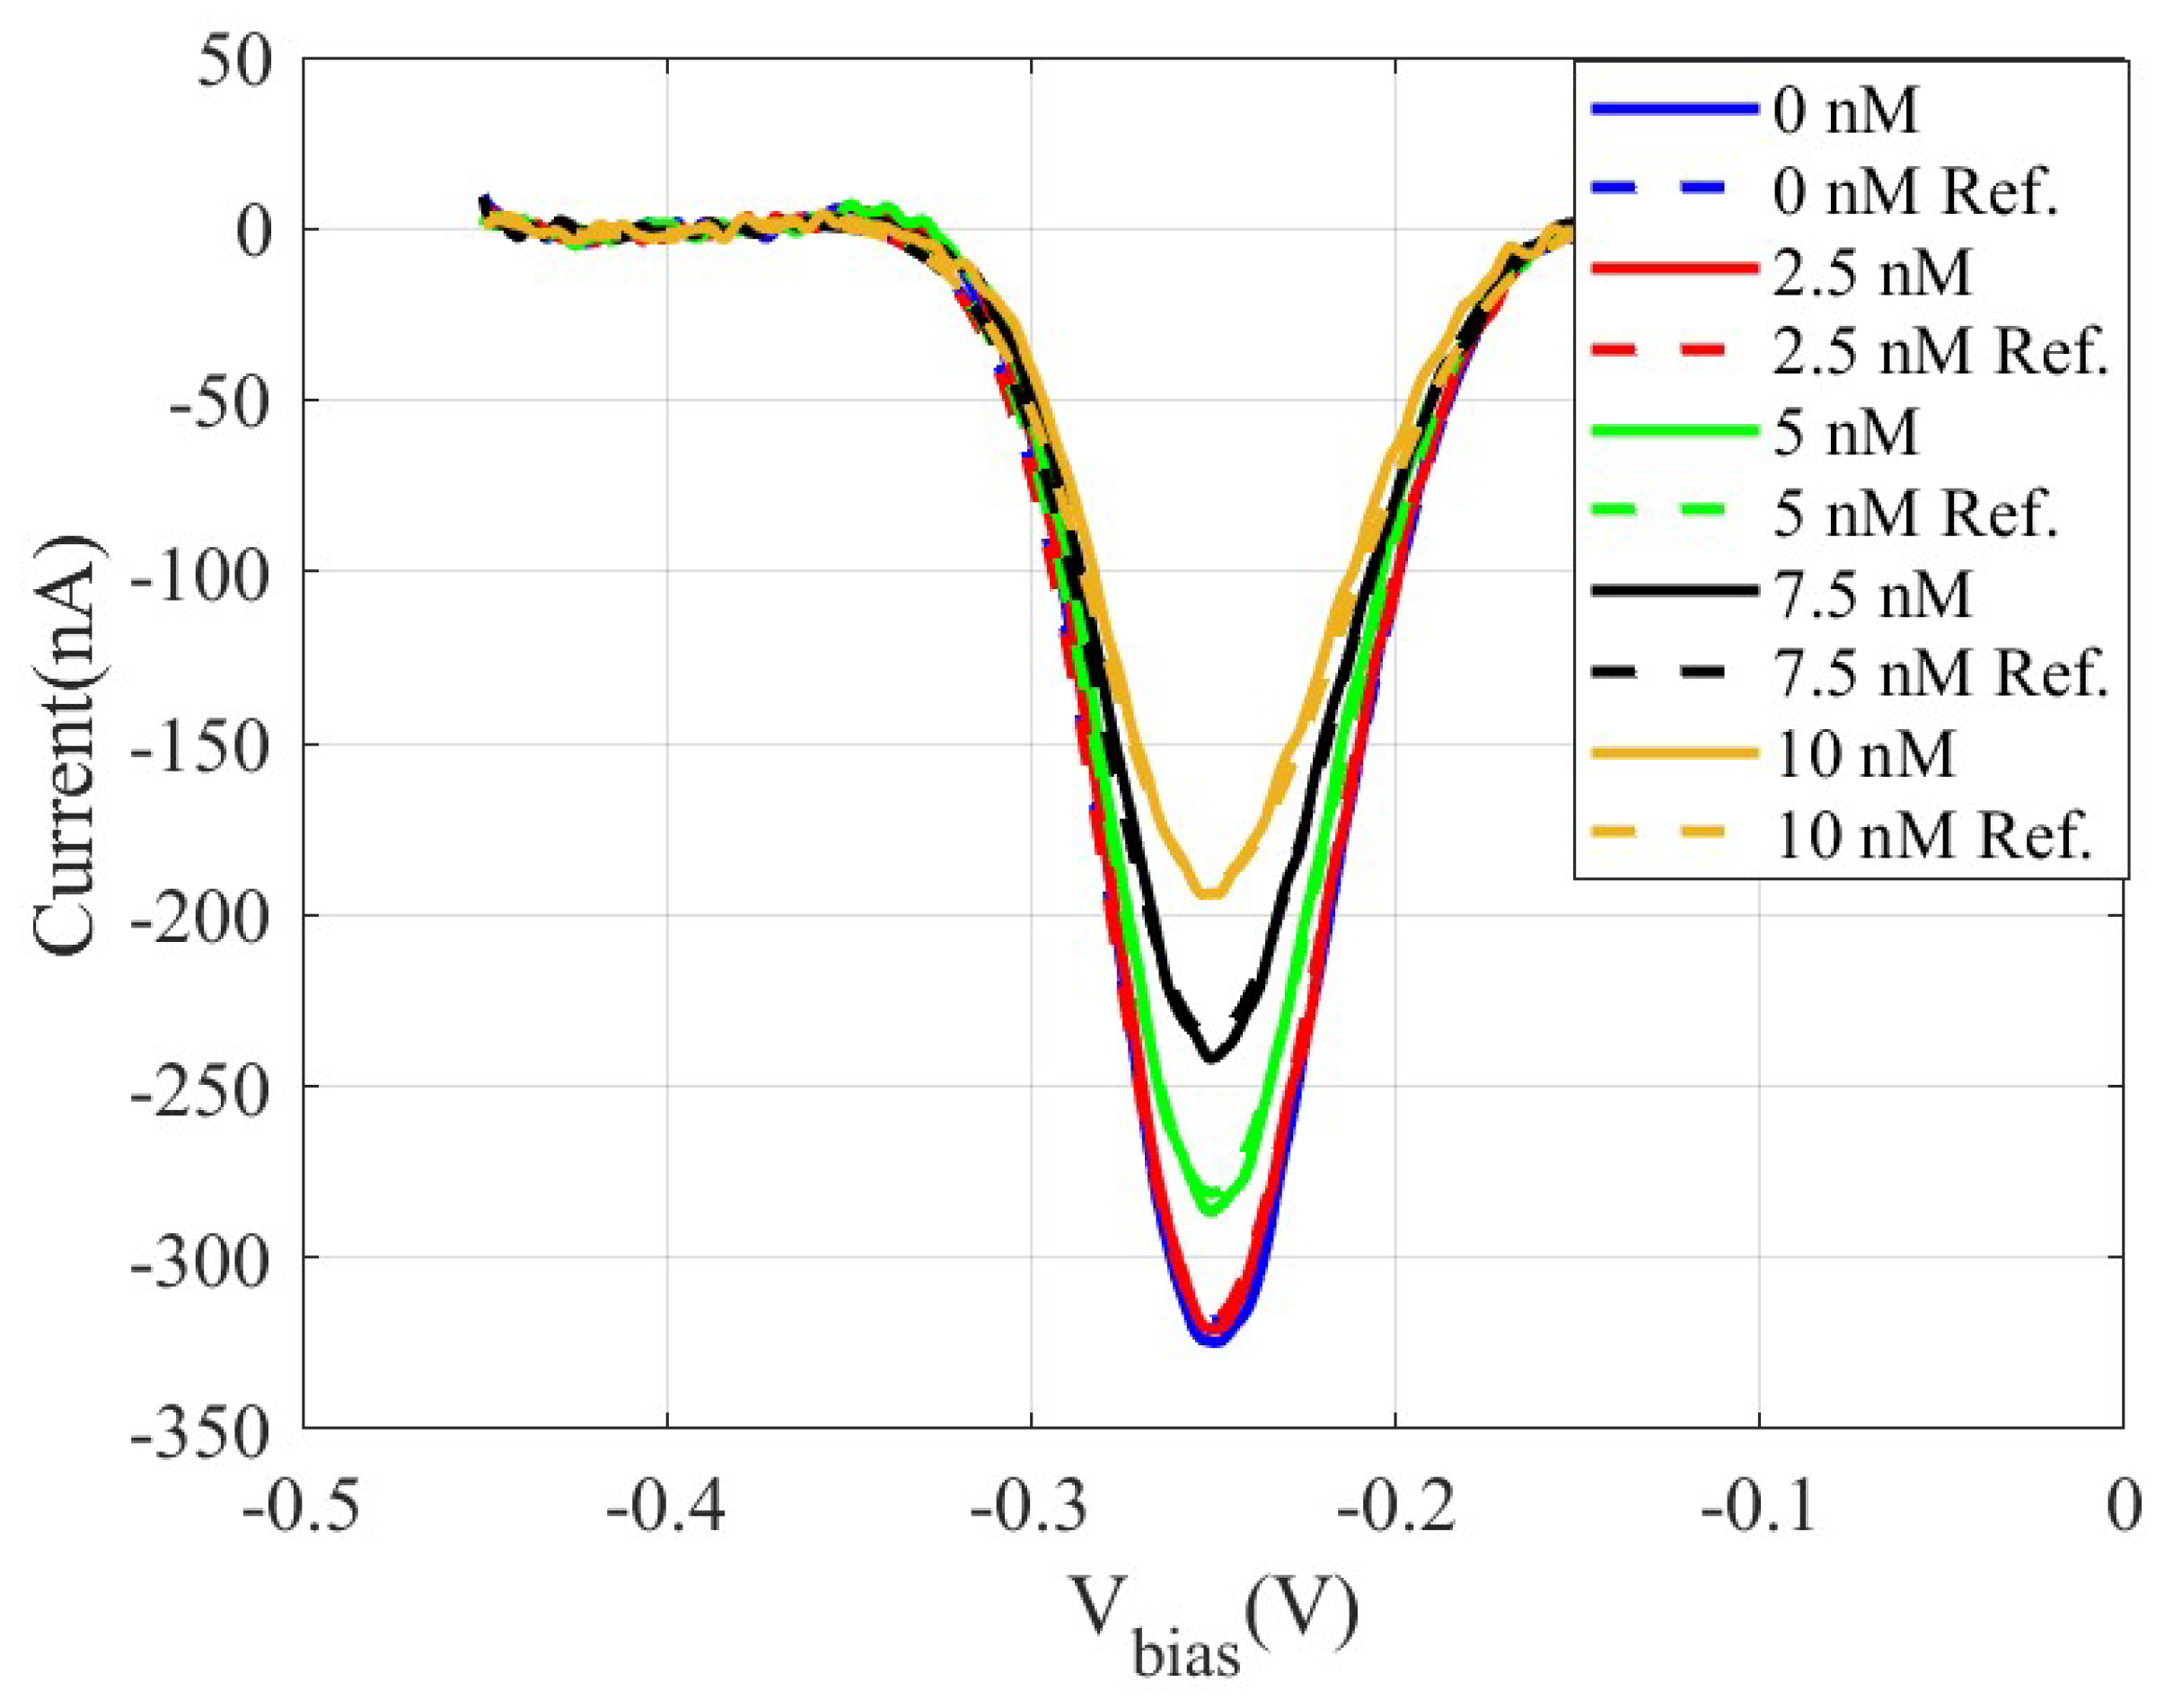
DNA sensor electrochemical response measurements are performed in a potential window of −0.1 to −0.45 V, using an amplitude of 0.025 V, a potential step of 0.003 V, and a frequency of 50 Hz. The response of the DNA sensors was calculated using the following equation:
where corresponds to the current in the presence of the target sequence and is the background current measured in PBS. For measurements, first a set of freshly prepared biosensors were interrogated at a non-target PBS solution until a stable SWV baseline signal was obtained. Then, biosensors were incubated for 1 h in the target sequence solutions prepared in PBS at concentrations of 1, 2.5, 5, and 10 nM, consecutively, followed by 3 SWV measurements for each electrode at each concentration.
Figure 10 shows the measured differential SWV current obtained using the low-cost prototype and a commercial Ivium electrochemical analyzer used as a reference, for DNA solutions whose concentrations cover a range from 2.5 nM to 10 nM. This relatively narrow concentration range was intentionally chosen to clearly demonstrate the sensitivity of the prototype, capable of distinguishing small differences in the target concentration.

Figure 10.
Measured SW voltammograms obtained using a DNA sensor by incubating solutions of the DNA target sequence at increasing concentrations using an amplitude of 0.025 V, a potential step of 0.003 V, and a frequency of 50 Hz: Proposed system (solid lines) and Ivium analyser used as reference (dashed lines).
To assess the biosensor’s selectivity and specificity, we recorded its response in PBS to two non-complementary (NC) DNA sequences and a two-base mismatched (2 bmm) sequence, each at 10 nM, and compared these to the response obtained from the complementary DNA target at the same concentration (10 nM). It should be noted that this experiment was performed exclusively using the Ivium CompactStat analyzer. The response obtained from the NC sequences was less than 10% of that obtained from the complementary DNA target, while the response from the 2 bmm sequence was less than 40% of the target response. Statistical analysis using an unpaired t-test confirmed significantly lower responses for both the NC and the 2 bmm sequences compared to the complementary DNA target, verifying excellent selectivity and specificity. Such outstanding selectivity primarily arises from the intrinsic base-pairing specificity of nucleic acids and is independent of the instrumentation used for measuring the biosensor’s response.
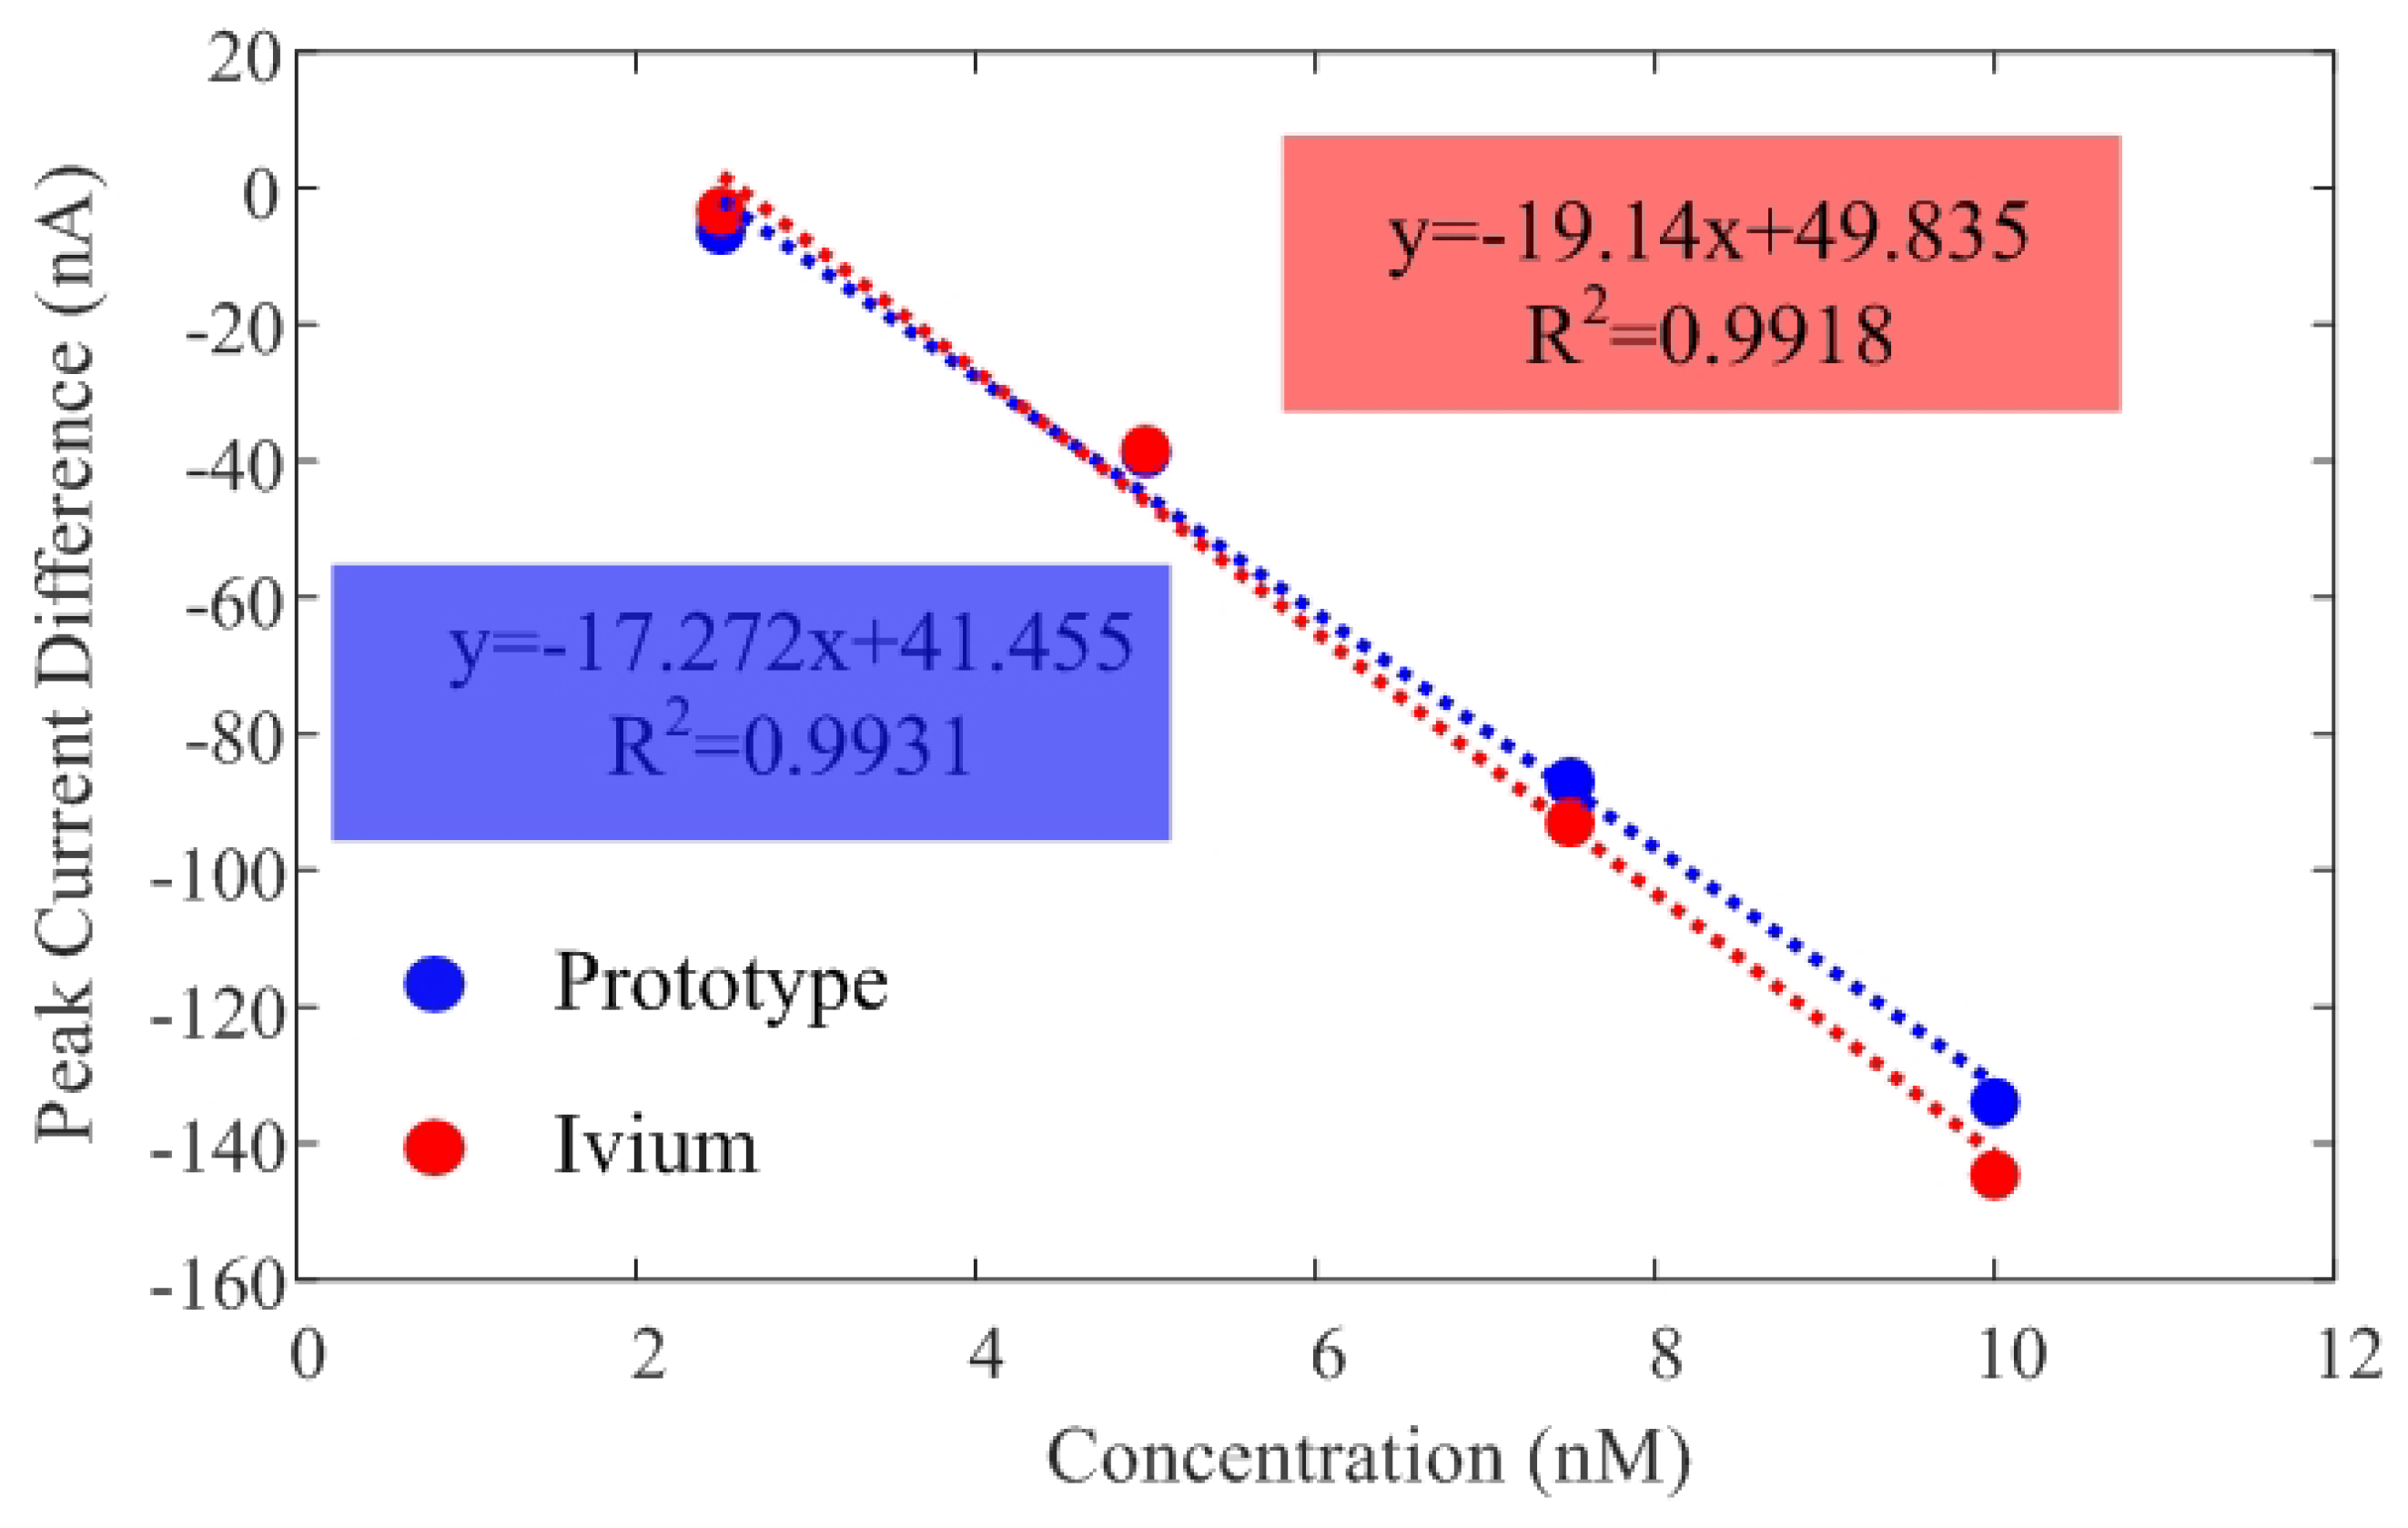
Additionally, Figure 11 illustrates the peak current difference () between the target and the background current in PBS. Currents measured with the low-cost prototype and the commercial Ivium electrochemical analyzer show good agreement. Table 3 compares the sensitivity and the limit of detection (LOD), estimated from the slope of the calibration curve and the calibration equation solver for there times the standard deviation, respectively. The Limit of Detection (LOD) obtained is approximately 2.5 nM in both systems.

Figure 11.
Calibration curves of current difference as a function of DNA concentration obtained from measurements with both the developed prototype and the Ivium CompactStat electrochemical analyzer. The regression lines and corresponding correlation coefficients are provided for each system.
Table 3.
Comparison of sensitivity and LOD between the reference system and the prototype.
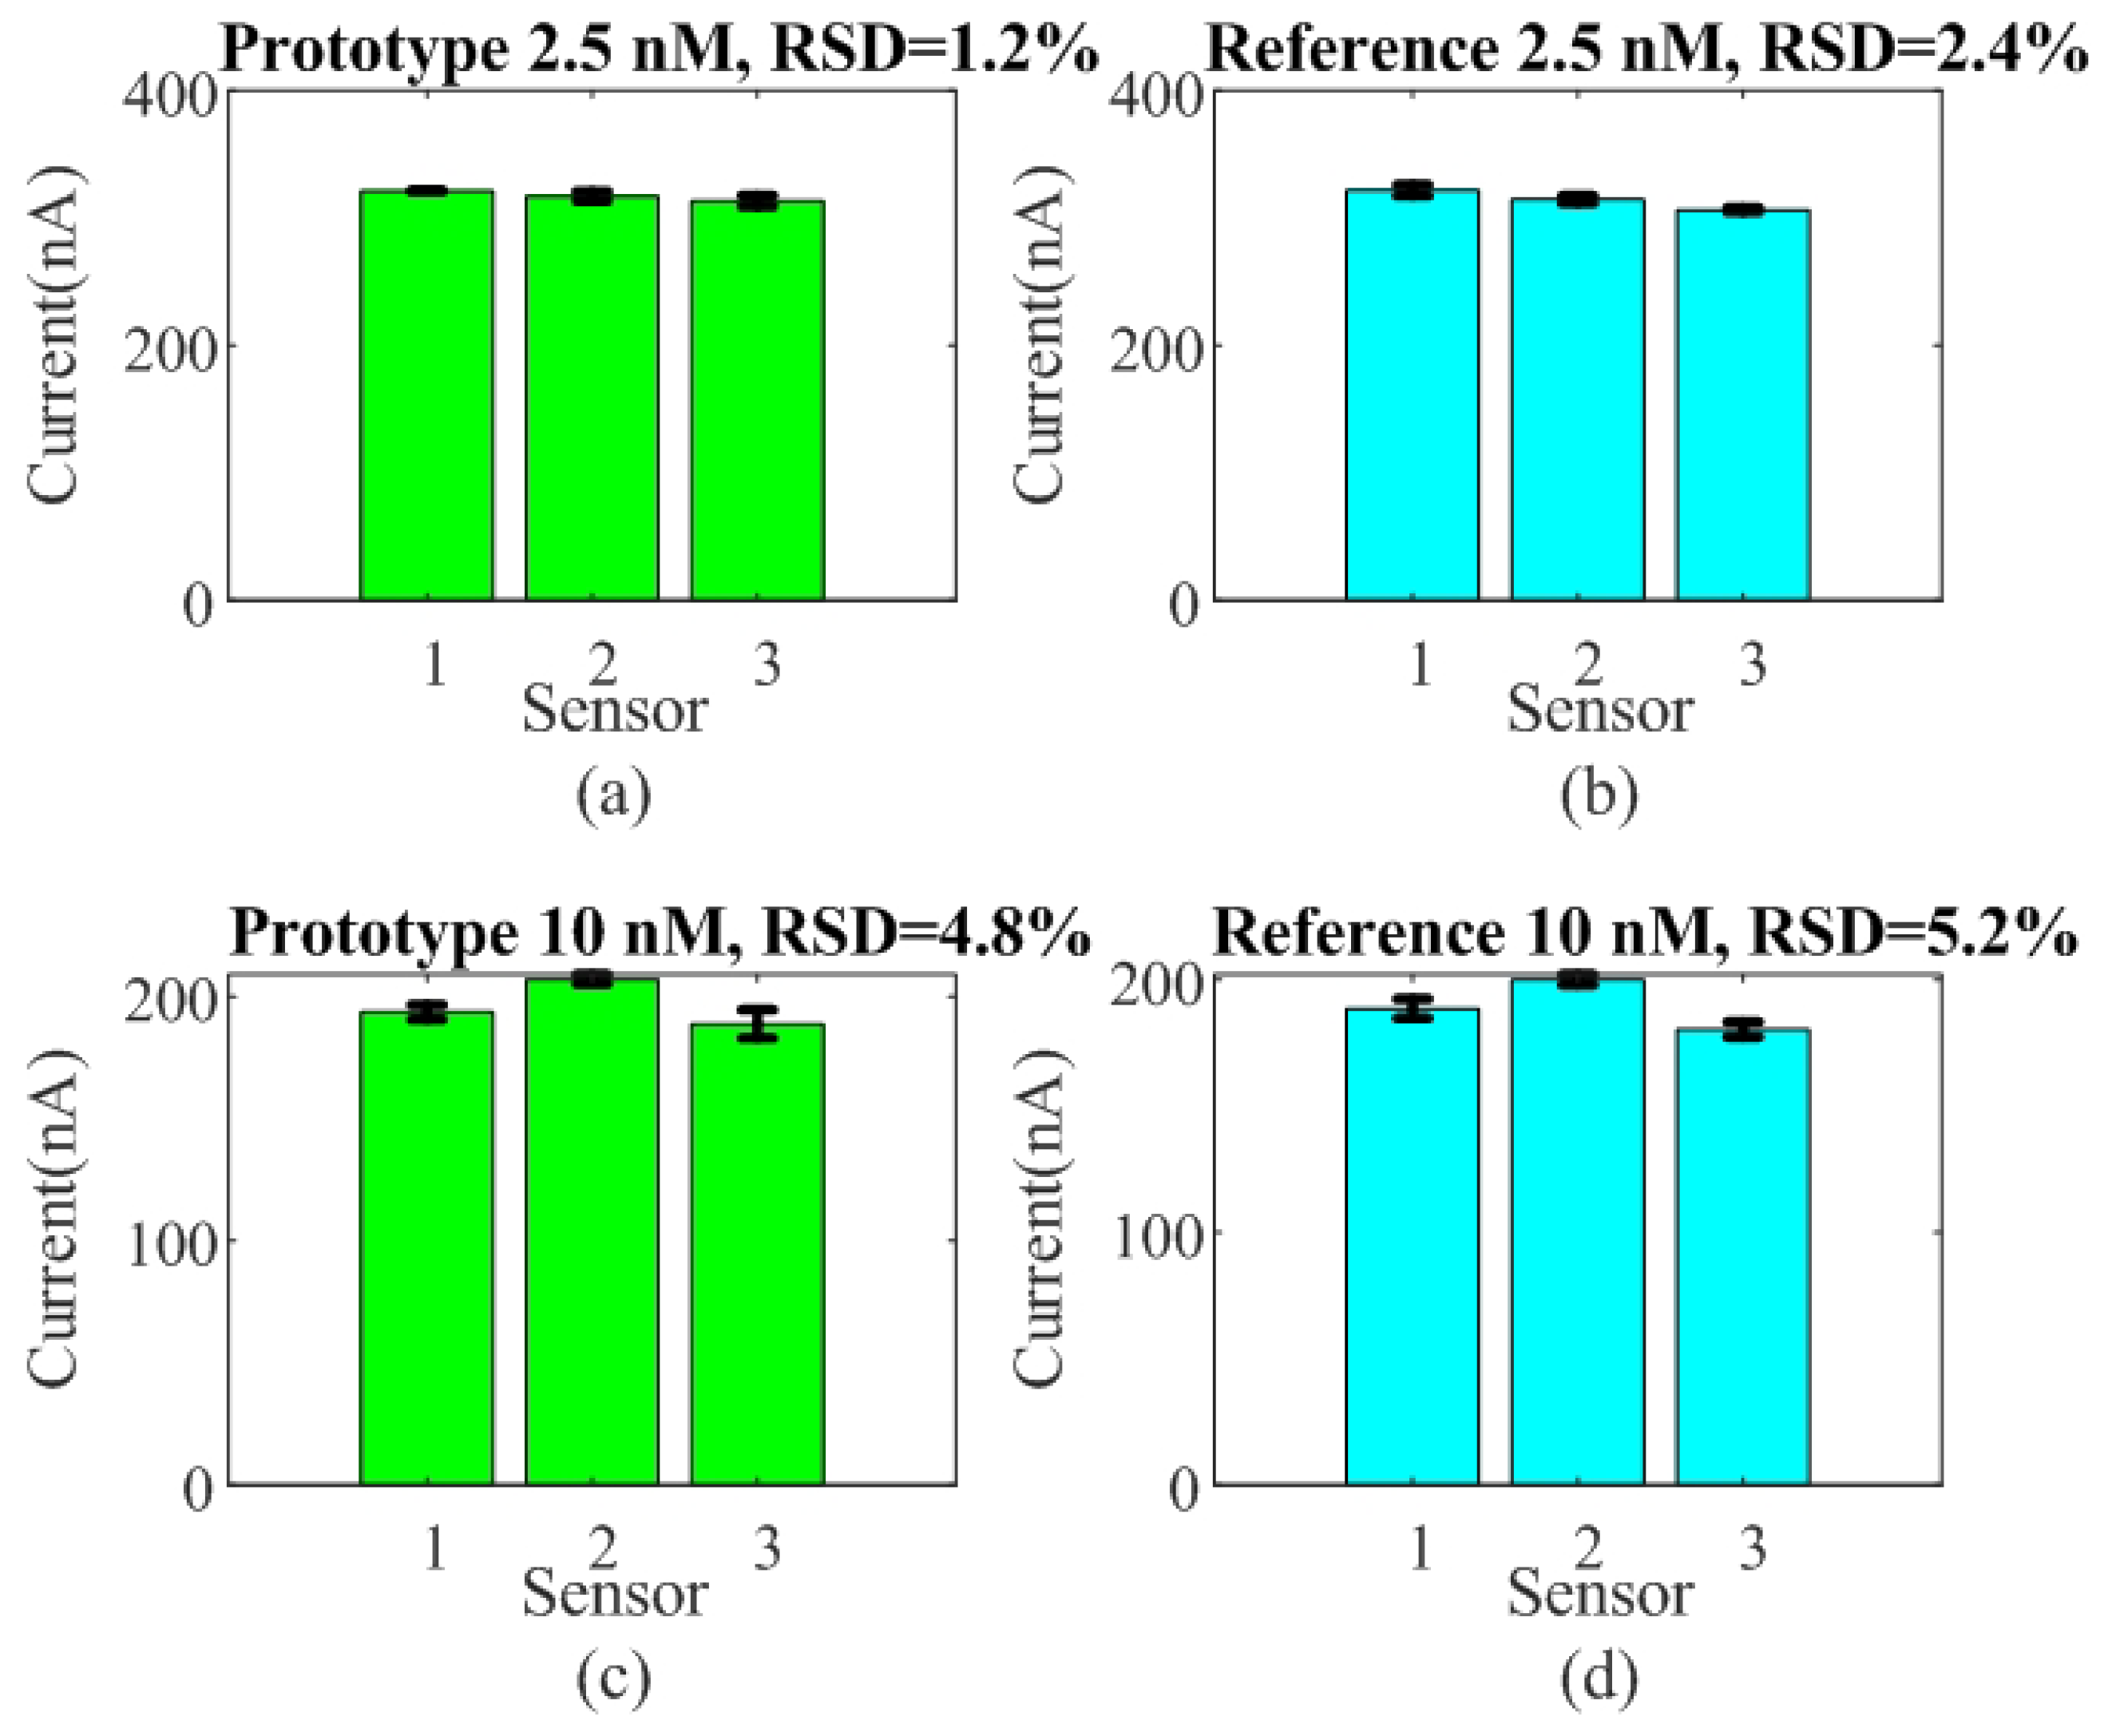
The reproducibility and repeatability of the sensor were evaluated by performing SQW measurements for detection concentrations of 2.5 nM and 10 nM of DNA within a PBS solution. For this test, three different sensors were prepared under identical conditions. Figure 12 shows the measured peak current height for the two systems, the prototype and the reference Ivium analyzer. Relative standard deviation (RSD) values of 1.2% and 2.45% at 2.5 nM, and 4.8% and 5.2% at 10 nM, respectively, were obtained. The RSD is similar for the two systems, confirming good sensor-to-sensor consistency. The repeatability between measurements, shown in Figure 13, was evaluated based on the relative standard deviation (RSD) of ten measurements between measurements for each sensor. The results show it to be less than 4%.
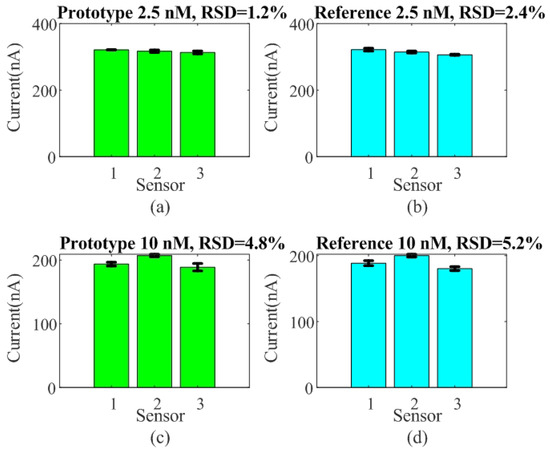
Figure 12.
Reproducibility test for three sensors. Peak current height was measured as a function of the sensor for target concentrations of 2.5 nM (a,b) and 10 nM (c,d) using both systems, the developed prototype and the commercial electrochemical analyzer Ivium CompactStat used as reference.
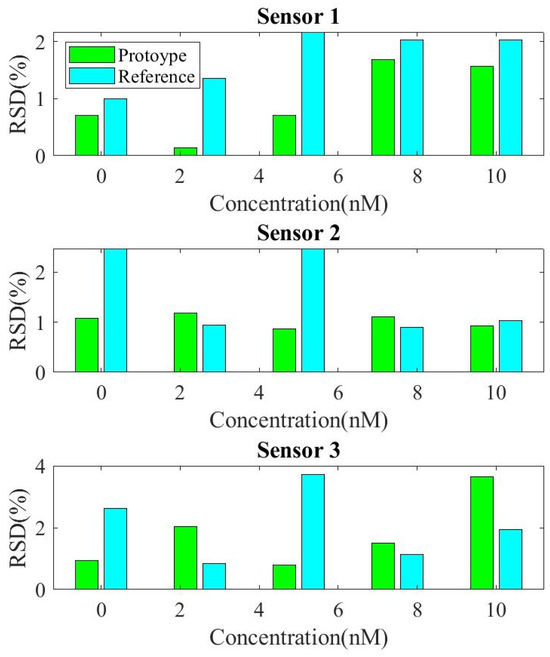
Figure 13.
Repeatability test for three sensors. Relative standard deviation (RSD) as a function of target concentration Calibration curves of current vs. DNA concentration with both systems, the developed prototype and the commercial electrochemical analyzer Ivium CompactStat.
Table 4 compares the design carried out in this work with some low-cost portable boards described in the literature. Most of them allow you to control the device from your smartphone via Bluetooth Low Energy. The main differences are the number of bits of the ADC converter and whether the microcontroller’s internal converter is used or, on the contrary, an additional one is required. Current range depends on the gain of the TIA as well as the noise level and the number of bits of the ADC. Although the values are in the order of A, they will depend on the particular application and, in the case of this work, are in the order of tens of nA. Most devices use an external DAC because most microcontrollers do not have one. The number of bits of the DAC is key for determining the resolution of both the voltage sweeps and the bias point. Except for in [30], which uses a specific potentiostat (LMP9100), discrete TIA designs based on OpAmp were used. The main difference is the measurement technique that can be performed. All of them have the option to perform chronoamperometry (CA) and CV but rarely allow SWV. The prototype proposed in this work platform can perform the signal processing on board. The latter requires ADCs capable of measuring with low noise and at higher sampling rates than in the case of CV.
Table 4.
Comparison of the state-of-the-art wireless electrochemical boards.
4. Conclusions
In this paper, a low-cost prototype with wireless communication oriented to PoCT applications integrated with a DNA sensor based on SWV measurements has been presented. Unlike other designs in the literature, the presented prototype uses dedicated ADC and DAC components to reduce noise and allow very small voltage steps in SWV scans. The signal processing is performed on board, making it suitable for use by inexperienced end-users. The prototype uses Bluetooth LE to transmit data to a mobile app, which records the measurements on a cloud platform. The results obtained are in line with those obtained with high-performance commercial electrochemical analyzers. This study demonstrates the feasibility of using this device for the sensitive quantification of low nM concentrations of a specific DNA sequence, underscoring its potential for a broad spectrum of biosensing applications.
Author Contributions
A.L., investigation, software development, writing—original draft preparation, project administration, supervision; R.V., prototype manufacturing, review; D.G., review; H.H.-H., sensor manufacturing, review and editing; B.P.-S., review and editing, supervision. All authors have read and agreed to the published version of the manuscript.
Funding
This work was funded by the Spanish Government grant PID2021-122399OB-I00 by MCIN/AEI/10.13039/501100011033 and FEDER, UE; TED2021-130307B-I00 by MCIN/AEI/10.13039/501100011033 and European Union NextGenerationEU/PRTR.
Institutional Review Board Statement
Not applicable.
Informed Consent Statement
Not applicable.
Data Availability Statement
The data presented in this study are available on request from the corresponding author.
Conflicts of Interest
The authors declare no conflicts of interest.
References
- Mirceski, V.; Komorsky-Lovric, S.; Lovric, M. Square-Wave Voltammetry: Theory and Application; Springer Science & Business Media: Berlin/Heidelberg, Germany, 2007. [Google Scholar] [CrossRef]
- Mirceski, V.; Gulaboski, R. Recent achievements in square-wave voltammetry (a review). Maced. J. Chem. Chem. Eng. 2014, 33, 1–12. [Google Scholar] [CrossRef]
- Abu Shama, N.; Aşır, S.; Ozsoz, M.; Göktürk, I.; Türkmen, D.; Yılmaz, F.; Denizli, A. Gold-modified molecularly imprinted N-Methacryloyl-(L)-phenylalanine-containing electrodes for electrochemical detection of dopamine. Bioengineering 2022, 9, 87. [Google Scholar] [CrossRef]
- Guillem, P.; Bustos, R.H.; Garzon, V.; Munoz, A.; Juez, G. A low-cost electrochemical biosensor platform for C-reactive protein detection. Sens. Bio-Sens. Res. 2021, 31, 100402. [Google Scholar] [CrossRef]
- Msagati, T.A.; Ngila, J. Voltammetric detection of sulfonamides at a poly(3-methylthiophene) electrode. Talanta 2002, 58, 605–610. [Google Scholar] [CrossRef]
- Shaw, J.L. Practical challenges related to point of care testing. Pract. Lab. Med. 2016, 4, 22–29. [Google Scholar] [CrossRef]
- Kulkarni, M.B.; Rajagopal, S.; Prieto-Simón, B.; Pogue, B.W. Recent advances in smart wearable sensors for continuous human health monitoring. Talanta 2024, 272, 125817. [Google Scholar] [CrossRef] [PubMed]
- Xing, G.; Ai, J.; Wang, N.; Pu, Q. Recent progress of smartphone-assisted microfluidic sensors for point of care testing. TrAC Trends Anal. Chem. 2022, 157, 116792. [Google Scholar] [CrossRef]
- Lazaro, A.; Villarino, R.; Lazaro, M.; Canellas, N.; Prieto-Simon, B.; Girbau, D. Recent Advances in Batteryless NFC Sensors for Chemical Sensing and Biosensing. Biosensors 2023, 13, 775. [Google Scholar] [CrossRef]
- Gürsan, K.A.E.; Şentürk, M.H.; Göz, E.Y.; Maral, M.; Yildirim, A.; Bozoğlu, A.; Kivrak, B.; Ay, N.C. Electrochemical DNA biosensors developed for the monitoring of biointeractions with drugs: A review. Turk. J. Chem. 2023, 47, 864–887. [Google Scholar] [CrossRef]
- Wu, J.; Liu, H.; Chen, W.; Ma, B.; Ju, H. Device integration of electrochemical biosensors. Nat. Rev. Bioeng. 2023, 1, 346–360. [Google Scholar] [CrossRef]
- Ricci, F.; Plaxco, K.W. E-DNA sensors for convenient, label-free electrochemical detection of hybridization. Microchim. Acta 2008, 163, 149–155. [Google Scholar] [CrossRef]
- He, B.; Zhao, Z.; Cai, Q.; Zhang, Y.; Zhang, P.; Shi, S.; Xie, H.; Peng, X.; Yin, W.; Tao, Y.; et al. miRNA-based biomarkers, therapies, and resistance in Cancer. Int. J. Biol. Sci. 2020, 16, 2628. [Google Scholar] [CrossRef] [PubMed]
- Chin, G.P.; Guo, K.; Vasani, R.; Voelcker, N.H.; Prieto-Simón, B. Carbon-stabilized porous silicon biosensor for the ultrasensitive label-free electrochemical detection of bacterial RNA gene fragments. Biosens. Bioelectron. X 2024, 16, 100438. [Google Scholar] [CrossRef]
- Osteryoung, J.G.; Osteryoung, R.A. Square wave voltammetry. Anal. Chem. 1985, 57, 101–110. [Google Scholar] [CrossRef]
- Ramaley, L.; Krause, M.S. Theory of square wave voltammetry. Anal. Chem. 1969, 41, 1362–1365. [Google Scholar] [CrossRef]
- Mirceski, V.; Skrzypek, S.; Stojanov, L. Square-wave voltammetry. ChemTexts 2018, 4, 17. [Google Scholar] [CrossRef]
- Yi, Z.; Kun-Lin, Y. Quantitative detection of phenol in wastewater using square wave voltammetry with pre-concentration. Anal. Chim. Acta 2021, 1178, 338788. [Google Scholar] [CrossRef] [PubMed]
- Guziejewski, D. Electrode mechanisms with coupled chemical reaction—Amplitude effect in square-wave voltammetry. J. Electroanal. Chem. 2020, 870, 114186. [Google Scholar] [CrossRef]
- Haji-Hashemi, H.; Norouzi, P.; Safarnejad, M.R.; Ganjali, M.R. Label-free electrochemical immunosensor for direct detection of Citrus tristeza virus using modified gold electrode. Sens. Actuators B Chem. 2017, 244, 211–216. [Google Scholar] [CrossRef]
- Kang, D.; Zuo, X.; Yang, R.; Xia, F.; Plaxco, K.W.; White, R.J. Comparing the properties of electrochemical-based DNA sensors employing different redox tags. Anal. Chem. 2009, 81, 9109–9113. [Google Scholar] [CrossRef]
- Golub, G.H.; Van Loan, C.F. Matrix Computations; Johns Hopkins Studies in the Mathematical Sciences; Johns Hopkins University Press: Baltimore, MD, USA, 2013. [Google Scholar]
- Somerson, J.; Plaxco, K.W. Electrochemical aptamer-based sensors for rapid point-of-use monitoring of the mycotoxin ochratoxin a directly in a food stream. Molecules 2018, 23, 912. [Google Scholar] [CrossRef] [PubMed]
- Hua, H.; Liu, Y.; Guan, X.; Li, Y. DNA nanosensors based on the use of single gold nanowire electrodes and methylene blue as an intercalator. Microchim. Acta 2018, 185, 152. [Google Scholar] [CrossRef]
- Rowe, A.A.; Bonham, A.J.; White, R.J.; Zimmer, M.P.; Yadgar, R.J.; Hobza, T.M.; Honea, J.W.; Ben-Yaacov, I.; Plaxco, K.W. Cheapstat: An open-source,“do-it-yourself” potentiostat for analytical and educational applications. PLoS ONE 2011, 6, e23783. [Google Scholar] [CrossRef]
- Ainla, A.; Mousavi, M.P.; Tsaloglou, M.N.; Redston, J.; Bell, J.G.; Fernandez-Abedul, M.T.; Whitesides, G.M. Open-source potentiostat for wireless electrochemical detection with smartphones. Anal. Chem. 2018, 90, 6240–6246. [Google Scholar] [CrossRef]
- Aznar-Poveda, J.; Lopez-Pastor, J.A.; Garcia-Sanchez, A.J.; Garcia-Haro, J.; Otero, T.F. A cots-based portable system to conduct accurate substance concentration measurements. Sensors 2018, 18, 539. [Google Scholar] [CrossRef] [PubMed]
- Pérez, P.; Huertas, G.; Maldonado-Jacobi, A.; Martín, M.; Serrano, J.A.; Olmo, A.; Daza, P.; Yúfera, A. Sensing cell-culture assays with low-cost circuitry. Sci. Rep. 2018, 8, 8841. [Google Scholar] [CrossRef]
- Lazaro, A.; Villarino, R.; Lazaro, M.; Canellas, N.; Prieto-Simon, B.; Girbau, D. Battery-Less NFC Potentiostat for Electrochemical Point-of-Care Sensors Based on COTS Components. Sensors 2022, 22, 7213. [Google Scholar] [CrossRef]
- Dieffenderfer, J.; Wilkins, M.; Hood, C.; Beppler, E.; Daniele, M.A.; Bozkurt, A. Towards a sweat-based wireless and wearable electrochemical sensor. In Proceedings of the 2016 IEEE Sensors, Orlando, FL, USA, 30 October–3 November 2016; pp. 1–3. [Google Scholar] [CrossRef]
- da Costa, J.P.d.C.; Bastos, W.B.; Da Costa, P.I.; Zaghete, M.A.; Longo, E.; Carmo, J.P. Portable laboratory platform with electrochemical biosensors for immunodiagnostic of hepatitis C virus. IEEE Sens. J. 2019, 19, 10701–10709. [Google Scholar] [CrossRef]
- Lopin, P.; Lopin, K.V. PSoC-Stat: A single chip open source potentiostat based on a Programmable System on a Chip. PLoS ONE 2018, 13, e0201353. [Google Scholar] [CrossRef]
- Ahmad, R.; Surya, S.G.; Sales, J.B.; Mkaouar, H.; Catunda, S.Y.C.; Belfort, D.R.; Lei, Y.; Wang, Z.L.; Baeumner, A.; Wolfbeis, O.S.; et al. KAUSTat: A wireless, wearable, open-source potentiostat for electrochemical measurements. In Proceedings of the 2019 IEEE SENSORS, Montreal, QC, Canada, 27–30 October 2019; pp. 1–4. [Google Scholar] [CrossRef]
- Sarkar, S.; Bhattacharya, M. SStat: Wi-Fi and Bluetooth integrated Multimodal “Do-It-Yourself” Electrochemical Potentiostat. In Proceedings of the IECON 2020 The 46th Annual Conference of the IEEE Industrial Electronics Society, Singapore, 18–21 October 2020; pp. 5249–5254. [Google Scholar] [CrossRef]


Disclaimer/Publisher’s Note: The statements, opinions and data contained in all publications are solely those of the individual author(s) and contributor(s) and not of MDPI and/or the editor(s). MDPI and/or the editor(s) disclaim responsibility for any injury to people or property resulting from any ideas, methods, instructions or products referred to in the content. |
© 2025 by the authors. Licensee MDPI, Basel, Switzerland. This article is an open access article distributed under the terms and conditions of the Creative Commons Attribution (CC BY) license (https://creativecommons.org/licenses/by/4.0/).