A NO2 Sensitive MnO2/Graphene Oxide Composite Based Gas Sensor

 , ,
, ,  , ,
, ,  and
and 
Abstract
1. Introduction
2. Materials and Methods
2.1. Preparation of MnO2/GO Composite
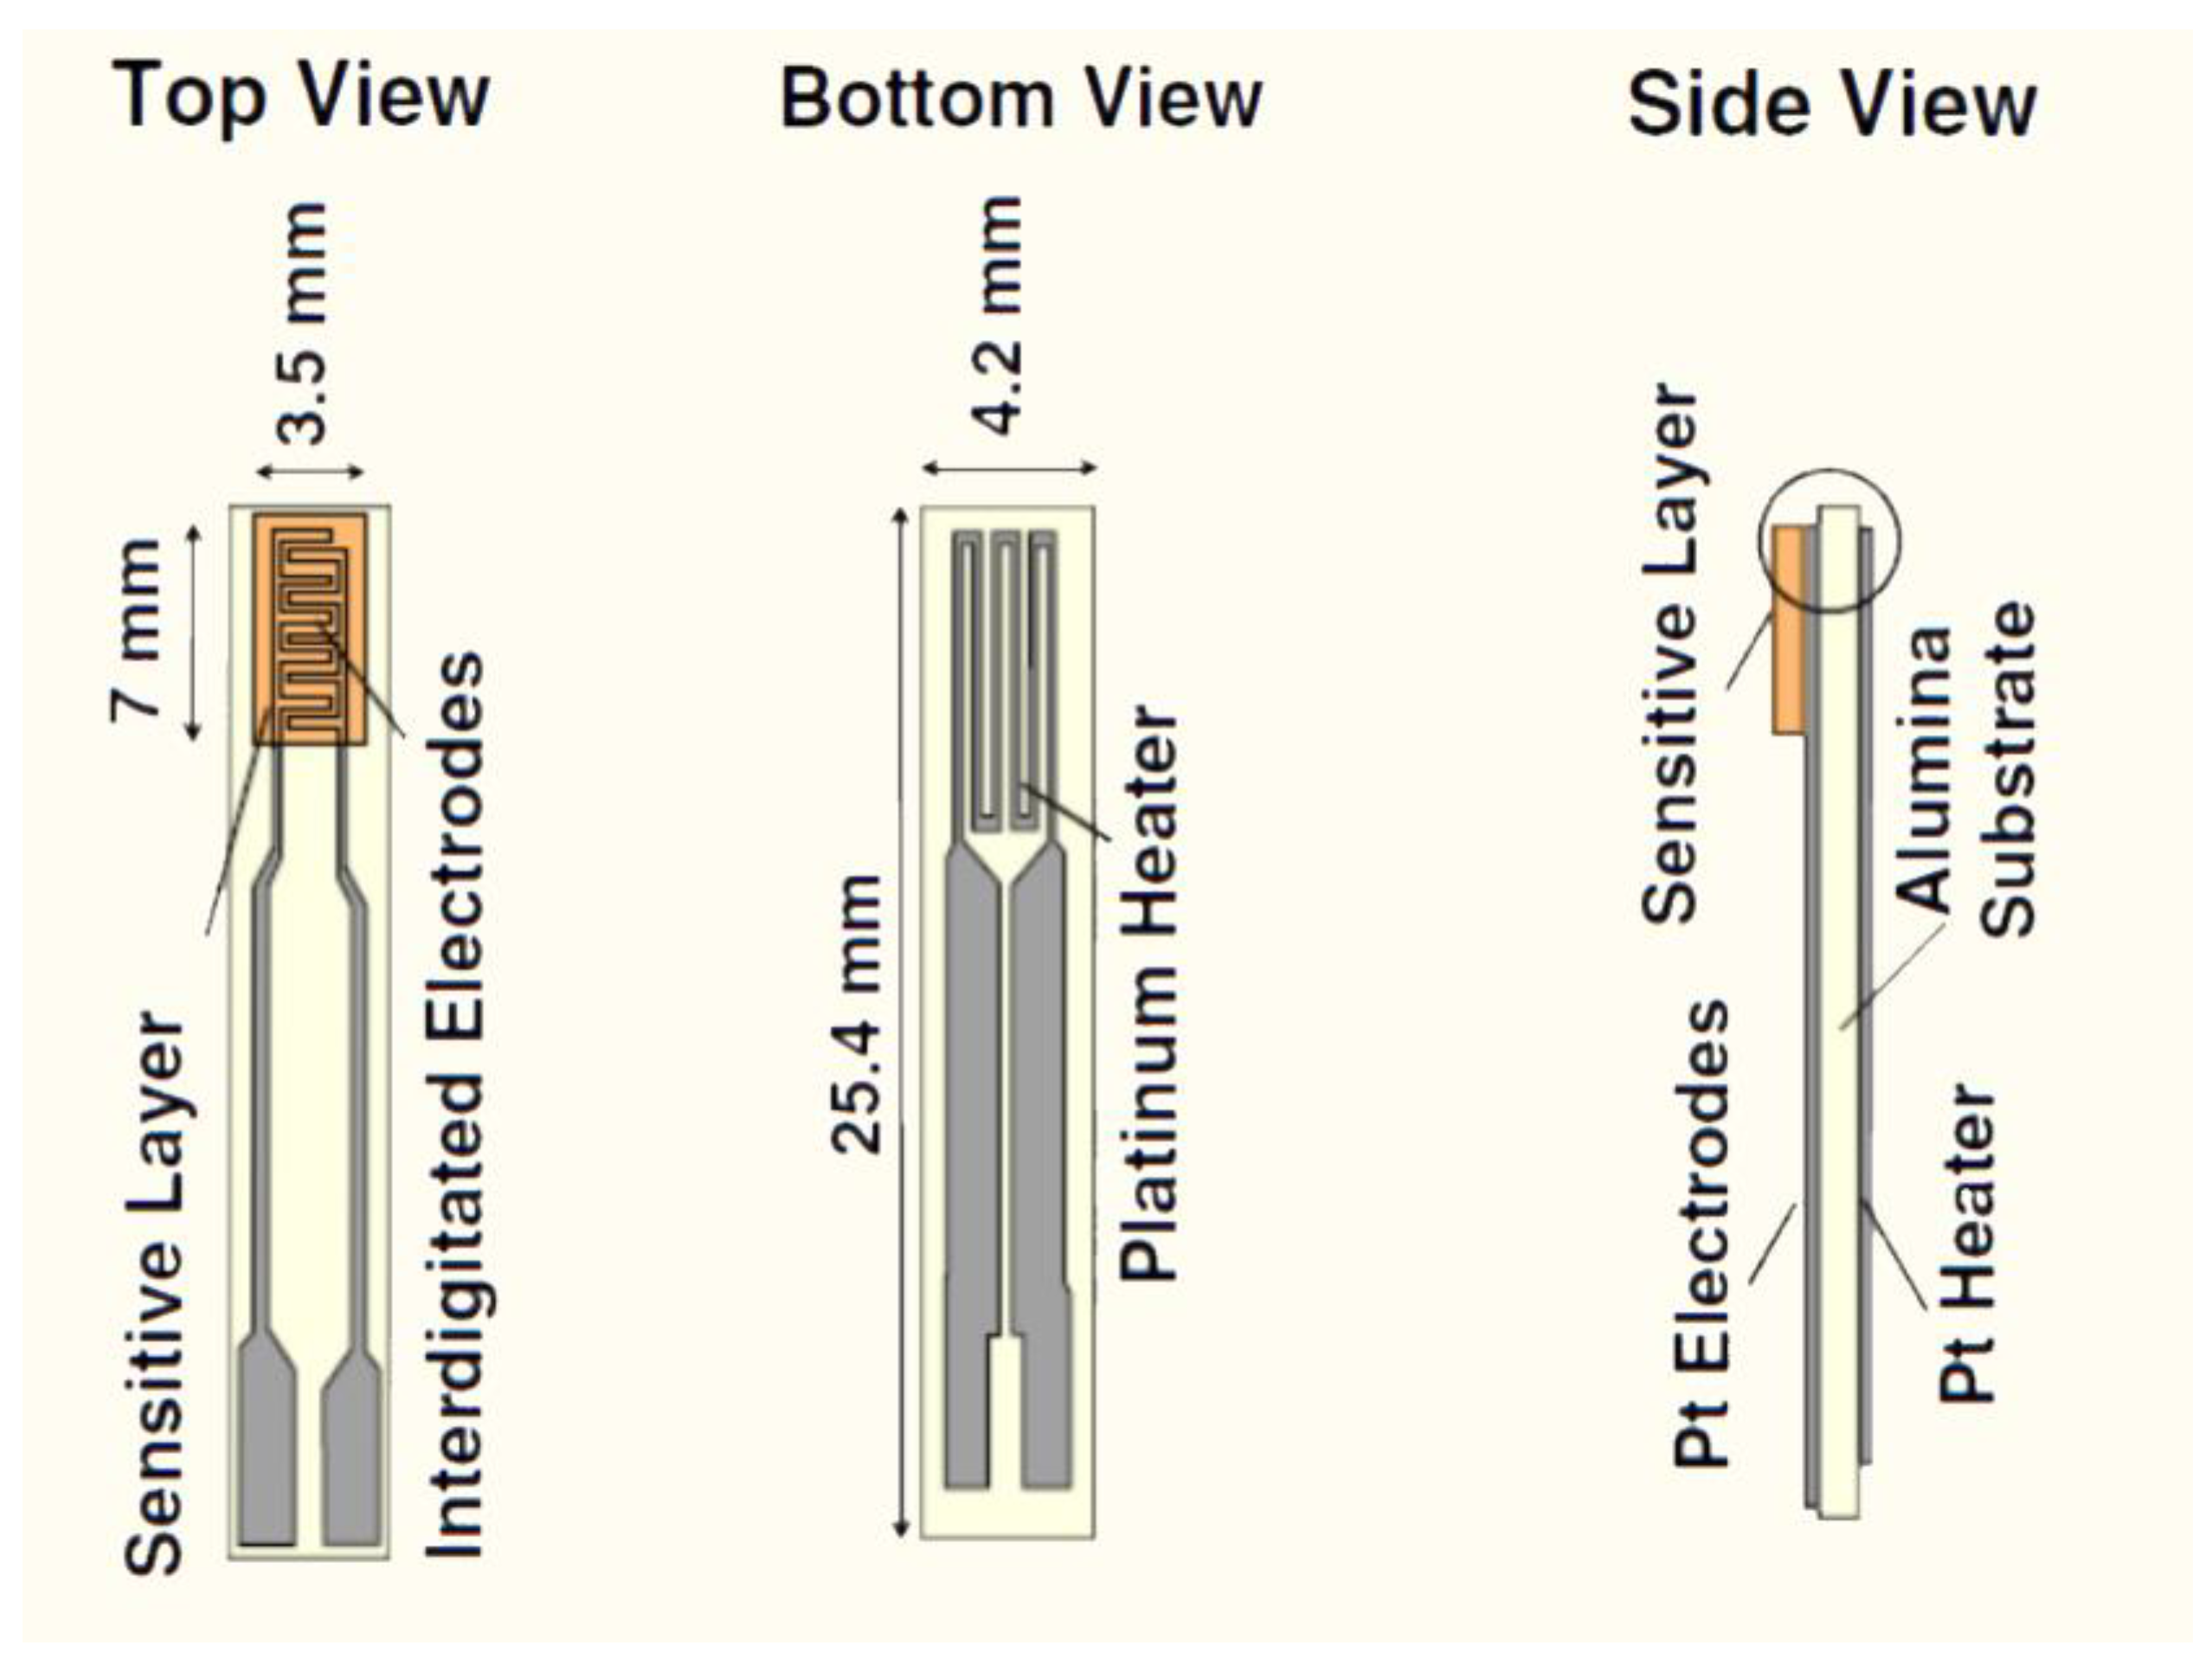
2.2. Material Preparation and Deposition
2.3. Material Characterization and Gas Sensing Measurements
3. Results
3.1. Gas Sensitive Layer Characterization
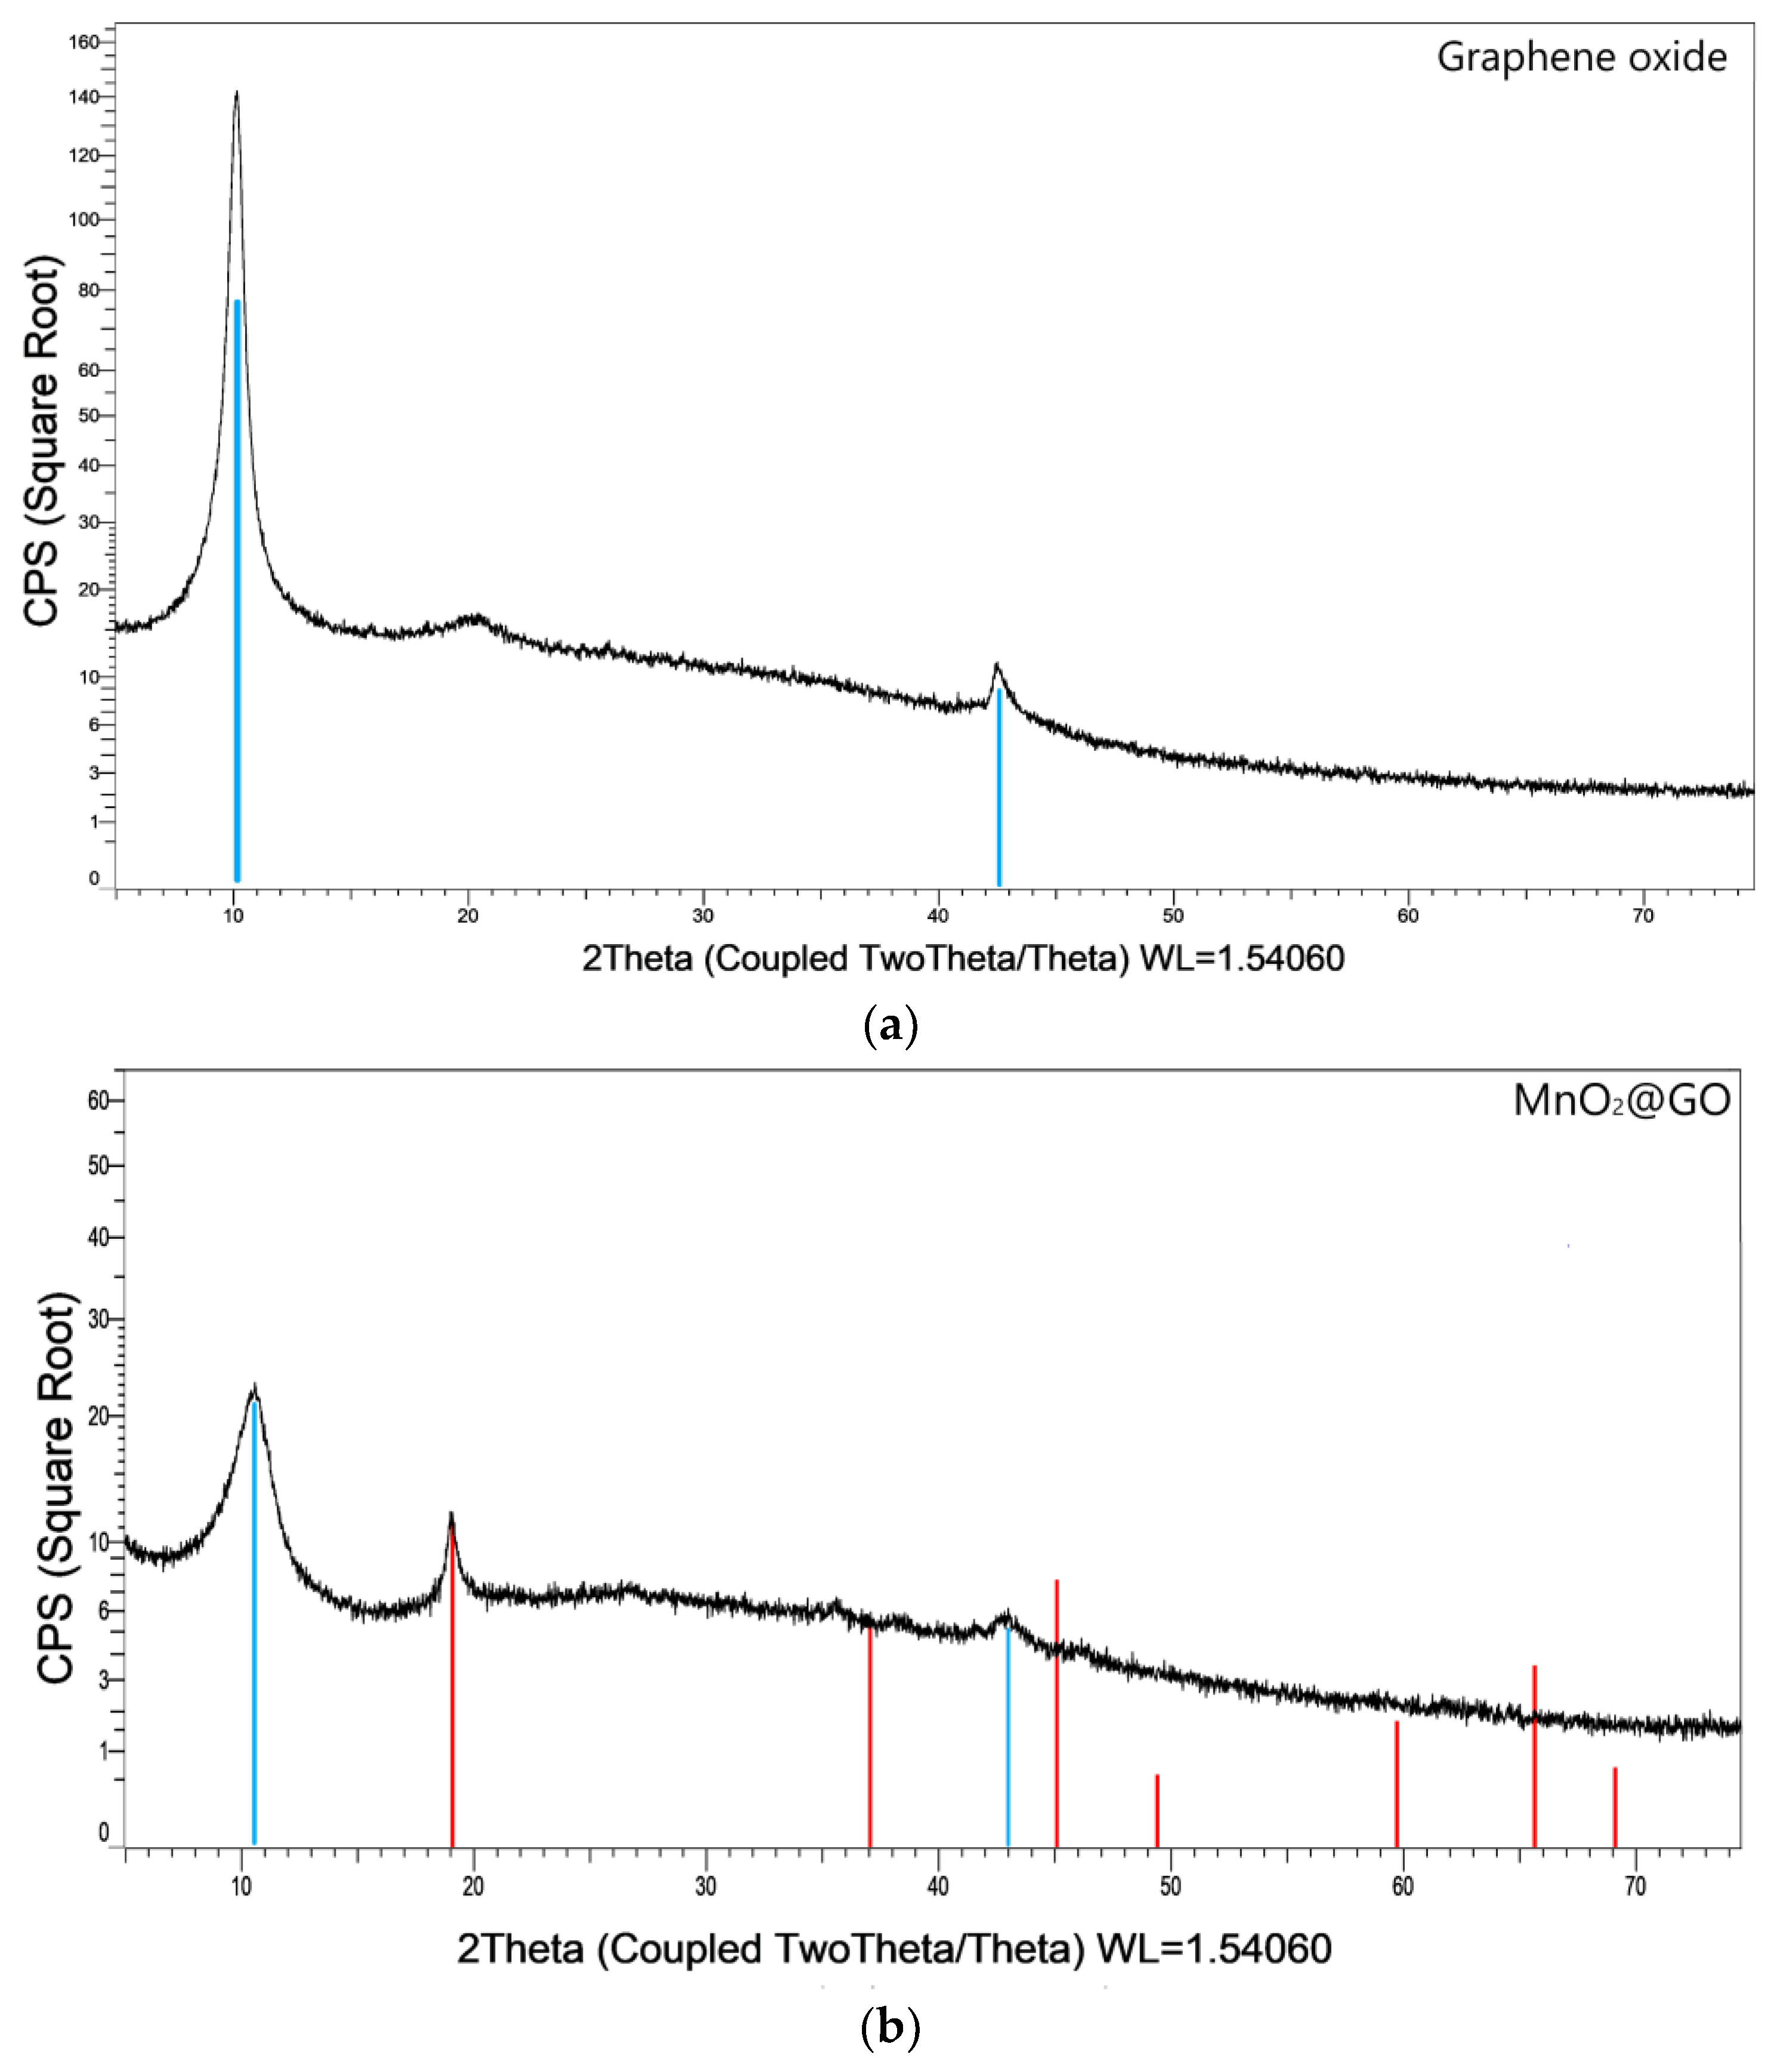
3.1.1. XRD
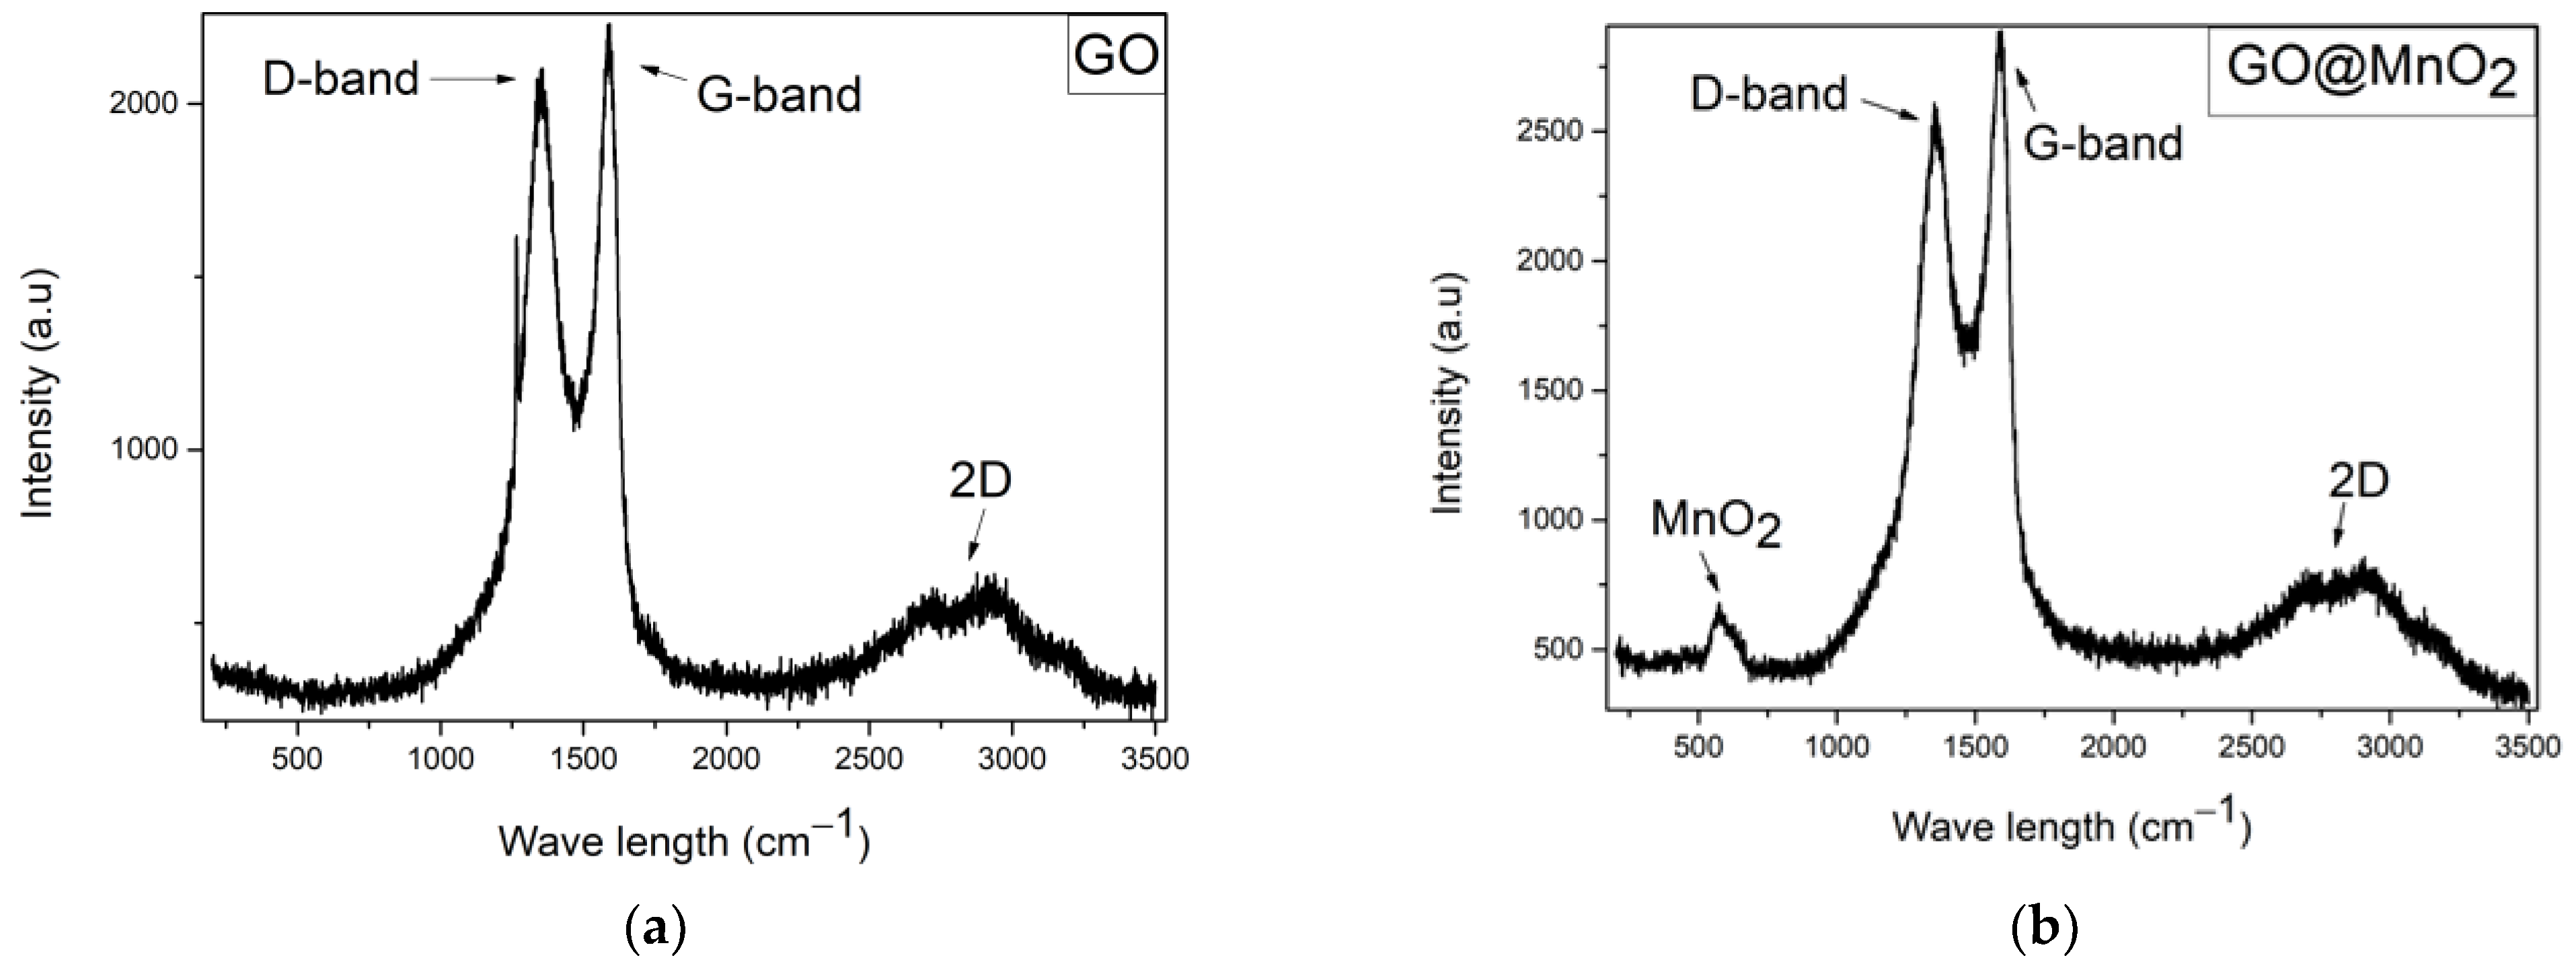
3.1.2. Raman
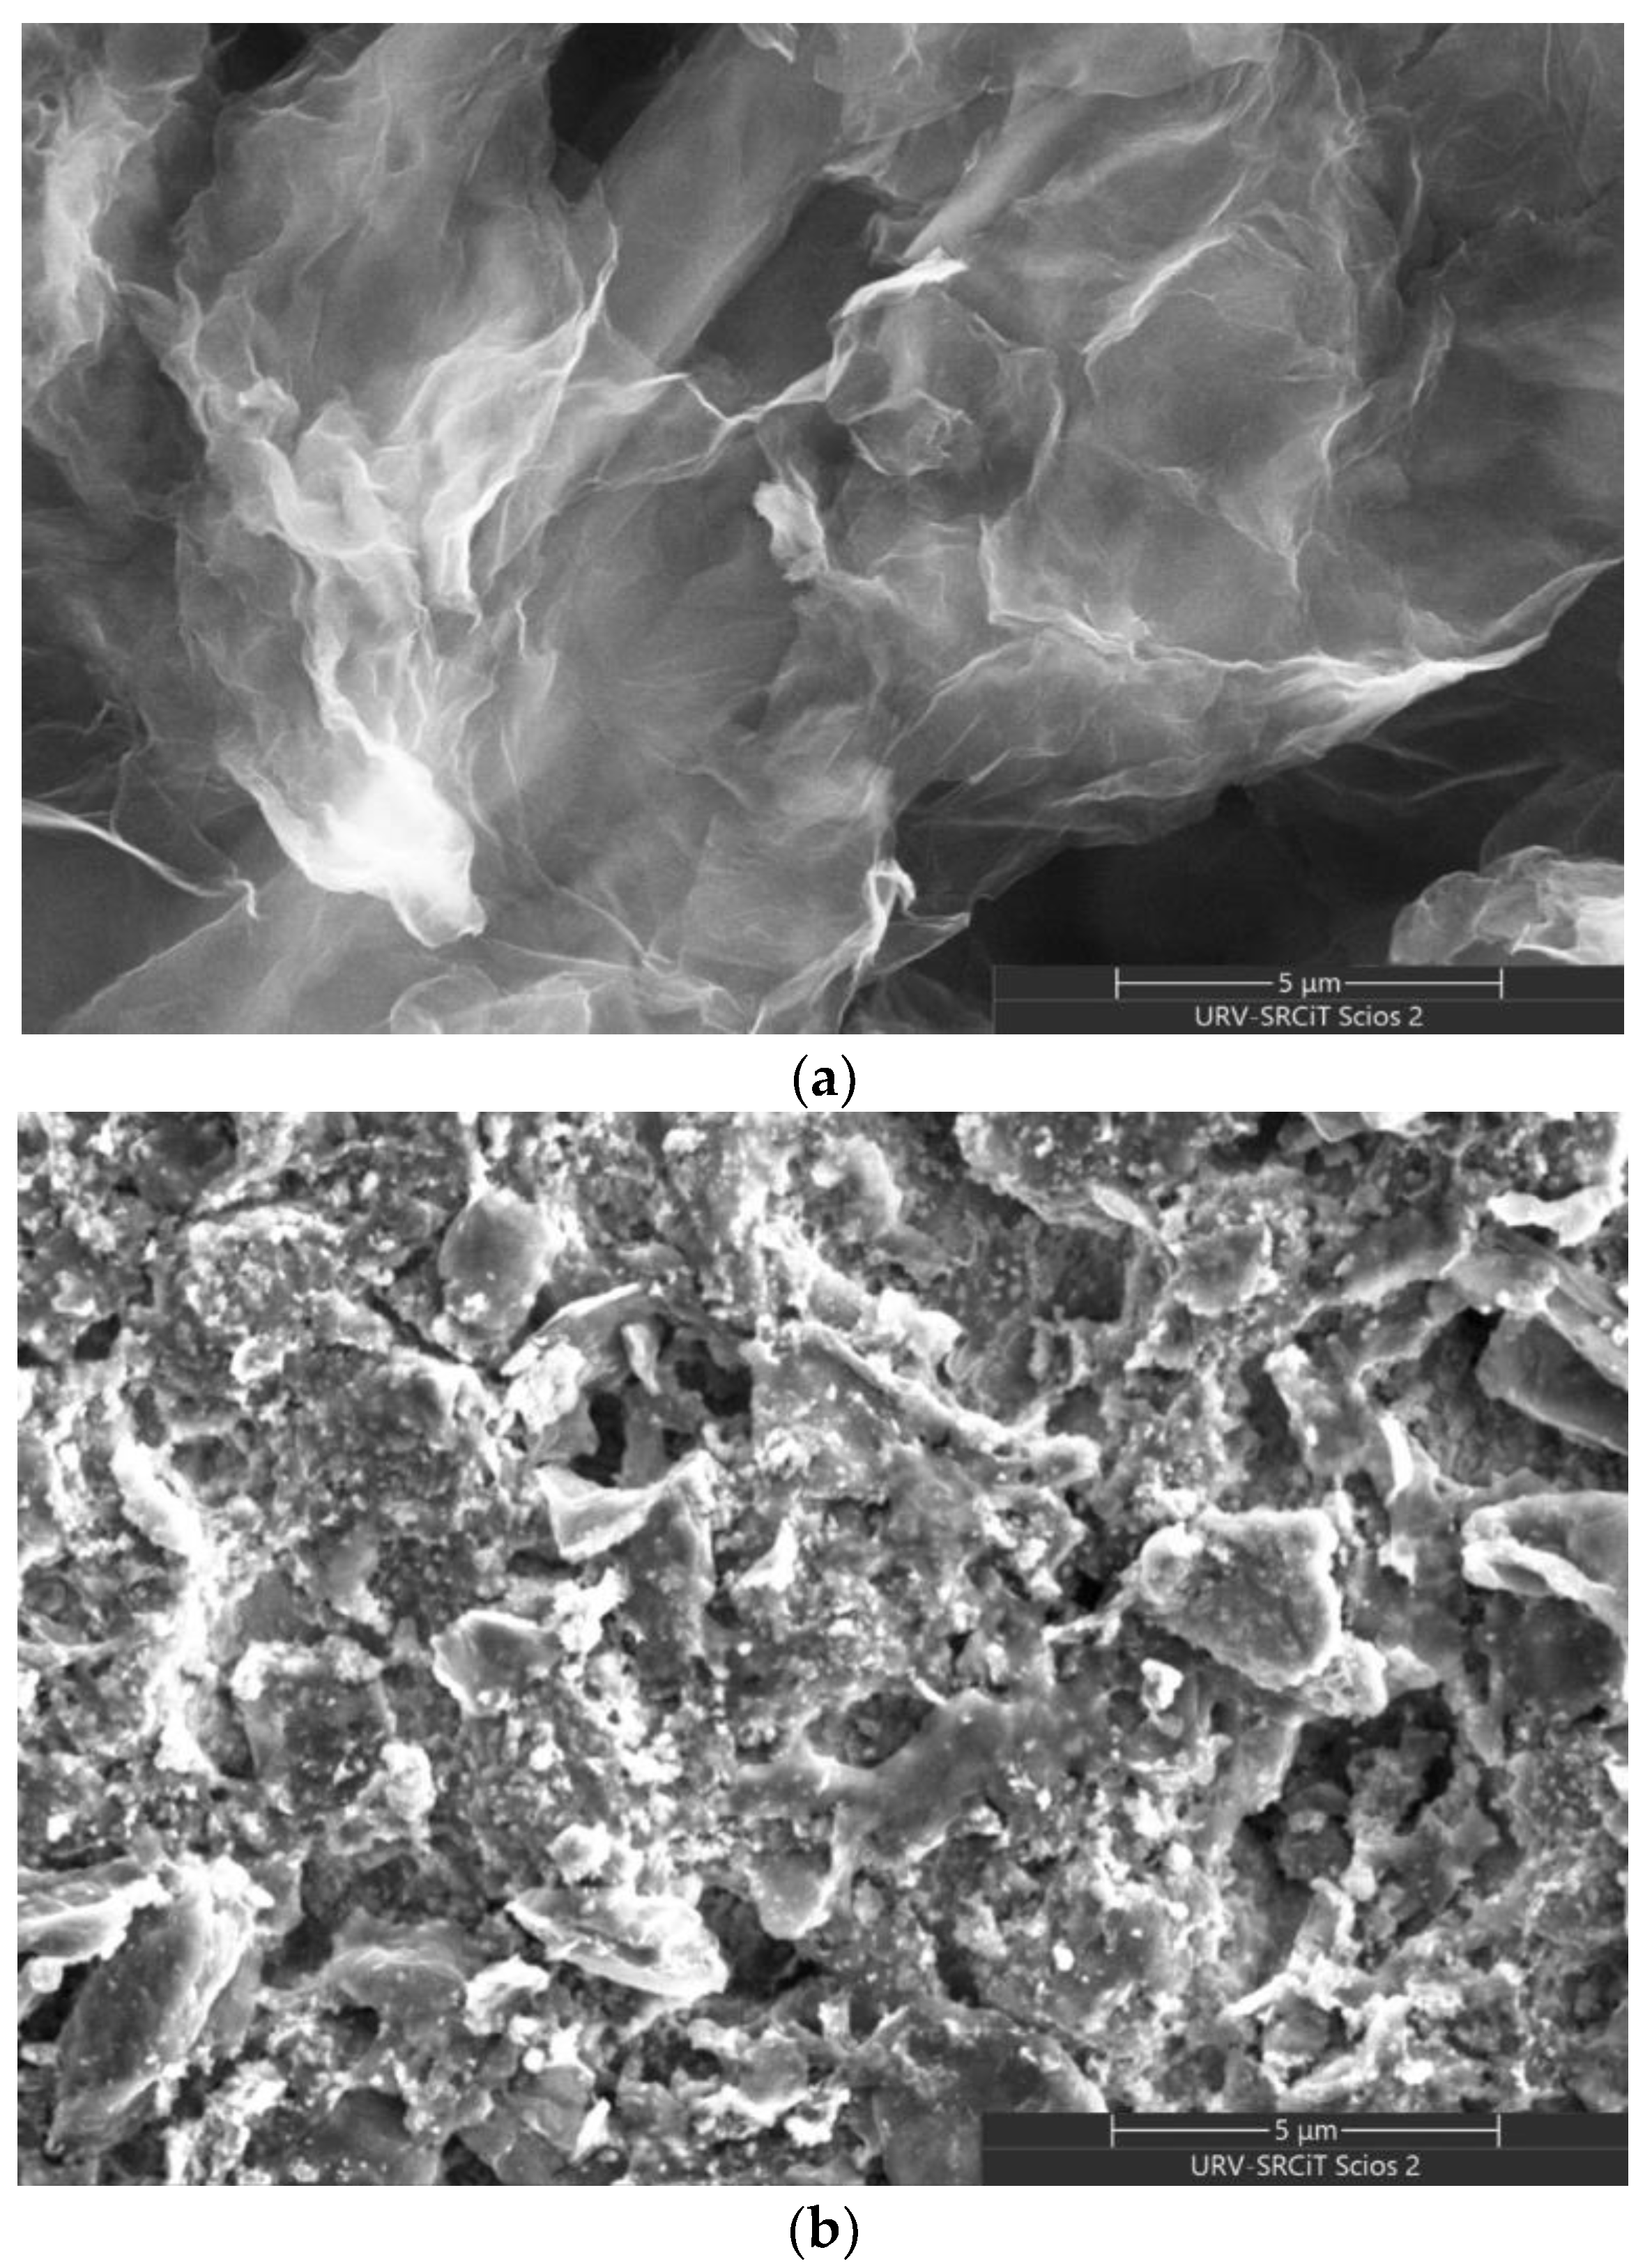
3.1.3. FESEM
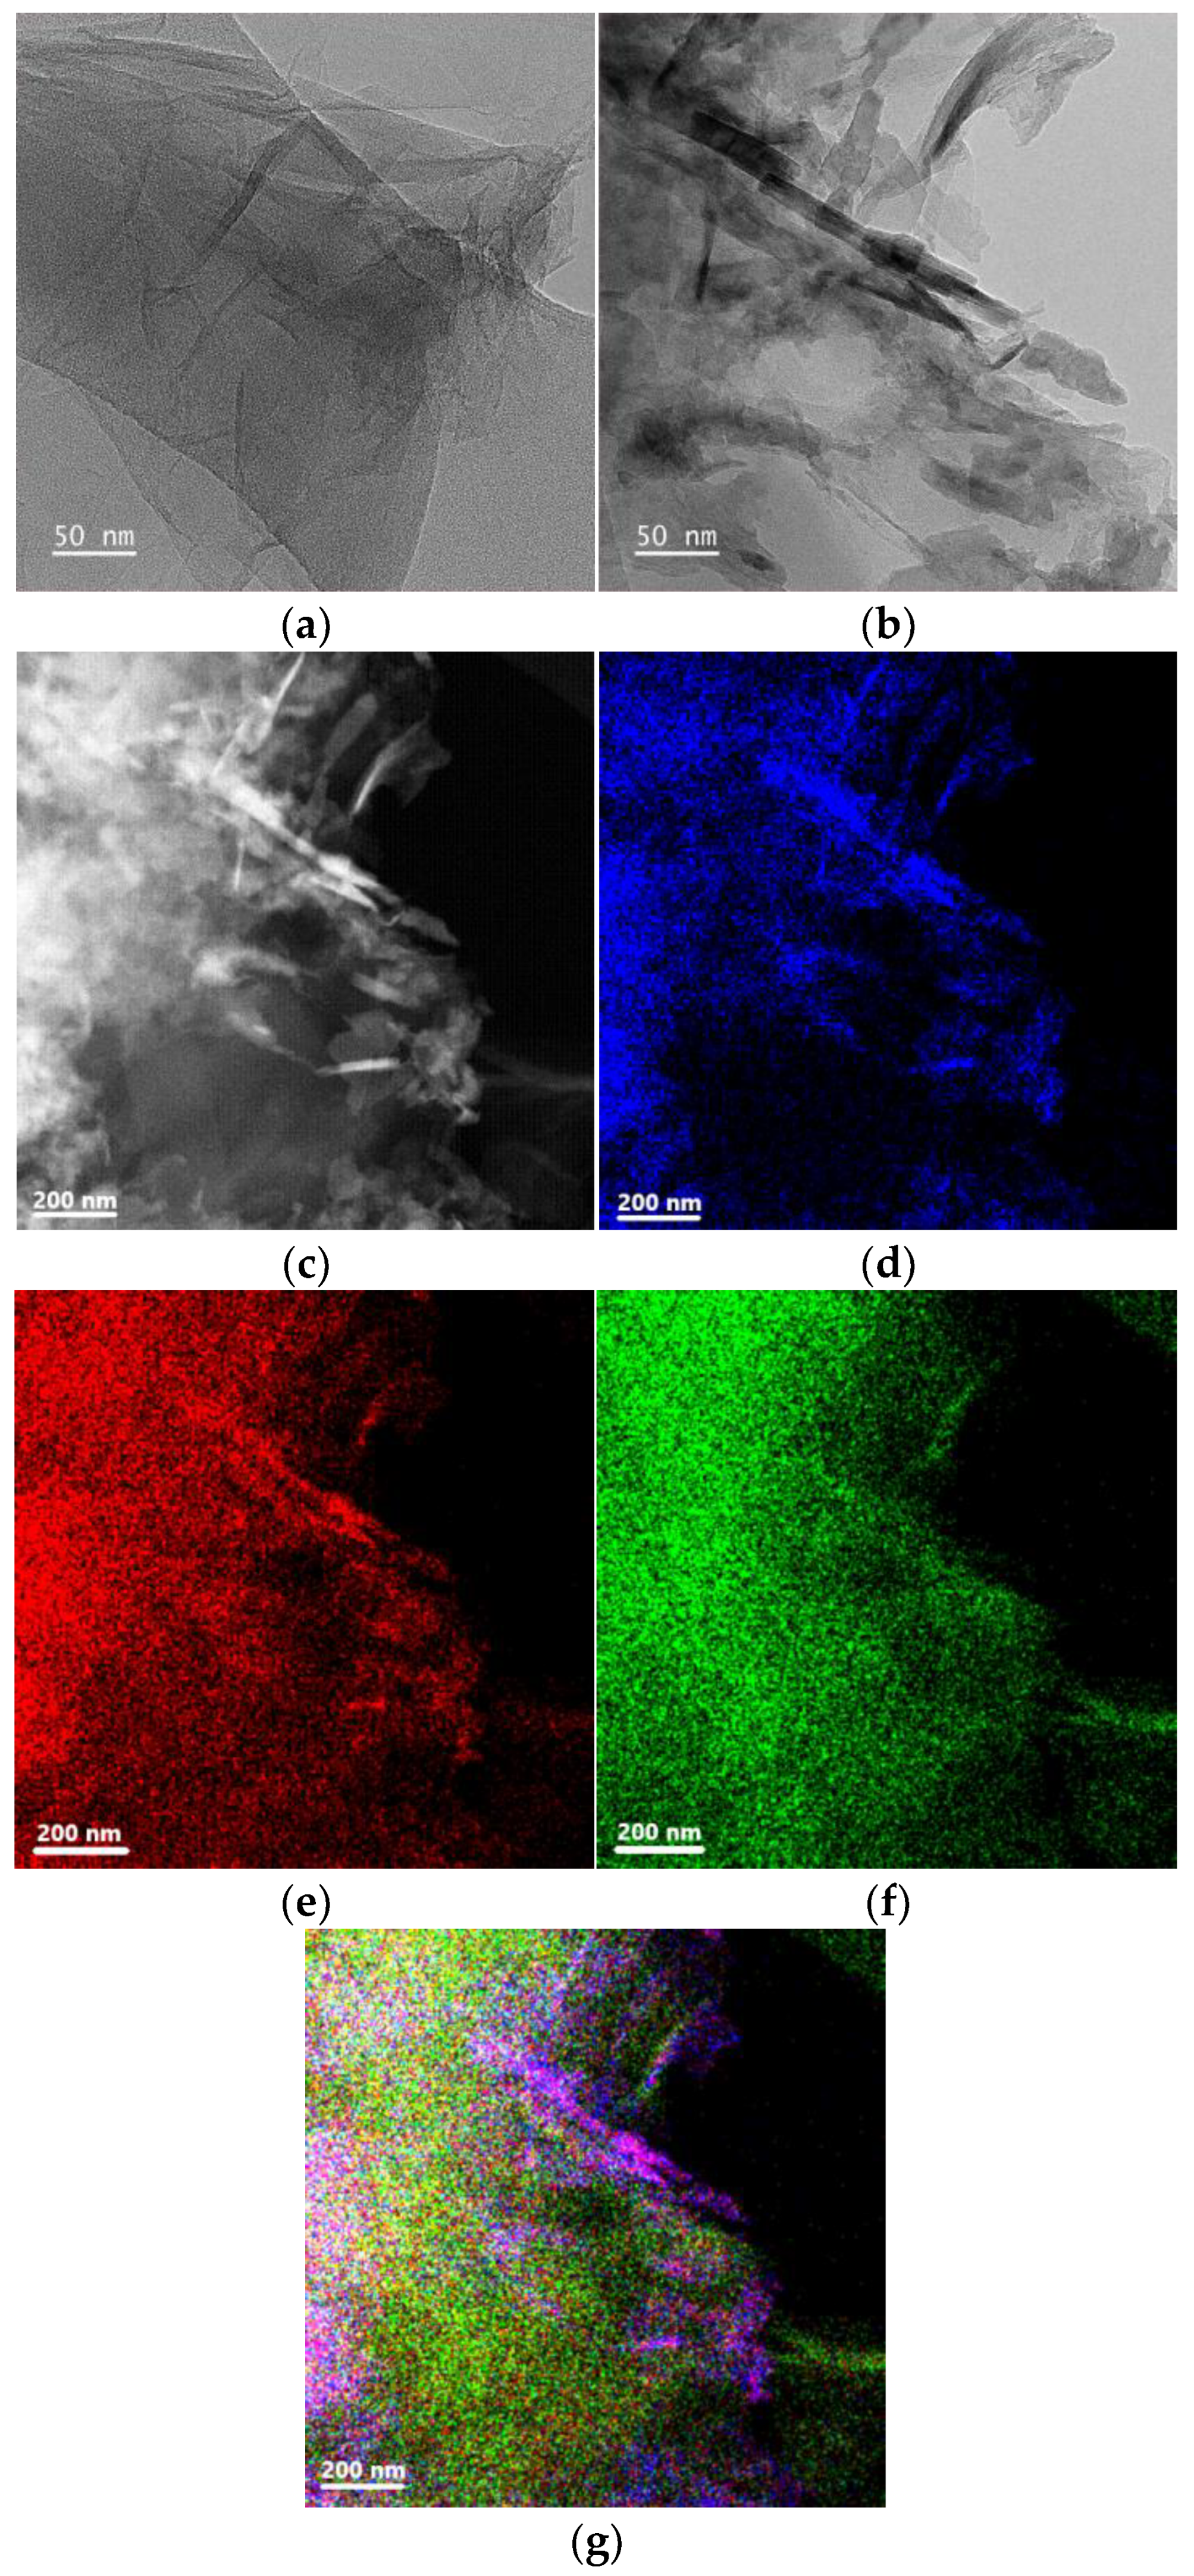
3.1.4. HR-TEM
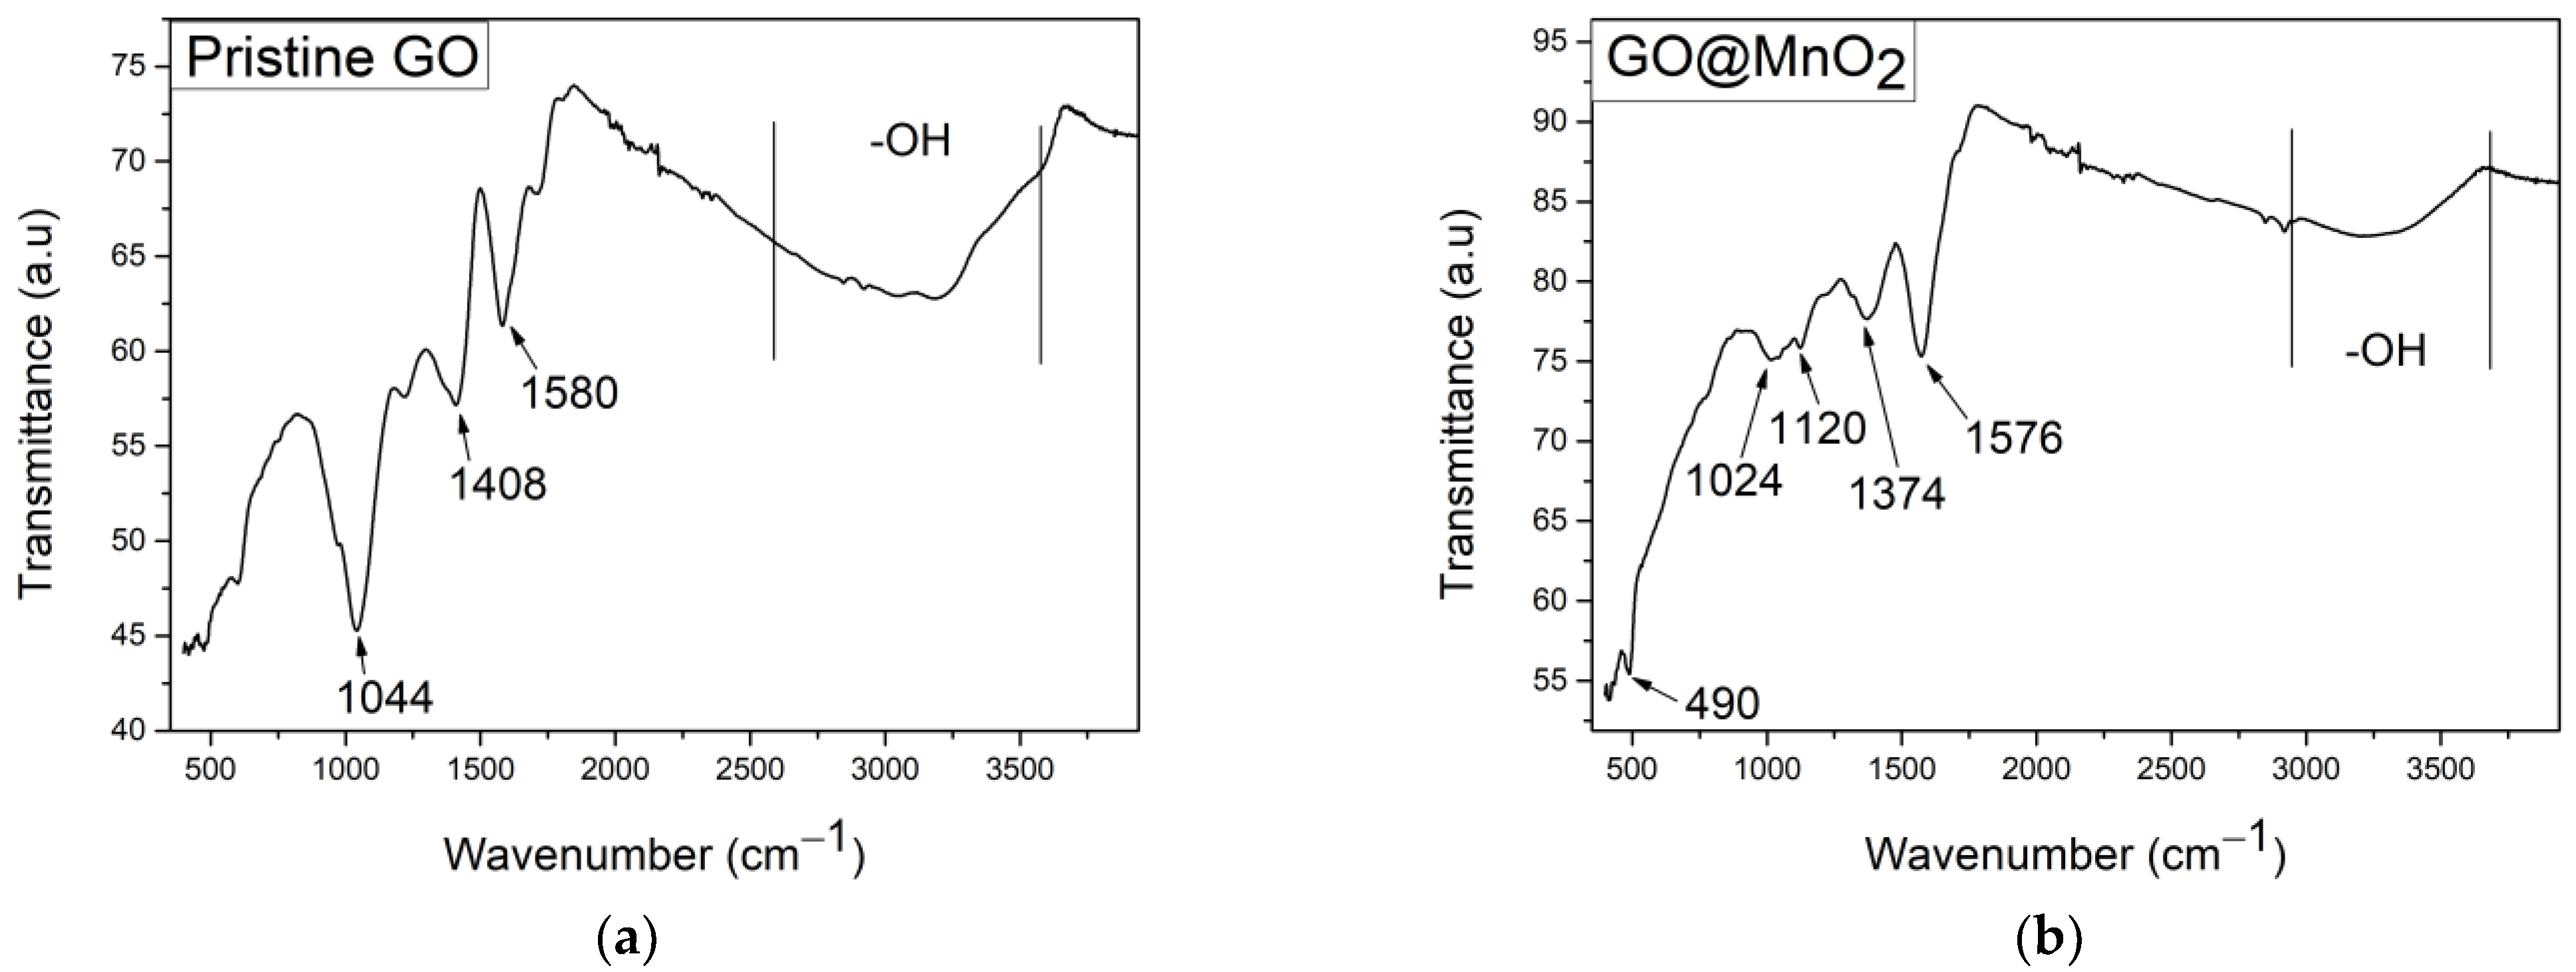
3.1.5. ATR-IR
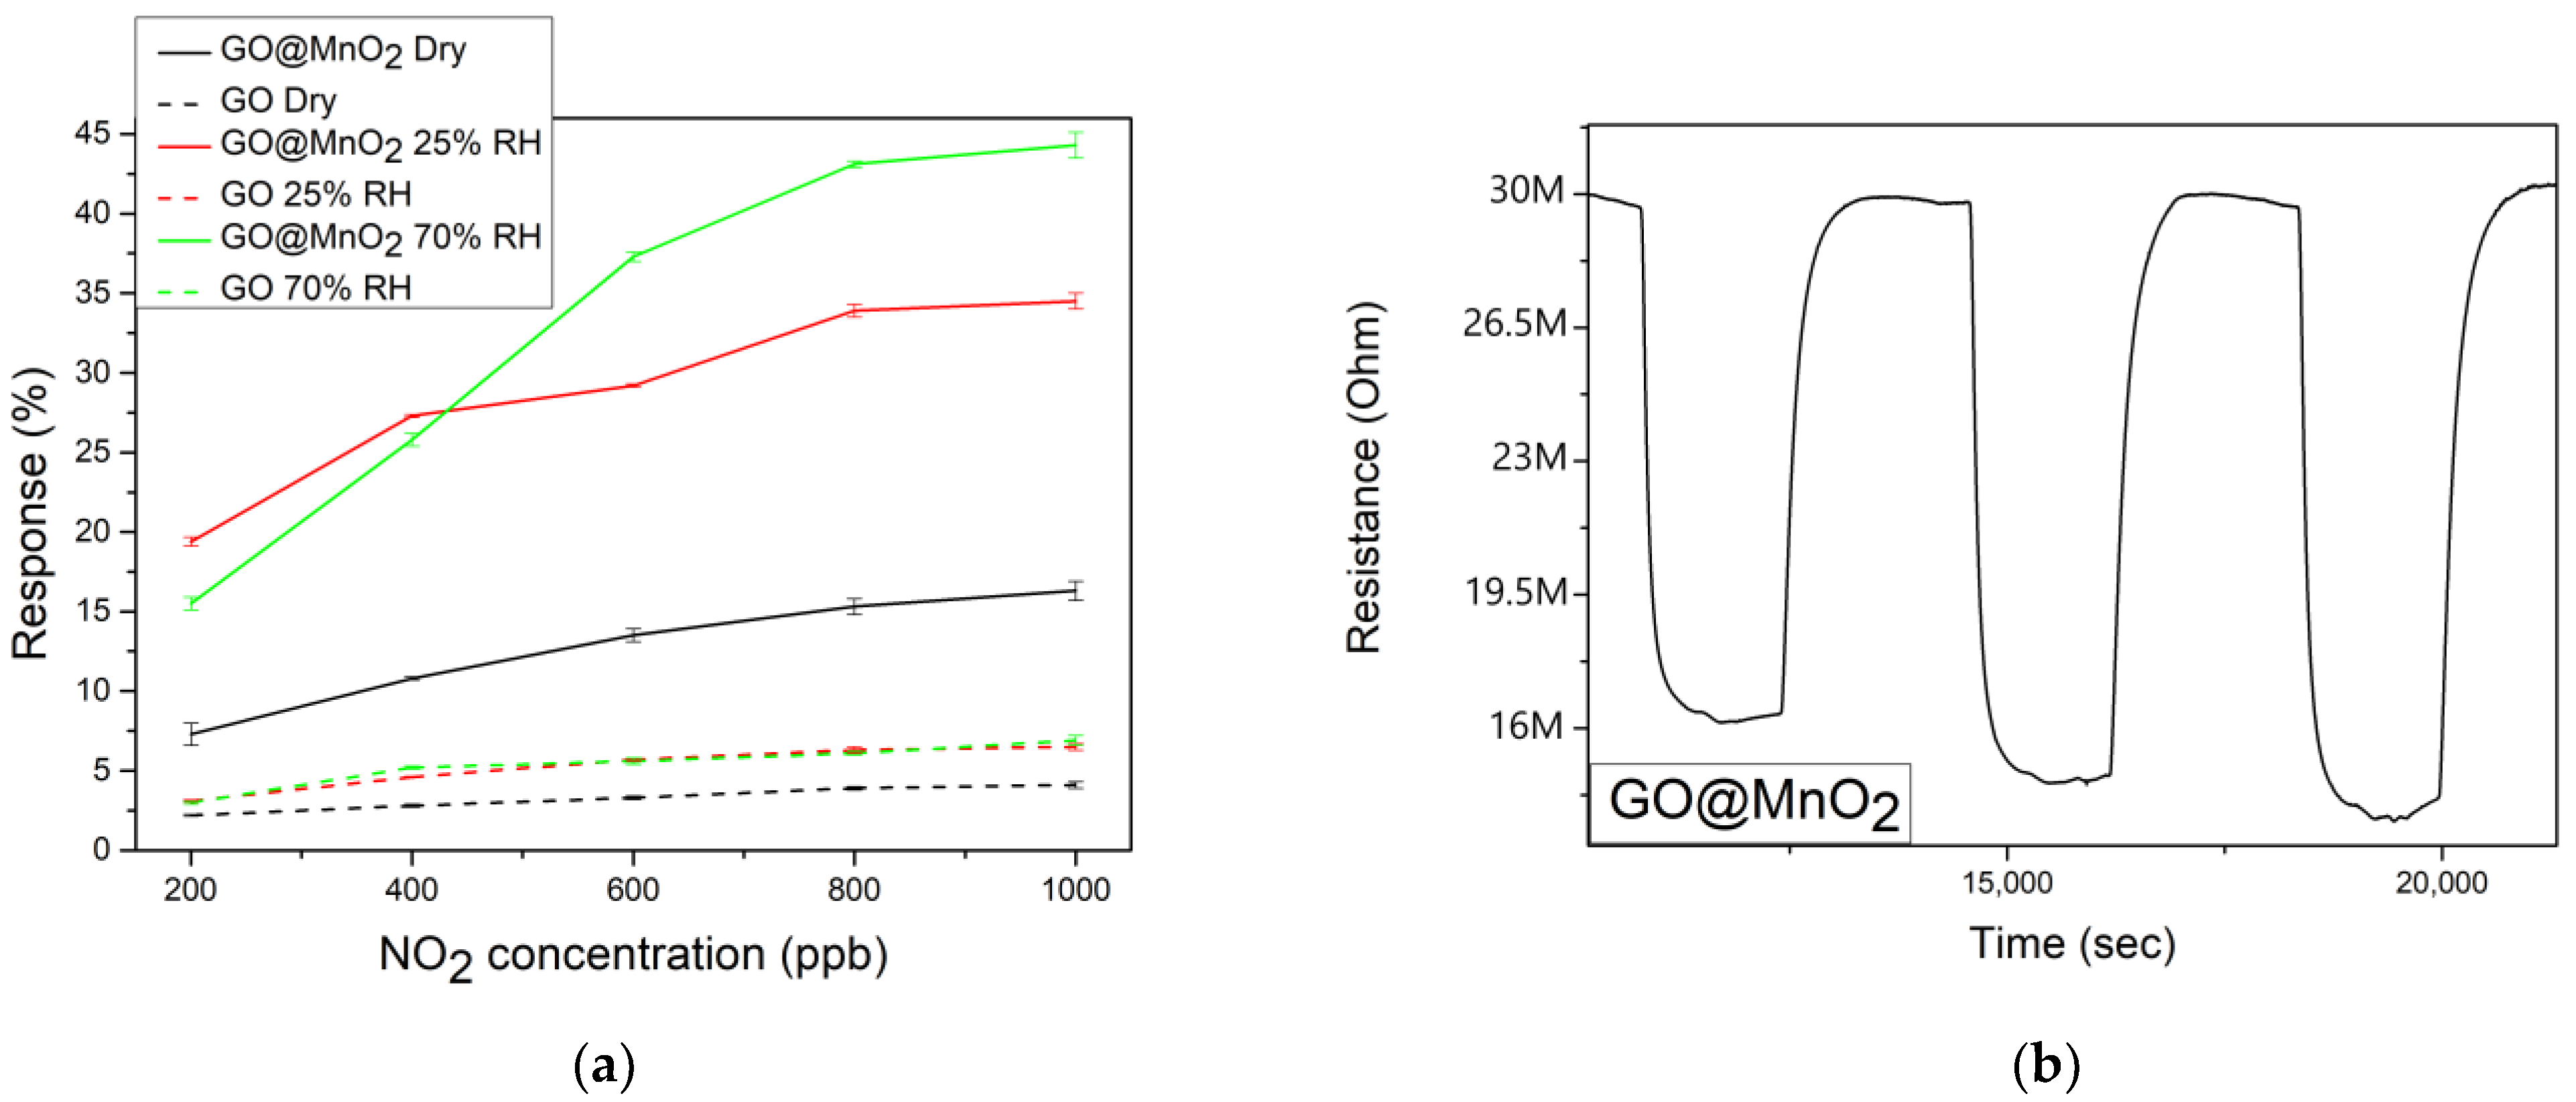
3.2. Gas Sensing Results
3.3. Proposed Sensing Mechanism
4. Conclusions
Supplementary Materials
Author Contributions
Funding
Institutional Review Board Statement
Informed Consent Statement
Data Availability Statement
Acknowledgments
Conflicts of Interest
References
- Beloconi, A.; Vounatsou, P. Revised EU and WHO Air Quality Thresholds: Where Does Europe Stand? Atmos. Environ. 2023, 314, 120110. [Google Scholar] [CrossRef]
- Huang, S.; Li, H.; Wang, M.; Qian, Y.; Steenland, K.; Caudle, W.M.; Liu, Y.; Sarnat, J.; Papatheodorou, S.; Shi, L. Long-Term Exposure to Nitrogen Dioxide and Mortality: A Systematic Review and Meta-Analysis. Sci. Total Environ. 2021, 776, 145968. [Google Scholar] [CrossRef]
- Latza, U.; Gerdes, S.; Baur, X. Effects of Nitrogen Dioxide on Human Health: Systematic Review of Experimental and Epidemiological Studies Conducted between 2002 and 2006. Int. J. Hyg. Environ. Health 2009, 212, 271–287. [Google Scholar] [CrossRef] [PubMed]
- Milone, A.; Monteduro, A.G.; Rizzato, S.; Leo, A.; Di Natale, C.; Kim, S.S.; Maruccio, G. Advances in Materials and Technologies for Gas Sensing from Environmental and Food Monitoring to Breath Analysis. Adv. Sustain. Syst. 2023, 7, 2200083. [Google Scholar] [CrossRef]
- Shangguan, C.; Xu, K.; Dong, M.; Ren, G.; You, R.; Liu, Z.; Ou, R.; Lu, L.; Hu, Y.; Ma, Q.; et al. Two-Dimensional Iron Oxyhydroxide for Visible-Light-Driven NO2 Sensing. ACS Appl. Nano Mater. 2025, 8, 952–961. [Google Scholar] [CrossRef]
- Kibet, E.; Dong, Y.; Yu, Y.; Niu, W.; Tan, Y.; Liu, H.; Hao, J.; Qu, W.; Zhou, Y.; Hu, W.; et al. Formation of Nanoporous Bi2 Se3 by Selenization of Bismuth Metal–Organic Frameworks for Highly Sensitive and Selective NO2 Sensing at Room Temperature. ACS Appl. Nano Mater. 2025, 8, 1233–1244. [Google Scholar] [CrossRef]
- Je, Y.; Chee, S.-S. High-Speed and Sub-Ppm Detectable Tellurene NO2 Chemiresistive Room-Temperature Sensor under Humidity Environments. Electron. Mater. Lett. 2025, 21, 94–101. [Google Scholar] [CrossRef]
- Yeh, Y.-M.; Chang, S.-J.; Fang, S.-Y.; Hsueh, T.-J. TiO2-based nitrogen dioxide gas sensor with transparent ordered micro-hollow bump structure prepared by 3D heterogeneous integration technology. Mater. Sci. Semicond. Process. 2024, 184, 108832. [Google Scholar] [CrossRef]
- Novoselov, K.; Geim, A.; Morozov, S.; Jiang, D.; Zhang, Y.; Dubonos, S.; Grigorieva, I.; Firsov, A. Electric field effect in atomically thin carbon films. Science 2004, 306, 666–669. [Google Scholar] [CrossRef]
- Jiříčková, A.; Jankovský, O.; Sofer, Z.; Sedmidubský, D. Synthesis and Applications of Graphene Oxide. Materials 2022, 15, 920. [Google Scholar] [CrossRef]
- Choi, Y.; Yoon, Y.-G.; Choi, K.S.; Kang, J.H.; Shim, Y.-S.; Kim, Y.; Chang, H.; Lee, J.-H.; Park, C.; Kim, S.Y.; et al. Role of Oxygen Functional Group in Graphene Oxide for Reversible Room-Temperature NO2 Sensing. Carbon 2015, 91, 178–187. [Google Scholar] [CrossRef]
- Park, J.; Kim, Y.; Park, S.; Sung, S.; Jang, H.; Park, C. Band Gap Engineering of Graphene Oxide for Ultrasensitive NO2 Gas Sensing. Carbon 2020, 159, 175–184. [Google Scholar] [CrossRef]
- Al-Jawdah, A.; Aljarrah, R.; Al-Khaykanee, M.; Skof, M. Enhance The Gas-Sensing Performances Of Graphene Oxide (GO) Thin Films For Detecting Nitrogen Dioxide Gas. Al-Qadisiyah J. Pure Sci. 2021, 26, 432–443. [Google Scholar] [CrossRef]
- Trinh, V.; Xu, K.; Yu, H.; Ha, N.; Hu, Y.; Khan, M.W.; Ou, R.; Luan, Y.; Zhang, J.; Ma, Q.; et al. Upcycled Graphene Oxide Nanosheets for Reversible Room Temperature NO2 Gas Sensor. Chemosensors 2024, 12, 108. [Google Scholar] [CrossRef]
- Natarajamani, G.S.; Kannan, V.; Madanag, S. Synergistically Enhanced NH3 Gas Sensing of Graphene Oxide-Decorated Nano-ZnO Thin Films. Mater. Chem. Phys. 2024, 316, 129036. [Google Scholar] [CrossRef]
- Han, J.; Gu, G.; Gao, Y.; Yu, N.; Zhou, W.; Wang, Y.; Kong, D.; Gao, Y.; Lu, G. Prototype Alarm Integrating Pulse-Driven Nitrogen Dioxide Sensor Based on Holey Graphene Oxide/In2O3. ACS Sens. 2024, 9, 5425–5435. [Google Scholar] [CrossRef] [PubMed]
- Srivastava, S.; Singh, A.; Sahz, M.; Yadav, B.; Pandey, N. Development of V2O5@GO (1D/2D) Nanohybrid Based Chemiresistor for Low-Trace of Toluene. Sens. Actuators B Chem. 2023, 400, 134817. [Google Scholar] [CrossRef]
- Amoh, P.; Elwardany, A.; Fujii, M.; Hassan, H. Room Temperature-Built Gas Sensors from Green Carbon Derivative: A Comparative Study between Pristine SnO2 and GO-SnO2 Nanocomposite. J. Nano Res. 2024, 82, 77–94. [Google Scholar] [CrossRef]
- Mohammad-Yusof, N.; Rozali, S.; Ibrahim, S.; Siddick, S. Synthesis of Hybridized Fireworks-like Go-Co3O4 Nanorods for Acetone Gas Sensing Applications. Mater. Today Commun. 2023, 35, 105516. [Google Scholar] [CrossRef]
- Wu, M.; Hou, P.; Dong, L.; Cai, L.; Chen, Z.; Zhao, M.; Li, J. Manganese Dioxide Nanosheets: From Preparation to Biomedical Applications. Int. J. Nanomed. 2019, 14, 4781–4800. [Google Scholar] [CrossRef]
- Sarma-Choudhury, S.; Katiyar, N.; Saha, R.; Bhattacharya, S. Inkjet-Printed Flexible Planar Zn-MnO2 Battery on Paper Substrate. Sci. Rep. 2024, 14, 1597. [Google Scholar] [CrossRef] [PubMed]
- Malook, K.; Khan, H.; Shah, M.; ul-Haque, I. Highly Selective and Sensitive Response of Polypyrrole-MnO2 Based Composites towards Ammonia Gas. Polym. Compos. 2018, 40, 1676–1683. [Google Scholar] [CrossRef]
- Shinde, P.V.; Xia, Q.X.; Ghule, B.G.; Shinde, N.M.; Seonghee, J.; Kim, K.H.; Mane, R.S. Hydrothermally Grown α-MnO2 Interlocked Mesoporous Micro-Cubes of Several Nanocrystals as Selective and Sensitive Nitrogen Dioxide Chemoresistive Gas Sensors. Appl. Surf. Sci. 2018, 442, 178–184. [Google Scholar] [CrossRef]
- Umar, A.; Ibrahim, A.; Kumar, R.; Albargi, H.; Zeng, W.; Alhmami, M.; Alsaiari, M.; Baskoutas, S. Gas Sensor Device for High-Performance Ethanol Sensing Using α-MnO2 Nanoparticles. Mater. Lett. 2021, 286, 129232. [Google Scholar] [CrossRef]
- Kumar, R.; Kushwaha, N.; Kumar, R.; Mittal, J. Ammonia Gas Sensing Using Thin Film of MnO2 Nanofibers. IEEE Sens. J. 2016, 16, 4691–4695. [Google Scholar] [CrossRef]
- Shirgaonkar, D.; Yewale, M.; Shin, D.K.; Mathad, S.; Nakate, N.T.; Ahmad, R.; Pawar, S.; Al Kahtani, A.; Aftab, S. High Selectivity in NO2 Gas Sensing Applications Using Polythiophene-MnO2 Composite Thin Films. Sens. Actuators Phys. 2024, 377, 115740. [Google Scholar] [CrossRef]
- Fahmy, A.; Saeed, A.; Dawood, U.; Abdelbary, H.; Altmann, K.; Schönhals, A. Nano-MnO2/Xanthan Gum Composite Films for NO2 Gas Sensing. Mater. Chem. Phys. 2022, 296, 127277. [Google Scholar] [CrossRef]
- Fan, G.; Huo, F.; Guan, J.; Yu, H.; Zhu, Q.; Han, N.; Mo, J.; Chen, Y. MnO2 Enhanced Low Temperature HCHO Sensing Performance of SnO2. Sens. Actuators B Chem. 2024, 412, 135803. [Google Scholar] [CrossRef]
- Li, C.; Choi, P.; Masuda, Y. Highly Sensitive and Selective Gas Sensors Based on NiO/MnO2@NiO Nanosheets to Detect Allyl Mercaptan Gas Released by Humans under Psychological Stress. Adv. Sci. 2022, 9, 2270174. [Google Scholar] [CrossRef]
- Xie, C.; Xiao, L.; Hu, M.; Bai, Z.; Xia, X.; Zeng, D. Fabrication and Formaldehyde Gas-Sensing Property of ZnO–MnO2 Coplanar Gas Sensor Arrays. Sens. Actuators B Chem. 2010, 145, 457–463. [Google Scholar] [CrossRef]
- Pedowitz, M.D.; Kim, S.; Lewis, D.I.; Uppalapati, B.; Khan, D.; Bayram, F.; Koley, G.; Daniels, K.M. Fast Selective Sensing of Nitrogen-Based Gases Utilizing δ-MnO2-Epitaxial Graphene-Silicon Carbide Heterostructures for Room Temperature Gas Sensing. J. Microelectromechanical Syst. 2020, 29, 846–852. [Google Scholar] [CrossRef]
- Alouani, M.A.; Casanova-Chafer, J.; de Bernardi-Martín, S.; García-Gómez, A.; Salehnia, F.; Santos-Ceballos, J.C.; Santos-Betancourt, A.; Vilanova, X.; Llobet, E. The Effect of Doping rGO with Nanosized MnO2 on Its Gas Sensing Properties. Chemosensors 2024, 12, 256. [Google Scholar] [CrossRef]
- Zhang, H.; Ou, K.; Guan, R.; Cao, Y.; Sun, Y.; Li, X. A Highly Sensitive Room-Temperature NO2 Gas Sensor Based on Porous MnO2/rGO Hybrid Composites. Curr. Nanosci. 2022, 19, 401–409. [Google Scholar] [CrossRef]
- Zöpfl, A.; Lemberger, M.-M.; König, M.; Ruhl, G.; Matysik, F.-M.; Hirsch, T. Reduced Graphene Oxide and Graphene Composite Materials for Improved Gas Sensing at Low Temperature. Faraday Discuss. 2014, 173, 403–414. [Google Scholar] [CrossRef]
- Ghosal, S.; Bhattacharyya, P. Fabrication, Characterization, and Gas Sensing Performance of Pd, RGO, and MnO2 Nanoflowers-Based Ternary Junction Device. IEEE Trans. Electron. Devices 2019, 66, 3982–3987. [Google Scholar] [CrossRef]
- Seara, M.; García, A.; Larraza, I.; Peña, E.; Blanco, V.; Ruiz, S. Method of Obtaining Nanomaterials Composed of Carbonaceous Material and Metallic Oxides. Patent no. ES2678419A1, 25 April 2018. [Google Scholar]
- Zhang, Y.; Li, Y.; Jiang, Y.; Duan, Z.; Yuan, Z.; Liu, B.; Huang, Q.; Zhao, Q.; Yang, Y.; Tai, H. Synergistic Effect of Charge Transfer and Interlayer Swelling in V2CTx/SnS2 Driving Ultrafast and Highly Sensitive NO2 Detection at Room Temperature. Sens. Actuators B Chem. 2024, 411, 135788. [Google Scholar] [CrossRef]
- Ahmad, H.; Rahman, M.; Faruki, M.J.; Razalli, S.; Ismail, M.F.; Shah, N.; Razak, M. Graphene Oxide (GO)-Based Wideband Optical Polarizer Using a Non-Adiabatic Microfiber. J. Mod. Opt. 2016, 64, 439–444. [Google Scholar] [CrossRef]
- Yin, F.; Wu, S.; Wang, Y.; Wu, L.; Yuan, P.; Wang, X. Self-Assembly of Mildly Reduced Graphene Oxide Monolayer for Enhanced Raman Scattering. J. Solid State Chem. 2016, 237, 57–63. [Google Scholar] [CrossRef]
- Hurtado, R.; Cortez-Valadez, M.; Aragon-Guajardo, J.R.; Cruz-Rivera, J.; Martinez, F.; Flores-Acosta, M. One-Step Synthesis of Reduced Graphene Oxide/Gold Nanoparticles under Ambient Conditions. Arab. J. Chem. 2020, 13, 1633–1640. [Google Scholar] [CrossRef]
- López Díaz, D.; Delgado Notario, J.; Clerico, V.; Diez, E.; Merchán Moreno, M.D.; Velázquez, M.M. Towards Understanding the Raman Spectrum of Graphene Oxide: The Effect of the Chemical Composition. Coatings 2020, 10, 524. [Google Scholar] [CrossRef]
- Md, S.; Nur, H.; Liu, W.W.; Lai, C.W.; Zulkepli, N.N.; Khe, C.-S.; Hashim, U.; Lee, H.C. Comparison on graphite, graphene oxide and reduced graphene oxide: Synthesis and characterization. AIP Conf. Proc. 2017, 1892, 150002. [Google Scholar]
- Jayashree, M.; Parthibavarman, M.; BoopathiRaja, R.; Sengodan, P.; Ramesh, R. Ultrafine MnO2/Graphene Based Hybrid Nanoframeworks as High-Performance Flexible Electrode for Energy Storage Applications. J. Mater. Sci. Mater. Electron. 2020, 31, 6910–6918. [Google Scholar] [CrossRef]
- Nadarajan, A.; Kasimayan, U.; Pan, G.-T.; Yang, T.C.-K.; Sharmila, G. One-Pot Synthesis of Covalently Functionalized Reduced Graphene Oxide–Polyaniline Nanocomposite for Supercapacitor Applications. Clean Technol. Environ. Policy 2018, 20, 2025–2035. [Google Scholar] [CrossRef]
- Saadati, F.; Kaboudin, B.; Hasanloei, R.; Namazifar, Z.; Marset, X.; Guillena, G. Manganese Oxide Nanoparticles Supported on Graphene Oxide as an Efficient Nanocatalyst for the Synthesis of 1,2,4-Oxadiazoles from Aldehydes. Appl. Organomet. Chem. 2020, 34, e5838. [Google Scholar] [CrossRef]
- Cantalini, C.; Giancaterini, L.; Treossi, E.; Palermo, V.; Perrozzi, F.; Santucci, S.; Ottaviano, L. Electrical Response of GO Gas Sensors; Springer: Berlin/Heidelberg, Germany, 2012. [Google Scholar] [CrossRef]
- Donarelli, M.; Prezioso, S.; Perrozzi, F.; Giancaterini, L.; Cantalini, C.; Treossi, E.; Palermo, V.; Santucci, S.; Ottaviano, L. Graphene Oxide for Gas Detection under Standard Humidity Conditions. 2D Mater. 2015, 2, 035018. [Google Scholar] [CrossRef]
- Ma, X.; Yuan, Y.; Peng, J.; Mingtai, S.; Chen, Z.; Yin, R.; Su, P.; Wang, X.; Wang, S. High-Performance Gas Sensor Based on GO/In2O3 Nanocomposite for Ethanol Detection. J. Mater. Sci. Mater. Electron. 2022, 33, 15460–15472. [Google Scholar] [CrossRef]
- Al-Hartomy, O.; Khasim, S.; Roy, A. Highly Conductive Polyaniline/Graphene Nano-Platelet Composite Sensor towards Detection of Toluene and Benzene Gases. Appl. Phys. A 2018, 125, 12. [Google Scholar] [CrossRef]
- Choudhary, M.; Singh, S.; Sinha, A.K.; Krishnamurthy, S.; Saravanan, K.; Chawla, A.; Avasthi, D.K.; Manna, S.; Chawla, V.; Wadhwa, S. Enhanced Hydrogen Gas Sensing Using Palladium—Graphene Oxide (PdGO) Thin Films. Chem. Eng. J. 2024, 501, 157604. [Google Scholar] [CrossRef]
- Chen, Y.; Zhang, D.; Wang, Z.; Tang, M.; Zhang, H. Pb Transfer-Enabled Recoverable Hydrogel-Based H2S Colorimetric Sensing with Assistance of Multimodal Deep Learning for Multifunctional Applications. Adv. Funct. Mater. 2024, 34, 2409017. [Google Scholar] [CrossRef]
- Takte, M.; Ingle, N.; Dole, B.; Tsai, M.-L.; Hianik, T.; Shirsat, M. A Stable and Highly-Sensitive Flexible Gas Sensor Based on Ceria (CeO2) Nano-Cube Decorated rGO Nanosheets for Selective Detection of NO2 at Room Temperature. Synth. Met. 2023, 297, 117411. [Google Scholar] [CrossRef]
- Fraih, A.; Naeema, N.; Abbas, F. High-Performance NO2 Gas Sensor Based on Reduced Graphene Oxide/ZrO2 Hybrids. J. Met. Mater. Miner. 2024, 34, 2038. [Google Scholar] [CrossRef]
- Casanova-Chafer, J.; Ameur, S.; Nsib, M.; Llobet, E. Gas Sensing Properties of Graphene Oxide Loaded with SrTiO3 Nanoparticles. J. Alloys Compd. 2023, 941, 169011. [Google Scholar] [CrossRef]
- Khan, J.; Režo, V.; Vincze, T.; Weis, M.; Momin, S.; El-Atab, N.; Jaafar, M. Flexible and Highly Selective NO2 Gas Sensor Based on Direct-Ink-Writing of Eco-Friendly Graphene Oxide for Smart Wearable Application. Chemosphere 2024, 367, 143618. [Google Scholar] [CrossRef] [PubMed]
- Mandawade, S.; Wagh, R.; Yewale, C.; Qadir, K.; Abdullah, H.; Alharbi, T.; Husain, D.; Tupe, U.; Naeem, S.; Patil, A. Graphene Oxide Nanoparticles Synthesized via Hummers Method and Investigation of Structural, Electrical, and Gas-Sensing Properties of Screen-Printed Thick Films. J. Indian Chem. Soc. 2024, 102, 101514. [Google Scholar] [CrossRef]
- Kamble, C.; Narwade, S.; Mane, R. Detection of Acetylene (C2H2) Gas Using Ag-Modified ZnO/GO Nanorods Prepared by a Hydrothermal Synthesis. Mater. Sci. Semicond. Process. 2023, 153, 107145. [Google Scholar] [CrossRef]
- Akshhayya, C.; Okla, M.; Al-Ghamdi, A.; Abdel-Maksoud, M.; AbdElgawad, H.; Das, A.; Khan, S. Construction of S-Scheme Heterojunction CuFe2O4/α-MnO2 with Tuned Bandgap for Enhanced White Light Harvesting: Insights of Photoluminescence, Raman Scattering and Photocatalysis. Surf. Interfaces 2021, 27, 101523. [Google Scholar] [CrossRef]
- Das, P.; Ibrahim, S.; Chakraborty, K.; Ghosh, S.; Pal, T. Stepwise Reduction of Graphene Oxide and Studies on Defect-Controlled Physical Properties. Sci. Rep. 2024, 14, 294. [Google Scholar] [CrossRef]
- Naik, G.; Krishnaswamy, S. Room-Temperature Humidity Sensing Using Graphene Oxide Thin Films. Graphene 2016, 5, 1–13. [Google Scholar] [CrossRef]
- Min, B.K.; Quiller, R.G.; Deiner, L.J.; Friend, C.M. Water Dissociation Associated with NO2 Coadsorption on Mo(110)-(1 × 6)-O: Effect of Coverage and Electronic Properties of Oxygen. J. Phys. Chem. B 2005, 109, 20463–20468. [Google Scholar] [CrossRef]


| Material | NO2 Concentration (ppm) | Response (%) | Condition | Sensitivity (%ppm−1) | T (°C) | Ref |
|---|---|---|---|---|---|---|
| Upcycled GO Nanosheets | 1.03 | 11 | Dry | NA * | RT | [14] |
| Hydrogel-Based Colorimetric Sensor | 100 | 1 | Dry | NA | RT | [51] |
| Flexible gas sensor based on Ceria (CeO2) nano-cube decorated rGO | 70 | 52.84 | Dry | NA | RT | [52] |
| rGO-ZrO2 Hybrid | 5 | 15.8 | Dry | NA | RT | [53] |
| GO/SrTiO3 | 1 | 3.2 | Dry | 2.9 | 100 | [54] |
| direct-ink-writing of eco-friendly GO | 1 | 1.68 | Dry | NA | 150 | [55] |
| hydrothermally grown α-MnO2 mesoporous cubes | 100 | 33 | Dry | NA | 150 | [23] |
| polythiophene-MnO2 | 100 | 90 | RH | NA | 75 | [26] |
| Nano-MnO2/xanthan | 7 | 1.21 | Dry | 0.17 | RT | [27] |
| δ-MnO2-Epitaxial Graphene-Silicon Carbide Heterostructures | 5 | 0.27 | 55% RH | 0.14 | RT | [31] |
| MnO2 doped rGO | 1 | 6.2 | Dry | 9.8 | RT | [32] |
| Pristine GO | 1 | 4.1 | Dry | 2.5 | 150 | This work |
| MnO2@GO | 1 | 16.3 | Dry | 11.3 | 150 | This work |
| MnO2@GO | 1 | 44 | 70% RH | 37.5 | 150 | This work |
Disclaimer/Publisher’s Note: The statements, opinions and data contained in all publications are solely those of the individual author(s) and contributor(s) and not of MDPI and/or the editor(s). MDPI and/or the editor(s) disclaim responsibility for any injury to people or property resulting from any ideas, methods, instructions or products referred to in the content. |
© 2025 by the authors. Licensee MDPI, Basel, Switzerland. This article is an open access article distributed under the terms and conditions of the Creative Commons Attribution (CC BY) license (https://creativecommons.org/licenses/by/4.0/).
Share and Cite
Alouani, M.A.; Casanova-Chafer, J.; de Bernardi-Martín, S.; García-Gómez, A.; Vilanova, X.; Llobet, E. A NO2 Sensitive MnO2/Graphene Oxide Composite Based Gas Sensor. Chemosensors 2025, 13, 96. https://doi.org/10.3390/chemosensors13030096
Alouani MA, Casanova-Chafer J, de Bernardi-Martín S, García-Gómez A, Vilanova X, Llobet E. A NO2 Sensitive MnO2/Graphene Oxide Composite Based Gas Sensor. Chemosensors. 2025; 13(3):96. https://doi.org/10.3390/chemosensors13030096
Chicago/Turabian StyleAlouani, Mohamed Ayoub, Juan Casanova-Chafer, Santiago de Bernardi-Martín, Alejandra García-Gómez, Xavier Vilanova, and Eduard Llobet. 2025. "A NO2 Sensitive MnO2/Graphene Oxide Composite Based Gas Sensor" Chemosensors 13, no. 3: 96. https://doi.org/10.3390/chemosensors13030096
APA StyleAlouani, M. A., Casanova-Chafer, J., de Bernardi-Martín, S., García-Gómez, A., Vilanova, X., & Llobet, E. (2025). A NO2 Sensitive MnO2/Graphene Oxide Composite Based Gas Sensor. Chemosensors, 13(3), 96. https://doi.org/10.3390/chemosensors13030096