Article

Controlled Insertion of Silver Nanoparticles in LbL Nanostructures: Fine-Tuning the Sensing Units of an Impedimetric E-Tongue

by
Maria Helena Gonçalves
1,
Maria Luisa Braunger
1,
Anerise de Barros
2,
Rafael C. Hensel
3,
Julianna G. Dalafini
1,
Italo O. Mazali
2,
Leonardo M. Corrêa
1,
Daniel Ugarte
1,
Antonio Riul Jr
1 and
Varlei Rodrigues
1,*
1
Instituto de Física Gleb Wataghin, Universidade Estadual de Campinas, Campinas 13083-859, Brazil
2
Institute of Chemistry, University of Campinas, Campinas 13083-970, Brazil
3
São Carlos Institute of Physics, University of São Paulo, São Carlos 13566-590, Brazil
*
Author to whom correspondence should be addressed.
Chemosensors 2024, 12(6), 87; https://doi.org/10.3390/chemosensors12060087
Submission received: 17 April 2024 / Revised: 10 May 2024 / Accepted: 17 May 2024 / Published: 24 May 2024
(This article belongs to the Section Materials for Chemical Sensing)

Abstract

:
Silver nanoparticles (AgNPs) possess unique characteristics ideal for enhancing device sensitivity, primarily due to their high surface-to-volume ratio facilitating heightened interaction with analytes. Integrating AgNPs into polymers or carbon-based materials results in nanocomposites with synergistic properties, enabling the detection of minute changes in the environment across various applications. In this study, we investigate the adsorption kinetics of AgNPs within multilayered layer-by-layer (LbL) structures, specifically examining the impact of AgNPs concentration in the LbL film formation that is further explored as sensing units in an impedimetric microfluidic e-tongue. Although absorption kinetic studies are infrequent, they are crucial to optimize the AgNPs adsorption and distribution within LbL structures, significantly influencing upcoming applications. Through systematic variation of AgNPs concentration within identical LbL architectures, we applied the films as sensing units in a microfluidic e-tongue capable of distinguishing food enhancers sharing the umami taste profile. Across all tested scenarios, our approach consistently achieves robust sample separation, evidenced by silhouette coefficient, principal component analyses, and long-term stability. This work contributes to exploring controlled nanomaterial-based developments, emphasizing the importance of precise parameter control for enhanced sensor performance across diverse analytical applications.

1. Introduction

Nanoparticles (NPs) hold significant promise in addressing diverse societal needs, particularly in the realm of developments analyzing complex liquids, environmental monitoring [1,2], precision agriculture [3,4,5], and disease detection [6]. Their usage stems from effects exhibited by localized surface plasmon resonance (LSPR) [7], surface-enhanced Raman spectroscopy (SERS) [8], electron transduction [9], and catalytic activity [10,11], which find application in diverse fields such early cancer detection [12,13,14] and electronic tongues (e-tongues) [15,16,17,18,19]. E-tongues comprise an array of non-selective sensing units that collectively respond to various components, effectively generating a fingerprint of the analyzed sample [20]. They have proven successful in identifying and discriminating basic tastes [21,22,23], assessing beverages [24,25], wines [26,27], milk [28,29], coffees [30,31], and beers [32,33], among others [34,35,36,37,38]. These devices are particularly interesting in scenarios where human assessment is impractical, such as continuous monitoring of industrial processes and analysis of hazardous or unpleasant samples, including drugs [39,40], viruses [41], bacteria [29], toxins [42], and pollutants [43,44,45,46,47].
The layer-by-layer (LbL) assembly [48,49,50,51] is particularly interesting for nanoscience as it shares the same interacting forces and length scales, enabling a controlled formation of molecular assemblies in distinct molecular architectures, and with molecular level thickness control. It has been exploited in impedimetric e-tongues with the deposition of LbL films having distinct electrical characteristics onto interdigitated electrodes (IDEs) [20,52,53,54]. In an impedimetric e-tongue device, the sensing mechanisms are primarily driven by the interaction of target analytes with surface-modified IDEs. The IDEs are coated with polymers and metallic nanoparticles, which modify the electrical properties of the electrodes in response to different substances. When analytes from a solution interact with the coated IDEs, they cause changes in both the capacitance and resistance across the electrodes, which can be detected and measured. These changes in electrical impedance are influenced by the physicochemical properties of the analytes, such as their charge, size, and concentration, affecting how they interact with the electrode coatings. The impedance is measured over a wide frequency range to capture a comprehensive spectrum of the interaction effects, providing a detailed signature that can be used to identify and quantify the analytes. Advanced algorithms are then applied to interpret these impedance (modulus and phase) changes, enabling the e-tongue to discriminate between different tastes or compounds effectively. This method offers a robust, sensitive, and versatile approach to analyzing complex solutions in a non-destructive and label-free manner.
Briefly, the recent literature brings the use of nanosystems in e-tongues, such as L. Mercante et al. demonstrating the use of electrospun zinc nanofibers alongside reduced graphene oxide and graphene quantum dots for glucose monitoring [55], and multiwalled carbon nanotubes with titanium dioxide employed in the detection of the pesticide triclosan [56]. In another instance, K. Fukushima et al. incorporated copper tetrasulfonated phthalocyanine, polyaniline, reduced graphene oxide, poly(allylamine hydrochloride), and silver nanoparticles (AgNPs) into an e-tongue array designed to detect flavor enhancers [57]. Mercante et al. synthesized Au NPs stabilized with poly(allylamine hydrochloride) (PAH) to create Au@PAH NPs [28], subsequently utilized in an impedimetric e-tongue for milk analysis. Comparatively, an e-tongue array comprising pristine polymer layers (without Au@PAH NPs) failed to distinguish different milk fat contents. However, incorporating AuNPs@PAH into the PAH polymer matrix enabled discrimination among fat, semi-skimmed, and skimmed milk. R. Hensel et al. [58] employed a distinct approach by integrating physically prepared AgNPs as sensing units in another impedimetric e-tongue setup, successfully distinguishing basic tastes and flavor enhancers with an umami taste profile.
Several studies have examined the efficacy of potentiometric e-tongues in assessing umami taste intensity and flavor enhancers. Wang et al. demonstrated the e-tongue’s ability to accurately discern concentration differences, consistent with human sensory evaluation [59]. Yang et al. expanded this by analyzing various food and beverage samples, including tea, tomato, honey, and wine, and its potential in pharmaceutical formulations [60]. They found promising results in evaluating umami tastes and comparing enhancers. Zhu et al. explored umami perception in different food matrices, correlating perceived intensity with umami components and device responses [61]. They observed positive correlations between perceived umami and amino acids/nucleotides. Transistor-like measurements have also been explored for detecting umami taste. Ahn et al. developed a graphene-based bioelectronic tongue with high sensitivity and selectivity for detecting sweet and umami tastes at low concentrations [62]. Lee et al. investigated umami perception in honeybees using a bioelectronic tongue, detecting l-monosodium glutamate (MSG) with remarkable sensitivity [63].
Here, we investigated the adsorption kinetics of chemically synthesized AgNPs in a polymeric matrix, controlling the NPs concentration in the nanocomposites formed. We systematically studied the time required to optimize the adsorption of AgNPs in LbL assembly, enabling the fabrication of different sensing units having distinct electrical response using the same film structure. The LbL films were deposited onto electrodes linearly displayed in a microfluidic channel, with dynamic data acquisition as the liquids passed through them. Our results demonstrated enhanced capability in distinguishing basic flavors and samples that have the umami taste, exploiting a delicate adjustment of the AgNP concentration in the LbL structure. With that, we emphasize the critical importance of fine-tuning the properties of the nanostructures applied as sensing units in many applications.

2. Materials and Methods

2.1. Silver Nanoparticles Chemical Synthesis

AgNPs were chemically synthesized following the method outlined by Lee and Meisel [64]. In brief, 9 mg of silver nitrate ( A g N O 3 ) is dissolved in 50 mL of ultrapure water by stirring and the mixture is simultaneously heated to boiling on a hot plate. Upon reaching boiling point, 5 mL of 1% sodium citrate ( N a 3 C 6 H 5 O 7 ) is introduced into the solution. It is noteworthy that sodium citrate serves as both a reduction and stabilizing agent [64]. Following the addition of sodium citrate (initially colorless), the solution gradually transitions from yellow to green-ocre, indicating the formation of silver nanoparticles. Subsequently, the solution is stirred for 20 min before being allowed to cool to room temperature.

2.2. Silver Nanoparticles Transmission Electron Microscopy and UV-Vis Absorption Analysis

We analyzed an aliquot of the AgNPs suspension (1:5 ratio in DI water) using a Biochrom Libra UV-visible spectrophotometer model S50 (Cambridge, England), employing a quartz cuvette, and conducting a spectral sweep from 190 nm to 1100 nm. The morphology and size distribution of the AgNPs were analyzed in a FEI TECNAI G2 F20 Transmission Electron Microscope (TEM) at the Structural Characterization Laboratory at Universidade Federal de São Carlos. For TEM analysis, the AgNPs solution was diluted in deionized water at a 1:1 ratio and deposited onto an ultra-thin 400 mesh copper grid.

2.3. Layer-by-Layer Technique and Deposition Parameters

The LbL technique allows the spontaneous adsorption of molecules with precise thickness control during the film assembly [48,49,65]. Here, poly(allylamine hydrochloride) (PAH) is the positive polyelectrolyte, while poly(sodium 4-styrenesulfonate) (PSS) and AgNPs are the negative polyelectrolytes. Initially, a drop of PAH solution is applied onto the electrode surface for 8 min, followed by removal using a syringe and a thorough washing with ultrapure water to eliminate loosely bound material. The surface is then dried for 10 min and the process is repeated for the opposite polyelectrolyte, as depicted in Figure S1 in Supplementary Materials. This cycle is repeated until the desired number of deposited bilayers is achieved; (PAH/PSS)15 denotes an LbL film composed of 15 deposited bilayers.
Our sensor array comprises (i) a bare interdigitated electrode (IDE1), (ii) an IDE covered with (PAH/PSS)15 bilayers (IDE2), (iii) an IDE covered with (PAH/PSS)15 followed by (PAH/AgNPs)15 (IDE3), and iv) an IDE similar to IDE3 but with AgNPs ten times more concentrated, resulting in (IDE4).

2.3.1. Zeta Potential

The surface charge characteristics from the AgNPs were assessed through the Zeta potential measurement, indicative of the electrical charge present within the nanoparticle’s surrounding bilayer. It was conducted utilizing a Malvern ZS-Zen 3600 particle-size zeta Potential Analyzer (Worcestershire, UK). The AgNPs solution was appropriately diluted at a 1:200 ratio in DI water, and subsequently loaded into capillary cells featuring gold electrodes for examination. Measurements were performed in triplicate, and the acquired data were processed using the Zetasizer Software program (version 7.11, Malvern, UK).

2.3.2. Adsorption Kinetics

The LbL adsorption kinetics of materials onto a solid substrate [66,67] is a crucial step, not always carried out, establishing the optimal adsorption time of the electrolytes on a substrate to achieve a uniform LbL coating. Briefly, AgNPs can electrostatically interact with an oppositely charged material (PAH). By keeping a fixed immersion time in PAH at 8 min, the adsorption kinetics can be obtained for varying immersion times in the AgNPs solution, as described elsewhere [68]. After each immersion, the quartz plates are allowed to air dry for 15 min, resulting in a multilayered LbL structure. UV-Vis absorption spectroscopy is employed at each deposition step, confirming the material adsorption by the characteristic AgNP absorption band at 420 nm. This process is iterated, gradually increasing the adsorption time of the AgNPs (Figure S2).

2.4. Microfluidic E-Tongue Setup

Briefly, as described in a previous publication [69], the microfluidic e-tongue setup consists of four IDEs linearly arranged on a gold-plated printed circuit board (Figure S3). Positioned along a single microchannel, these IDEs facilitate the propulsion of the analyte using a syringe pump. The integration and automation of this e-tongue device streamlines data acquisition, reducing potential errors associated with manual operations and minimizing user contact with the analyte during data collection. A multiplexer switches data acquisition between IDEs during measurements performed in triplicate for statistical validation. Impedance data are acquired in a Solartron 1260A Impedance Analyzer (Hampshire, England) within 1 Hz − 106 Hz frequency, with an AC signal set at 25 mV and a flow rate of 15 mL/h inside the microchannel. Following triplicate acquisitions for each analyte, the microchannel and IDEs are thoroughly washed with 10 mL of deionized water at moderate flow. This cleansing process not only maintains measurement integrity but also assesses any variations in sensor impedance post-analyte interaction, thereby mitigating cross-contamination between samples.

2.4.1. Analytes

An evaluation used for e-tongues is to check their performance across basic tastes: bitter (caffeine, C 8 H 1 0 N 4 O 2 ), sweet (sucrose, C 1 2 H 2 2 O 1 1 ), sour (hydrochloric acid, H C l ), salty (sodium chloride, N a C l ), and umami (L-glutamic acid, C 5 H 9 N O 4 ). Each taste was represented by 1 mM solutions, chosen to remain below the human threshold for saltiness and sweetness (10 mM) [70]. Additionally, tests encompassed food enhancers, e.g., samples having the same umami taste including monosodium glutamate (Aji-no-moto, C 5 H 8 N N a O 4 + H 2 O ), disodium inosinate (Ajitide IMP, C 1 0 H 1 1 N 4 N a 2 O 8 P + 7 H 2 O ), a 1:1 combination of disodium inosinate and disodium guanylate (Ajitide I+G, C 1 0 H 1 2 N 5 N a 2 O 8 P + 7 H 2 O ), and a yeast extract with umami taste (Savorboost U), all provided by Ajinomoto Brazil and used as received. Furthermore, the e-tongue’s ability to distinguish monosodium glutamate from different manufacturers was investigated by analyzing L-glutamic acid and commercial monosodium glutamate (Accent). While molar mass information for all materials used in the tests was unavailable, consistent concentrations with those of L-glutamic acid were maintained for all samples in all experiments.

2.4.2. Data Analysis

The impedance data obtained from the e-tongue were analyzed by Principal Component Analysis (PCA) [34,36], a statistical method that facilitates the identification of patterns and structures in raw data, unveiling relationships between variables and offering valuable insights for sample differentiation. In the context of e-tongue data, the PCA score plot typically shows clusters grouping similar samples. The k-means method [71] is employed to determine these clusters, with their quality assessed by the silhouette coefficient (SC). Introduced by Kaufman and Rousseeuw [72], the silhouette coefficient serves as a quality index for clustering. SC values ranging from 1.00 to 0.71 indicate a very robust cluster structure, SC between 0.70 to 0.51 reflects a reasonably well-structured cluster, SC between 0.50 to 0.26 indicates a weak cluster structure, and SC ≤ 0.25 suggests no discernible cluster structures [72]. We used the open-source software Orange for data analysis and visualization [73,74].

3. Results and Discussion

3.1. Synthesis of NPs

AgNPs exhibit a distinctive characteristic: the presence of a light extinction peak within the wavelength range of 400 to 670 nm. This peak arises from the collective oscillation of electrons in phase with the incident radiation. Noble elements such as silver demonstrate d-d transition bands that lead to a shift in the plasmonic frequency to the visible part of the spectrum, giving a specific color to the NPs. The Lee and Meisel synthesis employing a sodium citrate reduction typically yields nanoparticles with diameters ranging from 50 nm to 100 nm, featuring an absorption peak at 420 nm [75] that is observed in the UV-Vis absorption spectroscopy measurements, as shown in Figure 1a.
Figure 1b presents TEM micrographs of the AgNPs, revealing predominantly spherical nanoparticles along with some nanorods. The images also indicate AgNPs not uniformly dispersed on the TEM grid; instead they form agglomerates of varying sizes. This can be attributed to the sample preparation process, particularly to the solvent drying process, which may lead to nanoparticle aggregation. Additionally, interactions between the passivating layers of the nanoparticles can contribute to this agglomeration. The size distribution obtained from the TEM images is depicted in Figure 1c, showing an average diameter of 50 ± 3 nm. This diameter falls within the expected size range, confirming the successful synthesis of AgNPs [75].
In our case, the cohesion between layers in the LbL deposition was primarily driven by electrostatic forces. As we wanted to intercalate the AgNPs layer with PAH, we had to be careful as the solute’s cationic or anionic behavior could be influenced by the solution’s pH. In our study, we maintained a fixed pH value of 6.8 in the as-prepared AgNP solution. It is noteworthy to mention that altering the pH of the AgNPs solution resulted in NPs degradation. At pH 6.8, the Zeta potential is 24.56 mV, a specific condition selected to optimize the AgNPs stability and facilitate their intercalation in the LbL films.

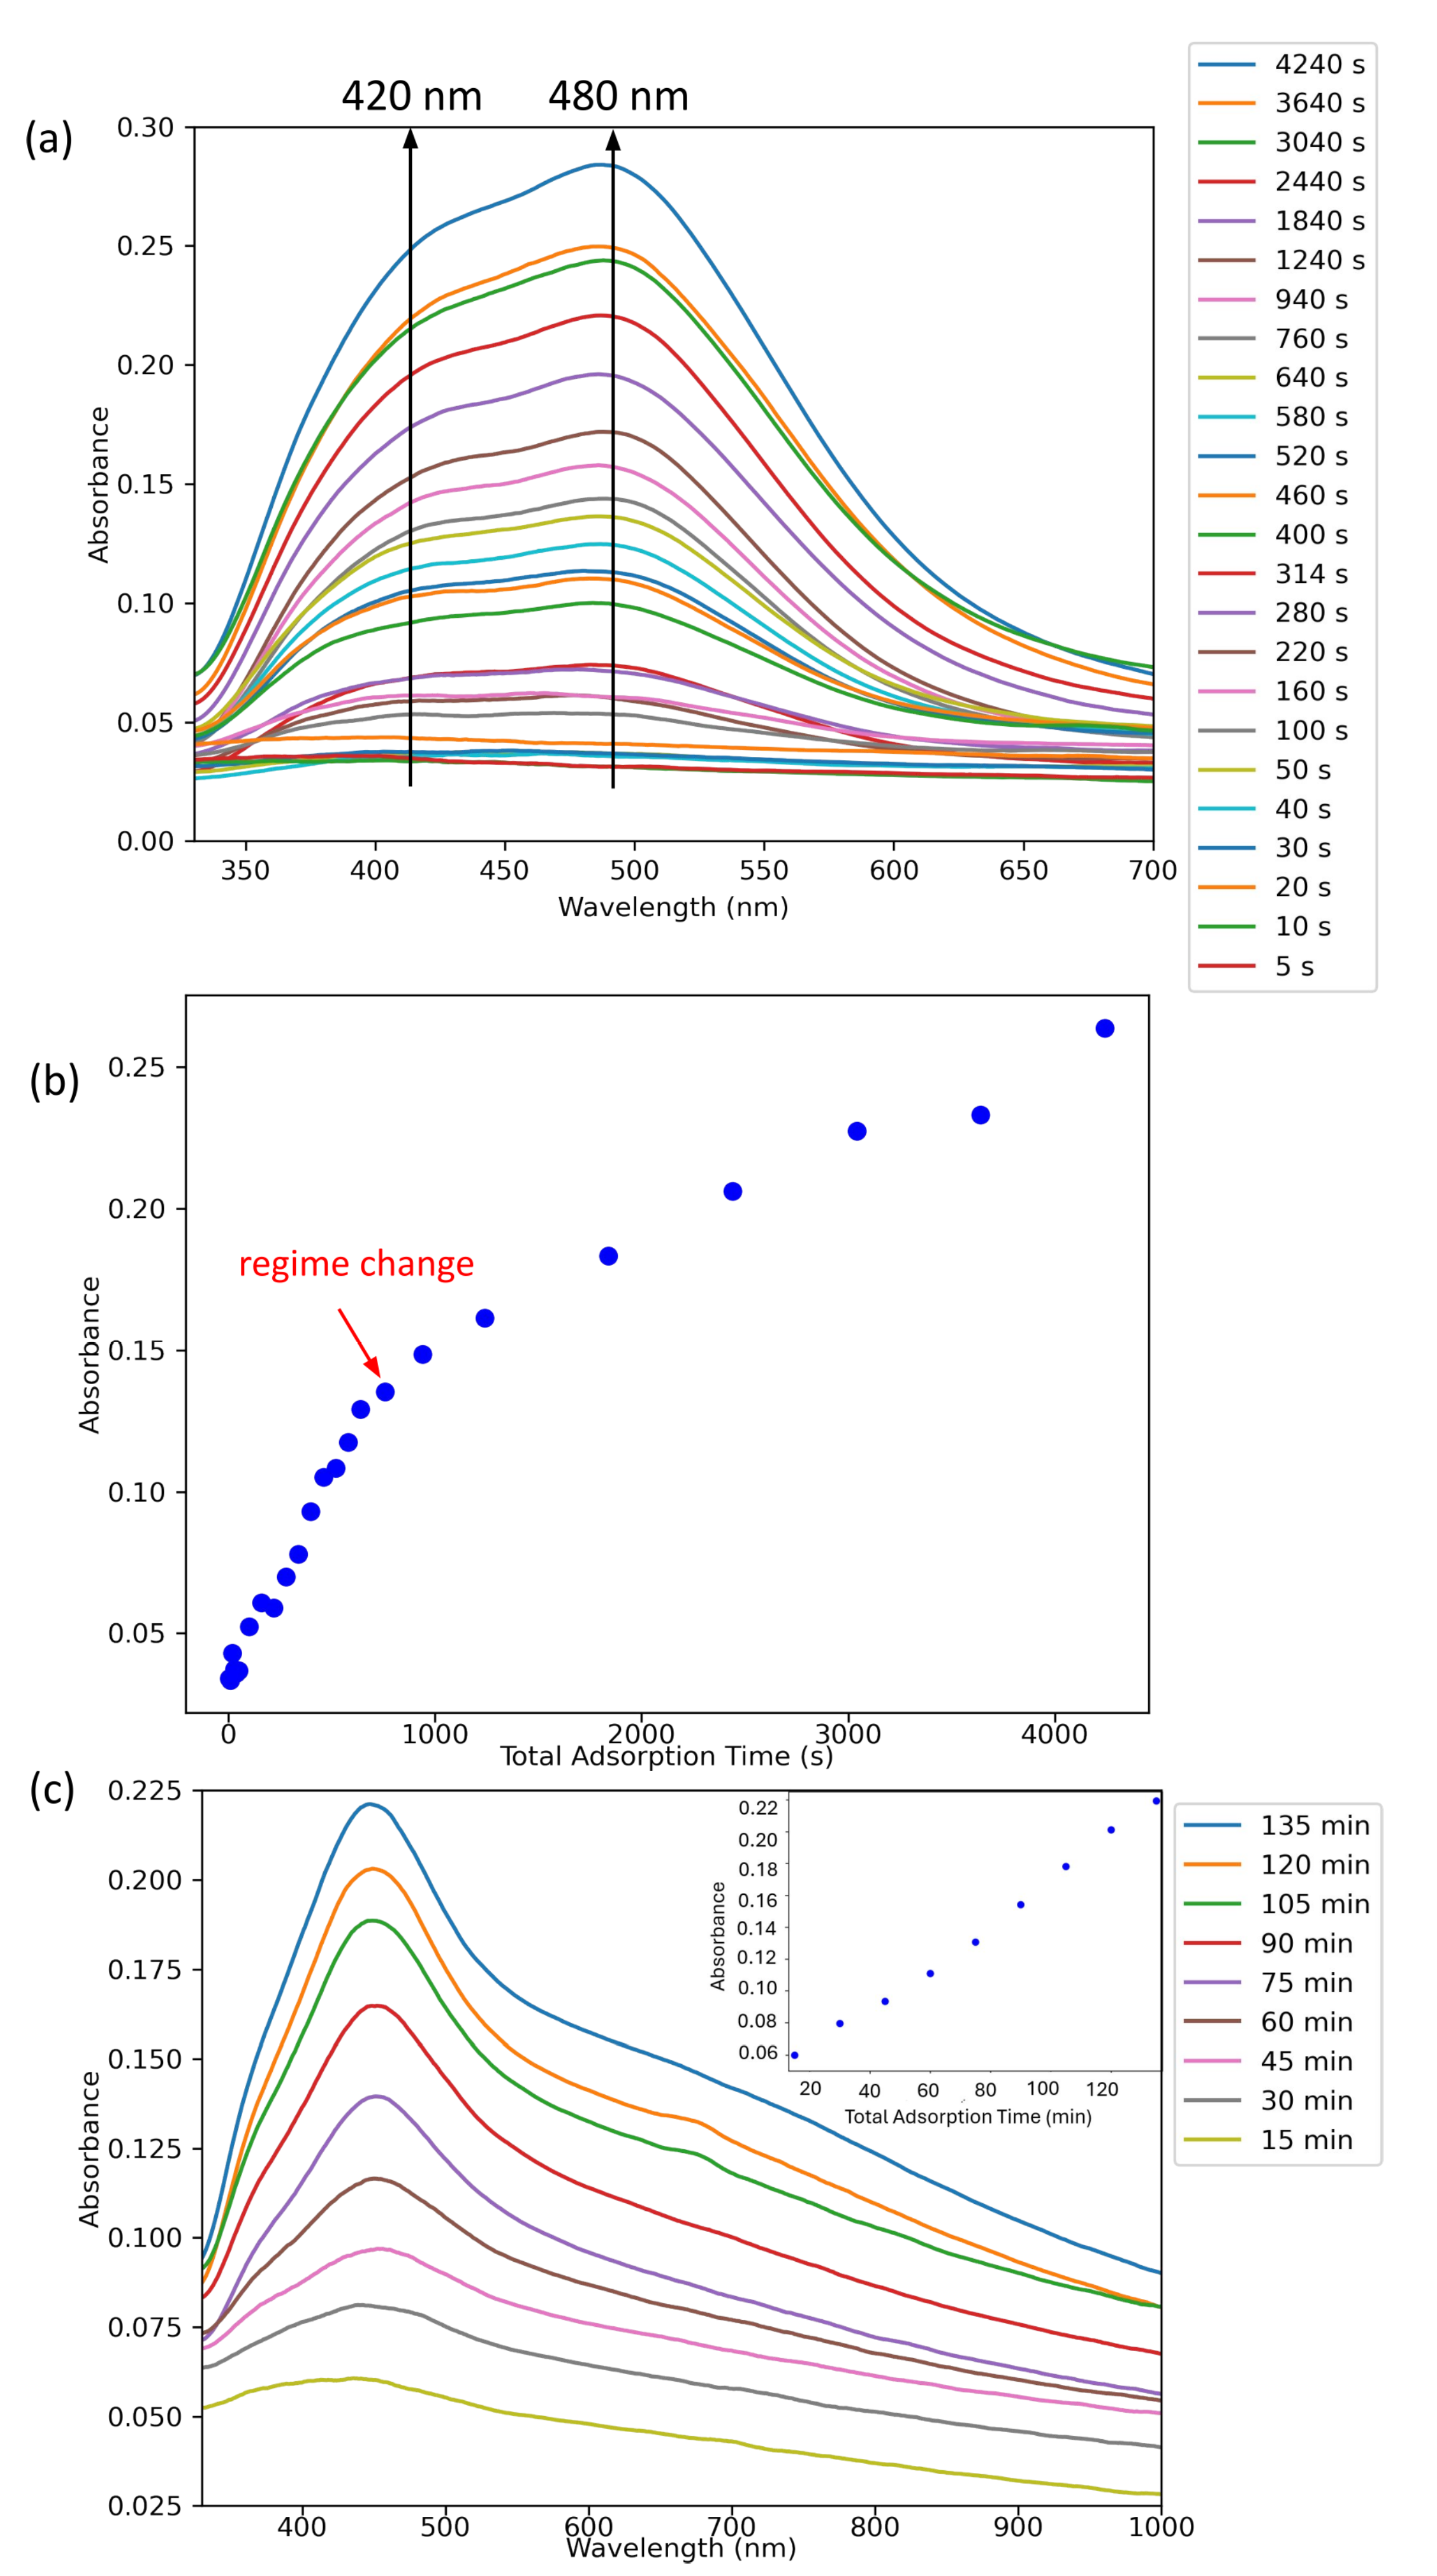
3.2. Silver NP Adsorption Kinetics

The UV-Vis absorption spectra following the deposition of each layer of AgNPs are depicted in Figure 2a, with an observed slight increase in the absorbance maximum between 400 and 500 nm after the deposition. Notably, a more pronounced peak appears at 486 nm, indicating a shift compared to the colloidal spectrum, which may be attributed to the agglomeration of AgNPs on the film surface, a phenomenon also observed in the TEM analysis (see Figure 1b) [76]. Figure 2b presents the absorbance at 420 nm for each deposited bilayer as a function of the immersion time in the AgNPs solution. A change in the adsorption regime is observed at around 940 s (approximately 15 min) of immersion time, indicating the optimal time for forming a monolayer of AgNPs on the quartz plate [77]. In Figure 2c we can see the LbL absorbance for a 15 min immersion time deposition, with the absorbance at 420 nm exhibiting a linear increase at each deposited bilayer, suggesting that the same amount of material is deposited on the surface at each deposition step in the LbL assembly [78].

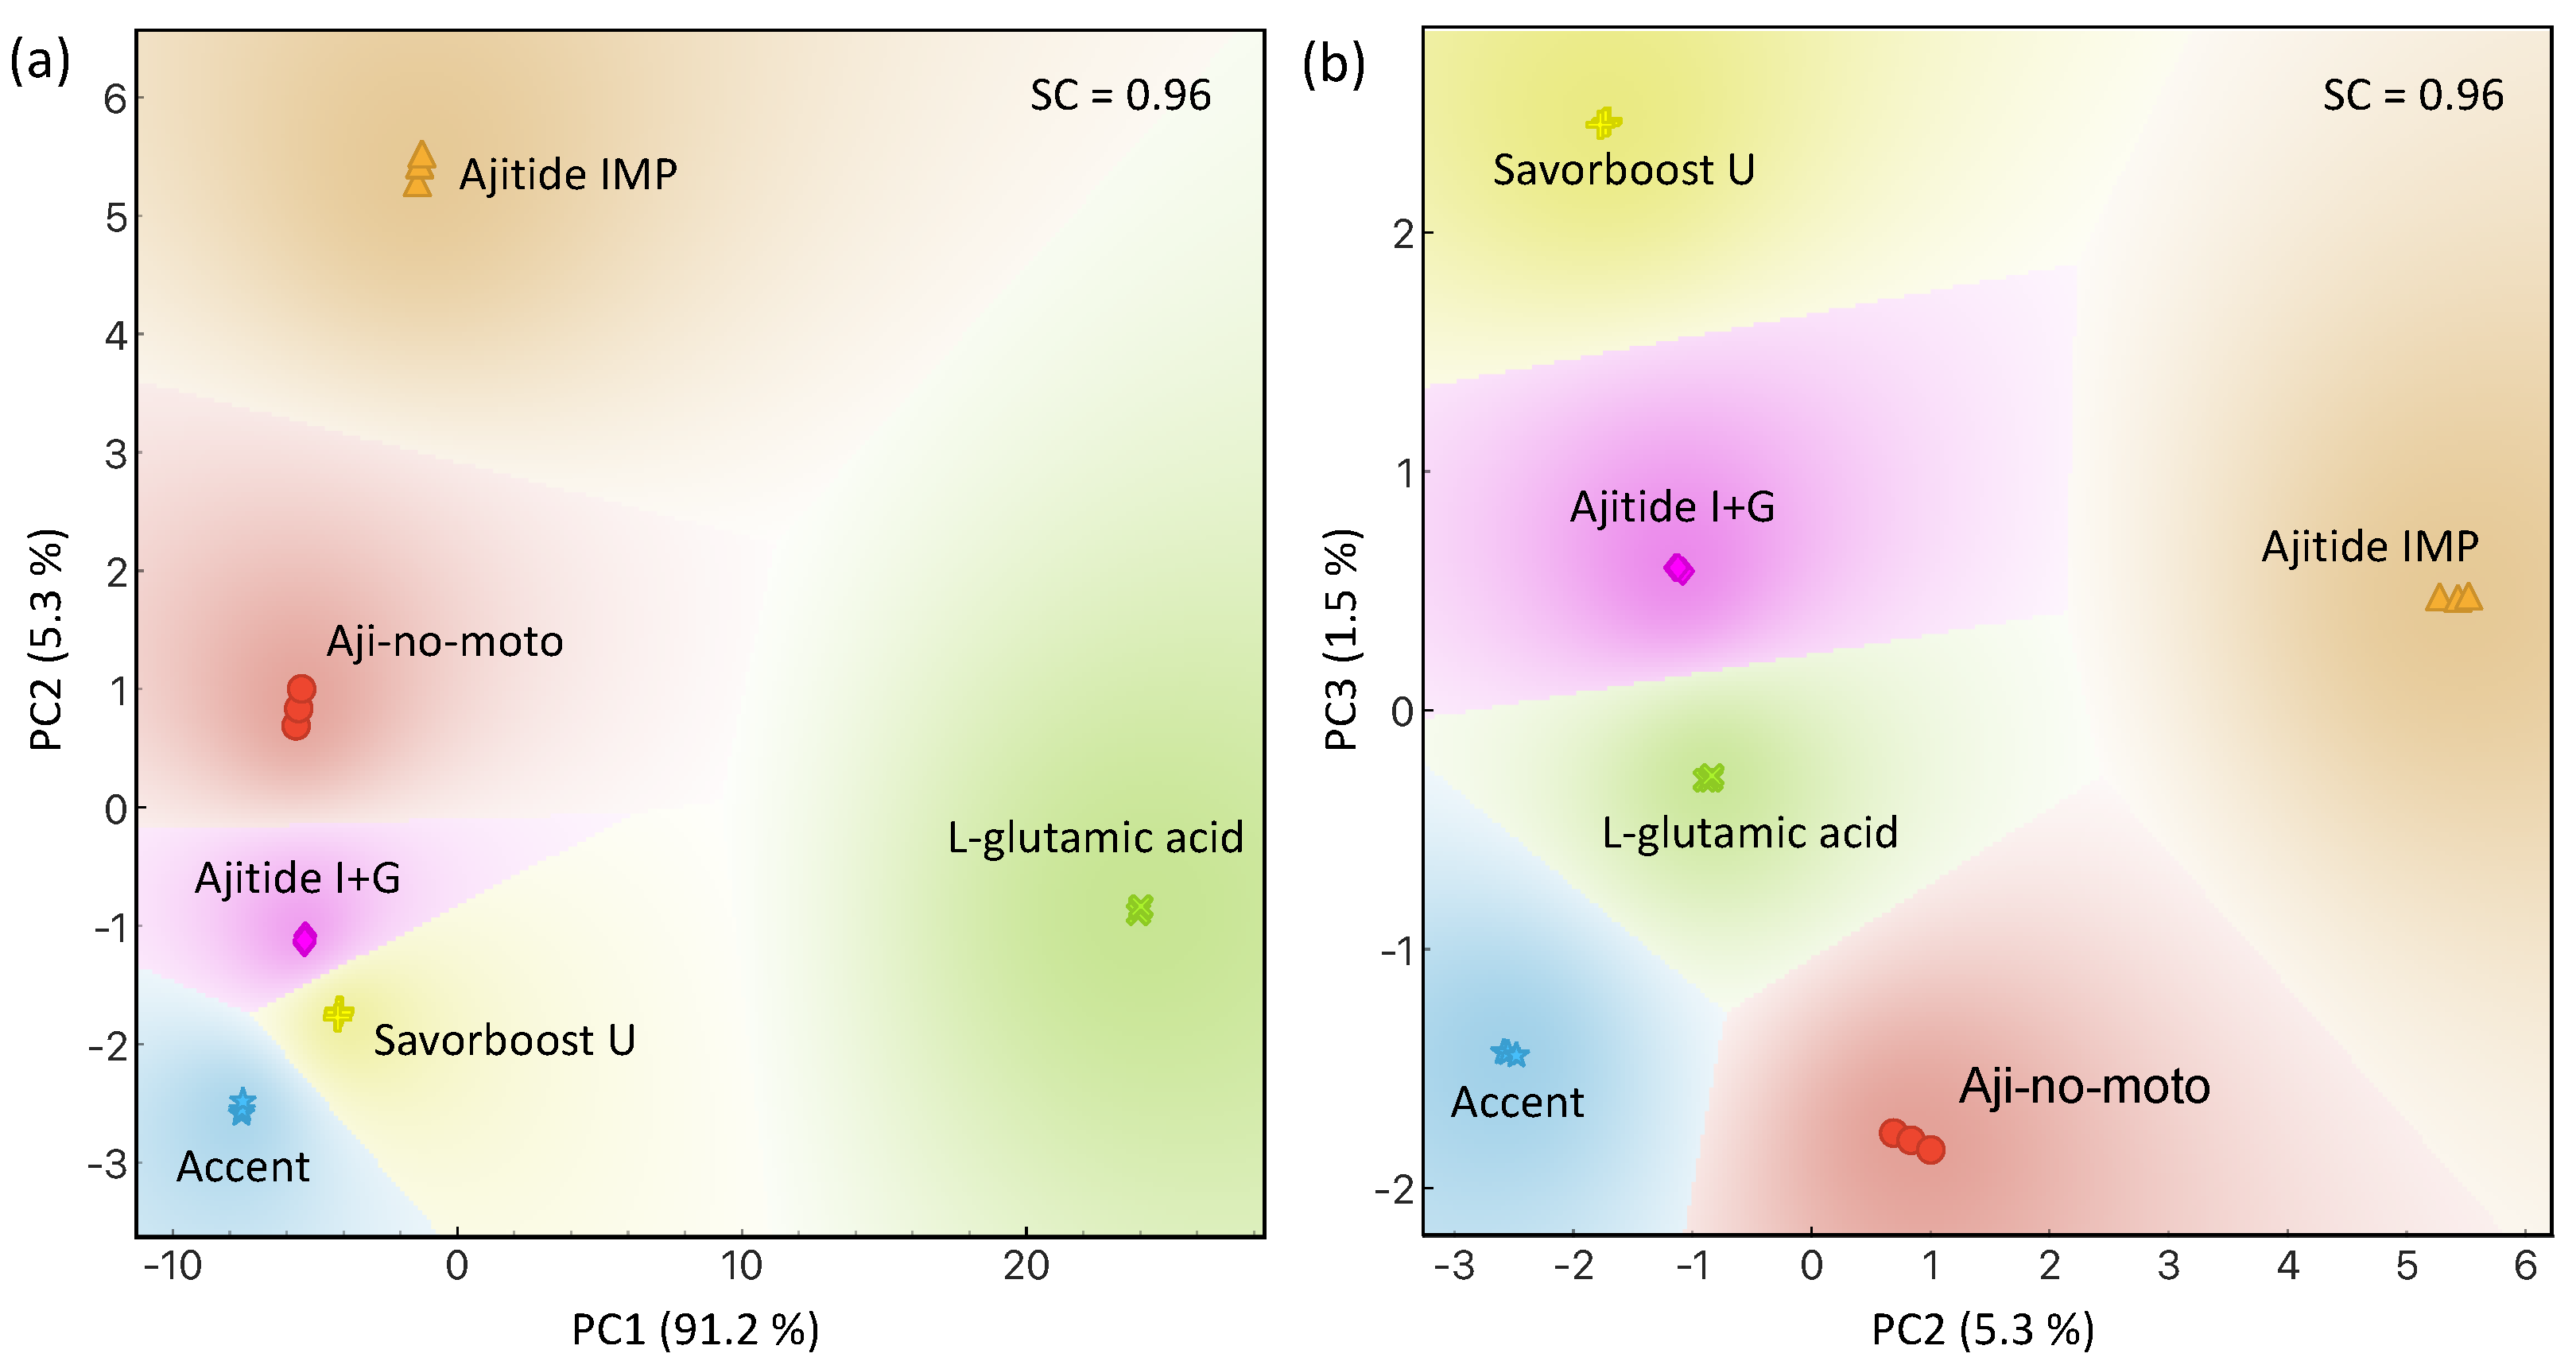
3.3. E-Tongue Characterization

As a foundational test, the e-tongue was applied to discern basic flavors, yielding a SC = 0.96, stating a robust cluster structure and excellent discrimination among different tastes. The high SC value suggests a successful differentiation between the basic flavors with a high degree of confidence. Furthermore, there are no signs of cross-contamination and the sensor also displayed no change in performance after a year of usage. The sensor’s ability to maintain consistent performance over a year without any special care demonstrates its reliability and durability. This is essential for practical applications where sensors may be deployed for extended periods without frequent maintenance or calibration. The data supporting this analysis can be found in the Supplementary Materials, Figures S4–S7.
Figure 3a illustrates the score plot of PC1 vs. PC2, capturing a total variance of 96.5%, with PC1 carrying 91.2% of the information and PC2 describing 5.3%. The e-tongue exhibits excellent performance in distinguishing samples having the umami flavor, achieving a robust SC of 0.96. Comparing this SC value with that obtained by Hensel et al. [58], who used physically synthesized Ag nanoparticles, demonstrates that this setup outperforms theirs in discriminating umami flavors. PC1 may visually suggest inadequate separation of the last five analytes; however, the projection of the data on PC1 facilitates the discrimination between L-glutamic acid and a commercially acquired food enhancer, while PC2 enables a complete discrimination of the latter. It is important to note that the SC is calculated based on the number of principal components (PCs) used in the PCA to reconstruct the original data. To further discriminate among the six food enhancers, we can also explore the score plot of PC2 vs. PC3, shown in Figure 3b. It clearly distinguishes between different samples, providing additional insight into the discrimination capabilities of the e-tongue.
Our e-tongue is formed by sensing units varying the density of chemically synthesized AgNPs within LbL layers, and the e-tongues detailed by Mercante et al. [28] and Hensel et al. [58] are the closest to compare. The former employs AuNPs stabilized with PAH in layered LbL films, albeit without adjusting NP density as we have done. Additionally, their application focused on a distinct analyte, milk. In contrast, Hensel et al. modulated LbL films by varying the AgNPs density, conducted umami measurements, and utilized SC analysis, facilitating a more pragmatic comparison. Both our device and Hensel’s exhibit proficient responses to umami flavors and enhancers. However, unlike our approach, Hensel et al. did not directly incorporate AgNPs layers within the LbL film; instead, NPs are introduced via physical deposition after the LbL film formation. Furthermore, our methodology involves microfluidic setup [69], while Hensel et al. individually immersed sensing units in the analyte. Consequently, our current approach offers a distinct strategy with considerable potential for the long-term usage of an e-tongue, given the versatility of utilizing metal particles as standalone layers within such films, thereby expanding their compositional possibilities.
Regarding the literature on umami detection, it is worth mentioning that three studies utilized potentiometric devices [59,60,61], while two employed transistor-like measurements [62,63], making a straightforward comparison difficult with the impedimetric measurements carried out in this work. The most sensitive detection reported involved selective measurements targeting MSG [63]. However, our approach aims for simplicity, utilizing non-selective sensing units enhanced by silver nanoparticles. In this study, umami compounds like monosodium glutamate and nucleotides (e.g., disodium inosinate and disodium guanylate) interact uniquely with the sensor’s surface-modified electrodes. The distinct LbL films on the electrodes cause variations in electrical impedance when these molecules interact with them, leading to distinctive impedance signatures that are characteristic of umami flavors. The inclusion of AgNPs in the electrode coating enhances these interactions due to their high conductivity and catalytic properties. As a result, the e-tongue can not only distinguish umami from other basic tastes but also differentiate between various umami-enhancing compounds and brands. This includes identifying different types of monosodium glutamate provided by Ajinomoto, offering valuable insights for quality control and product differentiation in the food industry.

4. Conclusions

In this study, we explored the incorporation of AgNPs into an LbL assembly to fabricate sensing units within a microfluidic, impedimetric e-tongue setup. Our methodology, inspired by previous work, aimed to control the spatial distribution and concentration of AgNPs within the composite structure to enhance the e-tongue’s performance. Through systematic variation of AgNP concentration, we demonstrated an improved capability in distinguishing different umami taste-enhancing compounds, highlighting the critical importance of parameter control in nanocomposite formation, as the NP adsorption kinetics. Comparison with similar devices documented in the literature underscored the distinctiveness of our approach. Also, by demonstrating no cross-contamination and long-term stability, the studied sensor device proved to be robust and suitable for diverse real-world applications, offering reliable and consistent performance over time. Our methodology of directly incorporating AgNP layers within the LbL film and employing microfluidic measurements offers a unique strategy with significant potential for expanding the compositional possibilities of LbL films in sensor applications. Overall, our study contributes to the ongoing exploration of nanomaterial-based sensor development, emphasizing the importance of precise parameter control and innovative methodologies in enhancing sensor performance for diverse analytical applications.

Supplementary Materials

The following supporting information can be downloaded at: https://www.mdpi.com/article/10.3390/chemosensors12060087/s1. Figure S1. Illustration of the layer-by-layer (LbL) technique used in this study. Figure S2. Adsorption kinetics procedure. Figure S3. Schema of the microfluidic e-tongue device. Figure S4. Impedance of the four sensing units for each basic palate. Figure S5. The impedance of the four sensing units obtained after testing each basic palate, with water as the analyte. Figure S6. PCA score plot for each basic palate. Figure S7. PCA score plot obtained for each basic palate, using the same sensor device used in the measurements presented in S6, after 1 year.

Author Contributions

Conceptualization, A.R.J. and V.R.; Data Curation M.H.G., A.R.J. and V.R.; formal Analysis, M.H.G., R.C.H. and J.G.D.; funding Acquisition, D.U., I.O.M., A.R.J. and V.R.; investigation, M.H.G., M.L.B., A.d.B., R.C.H. and L.M.C. methodology, M.H.G., M.L.B., A.d.B., R.C.H. and L.M.C. project Administration, D.U., I.O.M., A.R.J. and V.R.; resources, D.U., I.O.M., A.R.J. and V.R.; Supervision, A.R.J. and V.R.; Writing—Original Draft, M.H.G. and V.R.; Writing—Review & Editing, M.H.G., M.L.B., A.d.B., R.C.H., J.G.D., L.M.C., D.U., I.O.M., A.R.J. and V.R. All authors have read and agreed to the published version of the manuscript.

Funding

This work was supported by the Brazilian Agencies Fundação de Amparo à Pesquisa do Estado de São Paulo (Fapesp), Conselho Nacional de Desenvolvimento Científico e Tecnológico (CNPq) and Coordenação de Aperfeiçoamento de Pessoal de Nível Superior (Capes). M.H.G. thanks funding from CNPq and Capes. M.L.B. thanks funding from Fapesp (proc. 2015/14836-9) A.B. thanks funding from Fapesp (proc. 2022/02893-1). R.C.H. thanks funding from Fapesp (proc. 2020/15095-0). J.G.D. thanks funding from CNPq. L.M.C. thanks funding from CNPq (proc. 140596/2020-8). D.U. thanks funding from CNPq (proc. 402571/2016-9, 306513/2017-0, 402676/2021-1 and 403359/2023-6) I.O.M. thanks funding from CNPq (proc. 310131/2020-0 and 405087/2021-7). A.R.J. thanks funding from CNPq (proc. 308943/2021-0 and 403359/2023-6). V.R. thanks funding from Fapesp (proc. 2007/01722-9, 2020/15497-1 and 2022/03869-7) and CNPq (proc. 403359/2023-6, 306787/2020, 555647/2006-4 and 577046/2008-0).

Institutional Review Board Statement

Not applicable.

Informed Consent Statement

Not applicable.

Data Availability Statement

The data presented in this study are available on request from the corresponding author.

Acknowledgments

We thank the Food Ingredients Division of Ajinomoto in Brazil for providing the umami samples. We thank Igor Fier for the development of the multiplexed microfluidic setup and acquisition software.

Conflicts of Interest

The authors declare no conflict of interest.

References

  1. Wassie, A.T.; Bachheti, R.K.; Bachheti, A. Recent Advances in Nanoparticles for Environmental Monitoring and Sensing: An Overview. In Nanomaterials for Environmental and Agricultural Sectors; Bachheti, R.K., Bachheti, A., Husen, A., Eds.; Springer: Singapore, 2023; pp. 107–122. [Google Scholar] [CrossRef]
  2. Caroleo, F.; Magna, G.; Naitana, M.L.; Di Zazzo, L.; Martini, R.; Pizzoli, F.; Muduganti, M.; Lvova, L.; Mandoj, F.; Nardis, S.; et al. Advances in Optical Sensors for Persistent Organic Pollutant Environmental Monitoring. Sensors 2022, 22, 2649. [Google Scholar] [CrossRef] [PubMed]
  3. Mondal, R.; Dam, P.; Chakraborty, J.; Paret, M.L.; Katı, A.; Altuntas, S.; Sarkar, R.; Ghorai, S.; Gangopadhyay, D.; Mandal, A.K.; et al. Potential of nanobiosensor in sustainable agriculture: The state-of-art. Heliyon 2022, 8, e12207. [Google Scholar] [CrossRef] [PubMed]
  4. Chugh, B.; Poddar, D.; Singh, A.; Yadav, P.; Thakur, S.; Nguyen, T.A.; Rajendran, S. 6—Nanoparticles-based sensors for agricultural application. In Nanosensors for Smart Agriculture; Denizli, A., Nguyen, T.A., Rajendran, S., Yasin, G., Nadda, A.K., Eds.; Micro and Nano Technologies; Elsevier: Amsterdam, The Netherlands, 2022; pp. 117–146. [Google Scholar] [CrossRef]
  5. Nadporozhskaya, M.; Kovsh, N.; Paolesse, R.; Lvova, L. Recent Advances in Chemical Sensors for Soil Analysis: A Review. Chemosensors 2022, 10, 35. [Google Scholar] [CrossRef]
  6. Naikoo, G.A.; Arshad, F.; Hassan, I.U.; Awan, T.; Salim, H.; Pedram, M.Z.; Ahmed, W.; Patel, V.; Karakoti, A.S.; Vinu, A. Nanomaterials-based sensors for the detection of COVID-19: A review. Bioeng. Transl. Med. 2022, 7, e10305. [Google Scholar] [CrossRef] [PubMed]
  7. Anker, J.N.; Hall, W.P.; Lyandres, O.; Shah, N.C.; Zhao, J.; Van Duyne, R.P. Biosensing with plasmonic nanosensors. Nat. Mater. 2008, 7, 442–453. [Google Scholar] [CrossRef] [PubMed]
  8. Er, E.; Sánchez-Iglesias, A.; Silvestri, A.; Arnaiz, B.; Liz-Marzán, L.M.; Prato, M.; Criado, A. Metal Nanoparticles//MoS2 Surface-Enhanced Raman Scattering-Based Sandwich Immunoassay for α-Fetoprotein Detection. ACS Appl. Mater. Interfaces 2021, 13, 8823–8831. [Google Scholar] [CrossRef] [PubMed]
  9. Montes-García, V.; Squillaci, M.A.; Diez-Castellnou, M.; Ong, Q.K.; Stellacci, F.; Samorì, P. Chemical sensing with Au and Ag nanoparticles. Chem. Soc. Rev. 2021, 50, 1269–1304. [Google Scholar] [CrossRef]
  10. Aralekallu, S.; Sannegowda, L.K. Chapter 25—Metal nanoparticles for electrochemical sensing applications. In Handbook of Nanomaterials for Sensing Applications; Hussain, C.M., Kailasa, S.K., Eds.; Micro and Nano Technologies; Elsevier: Amsterdam, The Netherlands, 2021; pp. 589–629. [Google Scholar] [CrossRef]
  11. Białas, K.; Moschou, D.; Marken, F.; Estrela, P. Electrochemical sensors based on metal nanoparticles with biocatalytic activity. Microchim. Acta 2022, 189, 172. [Google Scholar] [CrossRef] [PubMed]
  12. Soares, J.C.; Iwaki, L.E.O.; Soares, A.C.; Rodrigues, V.C.; Melendez, M.E.; Fregnani, J.H.T.G.; Reis, R.M.; Carvalho, A.L.; Corrêa, D.S.; Oliveira, O.N.J. Immunosensor for Pancreatic Cancer Based on Electrospun Nanofibers Coated with Carbon Nanotubes or Gold Nanoparticles. ACS Omega 2017, 2, 6975–6983. [Google Scholar] [CrossRef]
  13. Jensen, G.C.; Krause, C.E.; Sotzing, G.A.; Rusling, J.F. Inkjet-printed gold nanoparticle electrochemical arrays on plastic. Application to immunodetection of a cancer biomarker protein. Phys. Chem. Chem. Phys. 2011, 13, 4888–4894. [Google Scholar] [CrossRef]
  14. Khazaei, M.; Hosseini, M.S.; Haghighi, A.M.; Misaghi, M. Nanosensors and their applications in early diagnosis of cancer. Sens. Bio Sens. Res. 2023, 41, 100569. [Google Scholar] [CrossRef]
  15. Vlasov, Y.; Legin, A. Non-selective chemical sensors in analytical chemistry: From “electronic nose” to “electronic tongue”. Fresenius J. Anal. Chem. 1998, 361, 255–260. [Google Scholar] [CrossRef]
  16. Zniber, M.; Vahdatiyekta, P.; Huynh, T.P. Analysis of urine using electronic tongue towards non-invasive cancer diagnosis. Biosens. Bioelectron. 2023, 219, 114810. [Google Scholar] [CrossRef] [PubMed]
  17. Braz, D.C.; Neto, M.P.; Shimizu, F.M.; Sá, A.C.; Lima, R.S.; Gobbi, A.L.; Melendez, M.E.; Arantes, L.M.B.; Carvalho, A.L.; Paulovich, F.V.; et al. Using machine learning and an electronic tongue for discriminating saliva samples from oral cavity cancer patients and healthy individuals. Talanta 2022, 243, 123327. [Google Scholar] [CrossRef] [PubMed]
  18. Shimizu, F.M.; Gaál, G.; Braunger, M.L.; Riul, A. Recent Developments on Devices Applied to Impedimetric Electronic Tongues; IOP Publishing: Bristol, UK, 2021. [Google Scholar] [CrossRef]
  19. Facure, M.H.; Braunger, M.L.; Mercante, L.A.; Paterno, L.G.; Riul, A., Jr. Electrical Impedance-Based Electronic Tongue In Encyclopedia of Sensors and Biosensors (First Edition), 1st ed.; Narayan, R., Ed.; Elsevier: Oxford, UK, 2023; pp. 567–590. [Google Scholar] [CrossRef]
  20. Riul, A., Jr.; Dantas, C.A.R.; Miyazaki, C.M.; Oliveira, O.N., Jr. Recent advances in electronic tongues. Analyst 2010, 135, 2481–2495. [Google Scholar] [CrossRef] [PubMed]
  21. Riul, A.; dos Santos, D.S.; Wohnrath, K.; Di Tommazo, R.; Carvalho, A.C.P.L.F.; Fonseca, F.J.; Oliveira, O.N.; Taylor, D.M.; Mattoso, L.H.C. Artificial Taste Sensor: Efficient Combination of Sensors Made from Langmuir-Blodgett Films of Conducting Polymers and a Ruthenium Complex and Self-Assembled Films of an Azobenzene-Containing Polymer. Langmuir 2002, 18, 239–245. [Google Scholar] [CrossRef]
  22. Bonanni, A.; del Valle, M. Use of nanomaterials for impedimetric DNA sensors: A review. Anal. Chim. Acta 2010, 678, 7–17. [Google Scholar] [CrossRef] [PubMed]
  23. Lu, L.; Hu, X.; Zhu, Z. Biomimetic sensors and biosensors for qualitative and quantitative analyses of five basic tastes. TrAC Trends Anal. Chem. 2017, 87, 58–70. [Google Scholar] [CrossRef]
  24. Toko, K.; Matsuno, T.; Yamafuji, K.; Hayashi, K.; Ikezaki, H.; Sato, K.; Toukubo, R.; Kawarai, S. Multichannel taste sensor using electric potential changes in lipid membranes. Biosens. Bioelectron. 1994, 9, 359–364. [Google Scholar] [CrossRef]
  25. Han, J.; Wang, B.; Bender, M.; Seehafer, K.; Bunz, U.H.F. Poly(p-phenyleneethynylene)-based tongues discriminate fruit juices. Analyst 2017, 142, 537–543. [Google Scholar] [CrossRef]
  26. Riul, A.; de Sousa, H.C.; Malmegrim, R.R.; dos Santos, D.S.; Carvalho, A.C.; Fonseca, F.J.; Oliveira, O.N.; Mattoso, L.H. Wine classification by taste sensors made from ultra-thin films and using neural networks. Sens. Actuators B Chem. 2004, 98, 77–82. [Google Scholar] [CrossRef]
  27. Ferreira, L.; Pinheiro, P.; Neto, N.B.; Reis, M. Buckypaper-Based Nanostructured Sensor for Port Wine Analysis. Sensors 2022, 22, 9732. [Google Scholar] [CrossRef] [PubMed]
  28. Mercante, L.A.; Scagion, V.P.; Pavinatto, A.; Sanfelice, R.C.; Mattoso, L.H.C.; Correa, D.S. Electronic Tongue Based on Nanostructured Hybrid Films of Gold Nanoparticles and Phthalocyanines for Milk Analysis. J. Nanomater. 2015, 2015, 890637. [Google Scholar] [CrossRef]
  29. Coatrini-Soares, A.; Coatrini-Soares, J.; Popolin Neto, M.; de Mello, S.S.; Pinto, D.D.S.C.; Carvalho, W.A.; Gilmore, M.S.; Piazzetta, M.H.O.; Gobbi, A.L.; de Mello Brandão, H.; et al. Microfluidic E-tongue to diagnose bovine mastitis with milk samples using Machine learning with Decision Tree models. Chem. Eng. J. 2023, 451, 138523. [Google Scholar] [CrossRef]
  30. Ferreira, E.J.; Pereira, R.C.T.; Delbem, A.C.B.; Oliveira Junior, O.N.d.; Mattoso, L.H.C. Random subspace method for analysing coffee with electronic tongue. Electron. Lett. 2007, 43, 1138–1140. [Google Scholar] [CrossRef]
  31. de Morais, T.C.B.; Rodrigues, D.R.; de Carvalho Polari Souto, U.T.; Lemos, S.G. A simple voltammetric electronic tongue for the analysis of coffee adulterations. Food Chem. 2019, 273, 31–38. [Google Scholar] [CrossRef] [PubMed]
  32. Polshin, E.; Rudnitskaya, A.; Kirsanov, D.; Legin, A.; Saison, D.; Delvaux, F.; Delvaux, F.R.; Nicolaï, B.M.; Lammertyn, J. Electronic tongue as a screening tool for rapid analysis of beer. Talanta 2010, 81, 88–94. [Google Scholar] [CrossRef] [PubMed]
  33. Men, H.; Shi, Y.; Fu, S.; Jiao, Y.; Qiao, Y.; Liu, J. Mining Feature of Data Fusion in the Classification of Beer Flavor Information Using E-Tongue and E-Nose. Sensors 2017, 17, 1656. [Google Scholar] [CrossRef] [PubMed]
  34. Wei, Z.; Zhang, W.; Wang, Y.; Wang, J. Monitoring the fermentation, post-ripeness and storage processes of set yogurt using voltammetric electronic tongue. J. Food Eng. 2017, 203, 41–52. [Google Scholar] [CrossRef]
  35. Magro, C.; Moura, T.; Ribeiro, P.A.; Raposo, M.; Sério, S. Smart Sensing for Antibiotic Monitoring in Mineral and Surface Water: Development of an Electronic Tongue Device. Chem. Proc. 2021, 5, 58. [Google Scholar] [CrossRef]
  36. El Alami El Hassani, N.; Tahri, K.; Llobet, E.; Bouchikhi, B.; Errachid, A.; Zine, N.; El Bari, N. Emerging approach for analytical characterization and geographical classification of Moroccan and French honeys by means of a voltammetric electronic tongue. Food Chem. 2018, 243, 36–42. [Google Scholar] [CrossRef] [PubMed]
  37. Semenov, V.; Volkov, S.; Khaydukova, M.; Fedorov, A.; Lisitsyna, I.; Kirsanov, D.; Legin, A. Determination of three quality parameters in vegetable oils using potentiometric e-tongue. J. Food Compos. Anal. 2019, 75, 75–80. [Google Scholar] [CrossRef]
  38. Wójcik, S.; Ciepiela, F.; Jakubowska, M. Computer vision analysis of sample colors versus quadruple-disk iridium-platinum voltammetric e-tongue for recognition of natural honey adulteration. Measurement 2023, 209, 112514. [Google Scholar] [CrossRef]
  39. Herrera-Chacón, A.; Torabi, F.; Faridbod, F.; Ghasemi, J.B.; González-Calabuig, A.; Del Valle, M. Voltammetric Electronic Tongue for the Simultaneous Determination of Three Benzodiazepines. Sensors 2019, 19, 5002. [Google Scholar] [CrossRef] [PubMed]
  40. Aramini, A.; Bianchini, G.; Lillini, S.; Bordignon, S.; Tomassetti, M.; Novelli, R.; Mattioli, S.; Lvova, L.; Paolesse, R.; Chierotti, M.R.; et al. Unexpected Salt/Cocrystal Polymorphism of the Ketoprofen–Lysine System: Discovery of a New Ketoprofen–l-Lysine Salt Polymorph with Different Physicochemical and Pharmacokinetic Properties. Pharmaceuticals 2021, 14, 555. [Google Scholar] [CrossRef] [PubMed]
  41. Falk, M.; Psotta, C.; Cirovic, S.; Ohlsson, L.; Shleev, S. Electronic Tongue for Direct Assessment of SARS-CoV-2-Free and Infected Human Saliva—A Feasibility Study. Biosensors 2023, 13, 717. [Google Scholar] [CrossRef]
  42. Cruz, M.G.; Ferreira, N.S.; Gomes, M.T.S.; Botelho, M.J.; Costa, S.T.; Vale, C.; Rudnitskaya, A. Determination of paralytic shellfish toxins using potentiometric electronic tongue. Sens. Actuators B Chem. 2018, 263, 550–556. [Google Scholar] [CrossRef]
  43. Cetó, X.; del Valle, M. Electronic tongue applications for wastewater and soil analysis. iScience 2022, 25, 104304. [Google Scholar] [CrossRef]
  44. Singh, M.; del Valle, M. 25–Arsenic biosensors: Challenges and opportunities for high-throughput detection. In Handbook of Arsenic Toxicology (Second Edition), 2nd ed.; Flora, S.J.S., Ed.; Academic Press: Oxford, UK, 2023; pp. 649–665. [Google Scholar] [CrossRef]
  45. Legin, E.; Zadorozhnaya, O.; Khaydukova, M.; Kirsanov, D.; Rybakin, V.; Zagrebin, A.; Ignatyeva, N.; Ashina, J.; Sarkar, S.; Mukherjee, S.; et al. Rapid Evaluation of Integral Quality and Safety of Surface and Waste Waters by a Multisensor System (Electronic Tongue). Sensors 2019, 19, 2019. [Google Scholar] [CrossRef]
  46. Iurgenson, N.; Wang, X.; Kong, L.; Sun, X.; Legin, A.; Wang, P.; Wan, H.; Kirsanov, D. Feasibility study of multisensor systems for the assessment of water pollution index induced by heavy metal contamination. Microchem. J. 2024, 197, 109762. [Google Scholar] [CrossRef]
  47. Lvova, L.; Jahatspanian, I.; Mattoso, L.H.; Correa, D.S.; Oleneva, E.; Legin, A.; Di Natale, C.; Paolesse, R. Potentiometric E-Tongue System for Geosmin/Isoborneol Presence Monitoring in Drinkable Water. Sensors 2020, 20, 821. [Google Scholar] [CrossRef] [PubMed]
  48. Decher, G.; Hong, J.; Schmitt, J. Buildup of ultrathin multilayer films by a self-assembly process: III. Consecutively alternating adsorption of anionic and cationic polyelectrolytes on charged surfaces. Thin Solid Films 1992, 210-211, 831–835. [Google Scholar] [CrossRef]
  49. Decher, G. Layer-by-Layer Assembly (Putting Molecules to Work). In Multilayer Thin Films; Wiley: Weinheim, Germany, 2012. [Google Scholar] [CrossRef]
  50. Richardson, J.J.; Cui, J.; Björnmalm, M.; Braunger, J.A.; Ejima, H.; Caruso, F. Innovation in Layer-by-Layer Assembly. Chem. Rev. 2016, 116, 14828–14867. [Google Scholar] [CrossRef] [PubMed]
  51. Richardson, J.J.; Bjonmalm, M.; Caruso, F. Technology-driven layer-by-layer assembly of nanofilms. Science 2015, 348, aaa2491. [Google Scholar] [CrossRef] [PubMed]
  52. PodraZka, M.; BAczyNska, E.; Kundys, M.; JeleN, P.S.; Witkowska Nery, E. Electronic Tongue—A Tool for All Tastes? Biosensors 2018, 8, 3. [Google Scholar] [CrossRef] [PubMed]
  53. Qian, L.; Durairaj, S.; Prins, S.; Chen, A. Nanomaterial-based electrochemical sensors and biosensors for the detection of pharmaceutical compounds. Biosens. Bioelectron. 2021, 175, 112836. [Google Scholar] [CrossRef] [PubMed]
  54. Jiang, H.; Zhang, M.; Bhandari, B.; Adhikari, B. Application of electronic tongue for fresh foods quality evaluation: A review. Food Rev. Int. 2018, 34, 746–769. [Google Scholar] [CrossRef]
  55. Mercante, L.A.; Andre, R.S.; Facure, M.H.M.; Fugikawa-Santos, L.; Correa, D.S. Design of a bioelectronic tongue for glucose monitoring using zinc oxide nanofibers and graphene derivatives. Sens. Actuators Rep. 2021, 3, 100050. [Google Scholar] [CrossRef]
  56. Magro, C.; Sardinha, M.; Ribeiro, P.A.; Raposo, M.; Sério, S. Magnetron Sputtering Thin Films as Tool to Detect Triclosan in Infant Formula Powder: Electronic Tongue Approach. Coatings 2021, 11, 336. [Google Scholar] [CrossRef]
  57. Fukushima, K.L.; Scagion, V.P.; Facure, M.H.M.; Pinheiro, A.C.M.; Correa, D.S.; Nunes, C.A.; Oliveira, J.E. Development of an Electronic Tongue Based on a Nanocomposite for Discriminating Flavor Enhancers and Commercial Salts. IEEE Sens. J. 2021, 21, 1250–1256. [Google Scholar] [CrossRef]
  58. Hensel, R.C.; Braunger, M.L.; Oliveira, B.; Shimizu, F.M.; Oliveira, O.N.; Hillenkamp, M.; Riul, A.; Rodrigues, V. Controlled Incorporation of Silver Nanoparticles into Layer-by-Layer Polymer Films for Reusable Electronic Tongues. ACS Appl. Nano Mater. 2021, 4, 14231–14240. [Google Scholar] [CrossRef]
  59. Wang, K.; Zhuang, H.; Bing, F.; Chen, D.; Feng, T.; Xu, Z. Evaluation of eight kinds of flavor enhancer of umami taste by an electronic tongue. Food Sci. Nutr. 2021, 9, 2095–2104. [Google Scholar] [CrossRef] [PubMed]
  60. Yang, Y.; Chen, Q.; Shen, C.; Zhang, S.; Gan, Z.; Hu, R.; Zhao, J.; Ni, Y. Evaluation of monosodium glutamate, disodium inosinate and guanylate umami taste by an electronic tongue. J. Food Eng. 2013, 116, 627–632. [Google Scholar] [CrossRef]
  61. Zhu, Y.; Zhou, X.; Chen, Y.P.; Liu, Z.; Jiang, S.; Chen, G.; Liu, Y. Exploring the relationships between perceived umami intensity, umami components and electronic tongue responses in food matrices. Food Chem. 2022, 368, 130849. [Google Scholar] [CrossRef] [PubMed]
  62. Ahn, S.R.; An, J.H.; Song, H.S.; Park, J.W.; Lee, S.H.; Kim, J.H.; Jang, J.; Park, T.H. Duplex Bioelectronic Tongue for Sensing Umami and Sweet Tastes Based on Human Taste Receptor Nanovesicles. ACS Nano 2016, 10, 7287–7296. [Google Scholar] [CrossRef] [PubMed]
  63. Lee, M.; Jung, J.W.; Kim, D.; Ahn, Y.J.; Hong, S.; Kwon, H.W. Discrimination of Umami Tastants Using Floating Electrode-Based Bioelectronic Tongue Mimicking Insect Taste Systems. ACS Nano 2015, 9, 11728–11736. [Google Scholar] [CrossRef] [PubMed]
  64. Lee, P.C.; Meisel, D. Adsorption and surface-enhanced Raman of dyes on silver and gold sols. J. Phys. Chem. 1982, 86, 3391–3395. [Google Scholar] [CrossRef]
  65. Decher, G. Fuzzy nanoassemblies: Toward layered polymeric multicomposites. Science 1997, 277, 1232–1237. [Google Scholar] [CrossRef]
  66. Elizarova, I.S.; Luckham, P.F. Layer-by-layer adsorption: Factors affecting the choice of substrates and polymers. Adv. Colloid Interface Sci. 2018, 262, 1–20. [Google Scholar] [CrossRef]
  67. Buron, C.C.; Filiâtre, C. Overshoots of adsorption kinetics during layer-by-layer polyelectrolyte film growth: Role of counterions. J. Colloid Interface Sci. 2014, 413, 147–153. [Google Scholar] [CrossRef]
  68. Kern, W. Cleaning solutions based on hydrogen peroxide for use in silicon semiconductor technology. RCA Rev. 1970, 31, 187–206. [Google Scholar]
  69. Braunger, M.L.; Fier, I.; Shimizu, F.M.; de Barros, A.; Rodrigues, V.; Riul, A. Influence of the Flow Rate in an Automated Microfluidic Electronic Tongue Tested for Sucralose Differentiation. Sensors 2020, 20, 6194. [Google Scholar] [CrossRef] [PubMed]
  70. Schiffman, S.S.; Crumbliss, A.L.; Warwick, Z.S.; Graham, B.G. Thresholds for sodium salts in young and elderly human subjects: Correlation with molar conductivity of anion. Chem. Senses 1990, 15, 671–678. [Google Scholar] [CrossRef]
  71. Wu, J. Cluster Analysis and K-means Clustering: An Introduction. In Advances in K-Means Clustering: A Data Mining Thinking; Springer: Berlin/Heidelberg, Germany, 2012; pp. 1–16. [Google Scholar] [CrossRef]
  72. Kaufman, L.; Rousseeuw, P.J. Finding Groups in Data: An Introduction to Cluster Analysis; Wiley Series in Probability and Statistics; Wiley: Hoboken, NJ, USA, 1990. [Google Scholar]
  73. Demšar, J.; Curk, T.; Erjavec, A.; Gorup Hočevar, T.; Milutinovič, M.; Možina, M.; Polajnar, M.; Toplak, M.; Starič, A.; Štajdohar, M.; et al. Orange: Data Mining Toolbox in Python. J. Mach. Learn. Res. 2013, 14, 2349–2353. Available online: http://jmlr.org/papers/v14/demsar13a.html (accessed on 14 April 2024).
  74. University of Ljubljana. Orange, version 3.36.2; University of Ljubljana: Ljubljana, Serbia, 2022. Available online: https://orangedatamining.com(accessed on 14 April 2024).
  75. Garcia, M.A. Surface plasmons in metallic nanoparticles: Fundamentals and applications. J. Phys. D Appl. Phys. 2011, 44, 283001. [Google Scholar] [CrossRef]
  76. Hensel, R.C.; Moreira, M.; Riul, A.; Oliveira, O.N.; Rodrigues, V.; Hillenkamp, M. Monitoring the dispersion and agglomeration of silver nanoparticles in polymer thin films using localized surface plasmons and Ferrell plasmons. Appl. Phys. Lett. 2020, 116, 103105. [Google Scholar] [CrossRef]
  77. De Barros, A. CAPÍTULO 8—Filmes Automontados por Adsorção Física; Universidade Estadual de Campinas: Campinas, SP, Brazil, 2020. [Google Scholar]
  78. Introduction. In Spectrochemical Analysis by Atomic Absorption and Emission (2); Lajunen, L.H.J.; Perämäki, P. (Eds.) The Royal Society of Chemistry: London, UK, 2004; pp. 1–15. [Google Scholar] [CrossRef]
Figure 1. Synthesized AgNPs: (a) UV-Vis absorption spectrum, (b) transmission electron microscopy image, and (c) size distribution obtained from TEM analysis.
Chemosensors 12 00087 g001
Figure 2. (a) UV-Vis absorption spectrum of AgNPs after the absorption of each layer on quartz slides. The two arrows indicate the growth of peaks at 420 and 486 nm. (b) NP absorbance at a wavelength of 420 nm, as a function of the total adsorption time for each bilayer. (c) Absorbance for a deposition using a 15 min immersion time in the AgNPs solution.
Chemosensors 12 00087 g002
Figure 3. PCA score plots for different umami samples across the entire frequency range; (a) PC1 vs. PC2; (b) PC2 vs. PC3. Each point corresponds to a sample, and distinct background colors indicate a cluster according to k-means analysis.
Chemosensors 12 00087 g003
Disclaimer/Publisher’s Note: The statements, opinions and data contained in all publications are solely those of the individual author(s) and contributor(s) and not of MDPI and/or the editor(s). MDPI and/or the editor(s) disclaim responsibility for any injury to people or property resulting from any ideas, methods, instructions or products referred to in the content.

