Article

Synergistic Enhancement Effect of Ag/rGO as SERS Platform for Capture and Trace Detection of Fenvalerate Molecules

1
National Key Laboratory for Germplasm Innovation and Utilization for Fruit and Vegetable Horticultural Crops, College of Horticulture & Forestry Sciences, Huazhong Agricultural University, Wuhan 430070, China
2
School of Electrical and Information Engineering, Tianjin University, Tianjin 300072, China
3
College of Optical and Electronic Technology, China Jiliang University, Hangzhou 310018, China
*
Authors to whom correspondence should be addressed.
These authors contributed equally to this work.
Chemosensors 2024, 12(5), 82; https://doi.org/10.3390/chemosensors12050082
Submission received: 16 April 2024 / Revised: 6 May 2024 / Accepted: 14 May 2024 / Published: 16 May 2024
(This article belongs to the Special Issue Recent Advances in Optical Chemo- and Biosensors)

Abstract

:
Surface-enhanced Raman scattering (SERS) provides an alternative rapid detection method for pesticide residues in food, but fenvalerate possesses poor affinity to the novel metal substrate, thus restricting its analysis. To break this bottleneck, a SERS-active platform with an Ag/rGO composite structure was engineered using a facile method for fenvalerate detection. Ag nanoparticles with a 60 nm diameter can grow evenly on the top and bottom of rGO layers under intense ultrasonic oscillation, and rGO in hybrid material acts as an ideal hotspot holder between the gaps of Ag nanoparticles, not only allowing the interaction area to be enhanced both electromagnetically and chemically but also enabling the capture and enrichment of fenvalerate pesticide molecules into the “hotspot” area to improve detection sensitivity. Ag/rGO composite substrate possesses superior SERS performance with an ultralow detectable concentration of 4-aminothiophenol (10−10 M) and good reproducibility, endowing the material with a better enhancement effect than pure Ag nanoparticles. When used as the SERS substrate for fenvalerate detection, Ag/rGO composite material showed excellent performance in both experiments and theoretical calculation, with the limit of detection (LOD) of fenvalerate being as low as 1.69 × 10⁻⁵ mg/kg and a detection model with an R2 of 99.2%, demonstrating its exciting potential as a SERS substrate for pesticides detection.

1. Introduction

Fenvalerate, a broad-spectrum insecticide and one typical representative of pyrethroid pesticides, is widely used in cotton, fruits, vegetables, tea, etc. [1], which not only triggers a serious threat to public health through the accumulation in the food chain but also influences the import and export trade of products. Therefore, fenvalerate tolerances in food have been set up in many countries and regions. For example, both the European Union and China have stipulated that the maximum concentration of fenvalerate in food cannot exceed 0.1 mg/kg, suggesting it is essential to develop an ultrasensitive, reliable, and selective sensor for fenvalerate detection. Like most typical pesticides, fenvalerate pesticide is generally detected using large-scale analytical instruments, such as gas chromatography (GC) or gas chromatography mass spectrometry (GC-MS). For example, Takaomi et al. employed GC-MS to detect fenvalerate residues in kampo products and performed the analysis of 22 samples [2]. However, these conventional methods suffer the shortcomings of high cost, professional operation, and time consumption, making them unable to be used for the on-site and rapid monitoring of pesticides. Therefore, many new detection strategies have been developed as portable tools for the detection of pesticides, including electrochemical sensors, immunosensors, fluorescence methods, and the surface-enhanced Raman scattering (SERS) method [3]. Wang et al. proposed a label-free impedimetric immunosensor for the sensitive detection of fenvalerate in tea and obtained a detection limit as low as 0.8 μg/L [4]. Diène et al. achieved the determination of fenvalerate in natural waters by using a photochemically induced fluorescence method [5]. Among them, SERS has attracted wide attention in the detection field due to its advantages, such as superior sensitivity, fingerprint recognition, and fast analysis. However, to our knowledge, the SERS detection of fenvalerate is generally achieved by integrating it with the molecular imprinting method [6], which is complex and tedious. Thus, it is necessary to study the SERS detection method for fenvalerate.
The SERS phenomenon is known to be mainly attributed to electromagnetic mechanism (EM) and chemical mechanism (CM) [7]. EM originates from the local surface plasmons excited by the rough surface of metal nanoparticles, and the enhancement factor can reach 1013 or even higher [8], where the fascinating EM effect can be obtained from the anisotropic morphologies of noble metal nanoparticles or nano-scaled interparticle area [9], with high electromagnetic field (known as hotspots) usually concentrated at interstitial areas, sharp tips, edges, and corners [10]. Consequently, multiple studies have been performed on the design and synthesis of active SERS substrates with high roughness or anisotropy, such as silver nanoflowers, gold nanostars, dendritic structures, or nanocubes [10]. CM, despite having a weaker enhancement effect than EM, also deserves attention and research, particularly for some composite systems [11]. The charge transfer between substrate and molecule can change the electron cloud density and polarizability of the system to improve the intensity of the Raman signal [12,13]. Therefore, maximizing the EM effect and CM effect between molecule and substrate is undoubtedly conducive to obtaining the best SERS performance. However, for nonadsorbing compounds such as fenvalerate, effective EM and CM enhancement cannot be easily achieved due to poor affinity between pesticide molecules and novel metal surface, thus posing a challenge to realizing the SERS detection of molecules by capturing them in a hotspot area and improving electron transfer efficiency at the same time. Thus far, many researchers have attempted to improve SERS performance by enriching molecules and narrowing the distance between instrumenting objects and noble metals [14]. In order to create SERS sensors, some researchers used affinity agents to modify novel substrates and enrich molecules, such as antibodies, aptamers, small molecules, and polymers [15,16]. However, these methods need the addition of some exogenous organic substances, thus increasing the complexity of the operation and the difficulty of identifying spectral peaks due to peak overlap.
In fact, engineering a kind of enhanced substrate with a molecular enrichment effect as a SERS platform is the most convenient method, which can involve integrating novel metal with graphene oxide (GO) or reduced graphene oxide (rGO). GO or rGO, as atomic monolayer materials with abundant oxygen-containing functional groups, have shown their unique advantage as choices for SERS substrate because of their superior physical and chemical structure [17], i.e., their large surface area and interconnected sp2 network allow the capture and concentration of target molecules by π–π stacking [18]. Furthermore, efficient charge transfer between graphene and probe molecules can be obtained through the unique electron and photon structures of graphene. Given these superior capabilities of GO or rGO, SERS platforms containing GO-based metal materials have been increasingly explored in the past few years. For example, He et al. proposed a nanoporous SERS substrate for ultrasensitive lead detection by combining the hybrid graphene monolayer with a noble metal nanostructure [19]. Zhang et al. successfully monitored polychlorinated biphenyls using a SERS method based on a GO-highly anisotropic noble metal hybrid system and obtained a minimum detectable concentration as low as 3.4 × 10⁶ M [20]. Glenda et al. decorated rGO with silver nanoparticles as a 3D SERS substrate for biosensing and detected a representative biomarker involved in numerous neoplastic diseases [21]. Despite extensive reports on SERS detection using GO-based metal hybrid materials as substrate, these reported methods always suffer from a series of complicated experimental conditions, rough graphene addition, or unsatisfied design, suggesting the necessity to develop a simple and efficient way to fabricate graphene-based hybrid substrate with the uniform distribution of nanoparticles and capture molecules in the cross regions of multiple enhancement mechanisms, thus facilitating SERS detection of fenvalerate.
In this work, we engineered a SERS-active platform with an Ag/rGO composite structure by using a facile method without any complicated steps or instruments, where rGO is used as a molecular capturer and an ideal hotspot holder between the gaps of Ag nanoparticles. As shown in Figure 1, silver ions and ascorbic acid could pass freely through the rGO layers under the action of intense ultrasonic oscillation, resulting in the growth of silver nanoparticles on the top and bottom of the rGO layers. In order to improve the SERS performance of Ag/rGO, many influencing factors were explored, including the concentration of silver nitrate, the number of graphene layers, and the stacking type of nanoparticles. The structure and morphology of the hybrid substrate were characterized by SEM, TEM, EDS, and XPS. Probe molecular test indicated that the optimized composite substrate has high sensitivity and outstanding reproducibility in generating SERS signals. Meanwhile, the composite material in this paper exhibited a better SERS enhancement effect than pure silver nanoparticles based on experimental results and finite-difference time-domain (FDTD) simulation. More importantly, this SERS strategy could avoid weak affinity between fenvalerate molecule and metal substrate without any modification and realize multiple enhancements, achieving the limit of detection (LOD) of 1.69 × 10⁻⁵ mg/kg in fenvalerate detection, which suggests its great potential for real-time and rapid field detection of fenvalerate in the future.

2. Materials and Methods

2.1. Materials and Reagents

Silver nitrate (AgNO3, ≥99.9% purity), ascorbic acid (ASA, ≥99.0% purity), polyvinylpyrrolidone (PVP, K30, >95% purity), and 4-aminobenzenethiol (4-ABT, ≥98% purity) were purchased from Aladdin Reagent Co., Ltd. (Shanghai, China); graphite powder and potassium permanganate (KMnO4, ≥99.5%) from Sinopharm Chemical Reagent Co., Ltd. (Shanghai, China); concentrated sulfuric acid (H2SO4) and hydrogen peroxide solution (H2O2, 30%) from Huadong Pharmaceutical Co., Ltd. (Hangzhou, China); and hydrochloric acid (HCl, 1.18 g/mL) and absolute ethanol from Zhejiang Sanying Chemical Reagent Co., Ltd. (Lanxi, China). Ultrapure water (18.3 MΩ) obtained by UPH ULTRAPURE WATER SYSTEM (Chengdu ultra pure Technology Co., Ltd., Chengdu, China) was used to prepare all the aqueous solutions. All chemicals were of analytical grade and used without further purification.

2.2. Instruments

Material structural characterization was performed using field-emission scanning electron microscopy (HITACHI, SU8010, FE-SEM, Tokyo, Japan), field emission high-resolution transmission electron microscopy (Thermo Fisher, Talos F200S, TEM, Waltham, MA, USA), X-ray photoelectron spectroscopy (Thermo Fisher Scientific, XPS, Waltham, MA, USA), and UV-vis spectroscopy (TU-1901, Purkinje, Beijing, China). SERS spectra were collected using the Raman system (Horiba, LabRAM HR, Shanghai, China) at an excitation wavelength of 532, 633, and 785 nm. Ultrasonic vibration was performed using an ultrasonic oscillator (GEX750-5D, Saines Instruments Co., Ltd., Suzhou, China), while ordinary dissolution was performed using the ultrasonic cleaning instrument (PS-20, Jiekang company, Guangzhou, China). Stirring was implemented using a constant temperature magnetic stirrer (08-2G, Mei Yingbu, China). The centrifugal operation was completed using a table-top high-speed centrifuge (TG16-WS, Xiangyi, China). All the drying processes were conducted in the vacuum drying oven (DZF-6050, Shanghai Jinghong Experimental Equipment Co., Ltd., Shanghai, China).

2.3. Fabrication of Ag/rGO Hybrid Material

Graphene oxide (GO) was prepared using the improved classical Hummers method [22]. Briefly, 0.8 g of graphite powder was weighed into a beaker, followed by slowly adding 50 mL of concentrated sulfuric acid into the beaker under slow stirring with a glass rod and then 4 g of potassium permanganate with further stirring for 2 min. Next, the beaker was put in a magnetic stirrer for stirring at 1500 rpm for 4 h, followed by adding 4 mL of hydrogen peroxide solution and 100 mL of deionized water and then exposing the solution in the beaker to ultrasonic oscillation for 30 min. After separating it from the solution by centrifugation at 8000 rpm for 10 min, the reaction product was washed in 10 mL of deionized water and diluted hydrochloric acid (3%) in an ultrasonicator for 10 min to remove the impurities until solution pH 7. Finally, graphene oxide was dispersed in 20 mL of deionized water for further use.
The preparation of the Ag/rGO composite substrate was performed as follows: 1 mL of GO solution and 2 mL of ascorbic acid solution (0.5 M) were mixed thoroughly with 47 mL of deionized water in a triangular flask, followed by vibrating the mixed solution strongly by an ultrasonic oscillator with 70% amplitude at 60 °C for 30 min and adding an amount of AgNO3 solution (0.1 M) dropwise into the mixed solution under ultrasonic oscillation for 5 min. Next, the reaction product was separated from the solution by centrifugation at 12,000 rpm for 10 min and then washed in 10 mL of a mixture of equal proportions of ethanol and deionized water in an ultrasonicator for 10 min. The above two steps were repeated four times to remove the impurities. Finally, the obtained Ag/rGO material was dispersed in 10 mL of deionized water for further analysis.

2.4. SEM, TEM, EDS, XPS, and Raman Analysis

For SEM, XPS, and EDS analyses, 2 mL of Ag/rGO colloid was pipetted on a Si wafer (0.5 × 0.5 cm), allowing the solution to immerse the whole Si wafer, followed by drying the treated Si wafers in a vacuum oven at 60 °C for 6 h to avoid oxidation. Finally, the Si wafer coated with Ag/rGO was used for SEM, XPS, and EDS characterization.
For TEM analysis, Ag/rGO colloid was pipetted on a copper mesh (0.5 × 0.5 cm), followed by drying in a vacuum oven at 60 °C for 6 h and then using the copper mesh coated with Ag/rGO for TEM characterization.
For AFM analysis, 30 µL of GO solution was pipetted on a Si wafer (0.5 × 0.5 cm), followed by drying the treated Si wafers in a vacuum oven at 60 °C for 6 h to avoid oxidation. Finally, the Si wafer coated with GO was used for AFM characterization.
SERS test of 4-ABT: the Si wafers coated with Ag/rGO were immersed in an aqueous solution of 4-ABT with gradient concentration (10−10 M–10−2 M) for 1 h and then transferred into the vacuum oven at 40 °C for 8 h. Finally, the dried samples were measured using Raman spectroscopy, and the SERS spectra of 4-ABT were acquired under a 532 nm laser at 25 mW power, with 5 s exposure time and two accumulations.
SERS test of fenvalerate: the Si wafers deposited with Ag/rGO were immersed in an aqueous solution of fenvalerate with gradient concentration (2.38 × 10⁻⁹ M–2.38 × 10⁻⁵ M) for 1 h and then transferred into the vacuum oven at 40 °C for 8 h. Finally, the dried samples were measured using Raman spectroscopy, and the SERS spectra of fenvalerate were acquired under a 532 nm laser with 25 mW power, a 20 s exposure time, and one accumulation.

2.5. FDTD Simulation of Ag/rGO Material

For quantitative analysis of electromagnetic field intensity, FDTD calculation was performed using a code of FDTD Solution, which was developed by Lumerical Solutions for the accurate calculation of the electromagnetic field dispersion of a composite material by solving the Maxwell equations. The Ag/rGO was simulated as two Ag spheres, which were separated by different layers of graphene, and the mesh accuracy of the simulation field on the x, y, and z sides was 0.001 × 0.001 × 0.0001 μm. The extinction spectra of Ag/rGO in the wavelength range of 250–800 nm were calculated under the conditions of a broadband total-field scattered-field source and perfectly matched layer (PML), with the thickness of each layer of graphene set at 0.34 nm. The local electromagnetic fields in the vicinity of Ag/rGO were simulated in terms of electric field (E2) under the excitation by the incident light at the given wavelengths, with the field distribution monitor perpendicular to the light irradiation direction (monitoring the distribution of electromagnetic field between two spheres) and 1000 fs simulation time (ensuring complete decay of electromagnetic field).

2.6. Vibrational Spectrum Calculation of Fenvalerate

The vibrational spectrum calculation of fenvalerate was based on the DFT/B3LYP functional and 6-31 G(d,p) basis set via Gaussian 09, which was the same as the ground state geometric optimization [23]. The IR peak half-width at half-height was set at 4 cm−1. By using the frequency/intensity data from the B3LYP vibrational analysis as a sum of Lorentzian line shapes of 4 cm−1 half-width, the Raman spectrum was acquired, and the vibrational spectrum (frequencies) was corrected by a constant actor of 0.97 to align the Raman features with experimental results.

2.7. Theoretical Modeling

The rGO and the fenvalerate molecules were explored by using density functional theory (DFT) with the hybrid B3LYP functional based on the Gaussian 09 computational package. The 6-31 G(d,p) basis set was adopted to complete all the calculations. Geometries were reoptimized to explain the interaction of fenvalerate molecules and rGO, and an aperiodic structure with Gamma k-point was used to calculate both fenvalerate molecules and rGO [24].

2.8. Spectral Data Processing

All the raw SERS spectral baseline and noise were processed by wavelet transform algorithm through the Python program, using the Daubechies function for baseline correction and the heuristic threshold method for noise elimination, with a wavelet coefficient of db8 and a decomposition level of seven.

3. Results and Discussion

3.1. Fabrication and Characterization of Ag/rGO

GO was fabricated using the Hummers method, followed by a reduction with an ascorbic acid such as rGO. In the AFM images of GO in Figure S1, the lowest thickness of GO was shown to be 53.8 nm, indicating that the GO fabricated in this paper was multilayer. In order to achieve the uniform distribution of silver nanoparticles in the interlayer and on the surface of rGO to obtain the optimal Raman enhancement effect, ultrasonic oscillation was adopted to push Ag+ to pass through rGO layers and then promote Ag+ to be reduced in the interlayer of graphene. As shown in Figure 2A–E, with the increment of AgNO3 volume (0.1 M) from 0.1 to 2.0 mL, the diameter of silver nanoparticles gradually increased, with the morphology and distribution of the particles on the graphene becoming uniform first and then disordered (particle size distribution is shown in Figure S2). At 0.5 mL AgNO3, the silver nanoparticles in the Ag/rGO composite substrate exhibited the most uniform size and distribution.
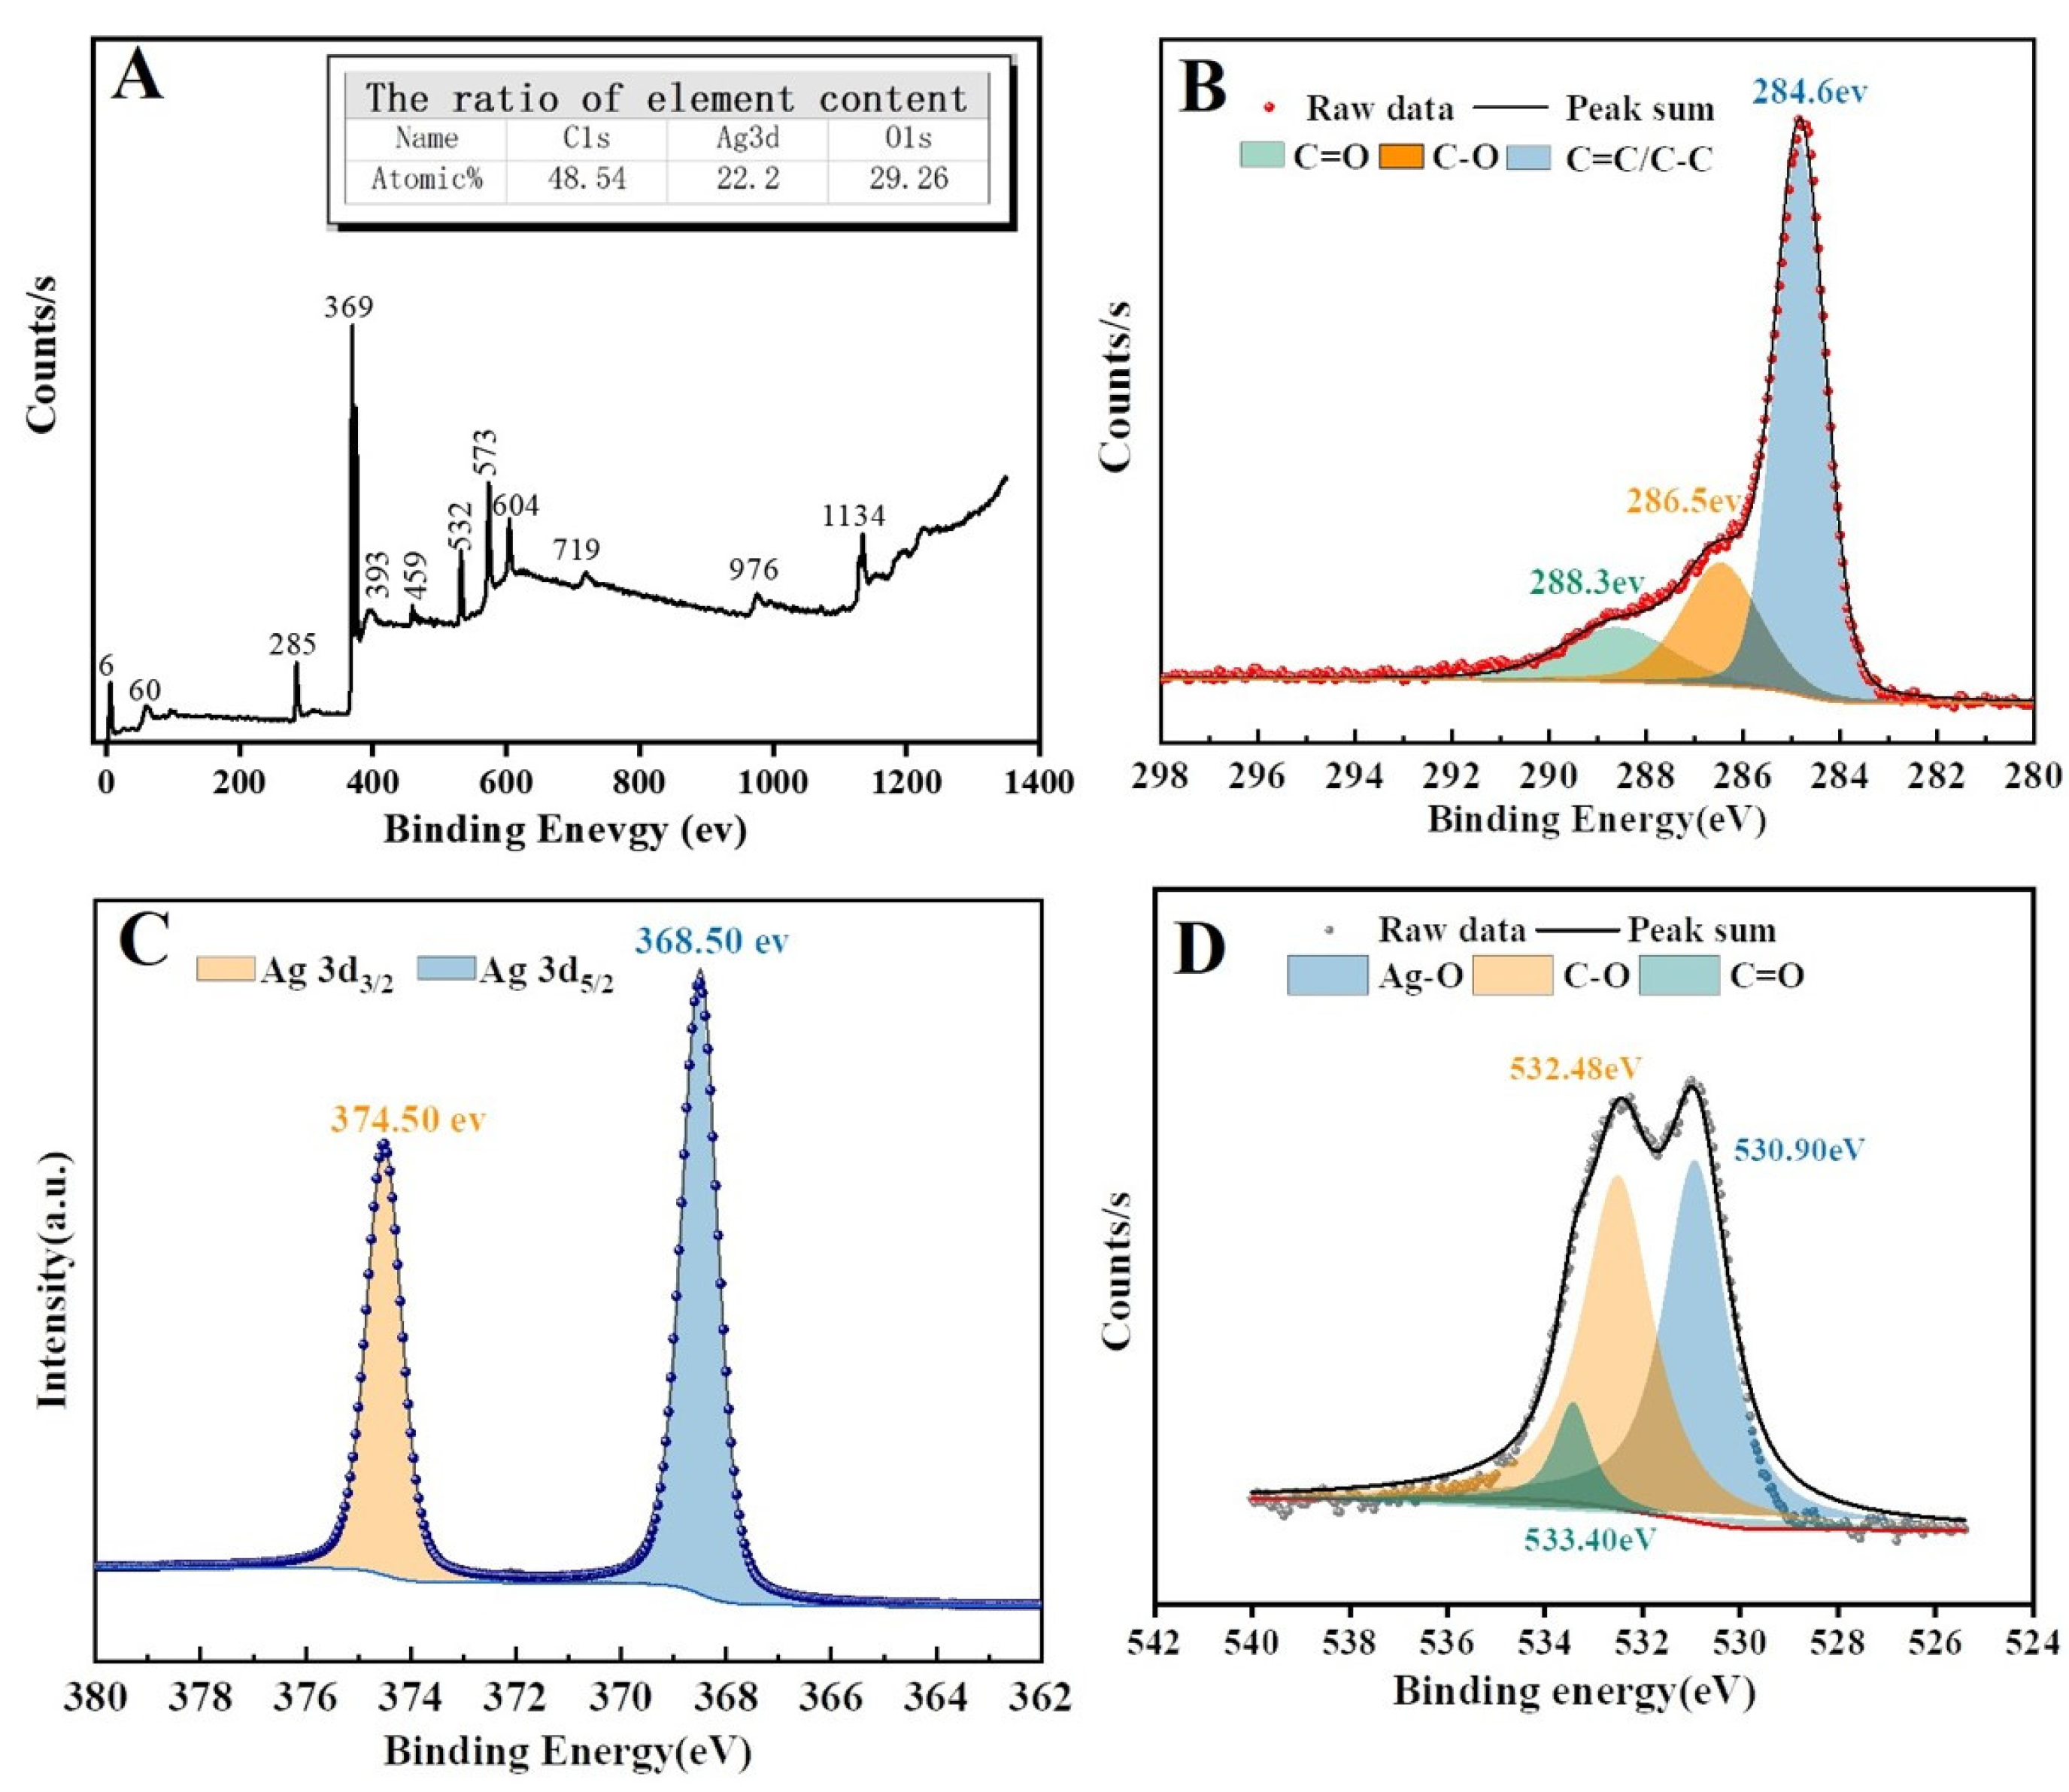
Figure 2F displays the SEM image of rGO, with the folds as its most obvious feature. The characterization of the Ag/rGO composite substrate synthesized under the optimal parameters is shown in Figure 2G–I, where silver nanoparticles with a diameter of about 60 nm were uniformly distributed on the top and bottom of the rGO layers. Some folds growing on the surface of silver nanoparticles can be attributed to rGO layers, which can also be confirmed by the abundant existence of C and O elements in the EDS mapping in Figure 2J–L. Furthermore, the gap between adjacent AgNPs is very narrow (Figure S3). In the SAED image of Figure 2M, the Ag nanoparticles in this paper can be deduced to be single crystals with long-ordered structures and anisotropy. The XPS spectra in Figure 3A also confirmed the presence of C, Ag, and O elements as described in the above element mapping. Apart from the C-O, C-C/C=C, and C=O bonds (Figure 3B,C), Ag/rGO also had an Ag-O bond, indicating some kind of bonding relationship between silver nanoparticles and rGO (Figure 3D) [25,26]. As can be seen in Figure S4, the adsorption bands of pure rGO and pure Ag were about 240 nm and 440 nm, respectively, while the adsorption bands of Ag/rGO were about 240 nm and 380 nm. The adsorption band of Ag in Ag/rGO had a blue shift, which is consistent with the previous literature [27]. These results also confirmed the successful synthesis of Ag/rGO.

3.2. SERS Performance of Ag/rGO Composite Substrate

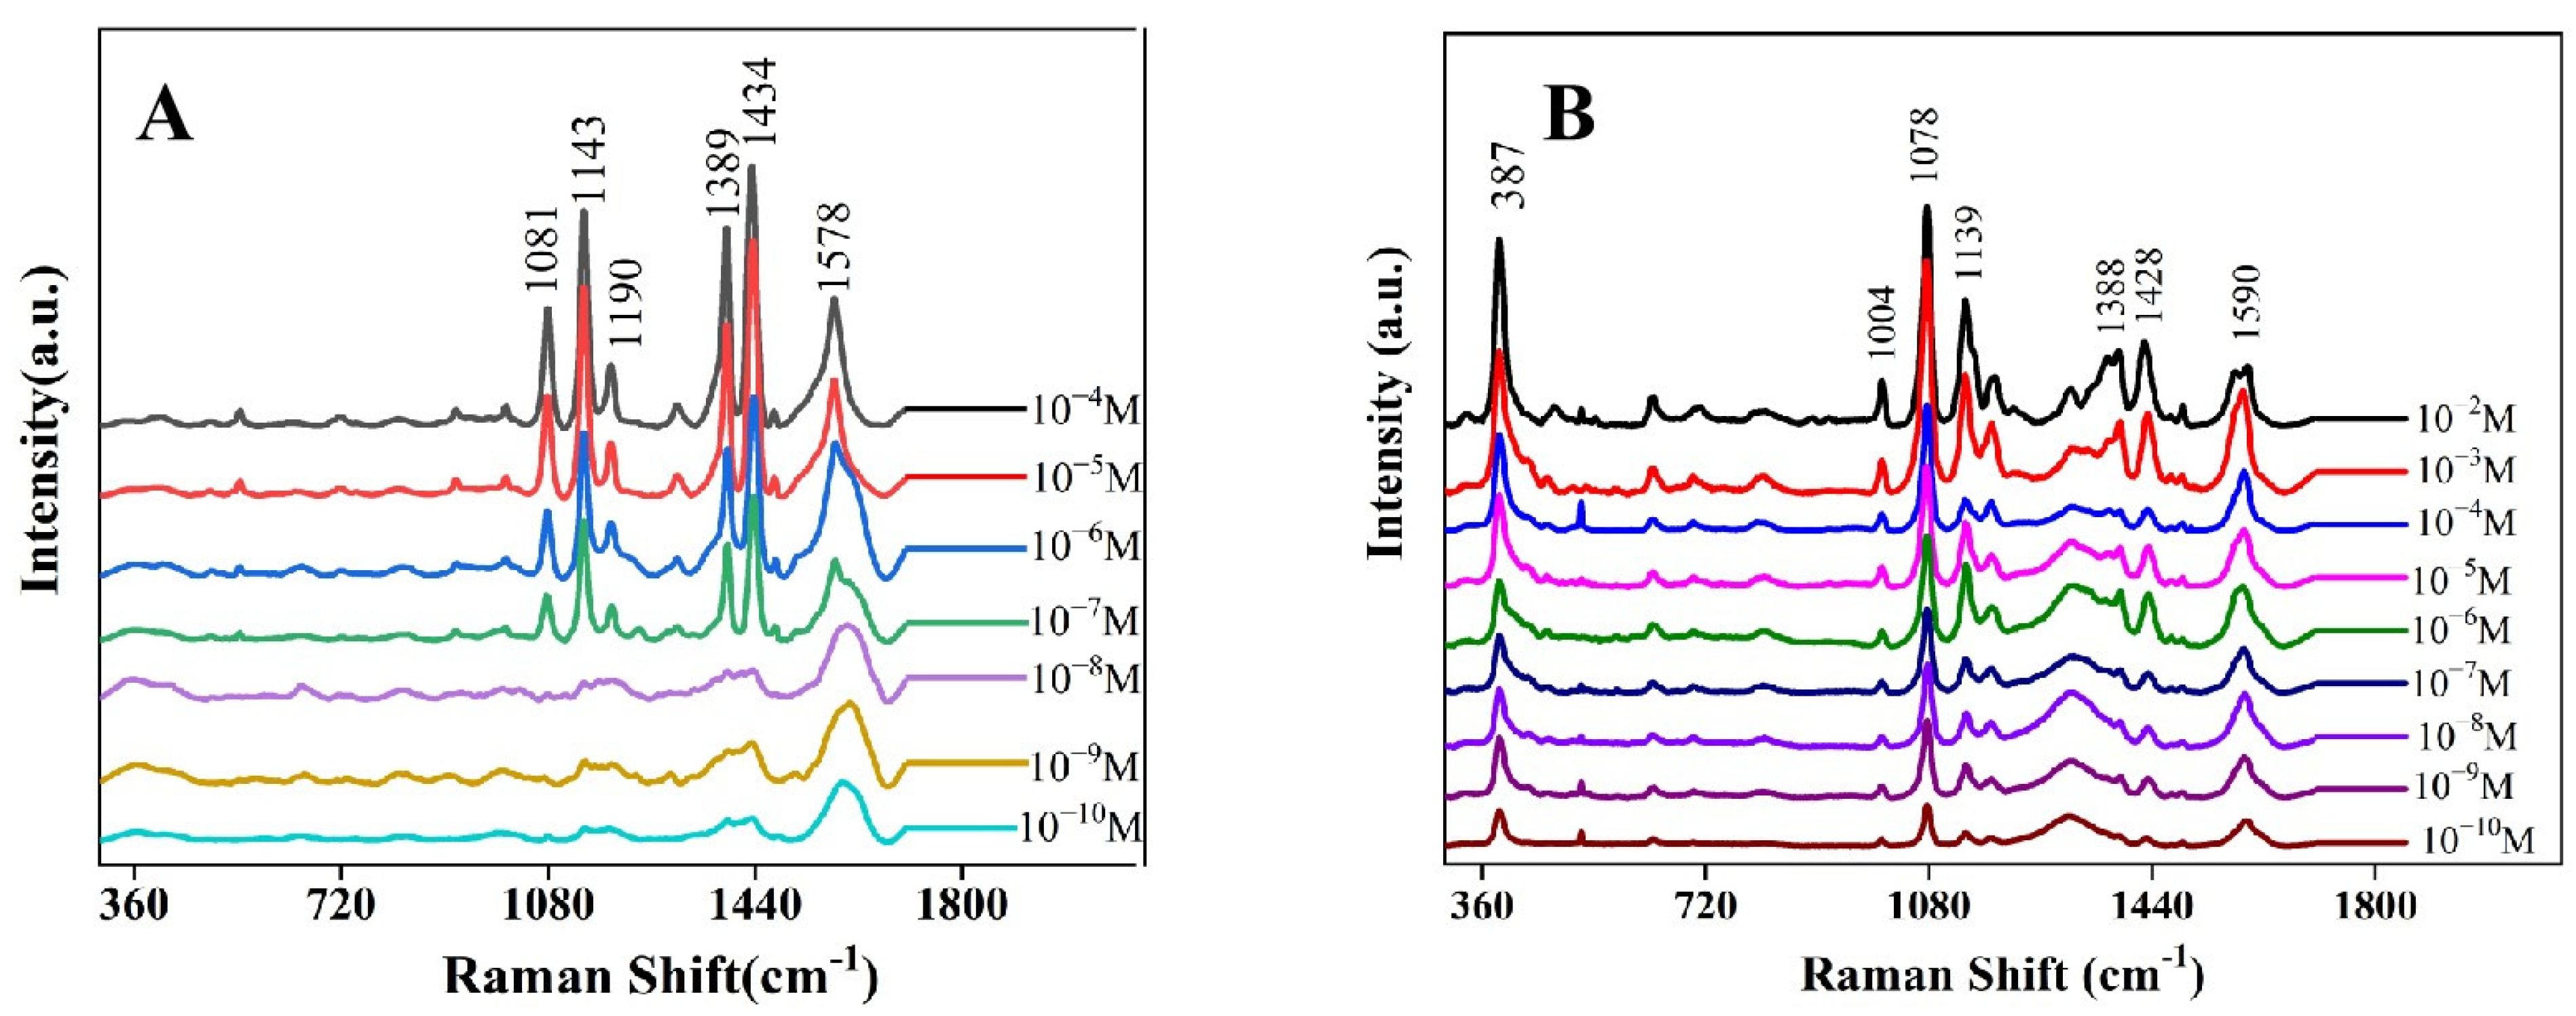
In order to investigate the enhancement ability of the Ag/rGO composite substrate, 4-aminothiophenol (4-ABT) was selected as a probe to explore its SERS performance. Figure 4B shows the SERS spectra of 4-ABT in the concentration range from 10−2 M to 10−10 M. When the concentration of 4-ABT was 10−10 M, the Raman peaks could still be identified, revealing the superior sensitivity of the Ag/rGO composite substrate. The sensitivity in this work is also better than that of similar enhanced materials (Table S1). As previously reported [28], the Raman characteristic peaks at 1078 and 1590 cm−1 are attributed to the A1 mode, while the peaks at 1139, 1388, and 1428 cm−1 are related to the B1 mode. Actually, 4-ABT can be transformed into 4,4′-dimercaptoazobenzene (DMAB) under Raman laser illumination, indicating that the B2 mode is actually derived from DMAB molecules, and the A1 mode is assigned to 4-ABT [29,30]. Concretely, the Raman peak at 1139 cm−1 is attributed to the bending of C-H vibration; the bands at 1388 and 1428 cm−1 are related to N=N vibration of DMAB; the peaks at 1078 and 1590 cm−1 are due to the stretching of C-S vibration, bending of C-H vibration, and stretching of C-S vibration, respectively. Furthermore, the new merging Raman peak at 387 cm−1 was assigned to the C-S vibration of 4-ABT [31,32]. The Raman peaks at 1078 and 1590 cm−1 can be clearly identified even at a concentration as low as 10−10 M, in contrast to only 10−7 M for the lowest concentration of 4-ABT detectable by SERS based on pure Ag substrate or pure rGO (Figure 4A and Figure S5), proving the superior enhancement ability of the Ag/rGO composite substrate. Figure S6A displays the SERS spectra of 4-ABT obtained from 20 random sites on Ag/rGO substrate. Figure S6B shows the peak intensities at 1081, 1190, and 1590 cm−1 that were selected for the relative standard deviation (RSD) calculation. These were calculated to be 9.917%, 9.406%, and 8.445%, respectively, with an average RSD of 9.256% for each peak, confirming the excellent reproducibility of the composite substrate in generating SERS signals. In Figure S6C, a total of 315 points were recorded in the SERS mapping of 10−4 M 4-aminothiophenol (1139 cm−1) on the composite substrate, and the color distribution is basically consistent, indicating good uniformity of the Ag/rGO substrate.
Furthermore, we performed the FDTD simulation to investigate the number of rGO layers-dependent electromagnetic enhancement of the Ag/rGO composite substrate (Figure 5). In Figure 5D, the electromagnetic field intensities were significantly lower in pure Ag substrate than in Ag/rGO composite substrate. When the incident light direction was the y-axis (Figure 5A), i.e., perpendicular to the plane connecting the two silver spheres’ centers, the simulation intensity of the Ag/rGO composite substrate first increased and then decreased with the number increments of graphene layers, with the largest simulation intensity for two graphene layers between the two spheres (Figure 5D). In addition, compared with pure silver substrate, Ag/rGO exhibited faster charge transfer according to charge distribution direction (Figure 5C). The difference in electromagnetic field intensity further confirmed the stronger enhancement ability of Ag/rGO. When the incident light direction was the z-axis (Figure 5B), i.e., parallel to the plane connecting the two silver spheres’ centers, the simulation intensity of the Ag/rGO composite substrate decreased continuously with the number increase of graphene layers (Figure 5D), with no difference in the charge distribution direction (Figure 5C). Additionally, compared with parallel light direction, perpendicular light direction had higher simulation intensities. More importantly, the distribution of most nanoparticles is in a non-stacked state according to the SEM images of Ag/rGO in Figure 2G,H; that is, the direction of light is perpendicular. Therefore, the non-stack of silver nanoparticles in the composite substrate is the main contributor to the excellent Raman enhancement performance of the substrate fabricated in this paper.

3.3. SERS Detection of Fenvalerate

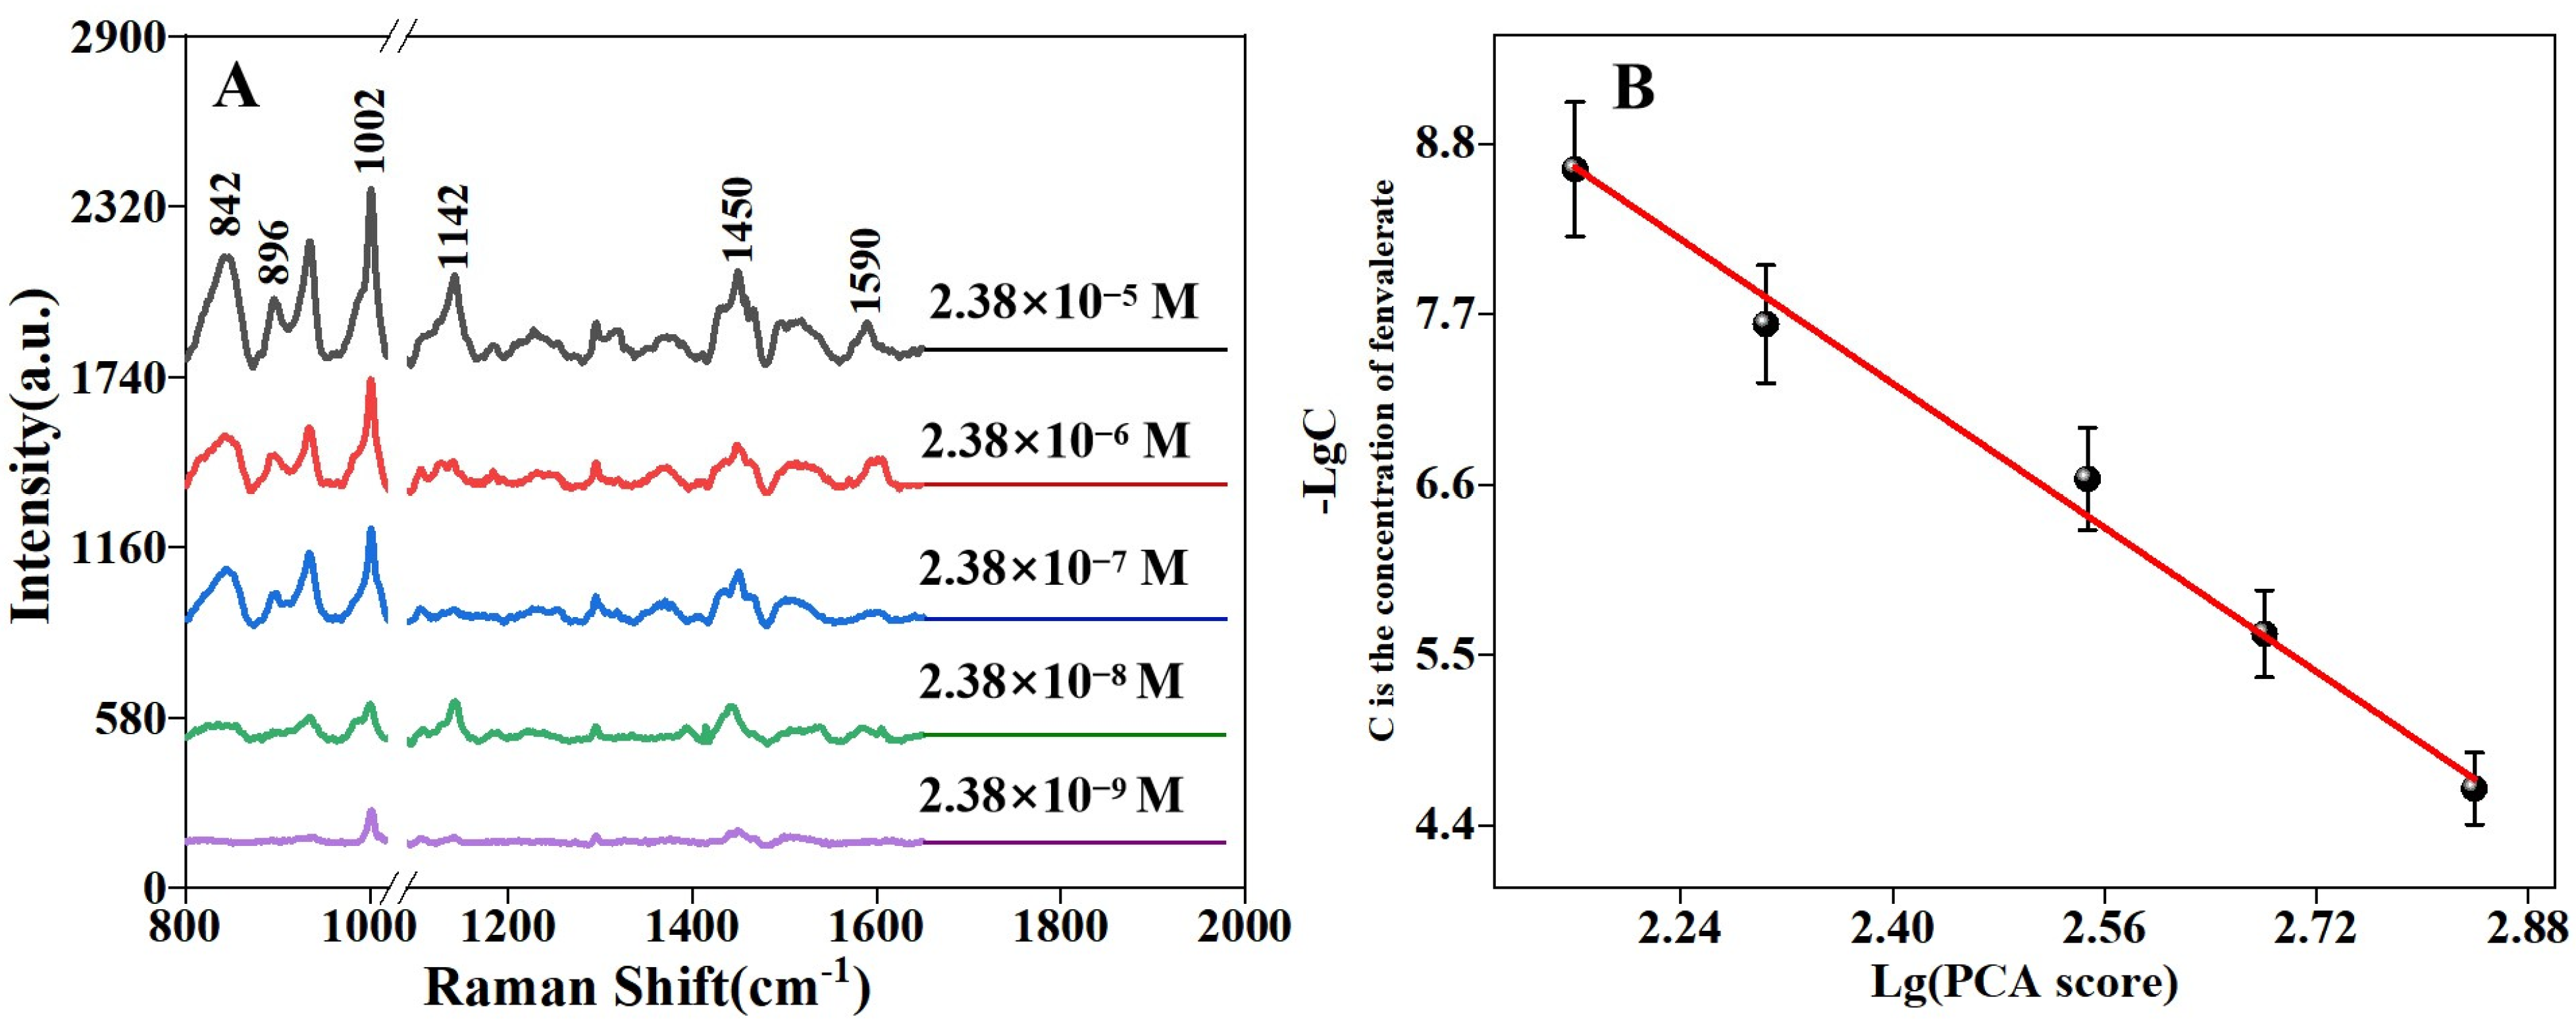
The Raman enhancement ability of Ag/rGO composite material was tested in fenvalerate detection, and the results are shown in Figure 6. Figure 6A displays the SERS spectra at different concentrations of fenvalerate after being processed by wavelet algorithms. Five characteristic peaks of fenvalerate could be clearly observed, which were basically consistent with the normal Raman bands of fenvalerate solid powder (Figure S7A) and Raman spectrum of fenvalerate obtained from DFT calculation (Figure S7B). Even at the concentration of 2.38 × 10⁻⁹ M, the SERS signal of fenvalerate could still be identified clearly and was not interfered with by the signal of the substrate itself (Figure S8), implying superior sensitivity. The above excellent detection of fenvalerate was mainly attributed to the high molecular enrichment performance of rGO through the π–π interaction and hydrophobic effect, avoiding the weak molecular affinity to the novel metal surface. We performed DFT calculations for the binding energy between fenvalerate and rGO. Figure S9A,B present the interaction models between functional groups of rGO and fenvalerate molecules. In the adsorption model, functional groups (H or COOH) in rGO play an important role in enriching fenvalerate molecules. According to the calculation results, the bonding energy was 0.234 eV between the H group and fenvalerate and 0.117 eV between the COOH group and fenvalerate, indicating that the interaction can easily occur between rGO and fenvalerate molecules. As is known to all, rGO has abundant functional groups of H or COOH, and compared with the Ag substrate, the adsorption capacity of fenvalerate on the Ag/rGO substrate can be significantly improved, which is consistent with the results of previous studies [33,34,35].
According to the literature [6] and DFT calculation of fenvalerate (Figure S8), the peaks at 842 cm−1 and 1450 cm−1 were attributed to stretching vibration of O-C≡N; the peak at 896 cm−1 was related to ring vibration; the peaks at 1002 cm−1, 1142 cm−1, and 1590 cm−1 were assigned to ring breathing and the stretching vibration of C-C and C=C, respectively. In Figure 6A, the intensity of SERS peaks was seen to increase with increasing fenvalerate concentration, indicating a certain correlation between SERS intensity and fenvalerate concentration. In order to obtain the optimal quantitative detection model, we analyzed the spectral data using univariate linear regression. The five clear peaks of fenvalerate at 842, 896, 1002, 1450, and 1590 cm−1 were randomly selected to set up the corresponding linear regression models and obtain the maximum regression coefficient R2. The representative fenvalerate peaks were selected to calculate the linear relationship, which involved a multivariate computation problem. Therefore, the PCA algorithm was employed to decrease the dimensions of multivariate variables, resulting in good accuracy and simplicity [36]. The peak intensity data of selected peaks and the corresponding concentration compose an array data structure, which was imported into the PCA algorithm. Subsequently, the variance contribution and cumulative variance contribution rate were obtained and displayed in Tables S2–S5. Because the cumulative variance contribution of one principal was greater than 85%, only one eigenvector was taken as the coefficient of PCA. The coefficients corresponding to each peak intensity can be obtained. PCA score was obtained by calculating the sum of the intensities of each peak at each concentration multiplied by the coefficients. Finally, the x-axis denoted Lg(PCA score), and the y-axis denoted -LgC (C is the concentration of fenvalerate). For all the pairwise combinations, the peak intensity at 1002 and 1590 cm−1 could be used to obtain the maximum R2 value for binary linear regression, coupled with the peak intensity at 896, 1002, and 1590 cm−1 for the best ternary linear combination, the peak intensity at 896, 1002, 1449, and 1590 cm−1 for the best quaternion linear combination, and the intensity of all peaks for the best five-element linear combination. Among all the linear regressions, the fitting effect of three Raman peaks (896, 1002, and 1590 cm−1) exhibited the best performance with an R2 of 99.2% (Figure S10A–E and Figure 6B), as well as the minimal detection error when the concentration of fenvalerate was 2.38 × 10⁻⁸ M (Figure S10F). Additionally, the limit of detection (LOD) was calculated to be 1.69 × 10⁻⁵ mg/kg (calculation details in Supporting Information), far lower than the relevant residue standard (European Union: 0.02 mg/kg; China: 2 mg/kg). These results indicate that the quantitative model of three Raman peaks was the most suitable model for fenvalerate detection.

4. Conclusions

In summary, we have developed an Ag/rGO composite structure as an effective SERS substrate through a simple solution synthesis route. Under ultrasonic oscillation, silver nanoparticles can grow closely with rGO and are distributed on the top and bottom of rGO layers, with their distribution uniformity well controlled by adjusting the concentration of silver nitrate. Due to the multi-enhancement of Raman signal from EM of novel metal nanoparticles and CM of rGO nanolayers, the ultra-high detection sensitivity of 4-ABT was achieved at the lowest detectable concentration of 1 × 10⁻¹⁰ M. Meanwhile, the composite structure exhibited a better SERS performance than pure Ag nanoparticles based on probe molecular detection experiment and FDTD simulation. More importantly, the rGO layers could capture and enrich molecules into the gaps between Ag nanoparticles through π–π interaction, avoiding poor SERS performance induced by the weak affinity of the molecule on the novel metal surface, achieving a LOD of 1.69 × 10⁻⁵ mg/kg in fenvalerate detection. All the results demonstrated the potential use of the Ag/rGO composite structure as an effective SERS substrate for fenvalerate detection.

Supplementary Materials

The following supporting information can be downloaded at https://www.mdpi.com/article/10.3390/chemosensors12050082/s1, Figure S1: The AFM images of the different positions of graphene oxide. Figure S2: Particle distribution of Ag NPs in each AgNO3 concentration. Figure S3: The TEM images of Ag/rGO material. Figure S4: UV-vis spectra of pure Ag, rGO, and Ag/Rgo. Figure S5: The Raman spectra of 4-ABT based on rGO. Figure S6: SERS spectra statistical diagram of 4-aminothiophenol (10−4 M) obtained from 20 randomly selected points on Ag/rGO substrate (A); statistical diagram of the Raman signal intensity at 1081, 1190, and 1590 cm−1 (B); SERS mapping of 4-aminothiophenol (10−4 M) obtained at 1139 cm−1 based on Ag/rGO substrate (C). Figure S7: Normal Raman of fenvalerate solid powder (A) and Raman of fenvalerate obtained using DFT calculation (B). Figure S8: SERS spectra of fenvalerate (2.38 × 10⁻⁹ M) (A) and blank composite substrate (B). Figure S9: The interaction model between rGO and fenvalerate: H group (A) and COOH (B). Figure S10. The linear regression of fenvalerate with different characteristic peaks: single peak (A), two peaks (B), three peaks (C), four peaks (D), and five peaks (E), and the error verification of −LgC was conducted with different relevant equations when the concentration of fenvalerate was 2.38 × 10⁻⁸ M (F). References [20,22,23,24,37,38,39,40,41,42] are cited in the Supplementary Materials.

Author Contributions

Validation, D.N.; formal analysis, M.Y., C.Q. and Z.Y.; investigation, M.Y., C.Q. and Z.Y.; resources, B.S.; writing—original draft preparation, M.Y., C.Q. and Z.Y.; writing—review and editing, P.L. and D.Z.; supervision, P.L. and D.Z.; funding acquisition, D.N. All authors have read and agreed to the published version of the manuscript.

Funding

This research was funded by National Nature Science Foundation of China (NO. 32202540), Fundamental Research Funds for the Central Universities (Program No. 2662023YLQD002).

Institutional Review Board Statement

Not applicable.

Informed Consent Statement

Not applicable.

Data Availability Statement

Data underlying the results presented in this paper may be obtained from the authors upon reasonable request.

Conflicts of Interest

The authors declare no conflicts of interest.

References

  1. Deng, W.; Yu, L.; Li, X.; Chen, J.; Wang, X.; Deng, Z.; Xiao, Y. Hexafluoroisopropanol-based hydrophobic deep eutectic solvents for dispersive liquid-liquid microextraction of pyrethroids in tea beverages and fruit juices. Food Chem. 2019, 274, 891–899. [Google Scholar] [CrossRef] [PubMed]
  2. Tagami, T.; Kajimura, K.; Yamasaki, K.; Sawabe, Y.; Nomura, C.; Taguchi, S.; Obana, H. Simple and Rapid Determination of Cypermethrin and Fenvalerate Residues in Kampo Products by Gas Chromatography-Mass Spectrometry with Negative Chemical Ionization. J. Health Sci. 2009, 55, 777–782. [Google Scholar] [CrossRef]
  3. Wang, D.; Liu, C.; Zhou, Z.; Wang, P. Recent advances in rapid detection of pesticide residues. Chin. J. Pestic. Sci. 2019, 21, 852–864. [Google Scholar] [CrossRef]
  4. Wang, M.; Kang, H.; Xu, D.; Wang, C.; Liu, S.; Hu, X. Label-free impedimetric immunosensor for sensitive detection of fenvalerate in tea. Food Chem. 2013, 141, 84–90. [Google Scholar] [CrossRef]
  5. Thiare, D.D.; Coly, A.; Sarr, D.; Khonte, A.; Diop, A.; Gaye-Seye, M.D.; Delattre, F.; Tine, A.; Aaron, J.-J. Determination of the fenvalerate insecticide in natural waters by a photochemically-induced fluorescence method. Maced. J. Chem. Chem. Eng. 2015, 34, 245–254. [Google Scholar] [CrossRef]
  6. Li, H.; Wang, Y.; Li, Y.; Zhang, J.; Qiao, Y.; Wang, Q.; Che, G. Fabrication of pollutant-resistance SERS imprinted sensors based on SiO2@TiO2@Ag composites for selective detection of pyrethroids in water. J. Phys. Chem. Solids 2020, 138, 109254. [Google Scholar] [CrossRef]
  7. Valley, N.; Greeneltch, N.; Van Duyne, R.P.; Schatz, G.C. A Look at the Origin and Magnitude of the Chemical Contribution to the Enhancement Mechanism of Surface-Enhanced Raman Spectroscopy (SERS): Theory and Experiment. J. Phys. Chem. Lett. 2013, 4, 2599–2604. [Google Scholar] [CrossRef]
  8. Schatz, G.C.; Young, M.A.; Van Duyne, R.P. Electromagnetic mechanism of SERS. Surf.-Enhanc. Raman Scatt. 2006, 103, 19–45. [Google Scholar] [CrossRef]
  9. Zhou, L.; Yang, J.; Wang, X.; Song, G.; Lu, F.; You, L.; Li, J. Ag nanoparticles decorated Ag@ZrO2 composite nanospheres as highly active SERS substrates for quantitative detection of hexavalent chromium in waste water. J. Mol. Liq. 2020, 319, 114158. [Google Scholar] [CrossRef]
  10. Zhang, Q.; Su, B.; Huang, J. Research progress on preparation of high active substrate base LSPR effect. Appl. Chem. Ind. 2020, 49, 709–714. [Google Scholar]
  11. Li, Y.; Yu, L.; Li, J.; Wang, L.; Lu, R. Polyamide@Ag coralloid nanoarrays with 3D high -density hot spots for ultrasensitive SERS sensing. Chem. Eng. J. 2020, 397, 125434. [Google Scholar] [CrossRef]
  12. Kim, J.; Jang, Y.; Kim, N.-J.; Kim, H.; Yi, G.-C.; Shin, Y.; Kim, M.H.; Yoon, S. Study of Chemical Enhancement Mechanism in Non-plasmonic Surface Enhanced Raman Spectroscopy (SERS). Front. Chem. 2019, 7, 582. [Google Scholar] [CrossRef] [PubMed]
  13. Jiao, A.; Cui, Q.; Li, S.; Tian, Y.; Ma, H.; Wang, C.; Zhang, M.; Chen, M.; Li, G.; Liu, X. Double profound enhancements of Cu2O nano-octahedrons connected by intertwined Ag nanovines for elevating SERS activity toward ultrasensitive pesticide detection. Opt. Express 2022, 30, 588–602. [Google Scholar] [CrossRef] [PubMed]
  14. Zhang, D.; Liang, P.; Yu, Z.; Xia, J.; Ni, D.; Wang, D.; Zhou, Y.; Cao, Y.; Chen, J.; Chen, J.; et al. Self-assembled “bridge” substance for organochlorine pesticides detection in solution based on Surface Enhanced Raman Scattering. J. Hazard. Mater. 2020, 382, 121023. [Google Scholar] [CrossRef] [PubMed]
  15. Xu, M.-L.; Gao, Y.; Han, X.X.; Zhao, B. Detection of Pesticide Residues in Food Using Surface-Enhanced Raman Spectroscopy: A Review. J. Agric. Food Chem. 2017, 65, 6719–6726. [Google Scholar] [CrossRef]
  16. Wang, K.; Sun, D.-W.; Pu, H.; Wei, Q. Polymer multilayers enabled stable and flexible Au@Ag nanoparticle array for nondestructive SERS detection of pesticide residues. Talanta 2021, 223, 121782. [Google Scholar] [CrossRef] [PubMed]
  17. Zhao, B.; Hao, R.; Wang, Z.; Zhang, H.; Hao, Y.; Zhang, C.; Liu, Y. Green synthesis of multi-dimensional plasmonic coupling structures: Graphene oxide gapped gold nanostars for highly intensified surface enhanced Raman scattering. Chem. Eng. J. 2018, 349, 581–587. [Google Scholar] [CrossRef]
  18. Ling, X.; Moura, L.G.; Pimenta, M.A.; Zhang, J. Charge-Transfer Mechanism in Graphene-Enhanced Raman Scattering. J. Phys. Chem. C 2012, 116, 25112–25118. [Google Scholar] [CrossRef]
  19. He, Q.; Han, Y.; Huang, Y.; Gao, J.; Gao, Y.; Han, L.; Zhang, Y. Reusable dual-enhancement SERS sensor based on graphene and hybrid nanostructures for ultrasensitive lead (II) detection. Sens. Actuators B-Chem. 2021, 341, 130031. [Google Scholar] [CrossRef]
  20. Zhang, C.-Y.; Zhao, B.-C.; Hao, R.; Wang, Z.; Hao, Y.-W.; Zhao, B.; Liu, Y.-Q. Graphene oxide-highly anisotropic noble metal hybrid systems for intensified surface enhanced Raman scattering and direct capture and sensitive discrimination in PCBs monitoring. J. Hazard. Mater. 2020, 385, 121510. [Google Scholar] [CrossRef]
  21. Biasotto, G.; Chiad, A.; Novara, C.; Fontana, M.; Armandi, M.; Zaghete, M.A.; Giorgis, F.; Rivolo, P. Graphenic Aerogels Decorated with Ag Nanoparticles as 3D SERS Substrates for Biosensing. Part. Part. Syst. Charact. 2020, 37, 2000095. [Google Scholar] [CrossRef]
  22. Zheng, H.; Ni, D.; Yu, Z.; Liang, P. Preparation of SERS-active substrates based on graphene oxide/silver nanocomposites for rapid zdetection of L-Theanine. Food Chem. 2017, 217, 511–516. [Google Scholar] [CrossRef]
  23. Grimme, S. Semiempirical GGA-type density functional constructed with a long-range dispersion correction. J. Comput. Chem. 2006, 27, 1787–1799. [Google Scholar] [CrossRef]
  24. Delley, B. An all-electron numerical-method for solving the local density functional for polyatomic-molecules. J. Chem. Phys. 1990, 92, 508–517. [Google Scholar] [CrossRef]
  25. Zemlyanov, D.Y.; Savinova, E.; Scheybal, A.; Doblhofer, K.; Schlogl, R. XPS observation of OH groups incorporated in an Ag(111) electrode. Surf. Sci. 1998, 418, 441–456. [Google Scholar] [CrossRef]
  26. Feng, L.; Wang, W.; Li, X.; Chen, T. Spontaneous Growth of 3D Silver Mesoflowers on Poly(4-vinylpyridine) Brushes-Grafted-Graphene Oxide Films and Facile Creation of Nanoporosities over their Surface. Chem.-A Eur. J. 2019, 25, 16377–16381. [Google Scholar] [CrossRef] [PubMed]
  27. Shaheen, F.; Aziz, M.H.; Fakhar-e-Alam, M.; Atif, M.; Fatima, M.; Ahmad, R.; Hanif, A.; Anwar, S.; Zafar, F.; Abbas, G.; et al. An In Vitro Study of the Photodynamic Effectiveness of GO-Ag Nanocomposites against Human Breast Cancer Cells. Nanomaterials 2017, 7, 401. [Google Scholar] [CrossRef] [PubMed]
  28. Zhang, D.; Liang, P.; Yu, Z.; Huang, J.; Ni, D.; Shu, H.; Dong, Q.-m. The effect of solvent environment toward optimization of SERS sensors for pesticides detection from chemical enhancement aspects. Sens. Actuators B-Chem. 2018, 256, 721–728. [Google Scholar] [CrossRef]
  29. Shi, M.; Zheng, J.; Liu, C.; Tan, G.; Qing, Z.; Yang, S.; Yang, J.; Tan, Y.; Yang, R. SERS assay of telomerase activity at single-cell level and colon cancer tissues via quadratic signal amplification. Biosens. Bioelectron. 2016, 77, 673–680. [Google Scholar] [CrossRef] [PubMed]
  30. Huang, Y.-F.; Zhu, H.-P.; Liu, G.-K.; Wu, D.-Y.; Ren, B.; Tian, Z.-Q. When the Signal Is Not from the Original Molecule To Be Detected: Chemical Transformation of para-Aminothiophenol on Ag during the SERS Measurement. J. Am. Chem. Soc. 2010, 132, 9244–9246. [Google Scholar] [CrossRef] [PubMed]
  31. Wang, T.; Zheng, R.; Hu, X.; Zhang, L.; Dong, S. Templated assembly of gold nanoparticles into microscale tubules and their application in surface-enhanced Raman scattering. J. Phys. Chem. B 2006, 110, 14179–14185. [Google Scholar] [CrossRef] [PubMed]
  32. Zheng, J.W.; Zhou, Y.G.; Li, X.W.; Ji, L.; Lu, T.H.; Gu, R.A. Surface-enhanced Raman scattering of 4-aminothiophenol in assemblies of nanosized particles and the macroscopic surface of silver. Langmuir 2003, 19, 632–636. [Google Scholar] [CrossRef]
  33. Li, H.; Wang, X.; Wang, Z.; Wang, Y.; Dai, J.; Gao, L.; Wei, M.; Yan, Y.; Li, C. A polydopamine-based molecularly imprinted polymer on nanoparticles of type SiO2@rGO@Ag for the detection of lambda-cyhalothrin via SERS. Microchim. Acta 2018, 185, 193. [Google Scholar] [CrossRef] [PubMed]
  34. Guo, T.-L.; Li, J.-G.; Sun, X.; Sakka, Y. Photocatalytic growth of Ag nanocrystals on hydrothermally synthesized multiphasic TiO2/reduced graphene oxide (rGO) nanocomposites and their SERS performance. Appl. Surf. Sci. 2017, 423, 1–12. [Google Scholar] [CrossRef]
  35. Zhang, C.; Lia, C.; Yu, J.; Jiang, S.; Xu, S.; Yang, C.; Liu, Y.J.; Gao, X.; Liu, A.; Man, B. SERS activated platform with three-dimensional hot spots and tunable nanometer gap. Sens. Actuators B-Chem. 2018, 258, 163–171. [Google Scholar] [CrossRef]
  36. Zhang, D.; Liang, P.; Ye, J.; Xia, J.; Zhou, Y.; Huang, J.; Ni, D.; Tang, L.; Jin, S.; Yu, Z. Detection of systemic pesticide residues in tea products at trace level based on SERS and verified by GC-MS. Anal. Bioanal. Chem. 2019, 411, 7187–7196. [Google Scholar] [CrossRef] [PubMed]
  37. Delley, B. From molecules to solids with the DMol 3 approach. J. Chem. Phys. 2000, 113, 7756–7764. [Google Scholar] [CrossRef]
  38. Shrivastava, A.; Gupta, V.B. Methods for the determination of limit of detection and limit of quantitation of the analytical methods. Chron. Young Sci. 2011, 2, 21–25. [Google Scholar] [CrossRef]
  39. He, J.; Song, G.; Wang, X.; Zhou, L.; Li, J. Multifunctional magnetic Fe3O4/GO/Ag composite microspheres for SERS detection and catalytic degradation of methylene blue and ciprofloxacin. J. Alloys Compd. 2022, 893, 162226. [Google Scholar] [CrossRef]
  40. Zhang, L.; Jiang, C.; Zhang, Z. Graphene oxide embedded sandwich nanostructures for enhanced Raman readout and their applications in pesticide monitoring. Nanoscale 2013, 5, 3773–3779. [Google Scholar] [CrossRef]
  41. Qu, L.-L.; Liu, Y.-Y.; Liu, M.-K.; Yang, G.-H.; Li, D.-W.; Li, H.-T. Highly reproducible Ag NPs/CNT-intercalated GO membranes for enrichment and SERS detection of antibiotics. ACS Appl. Mater. Interfaces 2016, 8, 28180–28186. [Google Scholar] [CrossRef] [PubMed]
  42. Fu, W.L.; Zhen, S.J.; Huang, C.Z. One-pot green synthesis of graphene oxide/gold nanocomposites as SERS substrates for malachite green detection. Analyst 2013, 138, 3075–3081. [Google Scholar] [CrossRef] [PubMed]
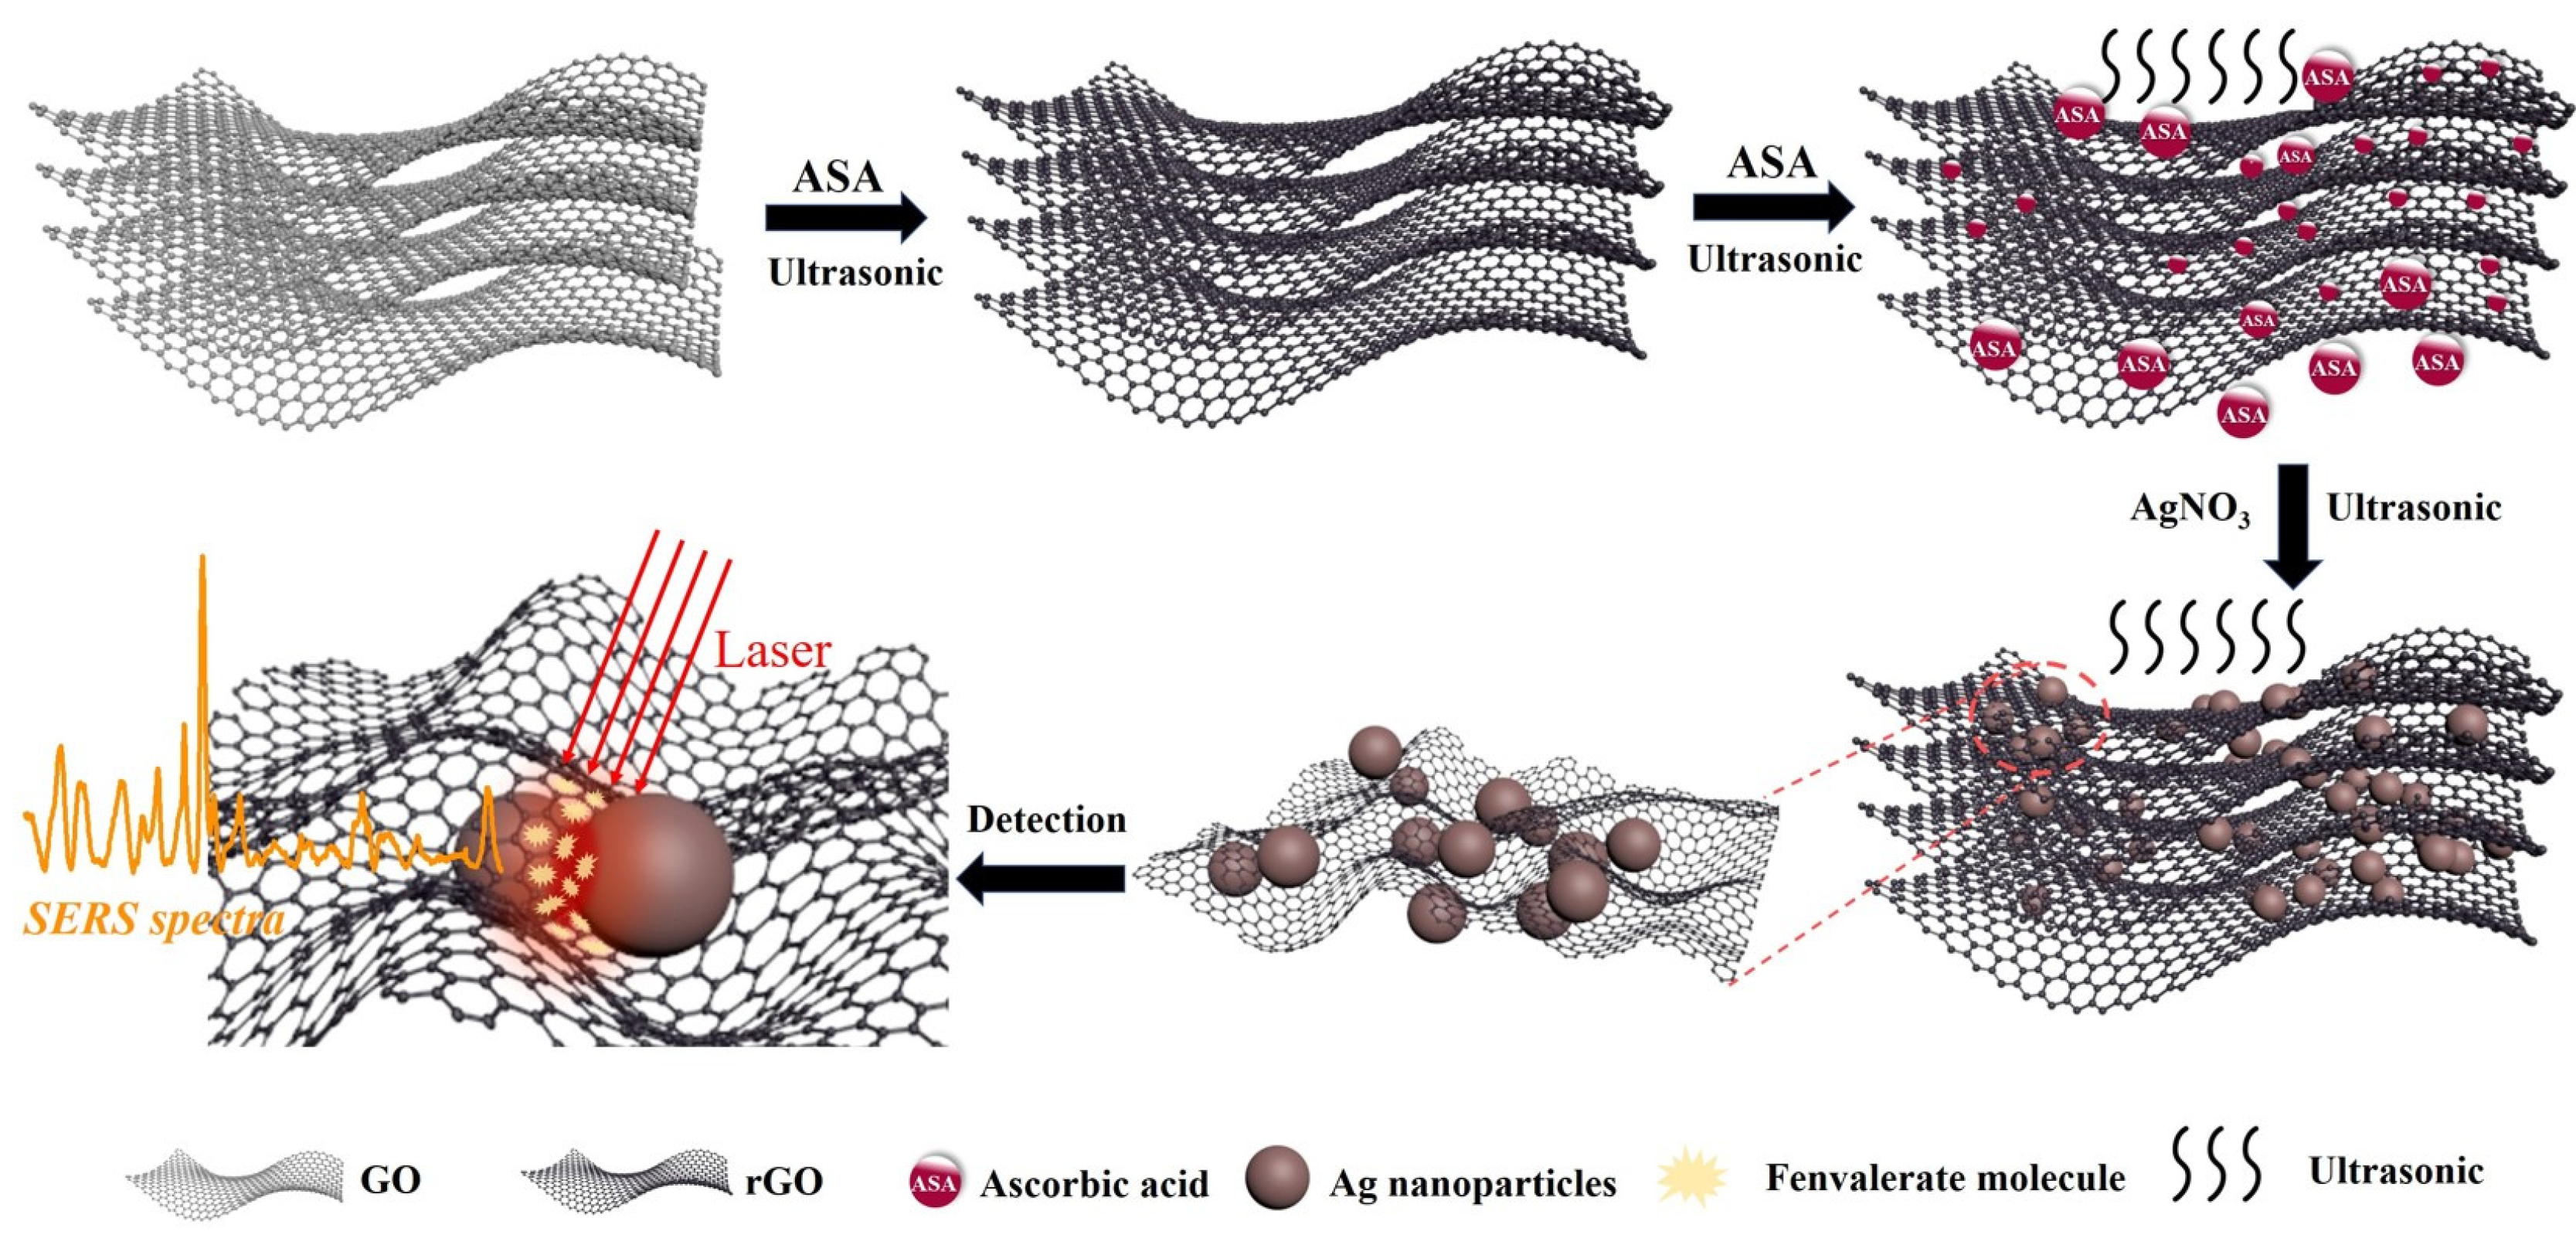
Figure 1. Fabrication of Ag/rGO substrate and enrichment of fenvalerate molecules for SERS detection.
Chemosensors 12 00082 g001
Figure 2. SEM images of Ag/rGO substrate with AgNO3 at different concentrations: (A) 0.1 mL, (B) 0.3 mL, (C) 0.5 mL, (D) 1.5 mL, (E) 2.0 mL, and rGO (F); SEM images (G,H), TEM image (I), EDS mapping (JL), and SADE image (M) of Ag/rGO substrate with optimized silver nitrate concentration.
Chemosensors 12 00082 g002
Figure 3. Deconvoluted XPS spectra of Ag/rGO (A), C1s (B), Ag3d (C), and O1s (D).
Chemosensors 12 00082 g003
Figure 4. SERS spectra of 4-ABT with different concentrations based on Ag nanoparticles (A) and Ag/rGO substrate (B).
Chemosensors 12 00082 g004
Figure 5. The FDTD results of Ag and Ag/rGO substrate. (A) y-axis is the direction of incident light (perpendicular). (B) z axis is the direction of incident light (parallel). (C) Charge distribution diagram of Ag and Ag/rGO substrate. (D) Simulation strength comparison curves of Ag and Ag/rGO substrate.
Chemosensors 12 00082 g005
Figure 6. SERS spectra of fenvalerate at different concentrations (A) and the linear regression of fenvalerate with three characteristic peaks (B).
Chemosensors 12 00082 g006
Disclaimer/Publisher’s Note: The statements, opinions and data contained in all publications are solely those of the individual author(s) and contributor(s) and not of MDPI and/or the editor(s). MDPI and/or the editor(s) disclaim responsibility for any injury to people or property resulting from any ideas, methods, instructions or products referred to in the content.