Article

Metal–Organic Framework-Derived CeO2/Gold Nanospheres in a Highly Sensitive Electrochemical Sensor for Uric Acid Quantification in Milk

by
Miloš Ognjanović
1,
Milena Marković
2,
Vladimír Girman
3,4,
Vladimir Nikolić
5,
Sanja Vranješ-Đurić
1,
Dalibor M. Stanković
1,5,* and
Branka B. Petković
2,*
1
VINČA Institute of Nuclear Sciences, National Institute of the Republic of Serbia, University of Belgrade, 11000 Belgrade, Serbia
2
Faculty of Sciences and Mathematics, University of Priština in Kosovska Mitrovica, Lole Ribara 29, 38220 Kosovska Mitrovica, Serbia
3
Institute of Physics, Faculty of Science, P. J. Šafárik University in Košice, Park Angelinum 9, 041 54 Košice, Slovakia
4
Institute of Materials Research, Slovak Academy of Sciences, Watsonova 47, 040 01 Košice, Slovakia
5
Faculty of Chemistry, University of Belgrade, Studentski trg 12-16, 11000 Belgrade, Serbia
*
Authors to whom correspondence should be addressed.
Chemosensors 2024, 12(11), 231; https://doi.org/10.3390/chemosensors12110231
Submission received: 30 September 2024 / Revised: 31 October 2024 / Accepted: 1 November 2024 / Published: 3 November 2024
(This article belongs to the Special Issue Chemical and Biosensors Based on Metal-Organic Frames (MOFs))

Abstract

:
In this work, CeBTC (a cerium(III) 1,3,5-benzene-tricarboxylate), was used as a precursor for obtaining CeO2 nanoparticles (nanoceria) with better sensor performances than CeO2 nanoparticles synthesized by the solvothermal method. Metal–organic framework-derived nanoceria (MOFdNC) were functionalized with spheric gold nanoparticles (AuNPs) to further improve non-enzymatic electrode material for highly sensitive detection of prominent biocompound uric acid (UA) at this modified carbon paste electrode (MOFdNC/AuNPs&CPE). X-ray powder diffraction (XRPD) and transmission electron microscopy (TEM) analysis were used for morphological structure characterization of the obtained nanostructures. Cyclic voltammetry and electrochemical impedance spectroscopy, both in an [Fe(CN)6]3−/4− redox system and uric acid standard solutions, were used for the characterization of material electrocatalytic performances, the selection of optimal electrode modifier, and the estimation of nature and kinetic parameters of the electrode process. Square-wave voltammetry (SWV) was chosen, and the optimal parameters of technique and experimental conditions were established for determining uric acid over MOFdNC/AuNPs&CPE. Together with the development of the sensor, the detection procedure was optimized with the following analytical parameters: linear operating ranges of 0.05 to 1 µM and 1 to 50 µM and a detection limit of 0.011 µM, with outstanding repeatability, reproducibility, and stability of the sensor surface. Anti-interference experiments yielded a stable and nearly unchanged current response with negligible or no change in peak potential. After minor sample pretreatment, the proposed electrode was successfully applied for the quantification of UA in milk.

1. Introduction

Uric acid (UA) is a weak organic acid, hardly soluble in water or ethanol, and it forms ions and salts known as urates and acid urates. Scheele separated monosodium urate crystals from kidney gout nodules and connected this compound to gout, a common, complex, and painful form of arthritis [1]. After that, Fourcroy discovered uric acid in human urine. Uric acid is a final oxidation product of purine metabolism, extracted in urine. The concentration of UA in the blood can increase, reaching 408 µM in serum (6.8 mg/dL), which can be diagnosed as pathological hyper-uricemia [2], if the body does not contain enough uricase, an enzyme for the catalysis of UA oxidation when UA is converted in water-soluble allantoin. Besides gout, this condition may be a precursor to the development of metabolic syndrome, diabetes, hypertension, and kidney and cardiovascular diseases, but some genetic diseases are related to small concentrations of UA [3]. As the body converts purines into uric acid, the consumption of food rich in purines can contribute to hyper-uricemia-developed diseases [4]. So, keeping uric acid at optimum levels, in a range between 5.0 and 7.0 mg/dL, is important for the normal functioning of the organism, and food intake could be a major contributor to this. It is important to mention that uric acid also plays an active, vital role in the body’s function in terms of initiating the inflammatory process that is necessary for tissue repair, mobilizing the progenitor of endothelial cells, and providing an antioxidant defense from oxygen free radicals that cause aging and cancer [5]. In food technology, a recent study confirmed that the antioxidant activity of uric acid can protect milk from rapid microbiological spoilage [6]. Zuo et al. determined uric acid by Hydrophilic Interaction HPLC [7], and they found 24.1 ± 0.05 to 36.8 ± 0.04 mg mL−1 of UA in bovine milk. Motshakeri et al. applied cyclic voltammetry to different milk samples and found 52.3 ± 2.1 to 92.9 ± 2.3 μM of UA, with no significant difference in uric acid content between fresh milk, UHT, and other processed milk samples [8]. Khamzina and co-workers found a high content of uric acid in fresh cow’s milk (208 ± 1 μM), while in pasteurized milk samples, they found much lower concentrations of 61 ± 6 and 77 ± 3 μM of uric acid [6]. Bearing in mind all of this, researching uric acid effects in the human body tissue and food and developing new, reliable, and accurate analytical procedures and methods for determining low UA concentrations are of high importance for medical sciences and industrial technologies.
Besides the spectral, fluorescence, capillary electrophoresis detections and various HPLC methods [9], the significance of determining uric acid has also conditioned the development of electrochemical methods for this purpose [10,11]. Among other analytical tools, electrochemical sensors proved themselves to be one of the most promising, bearing in mind low-cost instrumentation, facile fabrication, easy operation, fast response, good sensitivity and selectivity, and minor sample preparation [12,13]. CeO2 NPs (nanoceria) belong to high-quality electrode modification materials because of their unique physicochemical properties like switching between Ce+3 and Ce+4 oxidation states, ionic conductivity, oxygen storing capacity, chemically inertness, and thermal stability. For this reason, CeO2-based materials are suitable for diverse applications, such as catalysts, sensors, actuators, transducers, and supercapacitors [11]. Employed like uric acid sensor electrode material (often simultaneously determining other biocompounds like ascorbic acid, dopamine, and others), nanoceria were reported in different structures like CeO2 nanocubes [14], sponge-like CeO2 [15], and ZnO-CeO2 hollow nanospheres [16] or doped with cobalt [17] or indium nanoparticles [18]. As can be seen, for synergic improvement in sensor properties, CeO2 nanoparticles can be easily combined or functionalized with other nanomaterials, such as noble and other metals and metal oxide nanoparticles, and often with carbon nanomaterials. Au nanostructures were reported in the literature in different sizes, shapes, and compositions and applied in electrochemical sensors because of their biocompatibility, good thermal and electrical conductivity, chemical stability, and high volume/surface ratio [19]. Gold nanoparticles can be synthesized by physical, chemical, biological, and electrochemical methods [20], and some of them are commercially available. Nanoparticles stabilized in active CeO2 support are among the most popular gold-based systems for CO oxidation and other oxidation reactions [21]. Different AuNPs/CeO2 nanocomposites were successfully fabricated: Huang and coauthors applied atomically precise Au25 superatoms with electron-deficient Au12 shells and electron-rich Au13 cores immobilized on the surface of CeO2 nanorods as catalysts for styrene oxidation [22]. Gold nanoclusters supported on mesoporous CeO2 nanospheres were used for the reduction of nitrobenzene; Jiao et al. obtained strawberry-like Au@CeO2 nanoparticles by the assembly of block copolymer composite micelles [23], while Tang and coauthors employed Au-CeO2 composite aerogels with tunable Au nanoparticle sizes as plasmonic photocatalysts for CO2 reduction [24]. Also, Palanisamy et al. reported electrochemical sensing and the simultaneous detection of dopamine and uric acid at electrochemically deposited gold 3D nanoclusters on nanoceria of biomolecule adsorption and mass transport [25]. Considering the catalytic performance and selectivity of nanoceria/Au nanocomposite materials, it can be concluded that the structure properties and morphologies of metal and metal oxide nanoparticles play a key role in the tailoring of new functional materials.
Metal–organic frameworks (MOFs) present a prestigious group of materials with tunable pore sizes and high surface area, suitable for diverse applications [26,27]. On the other hand, the insufficient electronic conductivity and relatively poor chemical stability of these materials are a significant disadvantage, which can be overcome in MOF-derived functional materials: metal oxides and hierarchical carbon-based hybrid structures [28], in this form applicable for electrochemical sensing [29]. The approach through template-assisted nanomaterials offers promising protocols for obtaining nanoparticles with improved performances [30]. Then, MOF-derived metal oxide nanostructures can be combined with other functional materials in order to design further improved electronic structure of the sensor interface and enhance catalytic performance, which was a goal of this work.
In light of this, it is worthwhile to explore and compare the structural and electrochemical properties of CeO2 NPs, prepared in two different ways: by one of the most preferred methods—solvothermal synthesis—and nanoceria, easily prepared from CeBTC MOF, as a precursor for obtaining a functional CeO2 nanostructure. Electrode modification with CeO2 NPs can contribute to resistance to fouling from the oxidation of interferences and oxidation products of uric acid [16,31]. As MOF-derived CeO2 NPs can promote electron transfer between uric acid and the electrode, adding AuNPS in the electrode modifier can further improve the electrocatalytic activity of CeO2. Together, they can form a stable composite material that enhances sensitivity and response time for the electrochemical detection of uric acid. Hence, the selected favorable composite electrode modifier for a uric acid sensor with improved activity was prepared by combining two nanomaterials: 1—nanoceria, obtained by thermolysis of CeBTC MOF, synthesized at room temperature, and 2—gold nanoparticles, commercially available. Morphological and electrochemical characterization was used for structure analysis and to determine the sensor properties of the proposed binary nanocomposite. A sensitive and fast analytical SWV method at CeBTC-derived nanoceria/AuNP-modified CPE was developed by changing and optimizing experimental and technique parameters. Selectivity over possible interferences was estimated, and MOFdNC/AuNPs&CPE was successfully applied to determine uric acid in milk samples.

2. Materials and Methods

2.1. Chemicals

Cerium(III)-chloride heptahydrate and benzene-1,3,5-tricarboxylic acid (BTC) were purchased from Alfa Aesar (Haverhill, MA, USA). Ethylene glycol (≥99.5%) was acquired by Fluka, while poly(vinylpyrrolidone) (Mw 40,000) and sodium acetate trihydrate (≥99%) were obtained from Sigma Aldrich (St. Louis, MO, USA). Gold nanoparticles, 10 nm diameter, OD 1, stabilized suspension in citrate buffer, paraffin oil, and glassy carbon powder were all products of the Sigma Aldrich company (USA). All other chemicals used to perform the experiments in this work were reagent grade. Britton–Roinson buffer (pH 2 to 9) was prepared by adjusting the pH of a 0.05 M solution of acetic, boric, and phosphoric acid with a 0.2 M NaOH solution. Ultrapure water was produced from the Millipore Milli Q system.

2.2. Methods and Instrumentation

The crystal structures of the synthesized nanoceria were determined through X-ray powder diffraction (XRPD) analysis. Dried powder samples were examined using a high-resolution Smart Lab® diffractometer (Rigaku, Japan) equipped with a CuKα radiation source working at 40 kV accelerating voltage and 30 mA current. Diffraction patterns were collected within the 2θ range of 10–70°.
Transmission electron microscopy (TEM) was performed using a JEOL JEM 2100F UHR microscope operated at 200 kV to analyze the nanoparticle morphology. Diluted aqueous dispersions of the samples were deposited onto commercial copper support TEM grids and left to dry overnight at room temperature. TEM images were acquired in bright field mode in a STEM regime.
All electrochemical measurements were performed at an Autolab 302 N with corresponding NOVA 2.0.2 software. The three-electrode electrochemical working station consisted of an Ag/AgCl (saturated KCl) as the reference electrode, a Pt-wire as the counter electrode, and a modified carbon paste electrode as a working electrode. For the electrochemical characterization of electrode modifiers, cyclic voltammetric (CV) and electrochemical impedance spectroscopy (EIS) measurements were performed in a redox test solution of 5 mM K3[Fe(CN)]6/K4[Fe(CN)]6 (1:1) in 0.1 M KCl. EIS measurements were performed with the frequency changed from 1·105 Hz to 1∙102 Hz and a signal amplitude of 5 mV at the potential of 0.05 V. For analytical measurements, the SWV technique was used. The optimal parameters were found by varying the pulse amplitude from 10 to 50 mV, the frequency from 10 to 90 Hz, and the potential step from 2 to 8 mV/s. Measurements of uric acid standard solutions for the calibration curve and analysis of milk samples were performed by applying optimized parameters of the SWV technique: a pulse amplitude of 40 mV, a frequency of 80 Hz, and a potential step of 4 mV/s.

2.3. Synthesizing CeBTC MOF and Obtaining CeO2 NPs

CeO2 nanoparticles were synthesized by the solvothermal method. Cerium oxide nanoparticles (CeO2) were synthesized following a modified literature procedure [32]. Specifically, the concentrations of CeCl3∙7H2O and poly(vinylpyrrolidone) (PVP40) were varied, and the experimental method was adjusted. A typical synthesis involved dissolving 4 mmol of CeCl3∙7H2O in 60 mL of ethylene glycol (EG) using ultrasound. Then, 80 mmol of PVP40 was slowly added under vigorous magnetic stirring and mild heating until a homogeneous, colorless solution was formed. Finally, 20 mg of sodium acetate trihydrate (NaAc) was added to the solution. The mixture was transferred to a 100 mL Teflon-lined stainless-steel autoclave, sealed, and heated at 190 °C for 4 h for hydrothermal treatment. After cooling to room temperature, the precipitate was centrifuged and washed several times with deionized water and ethanol to remove excess EG, PVP, and NaAc. The product was dried overnight at 80 °C and afterward calcined at 400 °C for 4 h for better crystallization.
During the synthesis of MOF-derived CeO2 nanoparticles, a CeBTC metal–organic framework was easily synthesized by a complex reaction between Ce3+ and trimesic acid as a ligand at room temperature, according to the previously reported procedure [33]. In the first solution, 0.25 mmol of CeCl3·7H2O was added to 50 mL of ultrapure water, and the second solution was prepared when 0.25 mmol of benzene-1,3,5-tricarboxylic acid was dissolved in 50 mL of an ethanol/water solution (v/v = 1:1) under vigorous stirring. These two solutions were mixed, and after a continuous stirring for 1.5 h, a white precipitate of CeBTC was collected by centrifugation. This precipitate was washed several times with ethanol/water (v/v, 1:1) and then dried at 60 °C. CeO2 NPs were obtained by thermolysis of the as-prepared CeBTC. The calcination was performed at a temperature of 450 °C at 10 °C/min for 3 h in air conditions and cooled down to room temperature naturally.

2.4. Preparation of MOFdNC/AuNP-Modified CPE

First, 10 mg of MOF-derived CeO2 NPs was mixed with 1 mL of the gold nanoparticle suspension and ultrasonicated for 1 h. Liquid from the suspension of CeO2 NPs/Au NPs was left to evaporate at 40 °C. Then, 10 mg of light orange powder was mixed with paraffin oil and glassy carbon powder in a mortar, at a ratio of 1:4, up to a total amount of material of 100 mg. After standing overnight, the resulting paste was used as CeO2 NPs/Au NP-modified CPE.

2.5. Preparation of Milk Samples

Before analysis, two samples of pasteurized milk were prepared by removing proteins with the following procedure: a certain amount of pasteurized milk samples was fully mixed with trichloroacetic acid (10%) and then centrifuged at 5000 rpm for 20 min to remove the protein fraction, and the supernatant was collected. Then, 100 µM of this milk supernatant was added into an electrochemical cell with BR buffer pH 6 and spiked with a certain amount of UA before each SWV measurement.

3. Results and Discussion

3.1. Structural Analysis and Morphological Characterization

The crystal structure of the synthesized cerium oxide nanoparticles, prepared both hydrothermally and by the pyrolysis of the cerium-based metal–organic framework (MOF), were analyzed using X-ray powder diffraction (XRPD). The obtained diffractograms indicated that both samples crystallized in the pure cubic CeO2 phase (JCPDS card #43-1002) without any detectable impurities or other crystalline phases (Figure 1a) [34]. The presence of intense and broadened diffraction peaks in the XRPD patterns indicated the crystalline nature of the cerium oxide particles, as well as their nanoscale dimensions. The average crystallite size of the hydrothermally prepared CeO2 was determined to be 8 ± 1 nm using the Scherrer equation applied to the most intense diffraction peaks. Similarly, the crystallite size of the MOF-derived CeO2 was found to be 7 ± 1 nm. This analysis indicates that both synthesis methods successfully yielded pure cerium oxide nanoparticles with comparable crystallite sizes within the experimental error range. The XRD diffraction pattern of the parent compound (CeBTC) was also checked (Figure S1a). The observed diffraction peaks in the CeBTC particles closely matched those reported in the previous literature, which were indexed to Ce(1,3,5-BTC)(H2O)6 [33]. In addition, FT-IR spectra of CeBTC were analyzed (Figure S1b). The FTIR spectrum of mesoporous CeBTC exhibits prominent absorption bands at 1367, 1431, and 1608 cm−1, characteristic of carboxylate group vibrations. These bands correspond to the asymmetric, symmetric C=O stretching modes and the C–O stretching mode associated with the binding of carboxylate (COOH) groups to Ce ions. The analyzed spectrum also clearly shows most of the typical bands associated with the COO groups of BTC 3 - ligands in the CeBTC metal–organic framework.
The morphology of the synthesized samples was first characterized by transmission electron microscopy (TEM) measurements (Figure 1b–f). In contrast to XRPD measurements, the morphology of nanoceria samples prepared in different ways differs significantly. Nanoceria prepared hydrothermally consist of small spherical nanoparticles of an average diameter of 8.7 ± 1.2 nm, which are heavily agglomerated into cluster-like structures (Figure 1b,c). On the other hand, MOFdNC consists of layered nanotube-like structures that are stacked on top of each other. The length of each tube is between half and one micron, while the thickness of each layer is extremely small and amounts to 6.5 ± 1.5 nm, which is comparable to the average crystallite size from XRPD measurements (Figure 1d,e). Additionally, we prepared a MOFdNC/AuNP nanocomposite, which is best seen in Figure 1f. Spherical gold nanoparticles were decorated on the surface of MOFdNC tubes, potentially enhancing the surface area of the material and facilitating improved electron transfer and electrocatalytic properties. The morphology of the CeBTC particles was investigated using scanning electron microscopy (SEM). The pristine Ce-MOF exhibited an urchin-like structure composed of closely packed nanorods, with an overall diameter of about 4–5 μm (as displayed in Figure S1c–e). This structure resulted from the self-assembly of nanorods through a spilling growth mechanism, leading to the formation of larger hierarchical architectures, a phenomenon often observed in anisotropic crystal structures.
Liu et al. demonstrated a significant influence of the precursor morphology on the catalytic activity of CuCeO in their research [35]. They found that an urchin-like morphology exhibited superior catalytic activity compared to rod-like or strawsheaf-like morphologies, attributed to the presence of highly dispersed species and oxygen vacancies. The morphology of nanoceria plays a key role in the catalytic activity of modified electrodes as well, especially because of its surface reactivity and ability to store and release oxygen through changes in the oxidation state between Ce3+ and Ce4+. These factors are crucial both for electrochemical and catalytic applications. A thorough electrochemical characterization is necessary to establish the correlation between particle morphology and catalytic activity on the electrode modifier.

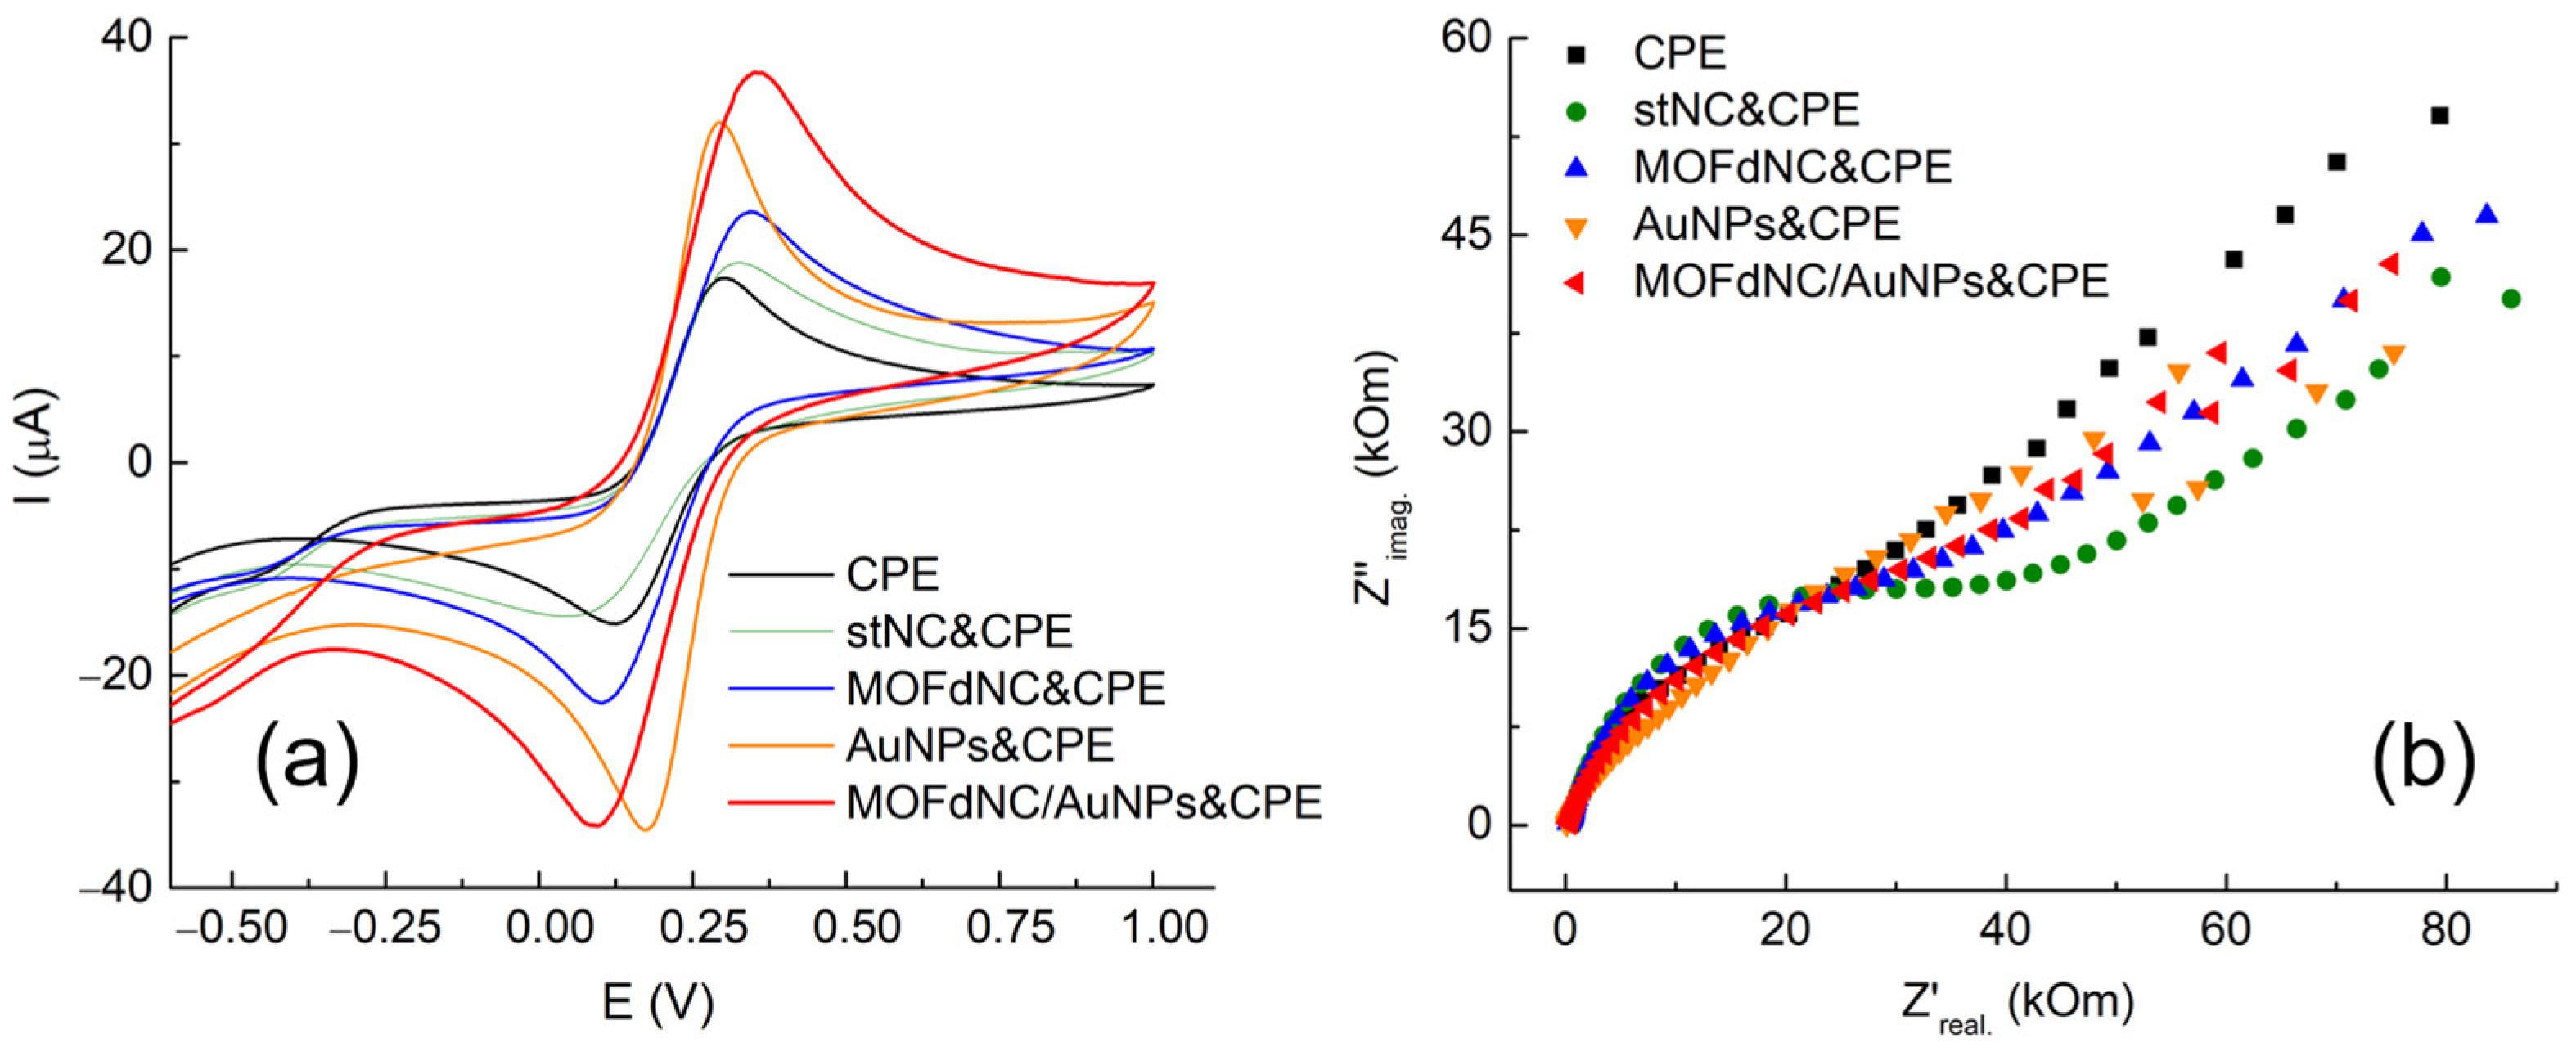
3.2. Determination of the Electrochemical Properties of the Selected Catalysts in the [Fe(CN)6]3−/4− Redox Probe

The results of our recent study confirmed the suitability of CeBTC-derived nanoceria as a potential sensor modifier. Based on those results, comparisons of the electrocatalytic behavior of pristine, solvothermal-prepared CeO2 NP-, Au NP-, and MOF-derived nanoceria and gold NP-functionalized MOF-derived nanoceria-modified carbon paste electrodes were performed by cyclic voltammetry. Studies were performed in 5 mM ferro-ferri-cyanide/KCl solution within the potential window of −0.6 to +1 V at a scanning rate of 50 mV/s. In Figure 2, it is obvious that MOF-derived nanoceria show better electrochemical response compared with nanoceria obtained by solvothermal synthesis, and further functionalization of this material with gold nanospheres rapidly enhanced peak current. Slight changes in the potential of the peaks, increasing the potential of the oxidation peak towards more positive values and the reduction peak towards more negative values, are attributed to the heterogeneous surface of the electrode due to the homemade preparation of the electrode, which is expected for such measurements. The final electrode modification shows excellent cathodic and anodic peak current values of −34 µA and +36 µA, respectively, with a total increase of over 100% compared with the unmodified electrode. This effect can be attributed to the extraordinary properties of the selected materials and the collective effect of the prepared bimetallic nanocomposite material.
This current improvement can be attributed to the synergetic effect of gold nanoparticles and nanoceria, where the final composite demonstrates fast electron transfer kinetic and mass/charge transfer properties.
Electrochemical impedance spectroscopy measurements were conducted to study the interface properties of electrode surfaces. The electron transfer kinetics of [Fe(CN)6]3−/4− at pristine and different modified electrodes revealed a typical Nyquist plot, as can be seen in Figure 2b. All obtained EIS curves include a semicircle part at high frequencies that corresponds to the electron transfer limited process consistent with charge transfer resistance. The results demonstrated that modified electrodes possess smaller semicircles compared with pristine CPE, and the best electrochemical properties and promotion of the electron transfer process were spotted at MOF-derived nanoceria functionalized with gold nanospheres, corresponding to previously considered CV data.

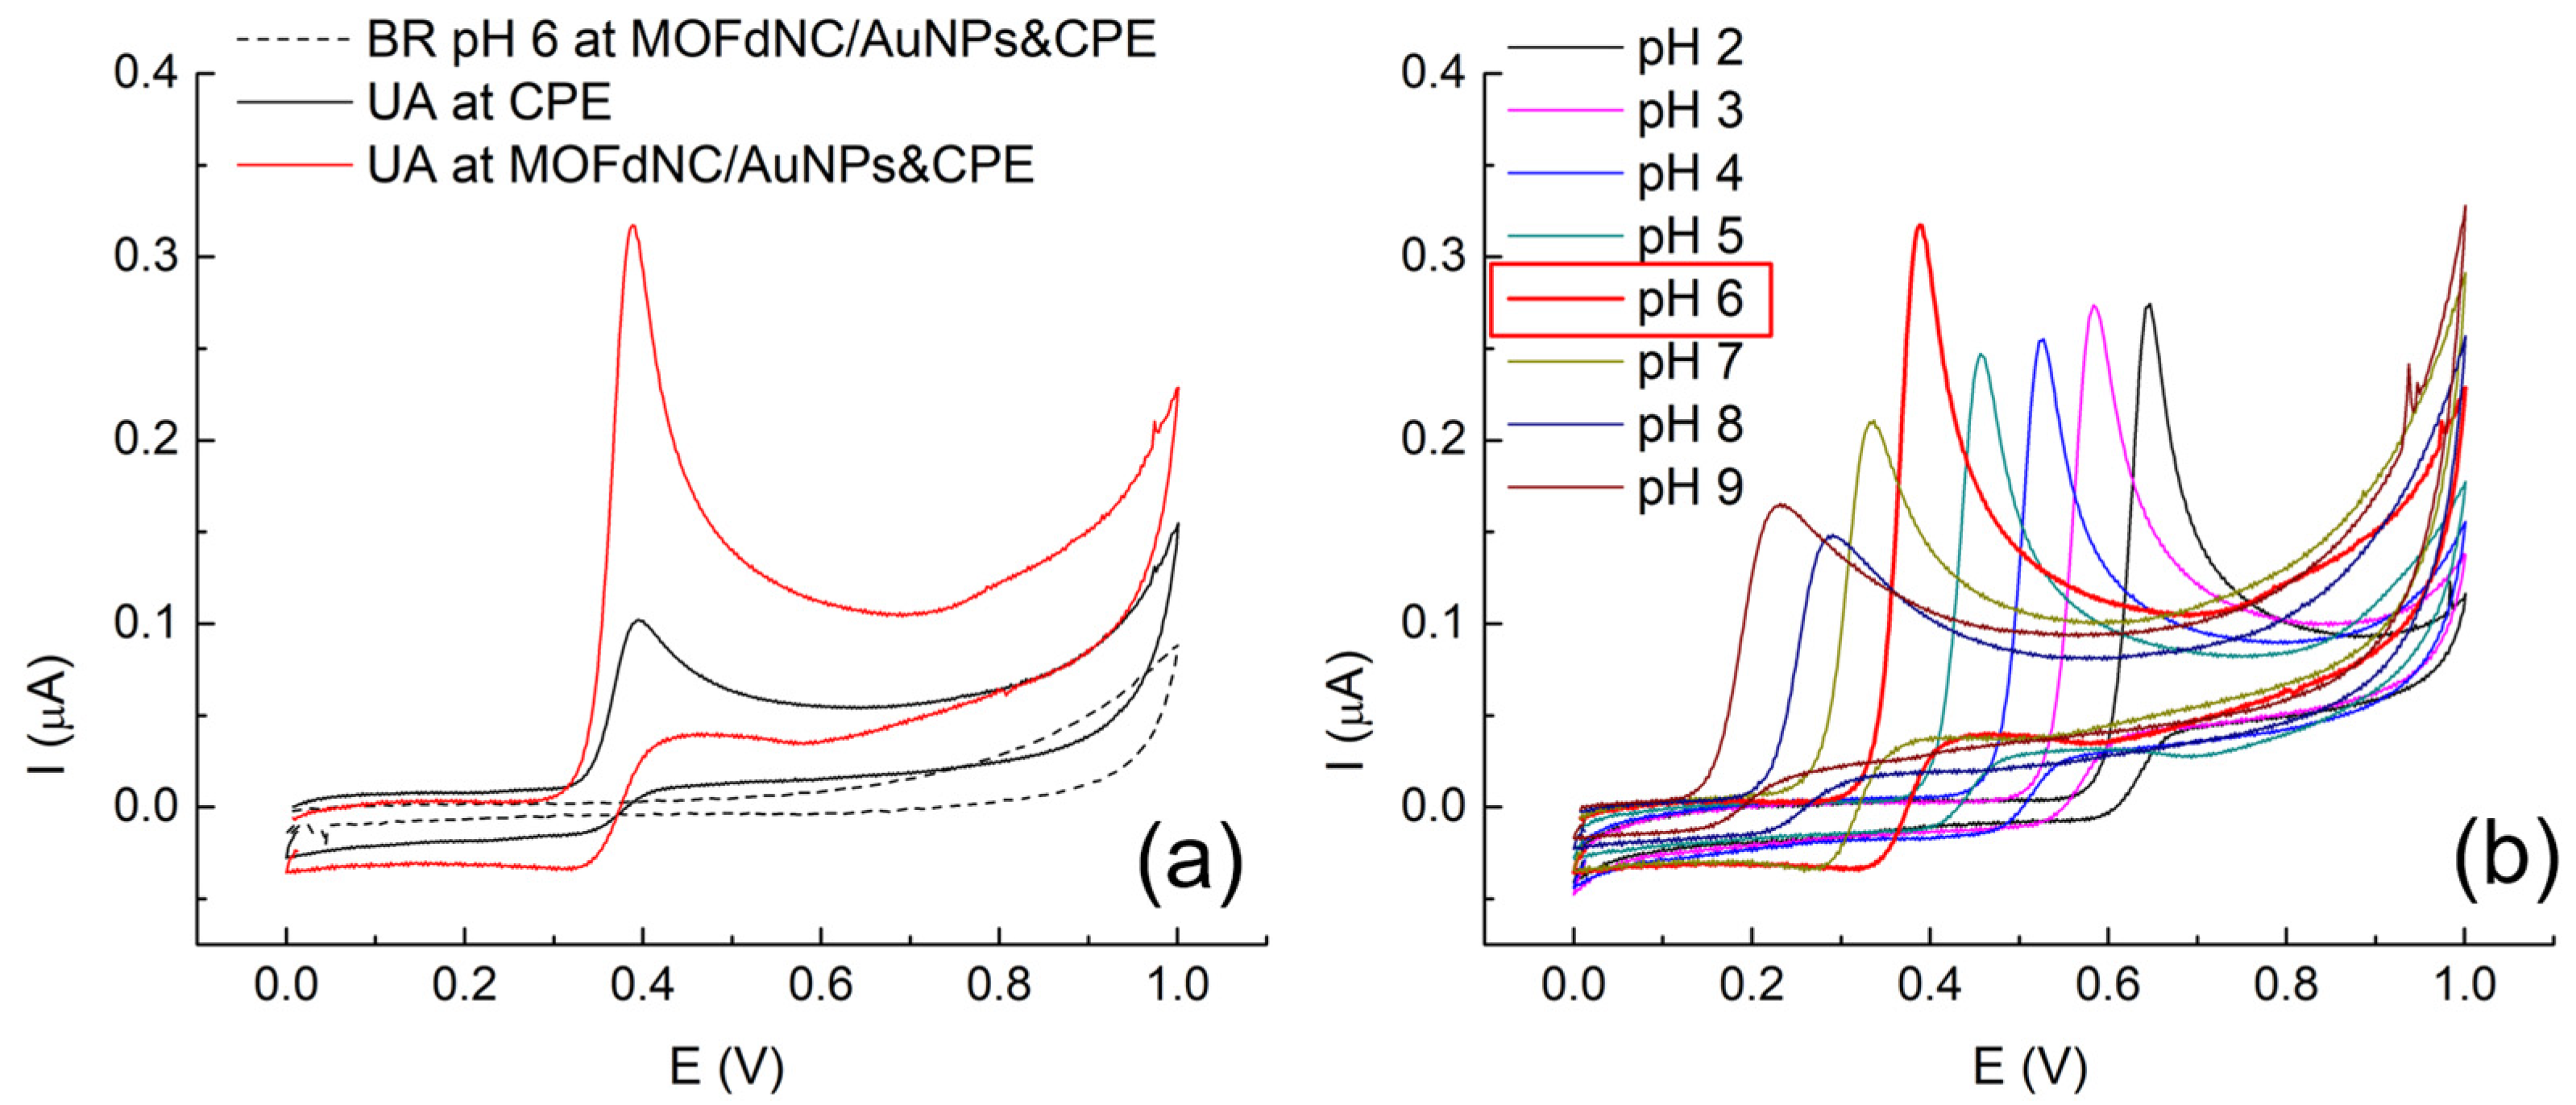
3.3. Electrochemical Behavior and Kinetics of UA over MOFdNC/AuNPs&CPE

Previous electrochemical studies confirmed that MOF-derived nanoceria functionalized with gold nanospheres facilitated the charge transfer and made the electrode area highly conductive, while further preliminary experiments showed that CPE modified with this binary composite is extremely sensitive to the presence of uric acid. As can be seen in Figure 3a, the peak current for determining 20 µM of UA at MOFdNC/AuNPs&CPE in BR buffer, pH 6, is about 3.7-fold higher, 0.32 µA, than it was recorded at pristine CPE, 9 µA. On both electrodes, the peak originating from UA oxidation is evidenced at about 0.39 V, and the electrode reaction can be considered irreversible because of the absence of a reduction peak. By changing the pH value of the BR buffer as a supporting electrolyte from 2 to 9, it was found that the peak current highly depends on pH, and protons are directly involved in the oxidation reaction of UA. The peak current is the highest at pH 6, and this pH value was chosen and kept constant in further experiments. Figure 3b shows that the peak potential shifts toward less positive potentials with increasing pH, and the linear relationship between Ep and pH was found with the following regression Equation (1):
Epa (V) = 0.75 − 0.058 pH (R = 0.993)
The slope of 58 mV/pH showed that the electrochemical oxidation of UA followed the Nernst equation. This suggests that the electrode process involved an equal number of protons and electrons included in the electrode reaction process (two protons and two electrons in the first step of the overall electrochemical reaction, which is in agreement with previous reports [15,36,37,38]). According to [39,40], the electro-oxidation pathway of uric acid occurred through the exchange of two protons and electrons and forming diamine in the transition state, which further successively absorbed two molecules of water to form imine-alcohol and uric acid-4,5-diol. In natural pH, this compound can be decomposed on allantoin and CO2. The proposed electrochemical reaction mechanism of UA oxidation is given in Figure 4.

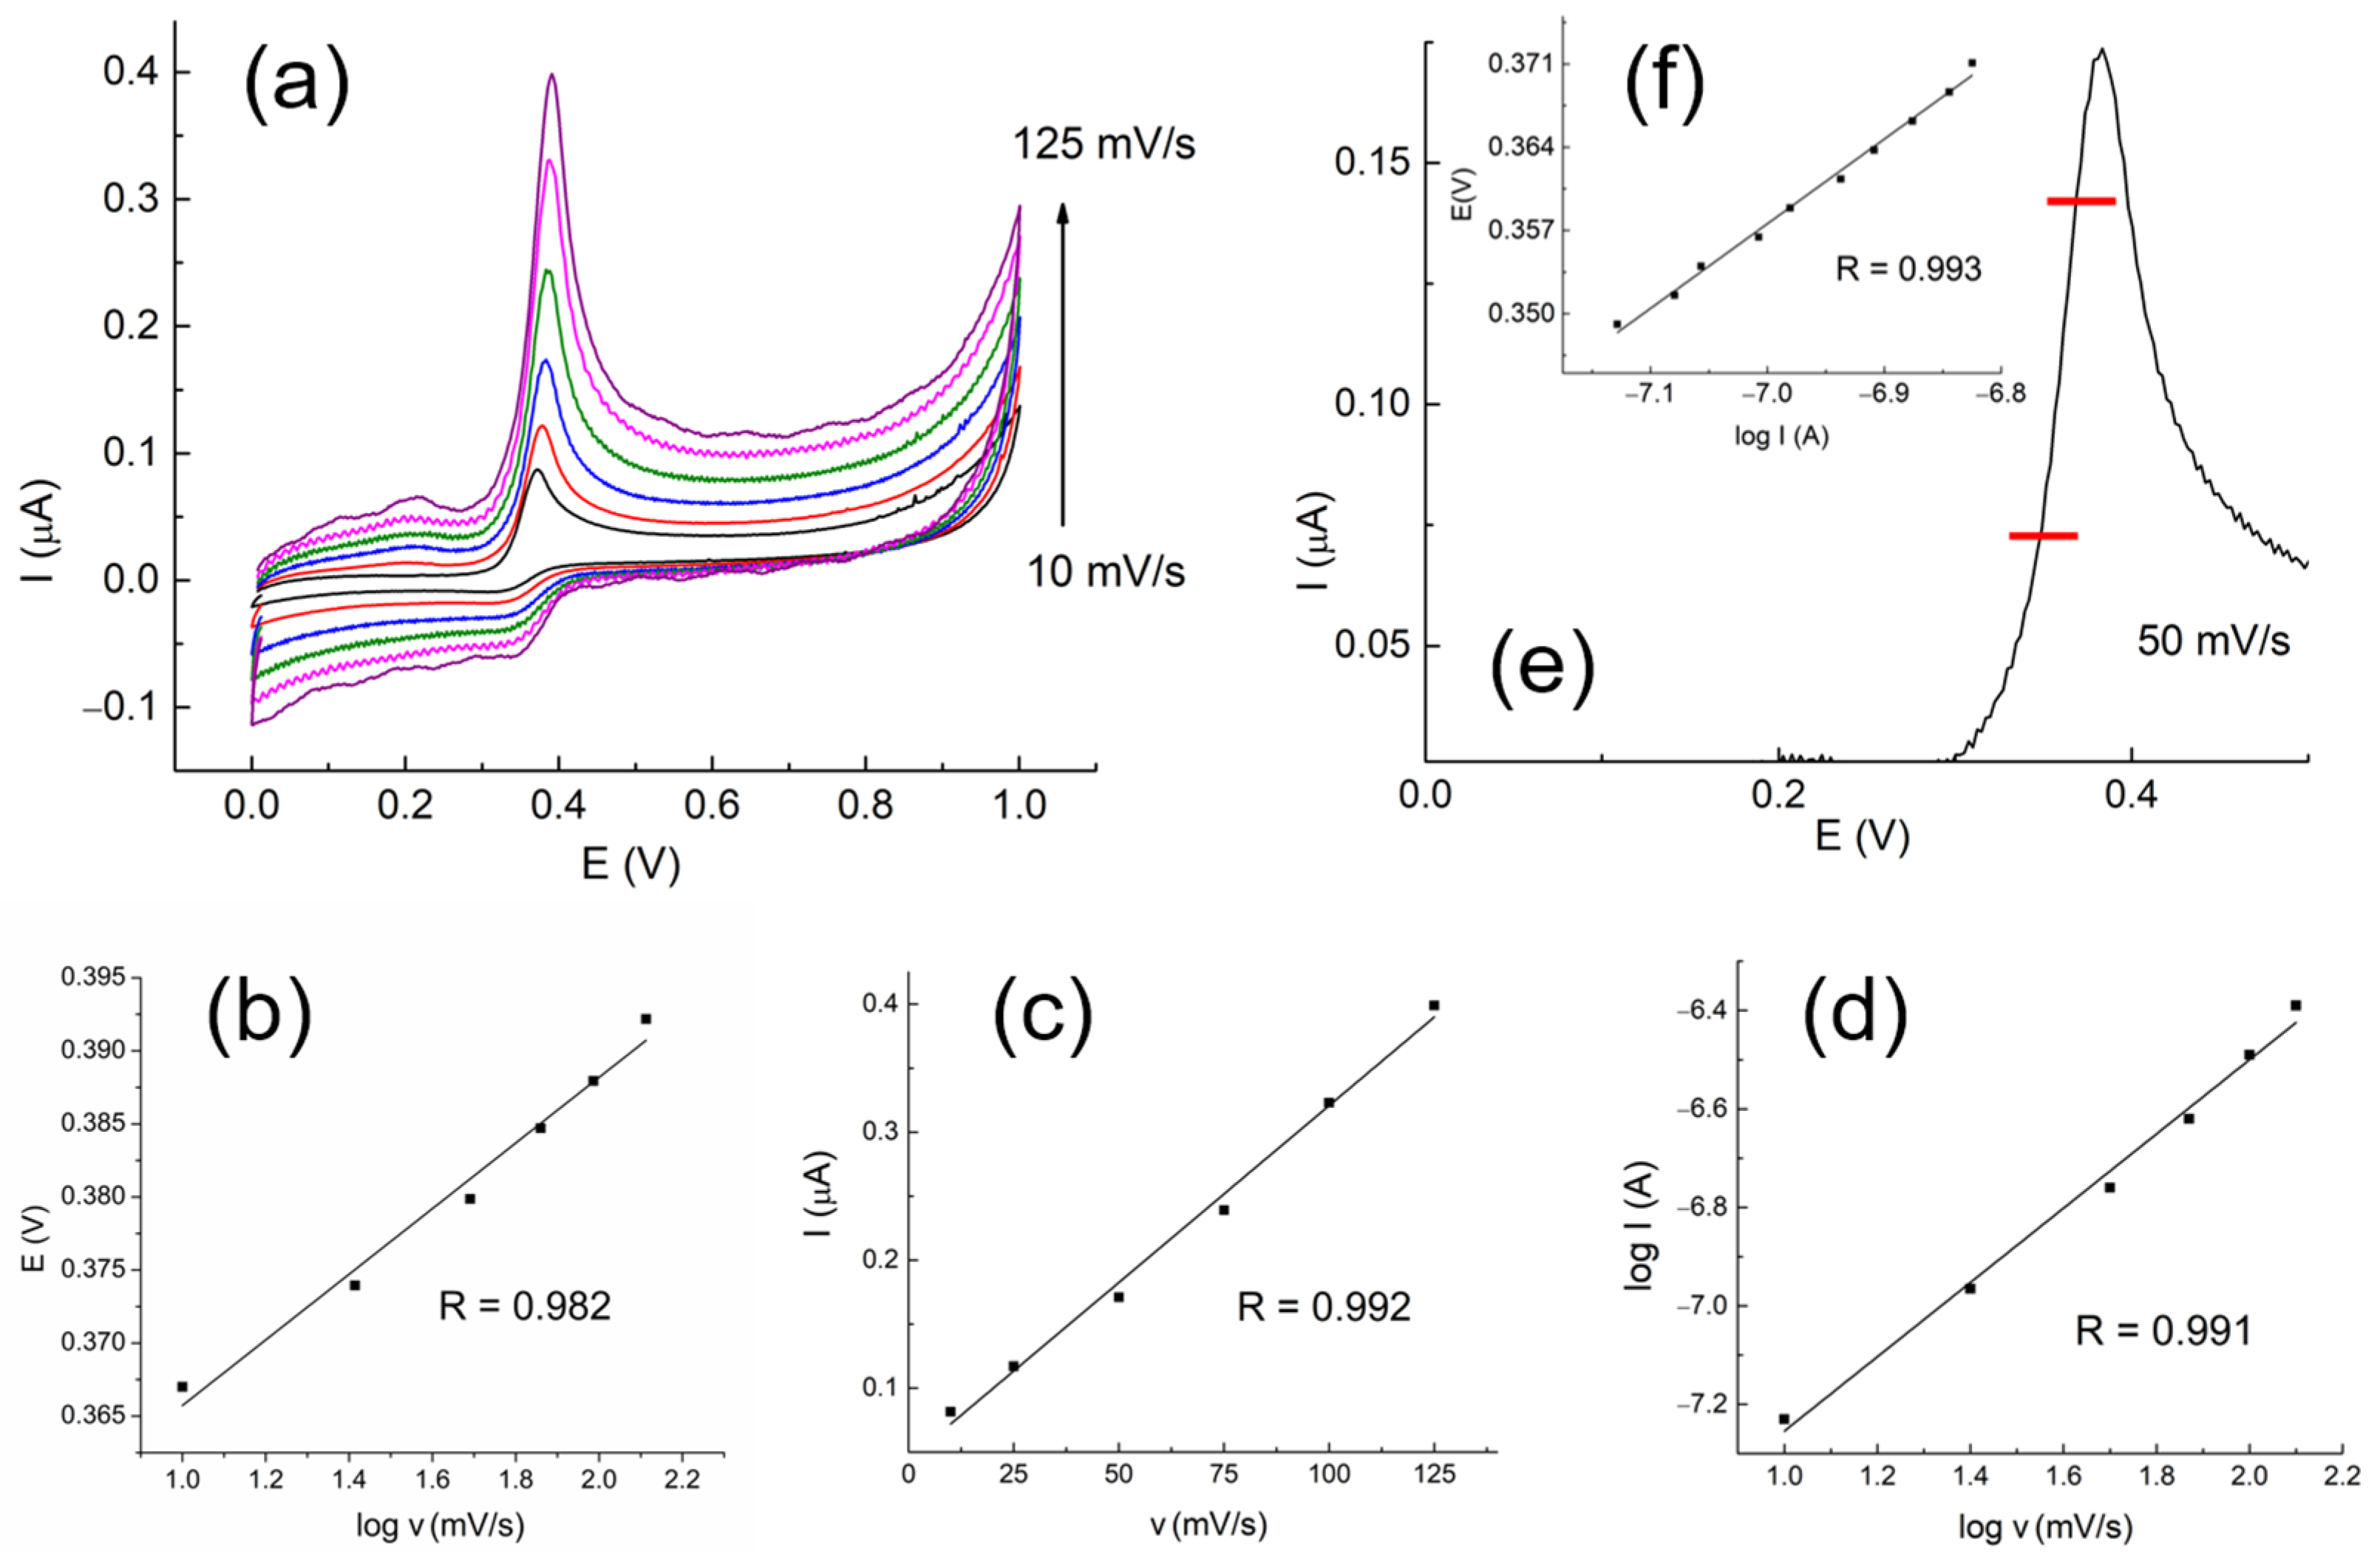
3.4. Effect of the Potential Scan Rate and Study of the Electrode Process

The oxidation mechanism at MOFdNC/AuNPs&CPE was examined by recording cyclic voltammograms of 20 µM of uric acid in BR buffer, pH 6, applying scan rates of 10, 15, 25, 50, 75, 100, and 125 mV/s (Figure 5a). In this figure, it is evident that the peak current increased with an increasing scan rate and the peak potential (Ep) was slightly shifted to positive potentials. The irreversibility of the reaction was confirmed by the linear plot of Ep vs. the logarithm of the scan rate (Figure 5b), described by regression equation Ep (V) = 0.336 + 0.025 log v (mV/s) (R = 0.990). The linear relationship between the peak current and scan rate is shown in Figure 5c, with the corresponding fitting equation I (A) = −4.43 × 10⁻⁸ + 2.76×10⁻⁹ × v (mV/s); (R = 0.992). This linearity between I and v indicated that an absorption-controlled process occurred at the electrode surface. The linear plot log I vs. log v, fitted by the formula log I (A) = − 8.01 + 0.81 × log v (V/s); (R = 0.991), is given in Figure 5d. The slope of 0.81 indicates the predominance of absorption over diffusion at the electrode surface, bearing in mind that the theoretical value for the fully absorption-controlled process is 1.0 [41].
The Tafel plot (Figure 5e) derived from the rising part points (between red marks on the graph) of the cyclic voltammogram of 20 µM of UA recorded at a scan rate of 50 mV/s (Figure 5d) was fitted by the equation E (V) = 0.071 log I (A) + 0.856 (R = 0.993). The Tafel slope of 71 mV is close to the theoretical value of 60 mV for two electrons involved in charge transfer in the reaction process of UA at MOFdNC/AuNPs&CPE, which is in correlation with the proposed electro-oxidation mechanism (Figure 4). The electron transfer coefficient (α) was calculated to be 0.61, and it was found when the slope of E vs. log I was equated to 2.3RT/Fn(1-α) [38] for the anodic reaction. In the given relation, R and F are the Gas and Faraday constant, T is absolute temperature, and n is the number of electrons. According to the Laviron theory for an adsorption-controlled and fully irreversible electrode process [42], Ep is defined by the following Equation (2):
E p = E 0 + 2.303 R T α n F l o g R T k 0 α n F + 2.303 R T α n F l o g v
The value of the formal potential E0 of 0.370 V was obtained from the intercept of Ep vs. v by extrapolation of the vertical axis to v = 0 mV/s. Thus, using the Laviron equation, the standard heterogeneous rate constant of the reaction, k0, was calculated to be 1.39 × 10³ s−1. These results may be attributed to the good electrical conductivity and large electrode surface area of the used MOF-derived CeO2 nanoparticles functionalized with gold nanospheres, which synergistically accelerate the electron transfer process between the UA molecules and proposed modified CPE.

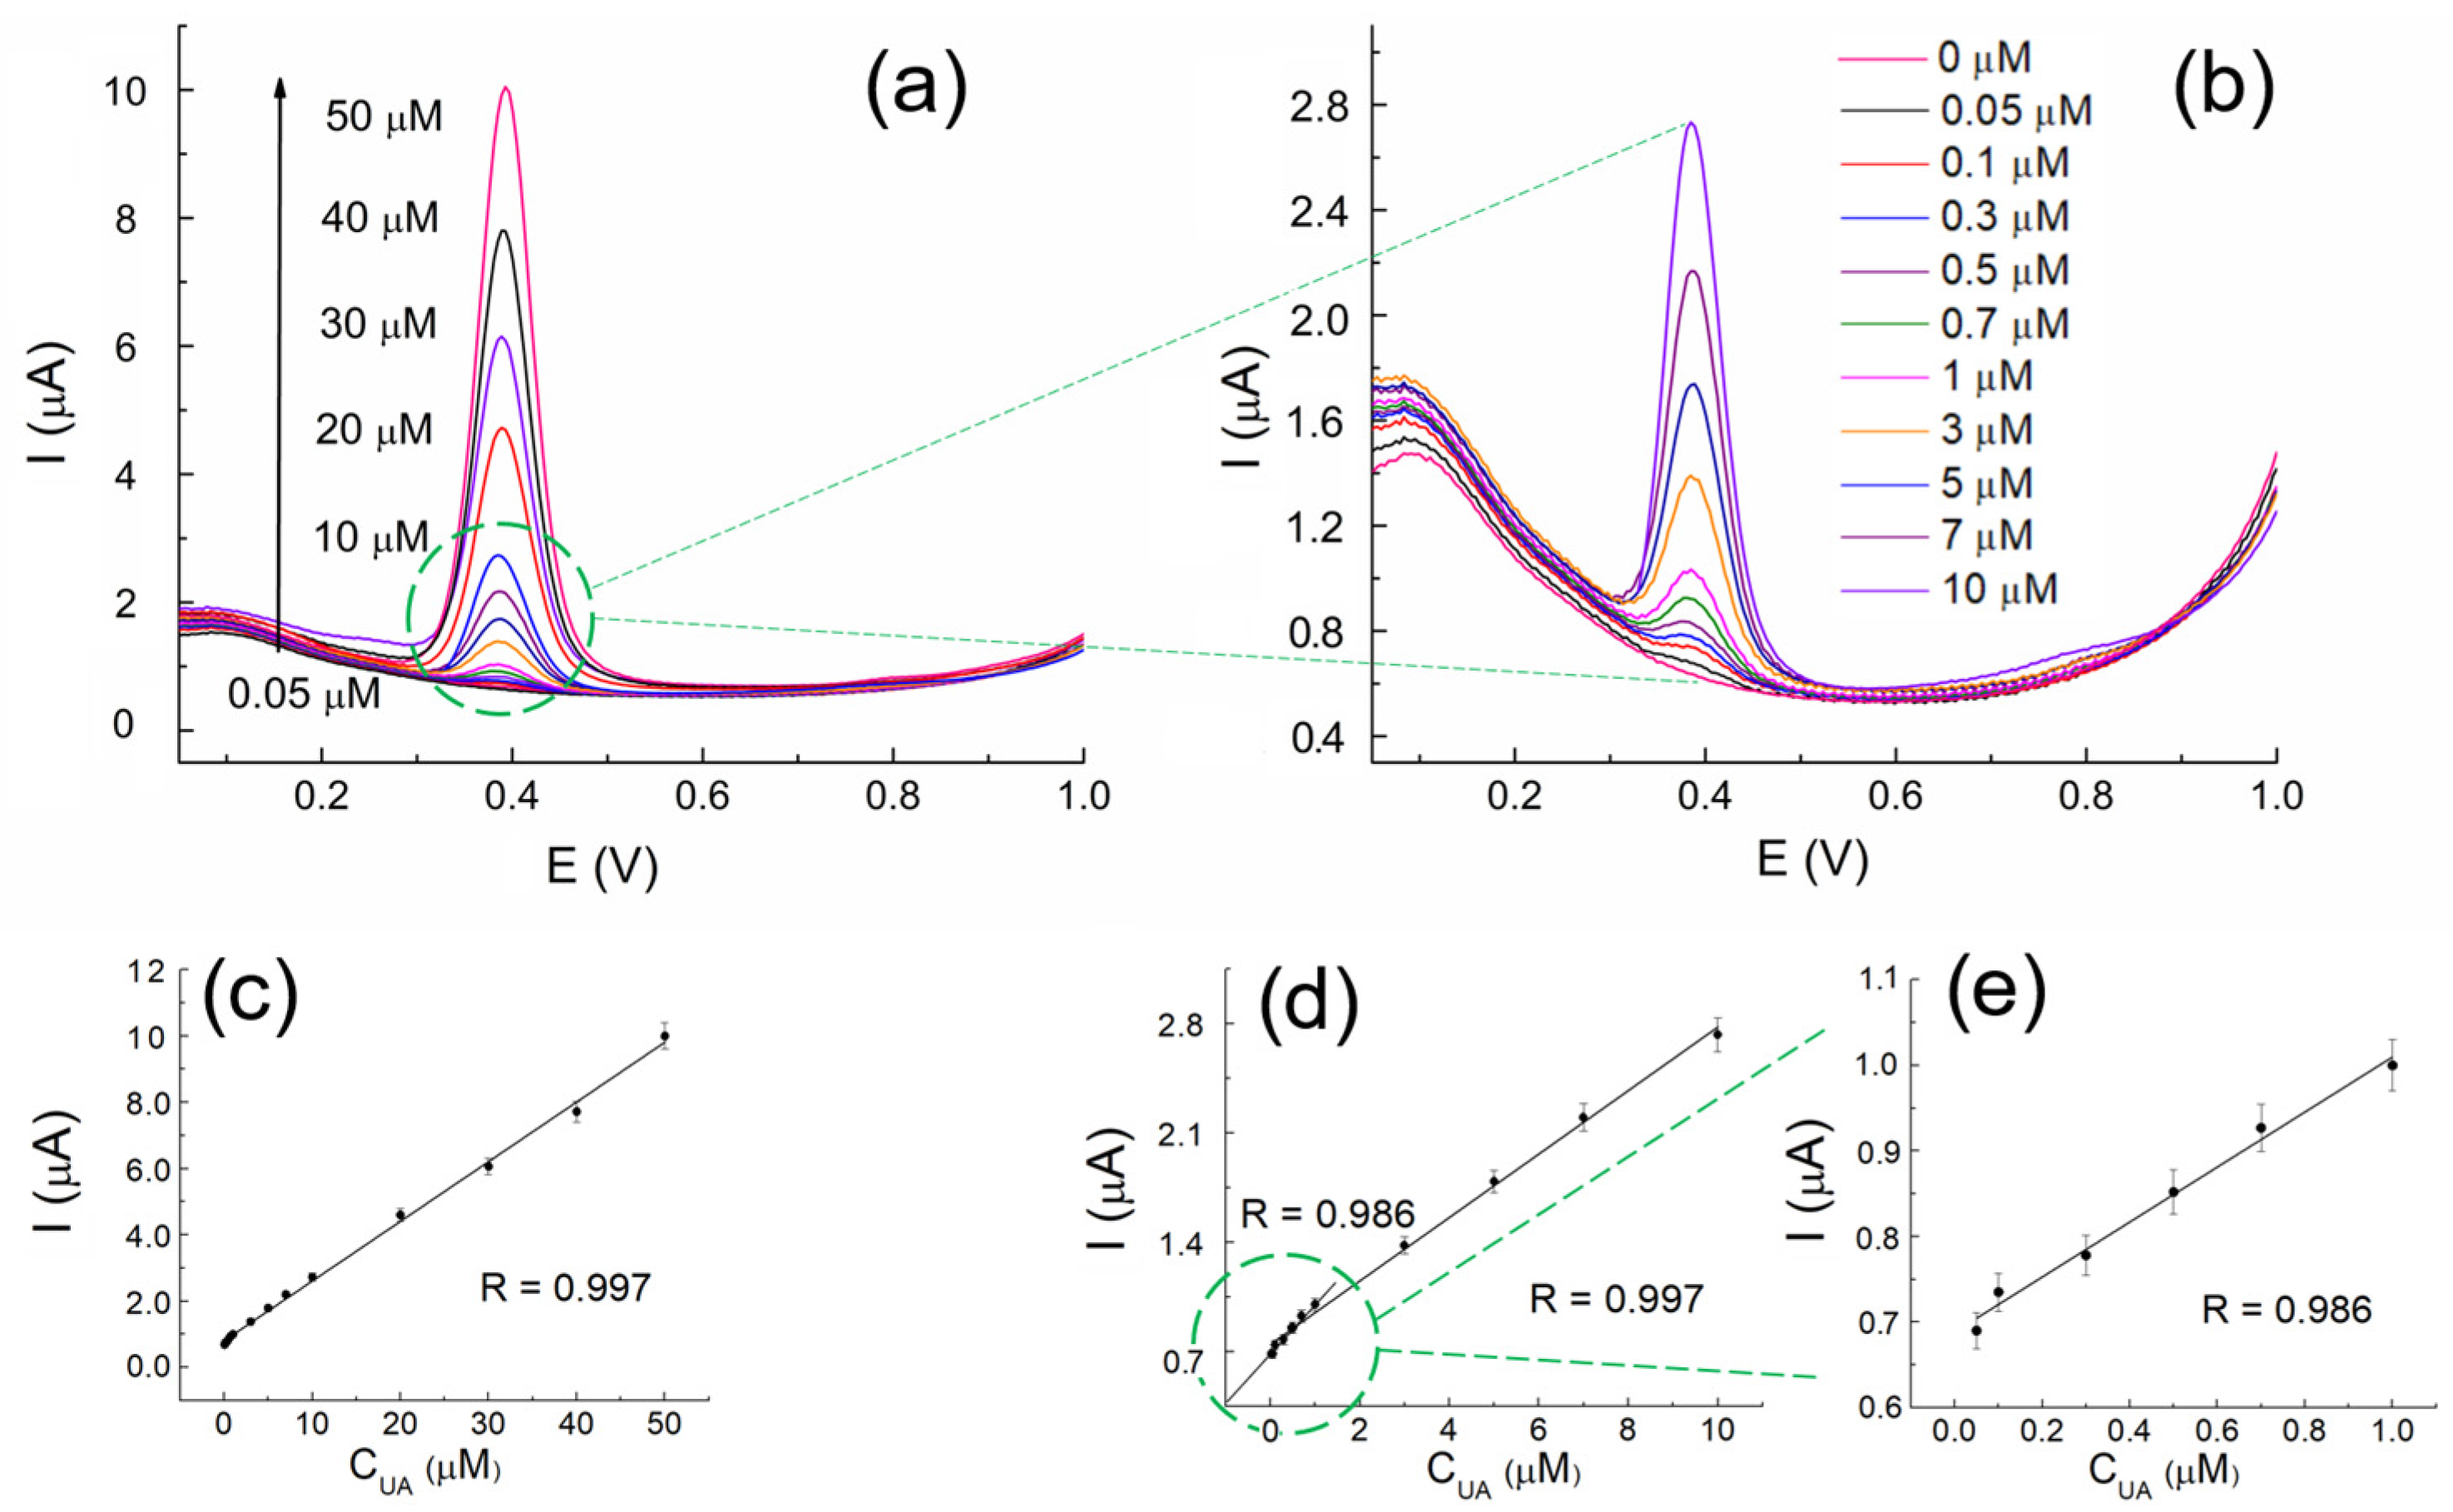
3.5. Quantification of UA at MOFdNC/AuNPs&CPE

The development of an analytical procedure for the determination of uric acid at MOFdNC/AuNPs&CPE in optimal pH 6 was the next step. The comparison between two highly sensitive analytical electrochemical pulse techniques (differential pulse and square wave voltammetry in Figure S2) showed that the SWV proved to be a more suitable technique for the quantification of UA because of the almost 3-fold higher electrochemical response in the presence of this compound. The optimization of SWV parameters was completed by varying each of the examined experimental parameters systematically while the others were kept constant. The pulse amplitude was changed in the range from 10 to 50 mV, the square-wave frequency was varied from 10 to 90 Hz, and the influence of the potential step was examined from 2 to 8 mV. In further experiments, an amplitude of 40 mV, a frequency of 80 Hz, and a potential step of 4 mV were chosen and used in the quantification of UA.
Under the optimized experimental conditions and parameters of the technique (Figure S3), the SW voltammograms of different concentrations (0, 0.05, 0.1, 0.3, 0.5, 0.7, 1, 3, 5, 7, 10, 20, 30, 40, 50 µM) of uric acid were recorded at the proposed modified electrode and voltammetric profiles of whole investigated range (Figure 6a,b). The linearity of the data was observed for the range of higher concentrations from 1 to 50 µM and for the range of lower concentrations from 0,05 to 1 µM. The corresponding calibration curves are given below for SWVs (Figure 6c,d), while in Figure 6e, the lower concentration range is presented in better resolution. The distinct oxidation peak was recorded at 0.39 V with a proportional increase in the current response as the concentration of uric acid increased, and it was applied for quantitative determination. At the same time, no changes in the peak potentials were observed, additionally confirming excellent electrocatalytic performances of the proposed sensor. The equations that describe linearity in calibration curves are as follows:
I (µA) = 0.688 + 0.321 × CUA (µM); R = 0.986, for concentration range from 0.05 to 1 µM;
I (µA) = 0.805 + 0.180 × CUA (µM); R = 0.997, for concentration range from 1 to 50 µM.
The correlation coefficient R shows a high correlation between the corresponding linear relationship and the data for both concentration ranges.
The limit of the detection (LOD) was calculated from the formula LOD = 3 s/m, where s is the standard deviation of the blank solution (S/N = 3) and m is the slope of the calibration curve (for a range of lower concentrations). The LOD for the proposed UA determination at MOFdNC/AuNPs&CPE amounts to 0.011 µM, and based on this result and the width of the working range, the developed analytical procedure on the proposed sensor represents one of the electrochemical methods with the highest sensitivity for uric acid. In Table 1, previously reported electrochemical sensors are compared to this one in terms of concentration range and LOD. When considering the upper limit of the working range of concentrations, the low solubility of uric acid in water of 6 mg/100 mL should be kept in mind, which corresponds to 360 µM.
Electrochemical sensors based on CeO2 NPs have been commonly used to determine uric acid, as seen in Table 1. It is interesting to mention that even Ce salt was used to dope Zn-MOF to fabricate a highly sensitive sensor for UA [46]. This sensor deposited uric acid on the surface of the electrode modifier, and contrary to other electrochemical sensors, the addition of UA led to a decrease in the peak current. The absorption of UA at the electrode surface of our electrode was also found to be dominant in the electro-oxidation process. In a previous study, CeO2 NPs in combination with gold were also investigated by depositing 3D nanoclusters (Au NCs) on a CeO2 NP-modified Ti substrate, which was used for the simultaneous electrochemical detection of dopamine and uric acid [25]. The authors suggested the application of this electrode for DPV and the amperometric detection of DA in the presence of UA because the application of UA makes the proposed determination much more sensitive. Nevertheless, amperometric detection at this electrode did not show any signal for UA in the range of 1–100 µM. In this work, we suggest a combination of nanoceria and commercially available Au NPs, which makes it much easier to prepare sensors with improved analytical performances in terms of the working range and detection limit compared with nanoceria-based and other reported electrodes.
From the perspective of the application, the reproducibility of the proposed sensor was examined by repeating seven SWV measurements of 0.3 and 1 µM UA under the same conditions. The value of the relative standard deviation (RSD) of the response currents was 3.4% and 4.2%, respectively. Five MOFdNC/AuNPs&CPE were prepared in the same way, and the same conditions demonstrated an RSD of 4.4% for the peak current obtained by recording 1.5 µM of UA. The stability of MOFdNC/AuNPs&CPE was also studied by measuring the electrochemical response after 10 and 30 days. The results showed excellent stability of this sensor as there was no significant change in the peak current after 10 days of storage, while after 30 days of storage, the current remained at 79.2% compared with the initial value. Based on the obtained analytical and statistical parameters, CeO2 nanoparticles prepared by calcination of CeBTC MOF and functionalized with gold nanospheres incorporated in a carbon paste matrix provided a highly sensitive, repeatable, and reproducible platform for UA quantification.

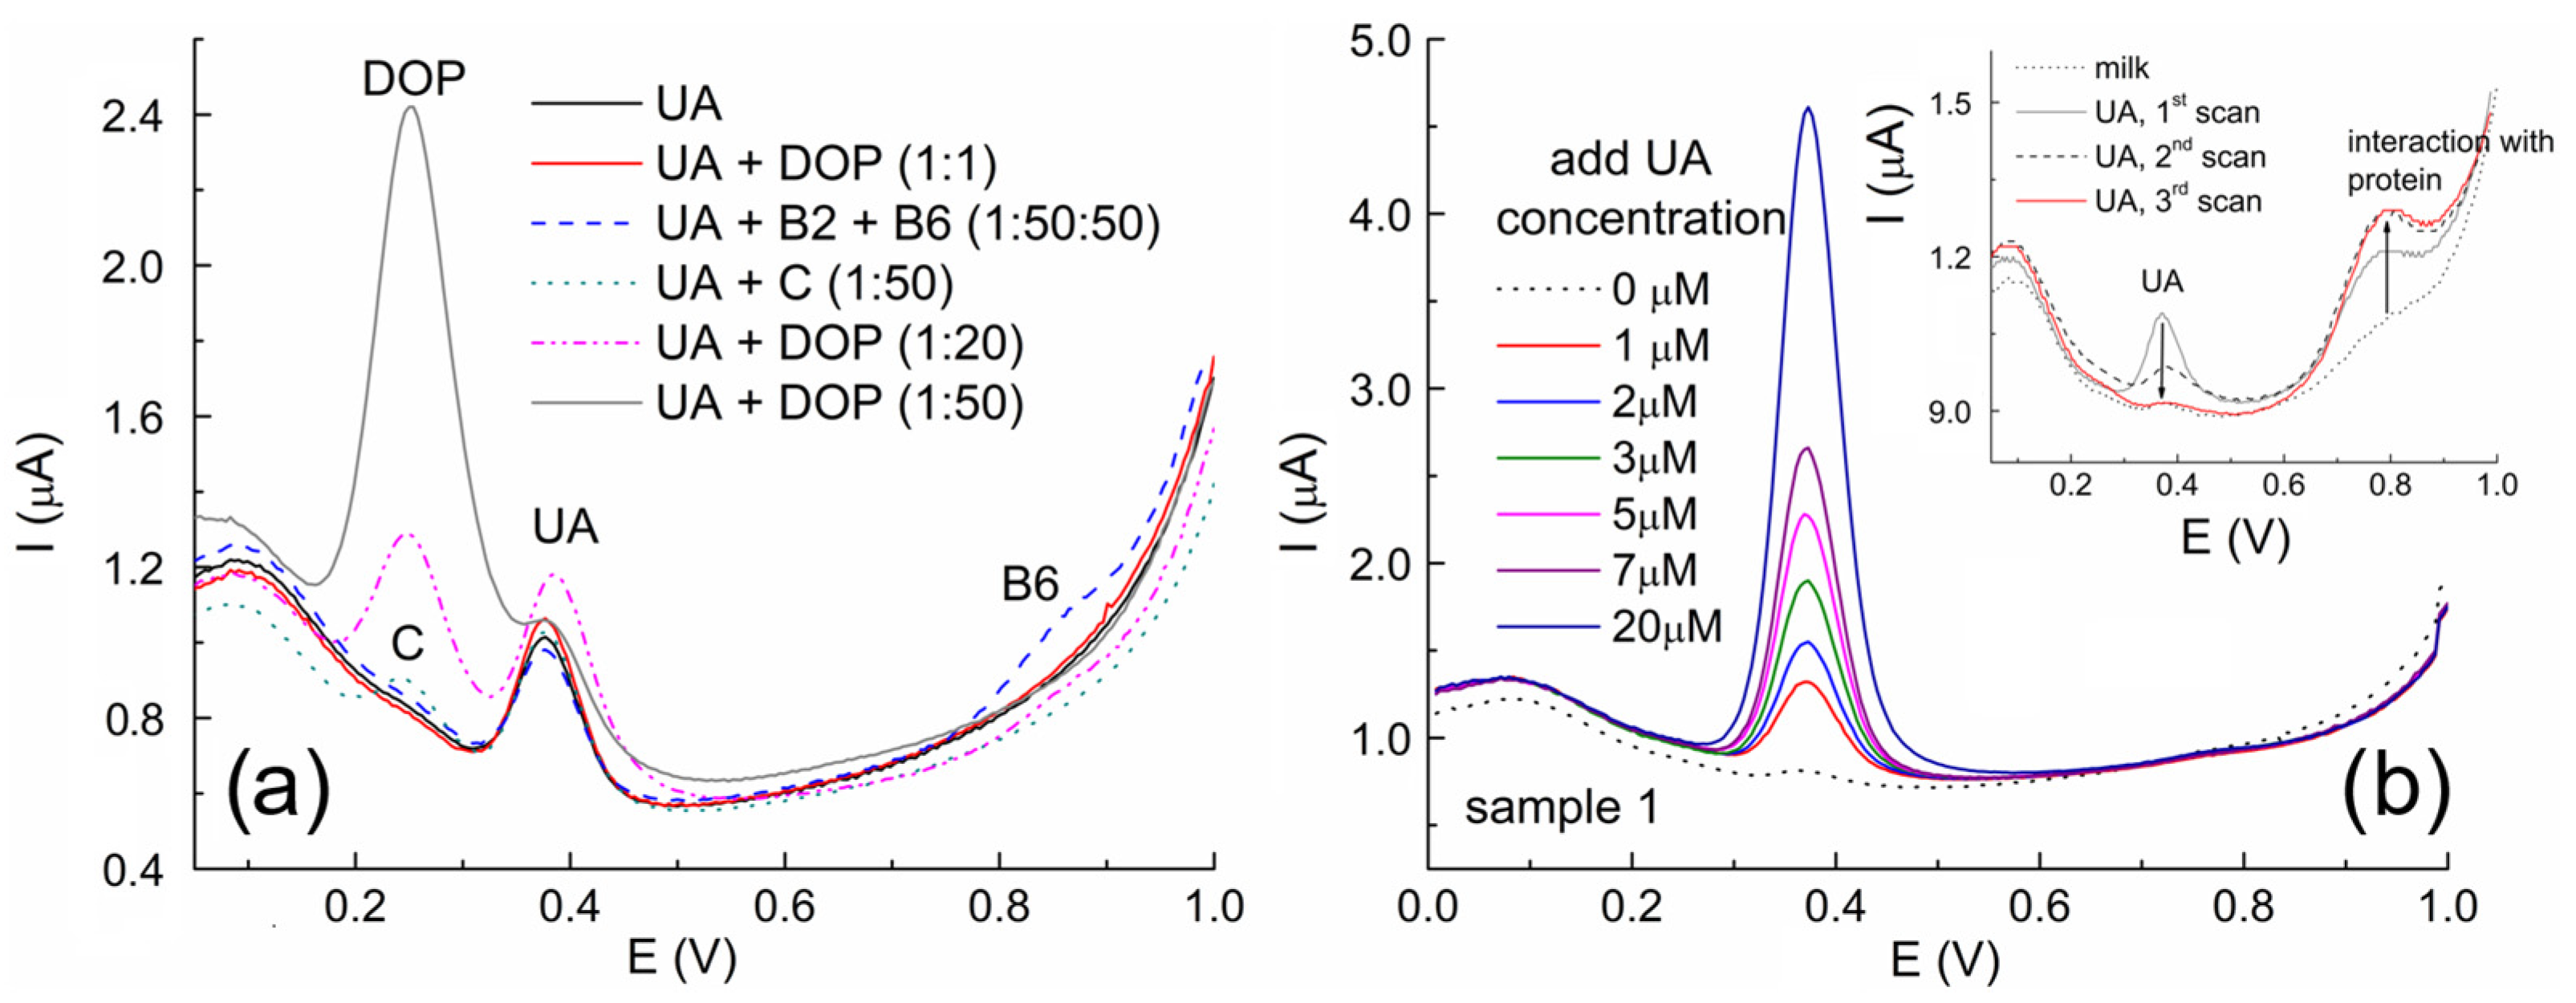
3.6. Interference Studies and Milk Sample Analysis

Next, measurements were performed to determine how the presence of various inorganic ions and bioactive compounds influenced the results of uric acid analysis at MOFdNC/AuNPs&CPE. The tolerance limit for interfering species was considered as the maximum concentration of foreign species that caused a relative error of less than ±5% for the determination of 1 μM of UA under the optimized conditions. First, selectivity over antioxidants and compounds that can usually be found with uric acid in body fluids (vitamins C, B6, B12, and dopamine-DOP) was studied. Figure 7a reveals that the electrochemical response to dopamine at this sensor is higher than the responses to the investigated vitamins, but in a ratio of 1:1 with UA, there is no peak for DOP. There is no interfering effect on the current response of a 1 μM concentration of UA when much higher concentrations (50-fold higher) of all these biocompounds were added simultaneously in the UA test solution.
Although this selectivity study suggested the possibility of the successful determination of UA in body fluids by the proposed sensor, we decided to investigate the possibility of applying this sensor in the milk sample because electrochemical UA sensors are rarely used in these samples [6,8,47,48]. Uric acid is one of the main antioxidant biomarkers found in milk [49], and the concentration of this compound was found to be connected with milk spoilage [6]. First, the interfering effect of some ions and biocompounds that can be found in milk was investigated. According to the results obtained, fructose, glucose, lactose, citric acid, folic acid, and Mg2+, Na+, Ca2+, NH4+, F, Cl, SO42−, and NO3 in 100-fold excess also did not interfere with the determination of uric acid, suggesting the possibility of successful analysis of milk samples. Two samples of pasteurized milk were investigated by the developed analytical procedure and sensor. Figure 7b shows the SWV of prepared milk sample 1 (S1) in BR buffer at pH 6 and the SWVs of the samples prepared with spiking. As can be seen in the inset graph, determining UA concentration by spiking an unprepared milk sample was impossible because of the interaction between the added UA and the proteins present in milk, as they can reduce the concentration of uric acid [50]. The peak current proportional to the concentration of UA decreased with the addition of UA and repeated measurements with the same concentration, while the peak at 0.8 V increased rapidly. After removing the protein fraction (Section 2.5), the determination of UA in the treated milk samples was successfully performed and correlated with comparative spectrophotometric measurements (Table 2).
Finally, 100 μM of prepared milk samples were analyzed by the SWV technique in BR buffer at pH 6, and the results indicated the low effect of the tested solution matrix in this condition. The unknown UA concentration in milk was calculated from the calibration curve. The final analyte concentration in the pasteurized milk samples, calculated taking into account a 200-fold dilution, is 82 μM and 88 μM, respectively. The obtained results are summarized in Table 2 (the determination of UA in treated milk sample 2 is shown in Figure S4).

4. Conclusions

In this study, functional nanostructured CeO2 obtained by calcination of MOF in air conditions and CeO2 NPs prepared by the solvothermal method were compared based on their structural, morphological, and electrochemical properties. MOF-derived CeO2 nanoparticles obtained by thermolysis proved themselves to be a suitable electrochemical sensor modifier, especially when they are functionalized with commercially available gold nanospheres. This binary nanocomposite, incorporated in a carbon paste electrode, represents an easily prepared, eco-friendly electrochemical platform with excellent electro-catalytic activity for the highly sensitive determination of uric acid. The developed analytical method based on this electrode material is distinguished by a wide linear range, higher sensitivity, and one of the lowest LODs for the detection of uric acid among the electrochemical sensors that have been reported until now. This combination of high conductivity, catalytic activity, redox mediation, and stability makes the proposed MOF-derived CeO2/AuNPs sensor an effective electrode modifier for the sensitive and selective electrochemical detection of uric acid. Moreover, good results were obtained in the analysis of milk samples, proving the great practical applicability potential of this modified electrode.

Supplementary Materials

The following supporting information can be downloaded at https://www.mdpi.com/article/10.3390/chemosensors12110231/s1: Figure S1: (a) X-ray powder diffraction pattern of CeBTC; (b) FT-IR spectra of CeBTC and c-e) SEM micrographs of CeBTC at different magnifications; Figure S2: A comparation of UA responses differential pulse voltammetry (DPV) and square wave voltammetry (SWV); Figure S3: Optimization of SWV method: (a) selection of the best modulation amplitude; (b) Frequency selection and (c) Scan rate selection; Figure S4: Determination of UA in treated milk sample 2.

Author Contributions

Conceptualization, M.O., V.G., M.M. and B.B.P.; methodology, M.O., M.M., D.M.S. and B.B.P.; validation, V.N.; formal analysis, M.O., M.M.; V.G., D.M.S. and B.B.P.; investigation, M.O., M.M., V.G., D.M.S. and B.B.P.; resources, S.V.-Đ.; writing—original draft preparation, M.O., D.M.S. and B.B.P.; writing—review and editing, M.O., M.M., D.M.S. and B.B.P.; supervision, M.O. and B.B.P. All authors have read and agreed to the published version of the manuscript.

Funding

Financial support for this study was granted by the Ministry of Education, Science and Technological Development of the Republic of Serbia, Grant Nos. 451-03-65/2024-03/200123 and 451-03-66/2024-03/200168, and the Faculty of Sciences and Mathematics, University of Priština in Kosovska Mitrovica, Project Number IJ-2301.

Institutional Review Board Statement

Not applicable.

Informed Consent Statement

Not applicable.

Data Availability Statement

The data presented in this study are available on request from the corresponding author.

Acknowledgments

The authors thank Djordje Veljović for the SEM measurements.

Conflicts of Interest

The authors declare no conflicts of interest.

References

  1. Scheele, K.W. Examen Chemicum Calculi Urinarii. Opuscula 1776, 2, 1776. [Google Scholar]
  2. Dalbeth, N.; Merriman, T.R.; Stamp, L.K. Gout. Lancet 2016, 388, 2039–2052. [Google Scholar] [CrossRef] [PubMed]
  3. Jin, M. Uric Acid, Hyperuricemia and Vascular Diseases. Front. Biosci. 2012, 17, 656. [Google Scholar] [CrossRef] [PubMed]
  4. Aihemaitijiang, S.; Zhang, Y.; Zhang, L.; Yang, J.; Ye, C.; Halimulati, M.; Zhang, W.; Zhang, Z. The Association between Purine-Rich Food Intake and Hyperuricemia: A Cross-Sectional Study in Chinese Adult Residents. Nutrients 2020, 12, 3835. [Google Scholar] [CrossRef]
  5. El Ridi, R.; Tallima, H. Physiological Functions and Pathogenic Potential of Uric Acid: A Review. J. Adv. Res. 2017, 8, 487–493. [Google Scholar] [CrossRef]
  6. Khamzina, E.; Bukharinova, M.; Stozhko, N. Uric Acid as a Marker of Milk Microbiological Spoilage. BIO Web Conf. 2023, 76, 02001. [Google Scholar] [CrossRef]
  7. Zuo, R.; Zhou, S.; Zuo, Y.; Deng, Y. Determination of Creatinine, Uric and Ascorbic Acid in Bovine Milk and Orange Juice by Hydrophilic Interaction HPLC. Food Chem. 2015, 182, 242–245. [Google Scholar] [CrossRef]
  8. Motshakeri, M.; Phillips, A.R.J.; Kilmartin, P.A. Application of Cyclic Voltammetry to Analyse Uric Acid and Reducing Agents in Commercial Milks. Food Chem. 2019, 293, 23–31. [Google Scholar] [CrossRef]
  9. Wang, Q.; Wen, X.; Kong, J. Recent Progress on Uric Acid Detection: A Review. Crit. Rev. Anal. Chem. 2020, 50, 359–375. [Google Scholar] [CrossRef]
  10. Chen, X.; Wu, G.; Cai, Z.; Oyama, M.; Chen, X. Advances in Enzyme-Free Electrochemical Sensors for Hydrogen Peroxide, Glucose, and Uric Acid. Microchim. Acta 2014, 181, 689–705. [Google Scholar] [CrossRef]
  11. Sun, M.; Cui, C.; Chen, H.; Wang, D.; Zhang, W.; Guo, W. Enzymatic and Non-Enzymatic Uric Acid Electrochemical Biosensors: A Review. ChemPlusChem 2023, 88, e202300262. [Google Scholar] [CrossRef] [PubMed]
  12. Knežević, S.; Ognjanović, M.; Nedić, N.; Mariano, J.F.M.L.; Milanović, Z.; Petković, B.; Antić, B.; Djurić, S.V.; Stanković, D. A Single Drop Histamine Sensor Based on AuNPs/MnO2 Modified Screen-Printed Electrode. Microchem. J. 2020, 155, 104778. [Google Scholar] [CrossRef]
  13. Stanković, D.M.; Ognjanović, M.; Fabián, M.; Avdin, V.V.; Manojlović, D.D.; Đurić, S.V.; Petković, B.B. CeO2-Doped—Domestic Carbon Material Decorated with MWCNT as an Efficient Green Sensing Platform for Electrooxidation of Dopamine. Surf. Interfaces 2021, 25, 101211. [Google Scholar] [CrossRef]
  14. Tharani, D.S.; Sivasubramanian, R. CeO2 Nanocubes-Based Electrochemical Sensor for the Selective and Simultaneous Determination of Dopamine in the Presence of Uric Acid and Ascorbic Acid. J. Chem. Sci. 2023, 135, 93. [Google Scholar] [CrossRef]
  15. Hashemzaei, Z.; Saravani, H.; Sharifitabar, M.; Shahbakhsh, M. Combustion Synthesis of Sponge-like CeO2 Powder for Selective Determination of Uric Acid in Biological Fluids. J. Part. Sci. Technol. 2021, 7, 73–82. [Google Scholar] [CrossRef]
  16. Zhang, Y.; Yan, X.; Chen, Y.; Deng, D.; He, H.; Lei, Y.; Luo, L. ZnO-CeO2 Hollow Nanospheres for Selective Determination of Dopamine and Uric Acid. Molecules 2024, 29, 1786. [Google Scholar] [CrossRef]
  17. Lavanya, N.; Sekar, C.; Murugan, R.; Ravi, G. An Ultrasensitive Electrochemical Sensor for Simultaneous Determination of Xanthine, Hypoxanthine and Uric Acid Based on Co Doped CeO2 Nanoparticles. Mater. Sci. Eng. C 2016, 65, 278–286. [Google Scholar] [CrossRef]
  18. Temerk, Y.; Ibrahim, H. A New Sensor Based on In Doped CeO2 Nanoparticles Modified Glassy Carbon Paste Electrode for Sensitive Determination of Uric Acid in Biological Fluids. Sens. Actuators B Chem. 2016, 224, 868–877. [Google Scholar] [CrossRef]
  19. Petrucci, R.; Bortolami, M.; Di Matteo, P.; Curulli, A. Gold Nanomaterials-Based Electrochemical Sensors and Biosensors for Phenolic Antioxidants Detection: Recent Advances. Nanomaterials 2022, 12, 959. [Google Scholar] [CrossRef]
  20. Xiao, T.; Huang, J.; Wang, D.; Meng, T.; Yang, X. Au and Au-Based Nanomaterials: Synthesis and Recent Progress in Electrochemical Sensor Applications. Talanta 2020, 206, 120210. [Google Scholar] [CrossRef]
  21. Centeno, M.; Ramírez Reina, T.; Ivanova, S.; Laguna, O.; Odriozola, J. Au/CeO2 Catalysts: Structure and CO Oxidation Activity. Catalysts 2016, 6, 158. [Google Scholar] [CrossRef]
  22. Huang, P.; Chen, G.; Jiang, Z.; Jin, R.; Zhu, Y.; Sun, Y. Atomically Precise Au25 Superatoms Immobilized on CeO2 Nanorods for Styrene Oxidation. Nanoscale 2013, 5, 3668. [Google Scholar] [CrossRef] [PubMed]
  23. Jiao, Y.; Li, N.; Yu, H.; Li, W.; Zhao, J.; Li, X.; Zhang, X. Fabrication of Strawberry-like Au@CeO2 Nanoparticles with Enhanced Catalytic Activity by Assembly of Block Copolymer Composite Micelles. RSC Adv. 2017, 7, 662–668. [Google Scholar] [CrossRef]
  24. Tang, H.; Ang Chen, Z.; Wu, M.; Li, S.; Ye, Z.; Zhi, M. Au-CeO2 Composite Aerogels with Tunable Au Nanoparticle Sizes as Plasmonic Photocatalysts for CO2 Reduction. J. Colloid Interface Sci. 2024, 653, 316–326. [Google Scholar] [CrossRef]
  25. Palanisamy, S. Simultaneous Electrochemical Detection of Dopamine and Uric Acid over Ceria Supported Three Dimensional Gold Nanoclusters. Mater. Res. Express 2014, 1, 045020. [Google Scholar] [CrossRef]
  26. Yusuf, V.F.; Malek, N.I.; Kailasa, S.K. Review on Metal–Organic Framework Classification, Synthetic Approaches, and Influencing Factors: Applications in Energy, Drug Delivery, and Wastewater Treatment. ACS Omega 2022, 7, 44507–44531. [Google Scholar] [CrossRef]
  27. Ma, J.; Fan, L.; Wang, X.; Li, L.; Zhang, Y.; Zhao, G.; Chai, B.; Gao, J. Defect Engineering on Metal-Organic Frameworks for Enhanced Photocatalytic Reduction of Cr(VI). Surf. Interfaces 2024, 54, 105174. [Google Scholar] [CrossRef]
  28. Lu, X.F.; Fang, Y.; Luan, D.; Lou, X.W.D. Metal–Organic Frameworks Derived Functional Materials for Electrochemical Energy Storage and Conversion: A Mini Review. Nano Lett. 2021, 21, 1555–1565. [Google Scholar] [CrossRef]
  29. Hammad, S.F.; Abdallah, I.A.; Bedair, A.; Abdelhameed, R.M.; Locatelli, M.; Mansour, F.R. Metal Organic Framework-Derived Carbon Nanomaterials and MOF Hybrids for Chemical Sensing. TrAC Trends Anal. Chem. 2024, 170, 117425. [Google Scholar] [CrossRef]
  30. Alhalili, Z. Metal Oxides Nanoparticles: General Structural Description, Chemical, Physical, and Biological Synthesis Methods, Role in Pesticides and Heavy Metal Removal through Wastewater Treatment. Molecules 2023, 28, 3086. [Google Scholar] [CrossRef]
  31. Hartati, Y.W.; Topkaya, S.N.; Gaffar, S.; Bahti, H.H.; Cetin, A.E. Synthesis and Characterization of Nanoceria for Electrochemical Sensing Applications. RSC Adv. 2021, 11, 16216–16235. [Google Scholar] [CrossRef] [PubMed]
  32. Ho, C.; Yu, J.C.; Kwong, T.; Mak, A.C.; Lai, S. Morphology-Controllable Synthesis of Mesoporous CeO2 Nano- and Microstructures. Chem. Mater. 2005, 17, 4514–4522. [Google Scholar] [CrossRef]
  33. He, J.; Xu, Y.; Wang, W.; Hu, B.; Wang, Z.; Yang, X.; Wang, Y.; Yang, L. Ce(III) Nanocomposites by Partial Thermal Decomposition of Ce-MOF for Effective Phosphate Adsorption in a Wide pH Range. Chem. Eng. J. 2020, 379, 122431. [Google Scholar] [CrossRef]
  34. Liu, X.-M.; Gao, W.-L.; Zhang, J. Facile Synthesis of Monodispersed CeO2 Nanostructures. J. Phys. Chem. Solids 2011, 72, 1472–1476. [Google Scholar] [CrossRef]
  35. Liu, Y.; Jie, W.; Liu, F.; Liu, Q.; Qiu, M.; Gong, X.; Hu, J.; Gong, L. Effect of Ce-BTC Precursor Morphology on CuO/CeO2 Catalysts for CO Preferential Oxidation in H2-Rich Gas. Solid State Sci. 2023, 139, 107182. [Google Scholar] [CrossRef]
  36. Hu, G.; Ma, Y.; Guo, Y.; Shao, S. Electrocatalytic Oxidation and Simultaneous Determination of Uric Acid and Ascorbic Acid on the Gold Nanoparticles-Modified Glassy Carbon Electrode. Electrochim. Acta 2008, 53, 6610–6615. [Google Scholar] [CrossRef]
  37. Zhao, Y.; Gao, Y.; Zhan, D.; Liu, H.; Zhao, Q.; Kou, Y.; Shao, Y.; Li, M.; Zhuang, Q.; Zhu, Z. Selective Detection of Dopamine in the Presence of Ascorbic Acid and Uric Acid by a Carbon Nanotubes-Ionic Liquid Gel Modified Electrode. Talanta 2005, 66, 51–57. [Google Scholar] [CrossRef]
  38. Wu, Y.; Deng, P.; Tian, Y.; Feng, J.; Xiao, J.; Li, J.; Liu, J.; Li, G.; He, Q. Simultaneous and Sensitive Determination of Ascorbic Acid, Dopamine and Uric Acid via an Electrochemical Sensor Based on PVP-Graphene Composite. J. Nanobiotechnol. 2020, 18, 112. [Google Scholar] [CrossRef]
  39. Chelmea, L.; Badea, M.; Scarneciu, I.; Moga, M.A.; Dima, L.; Restani, P.; Murdaca, C.; Ciurescu, D.; Gaman, L.E. New Trends in Uric Acid Electroanalysis. Chemosensors 2023, 11, 341. [Google Scholar] [CrossRef]
  40. Knežević, S.; Ognjanović, M.; Stanković, V.; Zlatanova, M.; Nešić, A.; Gavrović-Jankulović, M.; Stanković, D. La(OH)3 Multi-Walled Carbon Nanotube/Carbon Paste-Based Sensing Approach for the Detection of Uric Acid—A Product of Environmentally Stressed Cells. Biosensors 2022, 12, 705. [Google Scholar] [CrossRef]
  41. Bard, A.J.; Faulkner, L.R. Electrochemical Methods: Fundamentals and Applications, 2nd ed.; Wiley: New York, NY, USA, 2001; ISBN 978-0-471-04372-0. [Google Scholar]
  42. Laviron, E. General Expression of the Linear Potential Sweep Voltammogram in the Case of Diffusionless Electrochemical Systems. J. Electroanal. Chem. Interfacial Electrochem. 1979, 101, 19–28. [Google Scholar] [CrossRef]
  43. Mazzara, F.; Patella, B.; Aiello, G.; O’Riordan, A.; Torino, C.; Vilasi, A.; Inguanta, R. Electrochemical Detection of Uric Acid and Ascorbic Acid Using R-GO/NPs Based Sensors. Electrochim. Acta 2021, 388, 138652. [Google Scholar] [CrossRef]
  44. Yan, Q.; Zhi, N.; Yang, L.; Xu, G.; Feng, Q.; Zhang, Q.; Sun, S. A Highly Sensitive Uric Acid Electrochemical Biosensor Based on a Nano-Cube Cuprous Oxide/Ferrocene/Uricase Modified Glassy Carbon Electrode. Sci. Rep. 2020, 10, 10607. [Google Scholar] [CrossRef]
  45. Azizpour Moallem, Q.; Beitollahi, H. Electrochemical Sensor for Simultaneous Detection of Dopamine and Uric Acid Based on a Carbon Paste Electrode Modified with Nanostructured Cu-Based Metal-Organic Frameworks. Microchem. J. 2022, 177, 107261. [Google Scholar] [CrossRef]
  46. Zhang, J.; Gao, L.; Zhang, Y.; Guo, R.; Hu, T. A Heterometallic Sensor Based on Ce@Zn-MOF for Electrochemical Recognition of Uric Acid. Microporous Mesoporous Mater. 2021, 322, 111126. [Google Scholar] [CrossRef]
  47. Motshakeri, M.; Travas-Sejdic, J.; Phillips, A.R.J.; Kilmartin, P.A. Rapid Electroanalysis of Uric Acid and Ascorbic Acid Using a Poly(3,4-Ethylenedioxythiophene)-Modified Sensor with Application to Milk. Electrochim. Acta 2018, 265, 184–193. [Google Scholar] [CrossRef]
  48. Jawad, M.A.; Dorie, J.; El Murr, N. Electrochemical Quantitative Analysis of Uric Acid in Milk. J. Food Sci. 1991, 56, 594–595. [Google Scholar] [CrossRef]
  49. Lindmark-Månsson, H.; Åkesson, B. Antioxidative Factors in Milk. Br. J. Nutr. 2000, 84, 103–110. [Google Scholar] [CrossRef]
  50. Garrel, D.; Verdy, M.; PetitClerc, C.; Martin, C.; Brulé, D.; Hamet, P. Milk- and Soy-Protein Ingestion: Acute Effect on Serum Uric Acid Concentration. Am. J. Clin. Nutr. 1991, 53, 665–669. [Google Scholar] [CrossRef]
Figure 1. (a) XRPD diffractograms of solvothermal-prepared CeO2 and MOFdCeO2. The standard diffraction pattern of CeO2 JCPDS #43-1002 is given as a reference. (b,c) TEM micrographs of solvothermal-prepared CeO2. (df) TEM micrographs of MOFdCeO2/AuNP nanocomposites.
Chemosensors 12 00231 g001
Figure 2. (a) CV responses of pristine CPE, solvothermal-synthesized nanoceria and MOF-derived nanoceria-modified CPEs, and CPE modified with binary nanocomposite MOF-derived nanoceria/AuNPs. (b) EIS responses of the pristine and modified electrodes.
Chemosensors 12 00231 g002
Figure 3. (a) CV profiles of 20 µM of UA at pristine and MOFdNC/AuNP-modified CPE in BR buffer at pH 6. (b) Effect of pH on CV profiles at MOFdNC/AuNPs&CPE (scan rate of 100 mV/s).
Chemosensors 12 00231 g003
Figure 4. The suggested electro-oxidation mechanism of UA at MOFdNC/AuNPs&CPE.
Chemosensors 12 00231 g004
Figure 5. (a) Effect of the scan rate (20 µM of UA at various scan rates from 10 to 125 mV/s at MOFdNC/AuNPs&CPE in BR buffer at pH 6). (b) Plot of peak potential vs. log of the scan rate, derived from the graph in a. (c) Plot of the peak current vs. the scan rate. (d) Plot of log of the peak current vs. log of the scan rate. (f) Taffel plot derived from CV recorded at 50 mV/s, as presented in graph (e).
Chemosensors 12 00231 g005
Figure 6. SW voltammograms of different concentrations of UA in BR buffer at pH 6 at MOFdNC/AuNPs&CPE in (a) the whole investigated concentration range and (b) for a range of lower concentrations. The corresponding calibration curves (c,d) are given below each voltammetric profile. (e) The calibration curve for low concentrations ranging from 0.05 to 1 µM.
Chemosensors 12 00231 g006
Figure 7. (a) The interfering effect of selected biocompounds on 1 μM of UA at MOFdNC/AuNPs&CPE. (b) Determination of UA in treated milk sample 1 (insert graph—milk protein interfering effect).
Chemosensors 12 00231 g007
Table 1. Comparison of UA electrochemical sensors in terms of analytical parameters.
Electrochemical SensorApplied TechniqueLinear Range (µM)LOD (µM)Ref.
CeO2 nanocubes/GCEDPV10–7004.3[14]
CPE/CeO2 sponge-lake porousDPV0.25–10; 10–3000.06[15]
ZnO-CeO2/GCEDPV10–1000.49[16]
Co-CeO2/GCESWV1–22000.12[17]
In–CeO2/GCPESWV0.079–1480.0074[18]
ITO-rGO-AuNPsLSV10–5002.26[43]
PVP-GR/GCESDLSV0.04–1000.02[38]
UOx/Fc/Cu2O/GCE
Cu-BTC/CPE
DPV
DPV
0.1–1000
0.5–600
0.0596
0.2
[44]
[45]
Ce@Zn-MOF/GCEDPV0–1.78
(0–300 ng/mL) *
0.003
(0.51 ng) *
[46]
PEDOT/GCECV6–1007[47]
MOFdNC/AuNPs&CPESWV0.05–1; 1–500.011This work
* Original data on the UA concentration in the article.
Table 2. Determination of uric acid in milk samples.
S1 (Working Solution)S2 (Working Solution)
Added
(μM)
Found (μM) by SWV *Recovery (%)Added
(μM)
Found (μM) by SWV *Recovery (%)
00.41 ± 0.03-00.44 ± 0.04-
11.45 ± 0.06102.855.63 ± 0.09103.5
22.42 ± 0.04100.41010.33 ± 0.1998.9
33.39 ± 0.0499.41516.80 ± 0.59102.2
55.57 ± 0.07102.92020.54 ± 01.59100.5
77.24 ± 0.1898.2The final UA Concentration (μM)
in Milk Samples
2020.23 ± 0.3199.1SWV *
S1: 82 ± 6.23
S2: 88 ± 2.06
* average of three measurements ± SD.
Disclaimer/Publisher’s Note: The statements, opinions and data contained in all publications are solely those of the individual author(s) and contributor(s) and not of MDPI and/or the editor(s). MDPI and/or the editor(s) disclaim responsibility for any injury to people or property resulting from any ideas, methods, instructions or products referred to in the content.

