Abstract
Fatty liver diseases are a spectrum of liver disorders consisting of the benign fatty liver, which could eventually lead to cirrhosis or even hepatocellular cancer (HCC) without timely treatment. Therefore, early diagnosis is crucial for fatty liver diseases. Liver biopsy is regarded as the gold standard in the diagnosis of fatty liver diseases. However, it is not recommended for routine use due to its invasiveness and complicated operation. Thus, it is urgent to diagnose fatty liver diseases with non-invasive and precise methods. In this regard, fluorescence imaging technology has attracted intensive attention and become a robust non-invasive method for fatty liver visualization, and a series of fluorescent probes are being intensively designed to track the biomarkers in fatty liver. In this brief review, the small molecular fluorescent probes employed in fatty liver are summarized, mainly focusing on the last four years. Moreover, current opportunities and challenges in the development of fluorescent probes for fatty liver will be highlighted.
1. Introduction
Fatty liver diseases are the most common chronic liver diseases, with a worldwide prevalence of approximately 25% [1]. According to the latest diagnostic criteria, fatty liver diseases could be divided into alcoholic fatty liver (AFLD) and nonalcoholic fatty liver (NAFLD), which are associated with metabolic dysfunctions including overweight or obesity, type II diabetes mellitus and an abnormal lipid profile as the key drivers of the disease [2,3,4,5]. With a spectrum of liver disorders including benign fatty liver and severe steatohepatitis, fatty liver diseases are characterized by hepatocellular ballooning, lobular inflammation and steatosis [6]. Chronic steatohepatitis could eventually lead to cirrhosis or even hepatocellular cancer (HCC) in some cases [7]. Despite several proposed mechanisms including classic “two-hit theory” and “multiple parallel hits hypothesis theory”, the detailed mechanisms underlying fatty liver diseases are still unclear [8], which leads to urgent needs to elucidate the pathogenesis of fatty liver diseases.
Meanwhile, although several kinds of drugs have been used for benign fatty liver, no drug has been approved for steatohepatitis by FDA, much less for cirrhosis and HCC [9]. Finally, the only choice for patients with decompensated liver cirrhosis and HCC is liver transplantation, which greatly aggravates the economic burden. Therefore, the early diagnosis of fatty liver diseases is crucial. Liver biopsy is regarded as the gold standard in the diagnosis of fatty liver diseases due to its capability of distinguishing between steatosis and steatohepatitis. However, it is not recommended for routine use due to its invasiveness and complicated operation. Alternative routine imaging techniques mainly include type-b ultrasound (B-US), computed tomography (CT) and magnetic resonance imaging (MRI), which are more acceptable for patients. However, these imaging techniques also exhibit limitations such as high price, low sensitivity and poor resolution, leading to restricted applications in fatty liver diseases [10,11,12]. Therefore, it is urgent to develop novel molecular tools to diagnose fatty liver diseases with non-invasiveness and high accuracy.
In recent decades, fluorescence imaging technology has attracted intensive attention, and become a robust method for bioactive species and biological processes due to its advantages of easy operation, non-invasiveness, high sensitivity, favorable selectivity, and high spatial and temporal resolution [13,14,15]. A large number of fluorescence probes for bioactive species and biological microenvironments have been developed and applied in the study of physiological processes and early diagnoses of diseases [16,17,18]. It is worth noting that small molecular fluorescent probes have attracted intensive study interests due to their merits of definite and modifiable structure, excellent repeatability, easy excretion through metabolism, and good biocompatibility [19,20,21,22].
Typically, a small molecular fluorescent probe consists of a reporter group and a recognition group. The recognition group could sense biomarkers including active chemicals, enzymes, and microenvironments (viscosity, pH, polarity, temperature, etc.), and results in fluorescence signals based on flexible response mechanisms. Great progress has been achieved in recent decades, especially near-infrared emitting (NIR) fluorescent probes and two-photon fluorescent probes, which have been widely engaged in imaging on deep tissues and animal models [23,24,25]. Many critical principles and ingenious strategies on the design of small molecular fluorescent probes have been proposed and reviewed elaborately [26,27,28].
Thus far, many small organic molecular probes have been designed and applied to monitor the bioactive species and pathological processes in the fatty liver. Nonetheless, rare reviews have reported about small molecule fluorescence probes for NAFLD and AFLD diseases [29,30]. To this end, we review the advances of the small molecular fluorescence probes for NAFLD and AFLD in the last four years, and introduce their structures, response mechanisms and bio-imaging applications comprehensively. Since the occurrence and development of fatty liver is a very complex process associated with plenty of intracellular substances and energy metabolism, and these metabolic processes involved various enzymes, which are affected by the intracellular environment and regulated by the REDOX state, we will discuss the small molecular fluorescence probes for intracellular microenvironments (viscosity, polarity), REDOX species (reactive oxygen species, reactive sulfur species) and biological enzymes, to provide valuable guidelines and insights to develop small molecular fluorescent probes for the real-time and in situ visualization of fatty liver (Figure 1), and also some important organelles including lipid droplets, mitochondria, endoplasmic reticulum and peroxisome will be involved. Finally, current challenges and opportunities will be proposed to inspire further studies on small molecular fluorescent probes for fat livers. The full names for abbreviations of representative fluorescent molecules in this review are listed in Table 1.
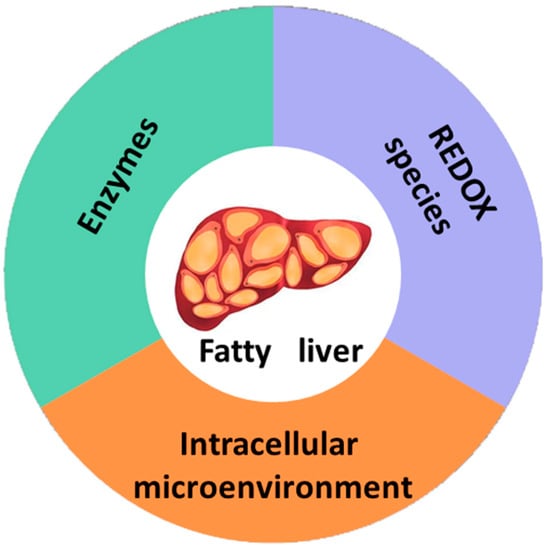
Figure 1.
A brief illustration showing stimuli-responsive fluorescence probes for fatty liver.

Table 1.
Full names of abbreviations for representative fluorescent molecules in the text.
2. Small Molecular Probes for Fatty Livers
2.1. Small Molecular Probes for Intracellular Microenvironment in Fatty Livers
2.1.1. Viscosity Responsive Probes for Fatty Livers
Viscosity is an important microenvironment parameter in biological systems, which can reflect the organelle status and biological functions [51,52,53]. The accumulation of excessive lipids in the liver would lead to the viscosity change in NAFLD, while the dysregulation of viscosity will in turn accelerate the lipids accumulation, in a word, abnormal viscosity is closely associated with NAFLD [54]. Therefore, viscosity is recognized as a promising biomarker in the study and diagnosis of NAFLD, and intensive research interests have been drawn into the development of fluorescent probes to investigate the viscosity in cellular and organelle environments in NAFLD.
Viscosity Responsive Probes in Mitochondria
Mitochondria are known as the powerhouses of cells, involved in diverse physiological processes including energy metabolism, inflammation, and cell apoptosis. Viscosity contributes significantly to the interactions among biomolecules, the diffusion of metabolites and the transmission of chemical signals in mitochondria. Abnormal viscosity could disturb the mitochondria functions and cause an imbalance in lipids’ metabolism, resulting in the accumulation of lipids in the liver [55]. Several studies have been performed on the design of probes to elucidate the relationship between mitochondria viscosity and NAFLD.
Lin’s group developed a two photon fluorescent probe CBI-V (Figure 2A), containing carbazole as the donating group, indolium as the accepting group, and a flexible olefin was applied as the rotor to sense the viscosity [31]. The D-π-A structure endowed CBI-V with an enhanced intramolecular charge transfer (ICT) in the excited state, affording a near infrared emitting fluorescent emission at 620 nm. Moreover, CBI-V displayed negligible fluorescence in nonviscous circumstances due to non-radiative decay by the free rotation, while it exhibited an enhanced fluorescence in viscous media owing to the restricted rotation (Figure 2B). Due to the mitochondria targeting the positive indolium, CBI-V could be used to visualize the mitochondria viscosity with deep red emission. After being stimulated by monensin or nystatin, the cell was incubated with CBI-V, and an enhanced fluorescent emission was obtained, suggesting the validation of the probe in viscosity detection. CBI-V was successfully applied to monitor the mitochondria viscosity in the liver of normal mice and NAFLD mice induced by a high-fat diet (HFD), and the enhanced fluorescence in the NAFLD group demonstrated a relationship between viscosity and liver injury (Figure 2C). Finally, the viscosity in inflamed zebrafish was also visualized by this robust probe (Figure 2D).
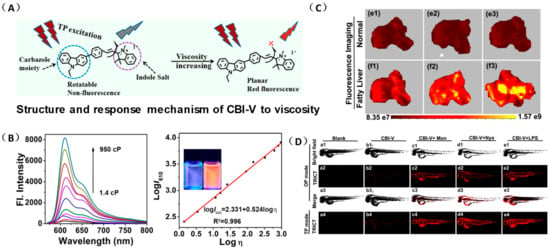
Figure 2.
(A) The structure and reaction mechanism of the probe CBI-V. (B) Left: Fluorescence spectra of 10 μM CBI-V in methanol–glycerol systems at various ratios (λex = 520 nm). Right: Linear relationship between log I610 and log η. (C) Fluorescence imaging of mitochondrial viscosity with CBI-V in normal liver and fatty liver. (D) Fluorescence imaging of zebrafish [31]. Copyright © 2023 American Chemical Society.
The same group designed another viscosity probe, NBI-V (Figure 3A). Integrating with hemicyanine and naphthalene [32], NBI-V exhibited a red emission of 590 nm. Attributed to the flexible vinyl group, an enhanced fluorescence up to 77 folds was found by the TICT mechanism, when the free rotations of the single bond between naphthalene and indolium were restricted in high-viscosity media (Figure 3B). They also established a NAFLD mice model by feeding mice with a high-fat diet to verify the probe’s imaging performance. As a result, the fatty liver mice livers stained with NBI-V performed with stronger fluorescence than normal mice livers by about 2.5 times (Figure 3C). Therefore, NBI-V was able to distinguish normal mice from diseased mice due to the change of viscosity, which provided a method for the study and diagnosis of viscosity-related diseases.
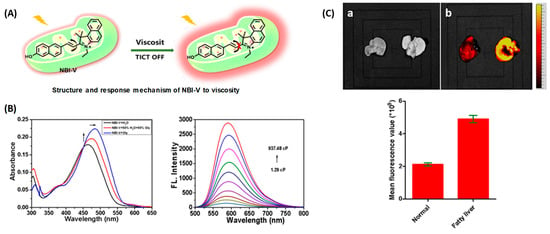
Figure 3.
(A) The structure and reaction mechanism of probe NBI-V. (B) Left: Absorption spectra and Right: fluorescence spectra of probe NBI-V (10 μM) in different ratios of water–glycerol mixtures (λex = 485 nm). (C) Up: Fluorescence imaging of normal mice liver and fatty liver mice liver (From left to right) with NBI-V. Down: Normal mice and fatty liver mice fluorescence intensity changes of liver [32]. Copyright © 2023 Elsevier B.V. All rights reserved.
Viscosity Probes in Endoplasmic Reticulum
The endoplasmic reticulum (ER) is the site for the synthesis of intracellular lipids, proteins and sugars. The accumulation of excessive lipids in the ER always leads to ER stress, results in the accumulation of proteins and lipids in the ER lumen, and aggravates the ER viscosity [56]. Therefore, real-time monitoring of endoplasmic reticulum viscosity dynamics is of great significance.
Li and coworkers developed a novel NIR fluorescence probe, Er-V (Figure 4A), to monitor ER viscosity [33]. Er-V contained a long conjugation system with malononitrile and hemicyanine. Under low viscosity conditions, both maleic cyanine and cyanine could rotate freely, causing non-radiative energy decay, leading to very weak fluorescence. As the viscosity increased, the rotation was inhibited with an enhanced fluorescence at 626 nm (Figure 4B). In addition, the methyl sulphonamide moiety endowed the probe with a capability of endoplasmic reticulum targeting (Figure 4C). Er-V was then used to perform fluorescence imaging on NAFLD cells and mouse models, and an enhancement in fluorescence intensity was observed, indicating the viscosity increase of endoplasmic reticulum in NAFLD liver, which provided imaging support for the early diagnosis and treatment of NAFLD (Figure 4D).
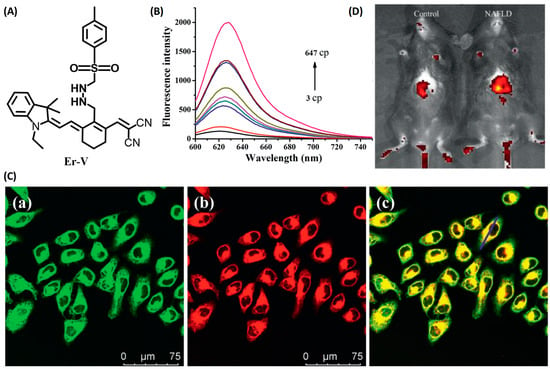
Figure 4.
(A) The structure of the probe Er-V. (B) Changes in the fluorescence of Er-V (5.0 μmol/L) in different methanol–glycerol systems. λex = 580 nm, λem = 626 nm. (C) Colocalization fluorescence images of HL-7702 cells stained with Er-V and ER commercial dye. (a) Fluorescence image from ER commercial dye (λex = 488 nm, λem = 495–550 nm). (b) Fluorescence image from Er-V (λex = 561 nm, λem = 580–700 nm). (c) The overlay images of image (a) and (b). (D) In vivo fluorescence images of the livers of mice in the NAFLD model [33]. Copyright © 2023 Elsevier B.V. All rights reserved.
Viscosity Probes in Peroxisome
Peroxisomes are essential organelles for lipids homeostasis in eukaryotic cells. Dysregulation of peroxisome will disturb the metabolism via activating endoplasmic reticulum stress, and cause lipids accumulation in the liver, which plays a crucial role in the generation and development of NAFLD. Additionally, the viscosity of liver peroxisome will also change along with the lipids accumulation [57]. Therefore, in order to achieve an early diagnosis of NAFLD, real-time and accurate monitoring of liver peroxisome viscosity is necessary. Fluorescent imaging has been widely used to detect liver injury in vivo due to its advantages of easy operation and high sensitivity. However, fluorescence imaging of deep tissues in high-resolution remains a challenge due to the influence of light scattering. Photoacoustic imaging is a novel biological imaging method based on laser ultrasound, emerging in the last decade. It uses the pressure wave generated by biological tissue under laser excitation as ultrasonic signal to carry out highly selective imaging on deep tissues.
Tang and coworkers developed a novel small molecular probe, PV-1 (Figure 5A), to detect peroxisomal viscosity [34]. PV-1 was composed of merocyanine as the reporter, a HLKPLQSKL peptide chain as the peroxisomal targeting group, and a malononitrile group as the rotor. With the increment of viscosity, the free rotation of the rotor was restricted, and the non-radiative energy decay was inhibited, which raised the NIR fluorescence at 705 nm (Figure 5B,C). With the viscosity increasing, the near-infrared absorption at 680 nm also increased significantly, which could be used for photoacoustic imaging. Therefore, fluorescent–photoacoustic dual-modality detection for the viscosity of peroxisome was achieved by PV-1. Further cell experiments proved that the probe exhibited good biocompatibility and could accurately accumulate in peroxisome (Figure 5D) for the fluorescence imaging of viscosity changes caused by lipid metabolism disorders. The probe was also used to visualize viscosity changes in the liver of NAFLD mice. The results showed that the fluorescent and photoacoustic signals in NAFLD mice were stronger than those in the control group, while the fluorescent and photoacoustic signals in the drug-treated group were weaker than those in the NAFLD group, but stronger than those in the control group. Therefore, dual-modality imaging based on the probe can not only be used to monitor the viscosity changes in hepatic peroxisome, but also conducive to the early diagnosis of NAFLD and efficacy evaluation of related therapeutic drugs.
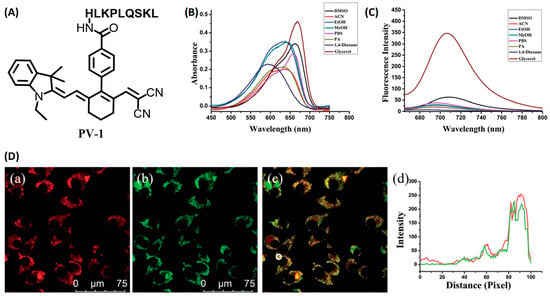
Figure 5.
(A) The structure of probe PV-1. (B) Ultraviolet spectra of PV-1 (5.0 mM) in different solvents, respectively. λex = 650 nm. (C) Fluorescence spectra of PV-1 (5.0 mM) in different solvents, respectively. λex = 650 nm. (D) (a–c) Confocal fluorescence images of the SMMC-7721 cells incubated with PV-1 and peroxisome-GFP. (a) Fluorescence image from PV-1 (λex = 633 nm, λem = 650–750 nm); (b) fluorescence image from peroxisome-GFP (λex = 488 nm, λem = 495–550 nm); (c) merged images; and (d) intensity profile of ROI lines of the white circle. Scale bar = 75 mm [34]. Copyright © 2023 Royal Society of Chemistry.
Dual-Response Viscosity Probes
Dual-response probes capable of monitoring two different analytes in different channels have attracted intensive attention from scientists in the last decade. These probes display the ability to afford simultaneous specific responses when two specific biomarkers are present in the sample. This unique function can not only overcome the false positive defect of a one-to-one response probe, but also improve the accuracy and spatial resolution of fluorescence detection, and facilitate the study of the correlation of biomarkers in complex bio-environments, providing a strong and accurate imaging support for pathological research and disease diagnosis [58].
Xiong and coworkers designed three bichromatic fluorescent probes to discriminate NAFLD and metastatic intestinal cancer in vivo [35]. After screening the excitation and emission performance, Cy-914 was obtained with the NIR I/NIR II feature, due to the extended conjugation. Meanwhile, Cy-914 possessed a pKa of 6.8, which enabled it to display NIR I fluorescent emission at 795 nm in acidic environments, while affording the NIR II fluorescent signal at 914/1030 nm under viscous conditions ranging from neutral to slightly basic (Figure 6A). Because of the difference between the microenvironment of NAFLD and metastatic intestinal cancer, Cy914 was able to monitor viscosity changes in NAFLD with the NIR II signal, and track the pH variation in metastatic intestinal cancer with the NIR I signal, respectively. Therefore, it was used to discriminate NAFLD and metastatic intestinal cancer simultaneously without any cross-talk. Furthermore, after topical spraying, tiny metastases less than 3 mm were resected precisely with the fluorescence-guided surgery (Figure 6B,C).
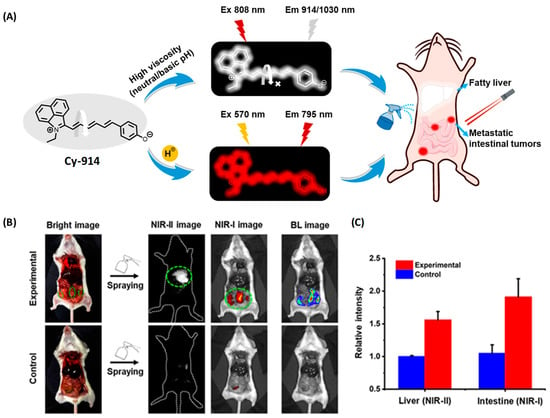
Figure 6.
(A) Illustration of pH-/viscosity-responsive BCFluors for simultaneous visualization of NAFLD and metastatic intestinal tumors by Cy-914. (B) NIR-I/NIR-II dual-color imaging of fatty liver and 4T1 metastatic intestinal tumors in BALB/c mice after in situ spraying Cy-914 (30 μM, ~50 μL) for 30 s. (C) Statistical fluorescence intensities of livers and intestines (n = 3) [35]. Copyright © 2023 American Chemical Society.
2.1.2. Small Molecular Polarity Probes in Fatty Livers
Small Molecular Polarity Probes in Lipid Droplets (LDs)
LDs are dynamic organelles with functions of energy storage and cell signaling. In living cells, LDs undergo self-adjustment in their amount, size, lipid–protein composition and organelle interactions to adapt the dynamic metabolism. As one of the hallmarks for NAFLD liver, LDs accumulation largely results from the imbalance between LDs bio-generation and degradation, which could trigger liver dysfunction, and further cause metabolic disturbances and liver damage [59]. Therefore, the LDs’ polarity reflects their dynamic status and is closely related to the function of the LDs. An abnormal polarity will cause the metabolic dysfunction for LDs, and then lead to liver diseases, so it’s necessary to track the LDs in the livers to investigate and diagnose the LDs-associated NAFLD.
In order to detect LDs in fatty livers, Tian and coworkers developed 03B (Figure 7A) using BODIPY as the acceptor and triphenylamine as the donor [36]. Under the excitation of 416 nm, 03B showed an emission at 560 nm with an excellent Stokes shift of 150 nm, which was helpful to reduce the background interference caused by light scattering and improve the detection. Combined with a partition coefficient between octanol and water (logP) of 1.55, which is close to 2.00, 03B was supposed to locate on LDs. Further DFT calculations and molecular docking confirmed that the electrons of 03B are mainly distributed in the C=N bond, and are more likely to interact with LDs by hydrogen bonding. An initial in vitro assay suggested that 03B could strongly interact with LDs with an obviously increased fluorescence, and exhibited high biocompatibility. They further visualized the fresh tissue slices including fatty liver, heart, and brain by fluorescence imaging using 03B, and a significant fluorescence intensity was obtained in fatty liver stained by 03B, indicating the potential of 03B to evaluate LDs in fatty liver.

Figure 7.
Structures and Emission (λex)/excitation (λem) performance of lipid droplet probes 03B and TNBD.
Wang and coworkers constructed a turn on fluorescent probe TNBD (Figure 7B) for imaging of LDs, with nitrobenzoxadiazole as the lipophilic group [37]. Under excitation at 556 nm, the probe showed that strong aggregation caused a quenching (ACQ) effect in the aqueous solution, and the fluorescence was almost negligible. Upon the addition of lipid, the probe was dispersed, and the fluorescence increased sharply in the red channel (657 nm). Therefore, the probe could be used to perform turn-on fluorescence imaging on LDs in cells. Cell imaging by fluorescence confirmed that the probe could efficiently target to cellular LDs, and the fluorescence intensity was enhanced with the increase of oleic acid concentration after incubation with cells. The bio-imaging experiments with TNBD were also performed on the NAFLD mouse model. The results showed that the lipid droplets of the control group were distributed evenly in the liver cells in a small amount, while the lipid droplets of NAFLD group were distributed in clusters, and the size and amount were larger than the control.
Dong’s group reported a probe, LD-TTP (Figure 8A), to give an insight into the intrinsic relationship between LDs and relative diseases [38]. LD-TTP is a highly conjugated molecule of D-π-A structure with triphenylamine as the donor, thiophene as the π-bridge and pyridyl as the acceptor. With high sensitivity to polarity, LD-TTP exhibited fluorescence enhancement over 278-folds when the polarity increased from Δf = 0.258 to 0.312 (Figure 8B). In addition, the hydrophobic triphenylamine of nonpolarity endowed LD-TTP with LDs specificity, which enables it to monitor LDs polarity in living cells (Figure 8C). Moreover, LD-TTP was adopted to observe LDs in the liver tissue of NAFLD mice, suggesting a lower LDs polarity in the NAFLD liver than the normal liver for the first time, and proposing a diagnostic tool for LD-polarity relative diseases (Figure 8D).
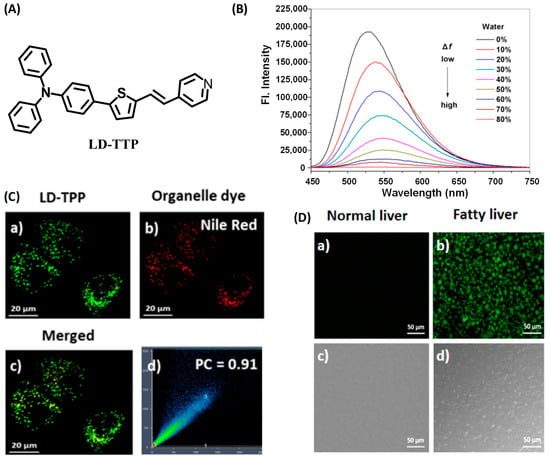
Figure 8.
(A) Structures of the probe LD-TTP. (B) Fluorescence spectra of LD-TTP (1 μM) in THF/H2O mixtures with increasing polarity (water from 0 to 80%), λex = 405 nm. (C) Colocalization fluorescence images of living cells stained with LD-TTP and Nile red commercial dye. (a) Fluorescence images from 3 μM LD-TTP. (b) Fluorescence images from from 0.3 μM Nile red. (c) Merged image of (a) and (b). (d) Pearson’s colocalization correlation of LD-TTP with Nile red. (D) Fluorescence images of LD-TTP (3 μM) in normal liver tissues (a) and fatty liver tissues (b). (c,d) Bright-field image of (a,b). λex = 410 nm and λem = 480–580 nm [38]. Copyright © 2023 American Chemical Society.
Zhou and coworkers fabricated a novel organic fluorescent probe, lip-YB (Figure 9A), to monitor the dynamics of intracellular LDs [39]. Lip-YB was an organic boride formed by coumarin and barbiturate, which was very sensitive to polarity and exhibited obvious solvatochromic characteristics. Due to the aggregation-induced quenching (ACQ) effect in the aqueous solution, the fluorescence of lip-YB was very weak. After being dispersed in oleic acid, the fluorescence intensity was enhanced by about 2113-folds compared than that in water (Figure 9B), and the quantum yield was as high as 73.28%, indicating an excellent signal to noise ratio (SNR). Therefore, lip-YB was suitable to visualize lipid droplets. Attributed to the significant two-photon (TP) characteristics, lip-YB was successfully used to track the LDs dynamics in the liver cells of NAFLD mice by TP fluorescence imaging, which provided a new method to investigate the biological roles and pathological processes that are highly related to LDs (Figure 9C–E).
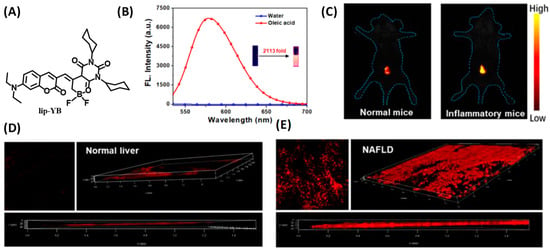
Figure 9.
(A) Structure of lip-YB for lipid droplet tracking. (B) Emission spectra of lip-YB in oleic acid and water, and the inset shows photographs of lip-YB in H2O (left) and in oleic acid (right) taken under illumination using a UV lamp. (C) In vivo imaging of lip-YB in normal mice and inflammatory mice. (D,E) TP Fluorescence images of lip-YB in normal liver tissues and NAFLD tissues [39]. Copyright © 2023 American Chemical Society.
Wang and coworkers developed a near-infrared emitting fluorescent probe LD-HW to achieve the identification of fatty liver in living mice by sensitive detection to LDs polarity [40]. With triphenylamine as the electron donor and a difluoroboron segment as the electron acceptor, LD-HW contained a typical D-π-A structure, which enabled a sensitive response to viscosity via intramolecular charge transfer. At the same time, due to the appropriate hydrophobicity and lipophilicity of triphenylamine and difluoroboron, LD-HW exhibited an improved affinity for lipid droplets (Figure 10A). Fluorescent imaging results exhibited that LD-HW could enter the cell smoothly and rapidly light up the LDs. By LD-HW, further fluorescent imaging on oleic acid-treated cell models showed that the fluorescence intensity in cells was mainly related to the size of LDs. Finally, the visualization of lipid droplets in the NAFLD mice model was achieved, and the fatty liver was discerned from the normal organs in living mice by LD-HW (Figure 10B–E).
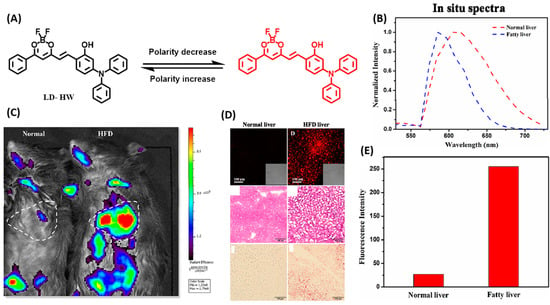
Figure 10.
(A) Design strategy of the probe LD-HW for visualizing cellular LDs variation. (B) In vivo imaging of LD-HW (400 μL, 300 μM, through tail vein injection) in normal mice and high-fat diet (HFD) mice, respectively. (C) Fluorescence images (Up), H&E stain (Mid), and Oil red O stain (Down) of LD-HW (10 μM) in normal liver mouse tissues and fatty liver mouse tissues. (D) Fluorescence intensity collected from B. (E) Normalized in situ fluorescence spectra obtained from B [40]. Copyright © 2023 Elsevier B.V. All rights reserved.
Small Molecular Polarity Probes in Lipid Droplets by Fluorescence Lifetime Imaging Microscopy (FLIM)
Plenty of probes have been developed to monitor the biomolecules, organelles and cellular-environments. However, traditional probes detect analytes by the change in fluorescence intensity, which is inherently interfered with by the dye distribution, photobleaching, and intensity of the excitation light, leading to difficulties in accurate measurement. The fluorescence lifetime is an essential feature of the dyes, which is independent of the above interferences, therefore fluorescence lifetime imaging microscopy (FLIM) using the fluorescence lifetime as the indicator can overcome this limit, and has become one of the research foci for bio-imaging [60,61].
Tobita and coworkers reported a fluorescent probe, PC6S, with extended coumarin, which exhibited polarity-dependent emission from green to red in different solvents (Figure 11) [41]. More intriguingly, the fluorescence lifetime of PC6S increased along with the increment of the solvent polarities, indicating the feasibility to monitor LDs by FLIM. PC6S was then used to visualize the formation and growth of LDs in oleic acid-induced cells and hepatocytes of HFD-induced NAFLD mice (Figure 11). The results demonstrated that, combined with FLIM, PC6S could provide a robust tool to monitor the behavior of LDs in living cells and tissues, which was conducive to diagnosis and therapies for liver diseases.
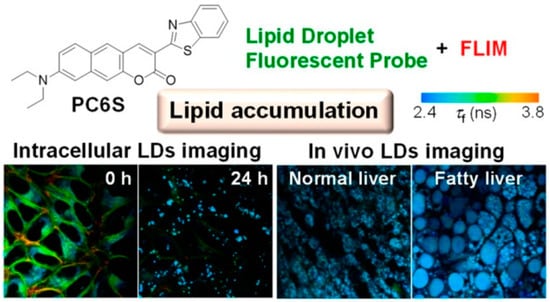
Figure 11.
Structure of the probe PC6S for monitoring LD polarity and in vivo visualization of cells [41]. Copyright © 2023 American Chemical Society.
Lin and coworkers designed a polarity-sensitive D-π-A fluorescent probe, CCB (Figure 12A), with coumarin as the electron acceptor and carbazole as the electron donor [42]. The optical properties of CCB showed that due to the intrinsic intramolecular charge transfer, CCB had a significant solvochromic response to solvents of different polarities. With the increase of solvent polarity, the absorption and emission bands of CCB were red shifted, and the quantum yield decreased (Figure 12B). More interestingly, the fluorescence lifetime showed a very excellent linear relationship with the solvent polarity: the larger the solvent polarity, the smaller the fluorescence lifetime (Figure 12C). In addition, the dimethylamino-substituted coumarin endowed CCB with good lipophilicity to localize on LDs. Therefore, CCB was used to quantitatively detect NAFLD-induced LDs polarity changes both in cells and tissues by fluorescence lifetime imaging (Figure 12D). The results showed that the cellular fluorescence lifetime increased with the aggravation of steatosis, which indicated a decrease in LDs polarity.
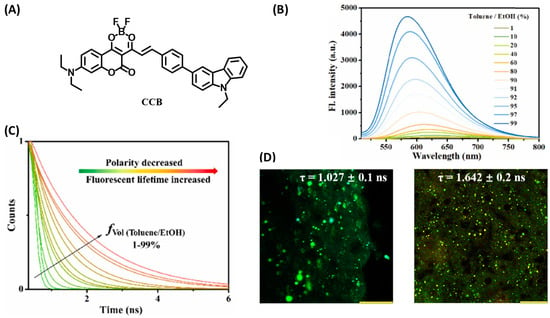
Figure 12.
(A) Structure of CCB for lipid droplet tracking. (B) The fluorescent spectrum of the probe CCB (10 μM) in various toluene/EtOH ratios. (C) Fluorescence decays of CCB (100 μM) in various toluene/EtOH ratios. (D) FLIM images of the liver obtained from (left) normal mouse and (right) NAFLD mouse. Scale bar: 100 μm [42]. Copyright © 2023 Elsevier B.V. All rights reserved.
Small Molecular Polarity Probes in Peroxisome
Peroxisomal proliferator-activated receptor alpha (PPAR-a) is an important nuclear receptor that maintains glucose and lipid metabolism by regulating the metabolic enzymes in peroxisome, and plays a crucial role in the generation and development of NAFLD [62]. Since the peroxisomal polarity varies long with the level of metabolic enzymes, there is an urgent need to monitor the peroxisomal polarity behaviors in NAFLD.
Tang’s group developed a two photon fluorescent probe, PX-P, with a D−π−A structure to image the peroxisomal polarity [43]. PX-P exhibited strong fluorescence in nonpolar environments, while a weak fluorescence emission was recorded in a high polar medium due to the nonradiative relaxation of energy in the exited state (Figure 13A–C). The confocal fluorescent imaging on the cell, tissue and murine models did not only validate the performance of PX-P in monitoring peroxisomal polarity, but also implied a significant decrease in peroxisomal polarity of NAFLD mice compared to the normal one, due to the downgrading of the intracellular PPAR-a (Figure 13D,E). Moreover, they also demonstrated that excessive ONOO− could inactivate the PPAR-a through ROS stress, which in turn aggravates NAFLD.
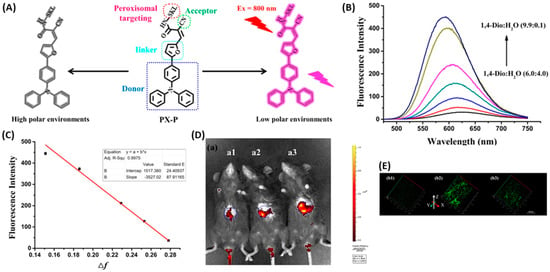
Figure 13.
(A) Structure of PX-P and the proposed response mechanism to polarity. (B) Fluorescence of PX-P (5.0 μM) in various 1,4-Dio–H2O solvent systems. (C) Linear relationship between fluorescence intensity of PX-P (5.0 μM) and Δf in various 1,4-Dio–H2O solvent systems. λex = 460 nm and λem = 586 nm. (D) Liver fluorescence imaging of PX-P (100 μL, 10–4 M) in vivo. (E) Two-photon imaging of PX-P in livers of mice with NAFLD [43]. Copyright © 2023 American Chemical Society.
2.2. Small Molecular REDOX Probes in Fatty Livers
2.2.1. Small Molecular Probes for Reactive Oxygen Species in Peroxisome
Reactive oxygen species (ROS) are a wide variety of high oxidative molecules or radicals with different properties and important biological functions including signaling and cell death. Oxidative stress is generally termed as the imbalance between the ROS and the antioxidants when the former is dominant. NAFLD is a complex disease strongly associated with oxidative stress. In the circumstance of NAFLD, oxidative stress can always lead to the reprogramed metabolism of hepatic lipid, altered insulin sensitivity, and inflammation modulation by interacting with innate immune signaling. Therefore, ROS stress is considered as one of the important contributors to the occurrence and progression for NAFLD, and ROS are implicated as a potential biomarker for NAFLD pathogenesis study and diagnosis [63,64].
Using the reaction between benzopyrylium and nitrate peroxide, Zhang’s group constructed a two-photon fluorescent probe for ONOO− [44]. They screened a variety of substituents on the carbonyl group of benzopyrylium to improve the selectivity and sensitivity of the probe. It was found that the electron-withdrawing groups could improve the sensitivity, but a too strong electron-withdrawing ability would attenuate the selectivity of the probe. Therefore, coumarin with appropriate electron withdrawing and electron donating ability was selected on benzopyrylium to construct a two-photon fluorescence probe, RTFP. RTFP acted as a ratiometric probe with two different emission peaks upon the addition of ONOO−, which could reduce the interference on fluorescence detection from the uneven distribution of the probe and complex biological environment, leading to improved sensitivity and accuracy in detection. Moreover, RTFP exhibited an excellent limit of detection (LOD) as low as 4.1 nM, with a high ratiometric signal up to 130 folds. RTFP was also applied to monitor ONOO− in NAFLD and acute liver injury cells, and the pathological effect of cytochrome P450 on non-alcoholic fatty liver in the environment of acute liver injury was revealed for the first time, suggesting that the inhibited activity of liver CYP2E1 could reduce the ONOO− level. Finally, by feeding them a high-fat diet (HFD), Kunming mice were used to establish NAFLD mouse models for fluorescence imaging in vivo, and RTFP was used to investigate the association between ONOO− and NAFLD, the results indicated that metabolic disorders could cause ONOO− changes in the liver of high-fat diet and obesity-induced NAFLD mice (Figure 14).
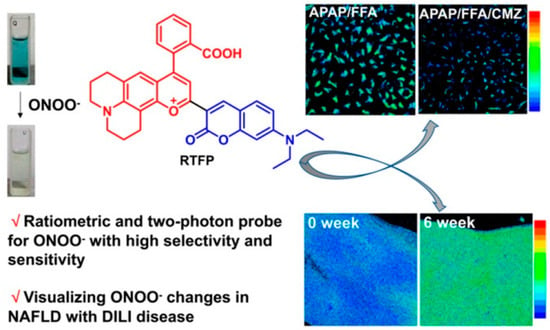
Figure 14.
Schematic illustrations of RTFP for ONOO− tracking [44]. Copyright © 2023 American Chemical Society.
2.2.2. Small Molecular Reactive Sulfur Species (RSS) Probes
Reactive sulfur species (RSS) play a vital role in maintaining cellular redox balance and signal transduction in various physiological processes such as cell protection, oxidative post-translational modification, ion channels and cardiovascular systems. Research indicated that the abnormal expression of RSSs can lead to many diseases including liver diseases [65]. However, due to the lack of effective detection tools, the physiological functions and signal transduction mechanisms of intracellular RSSs in the occurrence and development of NAFLD have not been clarified. Therefore, it is of practical significance to develop a fluorescent imaging method to detect intracellular RSSs in situ.
Zhang and coworkers designed and synthesized a fluorescent probe, Np-RhPhCO (Figure 15), based on through-bond energy transfer (TBET) mechanism for fluorescence detection of intracellular hydrosulfide [45]. Np-RhPhCO consisted of a naphthalene donor and a rhodamine acceptor, where a recognition site with high response activity to hydropolysulfide was introduced onto the rhodamine acceptor by screening experiments. Since the recognition site was affected by the active substances of high concentration such as cysteine, they introduced the self-assembly strategy of amphiphilic polymers to pack the small molecular probes into nanoparticles to further improve the selectivity of the probe (Figure 15A). Under excitation at 420 nm, the probe exhibited two distinct emission bands at 486 nm and 594 nm, respectively. After the addition of Na2S2, the emission at 594 nm decreased with an enhanced emission at 486 nm. Therefore, ratiometric fluorescent detection of cellular hydropolysulfide was achieved by the intensity ratio (F486/F594) (Figure 15B). Fluorescence imaging using this probe on the NAFLD cell model induced by free fatty acids showed that the generation of hydrogen polysulfide in NAFLD cells was regulated by hydrogen sulfide, and increased with enhanced hydrogen sulfide, and this process was also promoted by upregulation of 3-mercaptopyruvate sulfurtransferase (MPST). Further experiments revealed a complex signaling pathway involving ROS, RSS and hydropolysulfide (Figure 15C). Drug treatment on NAFLD activated MPST and Cystathionine Gamma Lyase (CSE) to produce more hydrogen sulfide (H2S), and H2S would further produce more hydropolysulfide under the catalysis of reactive oxygen species (ROS) or MPST and CSE (Figure 15D).
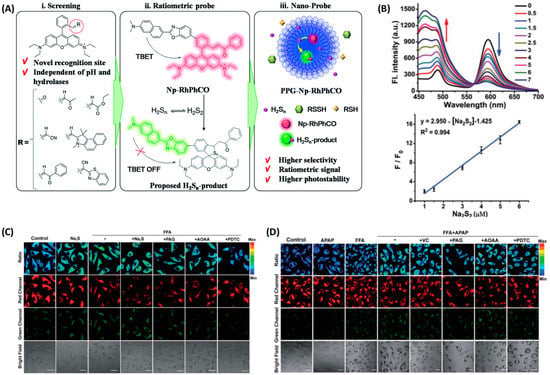
Figure 15.
(A) Design strategy of the ratiometric fluorescent probe PPG-Np-RhPhCO for sensing H2Sn. (B) Up: Fluorescence spectra of PPG-Np-RhPhCO in the presence of various concentrations of Na2S2 in PBS buffer (pH 7.4). Down: Plot of fluorescence intensity ratio (I486/I594) changes as a function of Na2S2 concentration in PBS buffer (pH 7.4). (C) H2Sn imaging in NAFLD with the nano-probe PPG-Np-RhPhCO. (D) H2Sn imaging in drug-treated NAFLD [45]. Copyright © 2023 Royal Society of Chemistry.
Yuan and coworkers used a similar strategy to construct a high selective near-infrared fluorescent probe MSN@CSN@PEG for real-time tracking of NAFLD-induced H2S changes in the liver [46]. They first selected a near-infrared fluorescent dye CSOH as the reporter to design a series of fluorescent probes for hydrogen sulfide, and then screened out the probe 1-CSN with superior response performance compared to the others (Figure 16A). In order to overcome the interference of cysteine on the detection, the probe was loaded with mesoporous silicon nanomaterials and modified with polyethylene glycol to prepare a fluorescent probe MSN@CSN@PEG with improved selectivity and stability for H2S detection (Figure 16B). In addition, the probe was applied to monitor the hepatic H2S levels in the pathological progression of NAFLD, which provided a promising tool for future studies of fatty liver and other chronic liver diseases (Figure 16C,D).
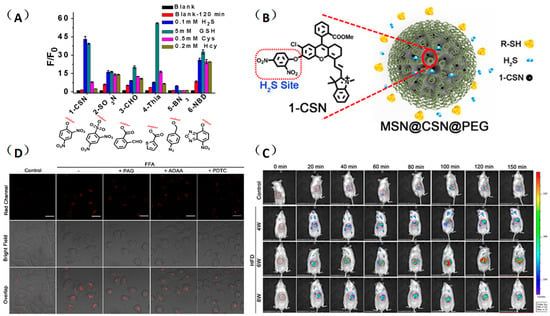
Figure 16.
(A) Screening of the near-infrared H2S molecular probe. (B) Nanofunctionalization of 1-CSN. (C) Imaging of H2S levels in normal liver cells (HL-7702) and NAFLD cell model with probe MSN@CSN@PEG (100 μg/mL). (D) Real-time in vivo fluorescence imaging of hepatic H2S levels in mice at different stages of NAFLD by intravenous injection of the probe MSN@CSN@PEG (100 μL, 10 mg/mL) [46]. Copyright © 2023 American Chemical Society.
2.3. Small Molecular Enzyme-Active Probes in Fatty Livers
2.3.1. Small Molecular Butyrylcholinesterase (BChE) Probes
BChE is one of the important cholinesterases in the human body; is mainly present in the liver, pancreas and brain; and plays essential roles in cholinergic neurotransmission. BChE is usually generated in the liver and transported throughout the body with the blood, where it plays an important role in maintaining metabolism and human health. Recent studies have shown that BChE is involved in various diseases such as Alzheimer’s disease, diabetes and liver disease, and the level of BChE in NAFLD patients is much higher than normal, therefore the BChE activity can reflect the status of the liver to some extent [66,67,68].
Gong and coworkers developed a ratiometric fluorescent probe, TB-BChE, for the imaging of BChE in NAFLD mice [47]. TB-BChE was composed of TCFIS and cyclopropanecarbonyl, which rendered high selectivity to BChE (Figure 17). In the absence of BChE, TB-BChE showed weak fluorescence at 626 nm and 760 nm due to the electron-deficient cyclopropanecarbonyl. After reacting with BChE, the ester bond is cleaved to afford TCFIS as the product, and the intramolecular charge transfer is recovered, leading to a significant enhancement at 626 nm and a slight decrease at 760 nm. Moreover, the ratio of fluorescence intensity at 626 nm and 760 nm (F626/F760) showed an excellent linear relationship towards BChE with a favorable limit of detection as low as 39.24 ng/mL. Molecular docking confirmed that TB-BCHE exhibited a stronger interaction with BChE than acetylcholinesterase (AChE) due to the large steric hindrance of cyclopropanecarboxylate, and thus guaranteed a specific response to BChE. The fluorescent imaging in cells and tissues proved that TB-BCHE could detect endogenous BChE in a ratiometric manner. In addition, the probe was used to visualize BChE in the liver of NAFLD mice. The results showed that the BChE level in the NAFLD group was higher than that of the normal group, which was consistent with the results of fluorescence detection on serum samples.

Figure 17.
Structure and response mechanism of HBT-BChE to butyrylcholinesterase (BChE).
Chen and coworkers developed another probe, HBT-BChE, to visualize the BChE in NAFLD livers [48]. HBT-BChE consisted of 2-(2′-Hydroxyphenyl)benzothiazole (HBT) as the reporter and cyclopropanecarbonyl as the recognition site. Due to the synergistic effect of the aggregation-induced enhanced emission (AIEE) and ESIPT, HBT-BChE possessed a large Stocks shift, which could eliminate the background interference in detection. Moreover, HBT-BChE exhibited negligible fluorescence without BChE, upon the addition of BChE, the cyclopropanecarbonyl departed from HBT, led to the recovery of excited state intramolecular proton transfer (ESIPT), and resulted in the formation of HBT-MO-MA with an enhanced fluorescence emission (Figure 18A). Spectral measurement showed that HBT-BChE was highly selective and sensitive to BChE over AChE, with a limit of detection at 7.540 × 10⁴ U/mL (Figure 18B). Further investigation in living cells showed that HBT-BChE could detect both endogenous and exogenous BChE, which could be used to evaluate the efficiency of BChE inhibitors (Figure 18C). Finally, the BChE level in the liver of NAFLD zebrafish was also detected by fluorescence imaging with BHT-BChE, and the results showed that the fluorescence in the disease group was stronger than that in the normal group, which provided a tool for the study and diagnosis of NAFLD (Figure 18D).
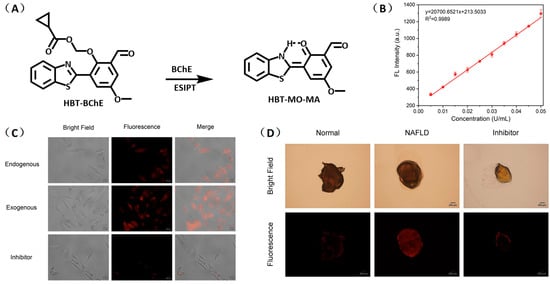
Figure 18.
(A) Structure and response mechanisms of the probe HBT-BChE for BChE. (B) Spectra of HBT-BChE with the BChE catalytic reaction (0.500 U/mL) at 37 °C in 10 mM PBS buffer of pH = 7.4. (C) Hela cells imaging of HBT-BChE (10 µM at 37 °C). (D) Part of the liver of zebrafish confocal imaging by HBT-BChE (10 µM) [48]. Copyright © 2023 Elsevier B.V. All rights reserved.
2.3.2. Small Molecular Fatty Acid Beta Oxidation (FAO) Probes
Fatty acid beta oxidation (FAO) is one of the most important forms of energy supply by oxidative metabolism in liver. In the FAO process, fatty acids are converted to acetyl-coA under the catalysis of various enzymes in the mitochondria. Recent studies have shown that disorders in FAO metabolism can cause fatty acid accumulation in the liver and induce a variety of diseases including NAFLD [69,70]. Ojida and coworkers designed a fluorescent probe, FTO-10, to detect FAO activity in living cells [49]. FTO-10 was a fatty acid possessing coumarin as the reporter group. HPLC analysis based on HepG2 cells was used to track the probe degradation in FAO, and the result confirmed that after transporting into mitochondria through the carnitine shuttle pathway, the probe underwent a sequence of enzymatic reactions to form truncated fatty acid chains, and eventually transformed into coumarin, which could exhibited enhanced fluorescence at least 300-fold compared to the free probe. FTO-10 was further used to visualize the FAO change in living cells and a non-alcoholic steatohepatitis (NASH) mouse model, and the results indicated that a high level of FAO activity could suppress LDs formation and improved the NASH symptom. Therefore, the fluorescent probe FTO-10 could act as a robust tool for the study and diagnosis of NAFLD (Figure 19).

Figure 19.
Structure and sensing mechanism of the probe FTO-10.
2.3.3. Small Molecular Probes for AFLD
Alcohol-induced liver injury is the early stage of alcoholic liver. In hepatocytes, alcohol will firstly transform to acetaldehyde by ethanol dehydrogenase and cytochrome P450 (CYP450), and then acetaldehyde will be metabolized into acetic acid by acetaldehyde dehydrogenase. Acetaldehyde can combine with intracellular proteins, lipids and DNA to form adduction, which will affect the structural stability of cell membranes, protein function, DNA function and repair, and eventually result in cell damage and cancer. In addition, free radicals are generated during the metabolism of ethanol–acetaldehyde and acetic acid, leading to mitochondria damage, energy metabolism disorder and lipid deposition in hepatocytes. A large number of studies have shown that CYP450 reductase is overexpressed in this stage with enhanced hypoxia [71]. Therefore, accurate detection of CYP450 reductase under hypoxia in the liver will be conducive to the early diagnosis of liver injury, and provide opportunities to prevent the liver from AFLD.
Wu and coworkers developed an activatable probe, NIR-NO, (Figure 20) to detect the alcohol-induced liver injury using photoacoustic/fluorescent dual-modality imaging [50]. The probe used benzothiazol-oxanthracene as the reporter group and N-oxidized amino as the recognition site. Under hypoxia conditions, N-oxidized amino (NIR-NO) could be reduced to amino (NIR-NEt2), leading to an enhanced intramolecular charge transfer, with an enhanced fluorescence intensity at 745 nm and a strong redshift absorption band (550 nm–718 nm) for photoacoustic imaging. Therefore, the fluorescent–photoacoustic dual-modality imaging of P450 reductase was achieved by NIR-NO, which would also be conducive to improve the accuracy of imaging. MTT assay and histology sections (H&E staining) of liver showed that the probe had favorable biocompatibility. Fluorescence imaging experiments on HepG2 cells and ALD mice demonstrated that the probe could be used to detect the P450 level in vivo. Finally, multispectral photoacoustic tomography in a mouse model demonstrated that the probe could monitor the level of P450 reductase in the liver of ALD mice, and the photoacoustic signal increased with the enhancement of alanine aminotransaminase in blood after the intake of alcohol.

Figure 20.
Structure and response mechanism of NIR-NO to CYP450 reductase.
3. Conclusions and Outlook
A large number of small molecular fluorescent probes have been designed and synthesized for the imaging of fatty liver. They have helped us with the study of the pathological processes in fatty liver by detecting fatty liver-related bioactive species and biological microenvironments, which provides strong support for the early diagnosis of fatty liver and drug screening. The development of high-performance fluorescent probes for fatty liver imaging and diagnosis will also be the focus of future research. According to the developmental trend of small molecular fluorescent probes and the requirement for the imaging of fatty liver, the study of fatty liver fluorescent probes still faces some deficiencies and challenges.
- The current fluorescent probes for fatty liver mainly involve biomarkers including viscosity, polarity, ROSs, RSS, and enzymes, but these active species are also abnormally expressed in other diseases. Therefore, it is necessary to develop fluorescence probes with liver targeting ability to improve the detection efficiency.
- Organelles are the main places for the physiological and biological processes. The study of biomarkers and their roles in specific organelles will help us to explore the pathological processes in fatty liver, and provide an imaging basis for the diagnosis and treatment of fatty liver. Although a few fluorescence probes with organelle targeting (lipid droplets, mitochondria, endoplasmic reticulum and peroxisome) have been developed and used for real-time monitoring of fatty liver, fluorescence probes targeting other important organelles such as lysosomes and Golgi apparatus have rarely been reported. Moreover, the physiological processes are implicated in different organelles, so the development of fluorescence probes with multi-organelle targeting is of practical significance for the study of fatty liver.
- Xiong and coworkers designed and synthesized double-response fluorescence probes for biological imaging, which can simultaneously detect viscosity and acidity [35]. This multi-response imaging technology can distinguish different diseases and improve the accuracy of diagnosis. However, there are few reports about such fluorescent probes for fatty liver, so there is still a need to develop multi-response fluorescence probes for the imaging of biomarkers in fatty liver.
- Most of the existing fatty liver fluorescent probes exhibit emissions in the short-wavelength and NIR I regions, which are not conducive to imaging in deep tissues due to poor tissue permeability and disturbance from the biological background. This deficiency can be overcome by developing fluorescent probes with emissions in the NIR-II region [72,73].
- Multi-modality fluorescent probes have been intensively studied in the last decade due to their integrated advantages of different imaging modalities [74,75,76]. However, few dual-modality fluorescent probes have been developed for fatty liver. Therefore, it is worth developing multi-modality fluorescent probes combining the advantages of magnetic resonance imaging (NMR), electrical impedance tomography (EIT), and photoacoustic imaging (PA), which are conducive to provide more comprehensive and accurate information and promote the early diagnosis of diseases.
- Although great developments have been achieved in fluorescent probes, there is still a long way to go before their application in the human body and clinics. The current research is still limited to the laboratory stage, mainly focused on cells and mice, and the metabolic pathways and bio-toxicity of the probes have not been investigated systematically. Considering the species difference, the probes’ harm to humans is still unknown, even involving environmental, genetic and other ethical issues. In addition, the practical application of the probes would also be hindered without the advances of supporting instruments and equipment, but it might require a large amount of financial cost to develop such expensive apparatuses.
Author Contributions
Conceptualization, G.M. and S.Y.; writing—original draft preparation, K.Z. and B.L.; writing—review and editing, H.Y., Y.L., K.Z. and S.Y.; supervision, K.Z. and S.Y.; funding acquisition, K.Z. and S.Y. All authors have read and agreed to the published version of the manuscript.
Funding
This research was funded by the National Natural Science Foundation of China (21974013), Sichuan Science and Technology Program (2018JY0168), and Open Research Fund of School of Chemistry and Chemical Engineering, Henan Normal University (2022A04).
Institutional Review Board Statement
Not applicable.
Informed Consent Statement
Not applicable.
Data Availability Statement
Not applicable.
Acknowledgments
Reproduced from Refs. [34,45] with permission from the Royal Society of Chemistry. Reproduced from Refs. [31,35,38,39,41,43,44,46] with permission from American Chemical Society. Reproduced from Refs. [32,33,40,42,48] with permission from Elsevier B.V.
Conflicts of Interest
The authors declare no conflict of interest.
References
- Kleiner, D.E.; Makhlouf, H.R. Histology of nonalcoholic fatty liver disease and nonalcoholic steatohepatitis in adults and children. Clin. Liver Dis. 2016, 20, 293–312. [Google Scholar] [CrossRef] [PubMed]
- Shulman, G.I. Cellular mechanisms of insulin resistance. J. Clin. Investig. 2000, 106, 171–176. [Google Scholar] [CrossRef] [PubMed]
- Tarantino, G.; Finelli, C. What about non-alcoholic fatty liver disease as a new criterion to define metabolic syndrome? World J. Gastroenterol. 2013, 19, 3375–3384. [Google Scholar] [CrossRef]
- Jiang, W.; Wu, N.; Wang, X.; Chi, Y.; Zhang, Y.; Qiu, X.; Hu, Y.; Li, J.; Liu, Y. Dysbiosis gut microbiota associated with inflammation and impaired mucosal immune function in intestine of humans with non-alcoholic fatty liver disease. Sci. Rep. 2015, 5, 8096. [Google Scholar] [CrossRef]
- Yun, J.; Yin, Y.; Sun, L.; Zhang, W. The molecular and mechanistic insights based on gut-liver axis: Nutritional target for non-alcoholic fatty liver disease (nafld) improvement. Int. J. Mol. Sci. 2020, 21, 3066. [Google Scholar]
- Kleiner, D.E.; Brunt, E.M.; Natta, M.V.; Behling, C.; Contos, M.J.; Cummings, O.W.; Ferrell, L.D.; Liu, Y.C.; Torbenson, M.S.; Arida, A.U.; et al. Design and validation of a histological scoring system for nonalcoholic fatty liver disease. Hepatology 2005, 41, 1313–1321. [Google Scholar] [CrossRef]
- Andrade, A.R.C.F.d.; Cotrim, H.P.; Bittencourt, P.L.; Almeida, C.G.; Sorte, N.C.A.B. Nonalcoholic steatohepatitis in posttransplantation liver: Review article. Rev. Assoc. Med. Bras. 2018, 64, 187–194. [Google Scholar] [CrossRef]
- Day, C.P.; James, O.F.W. Steatohepatitis: A tale of two “hits”? Gastroenterology 1998, 114, 842–845. [Google Scholar] [CrossRef]
- Sanyal, A.J.; Friedman, S.L.; McCullough, A.J.; Dimick-Santos, L. Challenges and opportunities in drug and biomarker development for nonalcoholic steatohepatitis: Findings and recommendations from an american association for the study of liver diseases–u.S. Food and drug administration joint workshop. Hepatology 2015, 61, 1392–1405. [Google Scholar] [CrossRef] [PubMed]
- Naredo, E. Efsumb multidisciplinary guidelines and recommendations on the use of musculoskeletal ultrasound in clinical practice: What else? Med. Ultrason. 2021, 23, 381–382. [Google Scholar] [CrossRef]
- Friedrich-Rust, M.; Poynard, T.; Castera, L. Critical comparison of elastography methods to assess chronic liver disease. Nat. Rev. Gastro. Hepat. 2016, 13, 402–411. [Google Scholar] [CrossRef] [PubMed]
- Ferraioli, G.; Wong, V.W.-S.; Castera, L.; Berzigotti, A.; Sporea, I.; Dietrich, C.F.; Choi, B.I.; Wilson, S.R.; Kudo, M.; Barr, R.G. Liver ultrasound elastography: An update to the world federation for ultrasound in medicine and biology guidelines and recommendations. Ultrasound Med. Biol. 2018, 44, 2419–2440. [Google Scholar] [CrossRef]
- Chen, X.; Tian, X.; Shin, I.; Yoon, J. Fluorescent and luminescent probes for detection of reactive oxygen and nitrogen species. Chem. Soc. Rev. 2011, 40, 4783–4804. [Google Scholar] [CrossRef]
- Terai, T.; Nagano, T. Small-molecule fluorophores and fluorescent probes for bioimaging. Pflug. Arch. Eur. J. Physiol. 2013, 465, 347–359. [Google Scholar] [CrossRef]
- Choquet, D.; Sainlos, M.; Sibarita, J.-B. Advanced imaging and labelling methods to decipher brain cell organization and function. Nat. Rev. Neurosci. 2021, 22, 237–255. [Google Scholar] [CrossRef]
- Shanmugam, V.; Selvakumar, S.; Yeh, C.-S. Near-infrared light-responsive nanomaterials in cancer therapeutics. Chem. Soc. Rev. 2014, 43, 6254–6287. [Google Scholar] [CrossRef] [PubMed]
- Wegner, K.D.; Hildebrandt, N. Quantum dots: Bright and versatile in vitro and in vivo fluorescence imaging biosensors. Chem. Soc. Rev. 2015, 44, 4792–4834. [Google Scholar] [CrossRef] [PubMed]
- Gao, L.; Wang, W.; Wang, X.; Yang, F.; Xie, L.; Shen, J.; Brimble, M.A.; Xiao, Q.; Yao, S.Q. Fluorescent probes for bioimaging of potential biomarkers in parkinson’s disease. Chem. Soc. Rev. 2021, 50, 1219–1250. [Google Scholar] [CrossRef] [PubMed]
- Fan, L.; Wang, X.; Zan, Q.; Fan, L.; Li, F.; Yang, Y.; Zhang, C.; Shuang, S.; Dong, C. Recent advances in small-molecule fluorescent probes for studying ferroptosis. Chem. Soc. Rev. 2022, 51, 7752–7778. [Google Scholar]
- Yin, J.; Huang, L.; Wu, L.; Li, J.; James, T.D.; Lin, W. Small molecule based fluorescent chemosensors for imaging the microenvironment within specific cellular regions. Chem. Soc. Rev. 2021, 50, 12098–12150. [Google Scholar] [CrossRef]
- You, J.; Liu, H.; Pan, Q.; Sun, A.; Zhang, Z.; Shi, X. Fast response fluorescent probe with a large stokes shift for thiophenol detection in water samples and cell imaging. J. Anal. Test. 2023, 7, 69–78. [Google Scholar] [CrossRef]
- Zheng, J.; Liu, W.; Lu, F.; Tang, Y.; Yuan, Z. Recent progress in fluorescent formaldehyde detection using small molecule probes. J. Anal. Test. 2022, 6, 204–215. [Google Scholar] [CrossRef]
- Huang, J.; Pu, K. Near-infrared fluorescent molecular probes for imaging and diagnosis of nephro-urological diseases. Chem. Sci. 2020, 12, 3379–3392. [Google Scholar] [CrossRef]
- Jin, H.; Yang, M.; Sun, Z.; Gui, R. Ratiometric two-photon fluorescence probes for sensing, imaging and biomedicine applications at living cell and small animal levels. Coord. Chem. Rev. 2021, 446, 214114. [Google Scholar] [CrossRef]
- Chen, X.; Bian, Y.; Li, M.; Zhang, Y.; Gao, X.; Su, D. Activatable off-on near-infrared qcy7-based fluorogenic probes for bioimaging. Chem. Asian J. 2020, 15, 3983–3994. [Google Scholar] [CrossRef]
- Jun, J.V.; Chenoweth, D.M.; Petersson, E.J. Rational design of small molecule fluorescent probes for biological applications. Org. Biomol. Chem. 2020, 18, 5747–5763. [Google Scholar] [CrossRef]
- Verbitskiy, E.V.; Kvashnin, Y.A.; Baranova, A.A.; Khokhlov, K.O.; Chuvashov, R.D.; Yakovleva, Y.A.; Makarova, N.I.; Vetrova, E.V.; Metelitsa, A.V.; Rusinov, G.L.; et al. Novel fluorophores based on imidazopyrazine derivatives: Synthesis and photophysical characterization focusing on solvatochromism and sensitivity towards nitroaromatic compounds. Dyes Pigment. 2019, 168, 248–256. [Google Scholar] [CrossRef]
- Cao, D.; Liu, Z.; Verwils, P.; Koo, S.; Jangjili, P.; Kim, J.S.; Lin, W. Coumarin-based small-molecule fluorescent chemosensors. Chem. Rev. 2019, 119, 10403–10519. [Google Scholar] [CrossRef] [PubMed]
- Deng, X.; Wu, Y.; Xu, H.; Yan, J.; Liu, H.; Zhang, B. Recent research progress in galactose-based fluorescent probes for detection of biomarkers of liver diseases. Chem. Commun. 2022, 58, 12518–12527. [Google Scholar] [CrossRef]
- Shen, Y.; Zhou, Q.; Li, W.; Yuan, L. Advances in optical imaging of nonalcoholic fatty liver disease. Chem. Asian J. 2022, 17, e202200320. [Google Scholar] [CrossRef]
- Yin, J.; Peng, M.; Lin, W. Visualization of mitochondrial viscosity in inflammation, fatty liver, and cancer living mice by a robust fluorescent probe. Anal. Chem. 2019, 91, 8415–8421. [Google Scholar] [CrossRef] [PubMed]
- Cheng, J.; Li, Z.; Lin, W. Development of a one-step synthesized red emission fluorescent probe for sensitive detection of viscosity in vitro and in vivo. Spectrochim. Acta A 2021, 258, 119808. [Google Scholar] [CrossRef]
- Zhou, Y.; Liu, Z.; Qiao, G.; Tang, B.; Li, P. Visualization of endoplasmic reticulum viscosity in the liver of mice with nonalcoholic fatty liver disease by a near-infrared fluorescence probe. Chin. Chem. Lett. 2021, 32, 3641–3645. [Google Scholar] [CrossRef]
- Zhou, Y.; Li, P.; Wang, X.; Wu, C.; Fan, N.; Liu, X.; Wu, L.; Zhang, W.; Zhang, W.; Liu, Z.; et al. In situvisualization of peroxisomal viscosity in the liver of mice with non-alcoholic fatty liver disease by near-infrared fluorescence and photoacoustic imaging. Chem. Sci. 2020, 11, 12149–12156. [Google Scholar] [CrossRef] [PubMed]
- Xu, W.; Liu, S.; Chen, Z.; Wu, F.; Cao, W.; Tian, Y.; Xiong, H. Bichromatic imaging with hemicyanine fluorophores enables simultaneous visualization of non-alcoholic fatty liver disease and metastatic intestinal cancer. Anal. Chem. 2022, 94, 13556–13565. [Google Scholar] [CrossRef]
- Shao, T.; Liu, T.; Liu, H.; Zhang, M.; Shen, Y.; Gao, A.; Tian, X.; Zhang, Q.; Wu, J.; Tian, Y. Identification of fatty liver disease at diverse stages using two-photon absorption of triphenylamine-based bodipy analogues. J. Mater. Chem. B 2019, 7, 3704–3709. [Google Scholar] [CrossRef]
- Li, S.; Zhuang, W.; Chen, J.; Li, G.; Li, C.; Chen, L.; Liao, Y.; Chen, M.; Wang, Y. Turn-on fluorescent probe for lipid droplet specific imaging of fatty liver and atherosclerosis. J. Mater. Chem. B 2021, 9, 4050–4055. [Google Scholar] [CrossRef]
- Fan, L.; Wang, X.; Zan, Q.; Fan, L.; Li, F.; Yang, Y.; Zhang, C.; Shuang, S.; Dong, C. Lipid droplet-specific fluorescent probe for in vivo visualization of polarity in fatty liver, inflammation, and cancer models. Anal. Chem. 2021, 93, 8019–8026. [Google Scholar] [CrossRef]
- Huang, H.; Bu, Y.; Yu, Z.-P.; Rong, M.; Li, R.; Wang, Z.; Zhang, J.; Zhu, X.; Wang, L.; Zhou, H. Solvatochromic two-photon fluorescent probe enables in situ lipid droplet multidynamics tracking for nonalcoholic fatty liver and inflammation diagnoses. Anal. Chem. 2022, 94, 13396–13403. [Google Scholar] [CrossRef]
- Hu, L.; Pan, J.; Zhang, C.; Yu, K.; Shen, S.; Wang, Y.; Shen, X.; Gu, X.; Han, J.; Wang, H. Polarity-sensitive and lipid droplet-specific red emission fluorophore for identifying fatty liver of living mice through in vivo imaging. Biosens. Bioelectron. 2022, 216, 114618. [Google Scholar] [CrossRef]
- Yoshihara, T.; Maruyama, R.; Shiozaki, S.; Yamamoto, K.; Kato, S.-i.; Nakamura, Y.; Tobita, S. Visualization of lipid droplets in living cells and fatty livers of mice based on the fluorescence of pi-extended coumarin using fluorescence lifetime imaging microscopy. Anal. Chem. 2020, 92, 4996–5003. [Google Scholar] [CrossRef]
- Lai, C.; Zhao, Y.; Zou, X.; Liang, Y.; Lin, W. Quantification of lipid droplets polarity for evaluating non-alcoholic fatty liver disease via fluorescence lifetime imaging. Sens. Actuators B-Chem. 2022, 369, 132267. [Google Scholar] [CrossRef]
- Zhou, Y.; Wu, C.; Wang, X.; Li, P.; Fan, N.; Zhang, W.; Liu, Z.; Zhang, W.; Tang, B. Exploring the changes of peroxisomal polarity in the liver of mice with nonalcoholic fatty liver disease. Anal. Chem. 2021, 93, 9609–9620. [Google Scholar] [CrossRef]
- Cheng, D.; Gong, X.; Wu, Q.; Yuan, J.; Lv, Y.; Yuan, L.; Zhang, X. A high-selectivity fluorescent reporter toward peroxynitrite in coexisting nonalcoholic fatty liver and drug induced liver diseases model. Anal. Chem. 2020, 92, 11396–11404. [Google Scholar] [CrossRef] [PubMed]
- Li, W.; Wang, L.; Yin, S.; Lai, H.; Yuan, L.; Zhang, X. Engineering a highly selective probe for ratiometric imaging of h(2)s (n) and revealing its signaling pathway in fatty liver disease. Chem. Sci. 2020, 11, 7991–7999. [Google Scholar] [CrossRef] [PubMed]
- Li, W.; Shen, Y.; Gong, X.; Zhang, X.; Yuan, L. Highly selective fluorescent probe design for visualizing hepatic hydrogen sulfide in the pathological progression of nonalcoholic fatty liver. Anal. Chem. 2021, 93, 16673–16682. [Google Scholar] [CrossRef]
- Xiang, C.; Xiang, J.; Yang, X.; Li, C.; Zhou, L.; Jiang, D.; Peng, Y.; Xu, Z.; Deng, G.; Zhu, B.; et al. Ratiometric imaging of butyrylcholinesterase activity in mice with nonalcoholic fatty liver using an aie-based fluorescent probe. J. Mater. Chem. B 2022, 10, 4254–4260. [Google Scholar] [CrossRef]
- Pei, X.; Fang, Y.; Gua, H.; Zheng, S.; Bin, X.; Wang, F.; He, M.; Lu, S.; Chen, X. A turn-on fluorescent probe based on esipt and aiee mechanisms for the detection of butyrylcholinesterase activity in living cells and in non-alcoholic fatty liver of zebrafish. Spectrochim. Acta A 2023, 287, 122044. [Google Scholar] [CrossRef]
- Uchinomiya, S.; Matsunaga, N.; Kamoda, K.; Kawagoe, R.; Tsuruta, A.; Ohdo, S.; Ojida, A. Fluorescence detection of metabolic activity of the fatty acid beta oxidation pathway in living cells. Chem. Commun. (Camb) 2020, 56, 3023–3026. [Google Scholar] [CrossRef] [PubMed]
- Chen, J.; Fang, Y.; Sun, L.; Zeng, F.; Wu, S. An activatable probe for detecting alcoholic liver injury via multispectral optoacoustic tomography and fluorescence imaging. Chem. Commun. (Camb) 2020, 56, 11102–11105. [Google Scholar] [CrossRef]
- Xiao, H.; Li, P.; Tang, B. Small molecular fluorescent probes for imaging of viscosity in living biosystems. Chem. Eur. J. 2021, 27, 6880–6898. [Google Scholar] [CrossRef] [PubMed]
- Mengmeng, W.; Rui, Y. Viscosity-sensitive mitochondrial fluorescent probes and their bio-applications. Ann. Adv. Chem. 2022, 6, 038–042. [Google Scholar] [CrossRef]
- Liu, J.; Zhang, W.; Zhou, C.; Li, M.; Wang, X.; Zhang, W.; Liu, Z.; Wu, L.; James, T.D.; Li, P.; et al. Precision navigation of hepatic ischemia-reperfusion injury guided by lysosomal viscosity-activatable nir-ii fluorescence. J. Am. Chem. Soc. 2022, 144, 13586–13599. [Google Scholar] [CrossRef]
- Li, N.; Zhang, X.; Zhou, J.; Li, W.; Shu, X.; Wu, Y.; Long, M. Multiscale biomechanics and mechanotransduction from liver fibrosis to cancer. Adv. Drug Deliver Rev. 2022, 188, 114448. [Google Scholar] [CrossRef]
- Sullivan, E.M.; Pennington, E.R.; Green, W.D.; Beck, M.A.; Brown, D.A.; Shaikh, S.R. Mechanisms by which dietary fatty acids regulate mitochondrial structure-function in health and disease. Adv. Nutr. 2018, 9, 247–262. [Google Scholar] [CrossRef]
- Charles-Messance, H.; Mitchelson, K.A.J.; De Marco Castro, E.; Sheedy, F.J.; Roche, H.M. Regulating metabolic inflammation by nutritional modulation. J. Allergy Clin. Immunol. 2020, 146, 706–720. [Google Scholar] [CrossRef] [PubMed]
- Fougerat, A.; Montagner, A.; Loiseau, N.; Guillou, H.; Wahli, W. Peroxisome proliferator-activated receptors and their novel ligands as candidates for the treatment of non-alcoholic fatty liver disease. Cells 2020, 9, 1638. [Google Scholar] [CrossRef]
- Wu, Z.; Liu, M.; Liu, Z.; Tian, Y. Real-time imaging and simultaneous quantification of mitochondrial h2o2 and atp in neurons with a single two-photon fluorescence-lifetime-based probe. J. Am. Chem. Soc. 2020, 142, 7532–7541. [Google Scholar] [CrossRef]
- Onal, G.; Kutlu, O.; Gozuacik, D.; Dokmeci Emre, S. Lipid droplets in health and disease. Lipids Health Dis. 2017, 16, 128. [Google Scholar] [CrossRef]
- Zhou, T.; Luo, T.; Song, J.; Qu, J. Phasor-fluorescence lifetime imaging microscopy analysis to monitor intercellular drug release from a ph-sensitive polymeric nanocarrier. Anal. Chem. 2018, 90, 2170–2177. [Google Scholar] [CrossRef]
- Koda, K.; Keller, S.; Kojima, R.; Kamiya, M.; Urano, Y. Measuring the ph of acidic vesicles in live cells with an optimized fluorescence lifetime imaging probe. Anal. Chem. 2022, 94, 11264–11271. [Google Scholar] [CrossRef] [PubMed]
- Quintero, P.; Arrese, M. Nuclear control of inflammation and fibrosis in nonalcoholic steatohepatitis: Therapeutic potential of dual peroxisome proliferator-activated receptor alpha/delta agonism. Hepatology 2013, 58, 1881–1884. [Google Scholar] [CrossRef]
- Hong, T.; Chen, Y.; Li, X.; Lu, Y. The role and mechanism of oxidative stress and nuclear receptors in the development of nafld. Oxid. Med. Cell. Longev. 2021, 2021, 6889533. [Google Scholar] [CrossRef]
- Gonzalez, A.; Huerta-Salgado, C.; Orozco-Aguilar, J.; Aguirre, F.; Tacchi, F.; Simon, F.; Cabello-Verrugio, C. Role of oxidative stress in hepatic and extrahepatic dysfunctions during nonalcoholic fatty liver disease (nafld). Oxid. Med. Cell. Longev. 2020, 2020, 1617805. [Google Scholar] [CrossRef]
- Luo, Z.; Tang, L.; Wang, T.; Dai, R.; Ren, J.; Cheng, L.; Xiang, K.; Tian, F. Effects of treatment with hydrogen sulfide on methionine-choline deficient diet-induced non-alcoholic steatohepatitis in rats. J. Gastroenterol. Hepatol. 2014, 29, 215–222. [Google Scholar] [CrossRef]
- Zhang, Q.; Fu, C.; Guo, X.; Gao, J.; Zhang, P.; Ding, C. Fluorescent determination of butyrylcholinesterase activity and its application in biological imaging and pesticide residue detection. ACS Sens. 2021, 6, 1138–1146. [Google Scholar] [CrossRef]
- Turecký, L.; Kupčová, V.; Urfinová, M.; Repiský, M.; Uhlíková, E. Serum butyrylcholinesterase/hdl-cholesterol ratio and atherogenic index of plasma in patients with fatty liver disease. Vnitr. Lek. 2021, 67, 4–8. [Google Scholar] [CrossRef]
- Wang, D.; Tan, K.S.; Zeng, W.; Li, S.; Wang, Y.; Xu, F.; Tan, W. Hepatocellular bche as a therapeutic target to ameliorate hypercholesterolemia through prmt5 selective degradation to restore ldl receptor transcription. Life Sci. 2022, 293, 120336. [Google Scholar] [CrossRef] [PubMed]
- Rom, O.; Liu, Y.; Liu, Z.; Zhao, Y.; Wu, J.; Ghrayeb, A.; Villacorta, L.; Fan, Y.; Chang, L.; Wang, L.; et al. Glycine-based treatment ameliorates nafld by modulating fatty acid oxidation, glutathione synthesis, and the gut microbiome. Sci. Transl. Med. 2020, 12, 2841. [Google Scholar] [CrossRef] [PubMed]
- Moore, M.P.; Cunningham, R.P.; Meers, G.M.; Johnson, S.A.; Wheeler, A.A.; Ganga, R.R.; Spencer, N.M.; Pitt, J.B.; Diaz-Arias, A.; Swi, A.I.A.; et al. Compromised hepatic mitochondrial fatty acid oxidation and reduced markers of mitochondrial turnover in human nafld. Hepatology 2022, 76, 1452–1465. [Google Scholar] [CrossRef] [PubMed]
- Nath, B.; Szabo, G. Hypoxia and hypoxia inducible factors: Diverse roles in liver diseases. Hepatology 2012, 55, 622–633. [Google Scholar] [CrossRef] [PubMed]
- Liu, S.; Li, Y.; Kwok, R.T.K.; Lam, J.W.Y.; Tang, B.Z. Structural and process controls of aiegens for nir-ii theranostics. Chem. Sci. 2020, 12, 3427–3436. [Google Scholar] [CrossRef]
- Zhang, Q.; Yu, P.; Fan, Y.; Sun, C.; He, H.; Liu, X.; Lu, L.; Zhao, M.; Zhang, H.; Zhang, F. Bright and stable nir-ii j-aggregated aie dibodipy-based fluorescent probe for dynamic in vivo bioimaging. Angew. Chem. Int. Ed. Engl. 2020, 60, 3967–3973. [Google Scholar] [CrossRef] [PubMed]
- Cheng, Y.; Yang, F.; Xiang, G.; Zhang, K.; Cao, Y.; Wang, D.; Dong, H.; Zhang, X. Ultrathin tellurium oxide/ammonium tungsten bronze nanoribbon for multi-modality imaging and second near-infrared region photothermal therapy. Nano Lett. 2019, 19, 1179–1189. [Google Scholar] [CrossRef] [PubMed]
- Gamache, R.F.; Zettlitz, K.A.; Tsai, W.K.; Collins, J.; Wu, A.M.; Murphy, J.M. Tri-functional platform for construction of modular antibody fragments for in vivo18f-pet or nirf molecular imaging. Chem. Sci. 2020, 11, 1832–1838. [Google Scholar] [CrossRef]
- Liu, X.; Gong, X.; Yuan, J.; Fan, X.; Zhang, X.; Ren, T.; Yang, S.; Yang, R.; Yuan, L.; Zhang, X. Dual-stimulus responsive near-infrared reversible ratiometric fluorescent and photoacoustic probe for in vivo tumor imaging. Anal. Chem. 2021, 93, 5420–5429. [Google Scholar] [CrossRef] [PubMed]
Disclaimer/Publisher’s Note: The statements, opinions and data contained in all publications are solely those of the individual author(s) and contributor(s) and not of MDPI and/or the editor(s). MDPI and/or the editor(s) disclaim responsibility for any injury to people or property resulting from any ideas, methods, instructions or products referred to in the content. |
© 2023 by the authors. Licensee MDPI, Basel, Switzerland. This article is an open access article distributed under the terms and conditions of the Creative Commons Attribution (CC BY) license (https://creativecommons.org/licenses/by/4.0/).


