Article

Monitoring of Osmotic Swelling Induced Filling Degree Changes in WOW Double Emulsions Using Raman Technologies

1
CeMOS—Center for Mass Spectrometry and Optical Spectroscopy, Mannheim University of Applied Science, Paul-Wittsack-Straße 10, 68163 Mannheim, Germany
2
Institute of Process Engineering in Life Science, Food Process Engineering, Karlsruhe Institute of Technology, 76131 Karlsruhe, Germany
*
Authors to whom correspondence should be addressed.
Chemosensors 2023, 11(4), 206; https://doi.org/10.3390/chemosensors11040206
Submission received: 9 February 2023 / Revised: 10 March 2023 / Accepted: 16 March 2023 / Published: 25 March 2023
(This article belongs to the Section Analytical Methods, Instrumentation and Miniaturization)

Abstract

:
Due to their nested structure, double emulsions have the potential to encapsulate value-adding substances until their application, making them of interest to various industries. However, the complex, nested structure negatively affects the stability of double emulsions. Still, there is a lack of suitable measurement technology to fundamentally understand the cause of the instability mechanisms taking place. This study presents a novel measurement method to continuously track filling degree changes due to water diffusion in a water-in-oil-in-water (W1/O/W2) double emulsion droplet. The measurement method is based on the Raman effect and provides both photometric and spectrometric data. No sample preparation is required, and the measurement does not affect the double emulsion droplet.

1. Introduction

Double emulsions are complex multiphase systems in which one emulsion is emulsified a second time. The most prominent types of double emulsions are water-in-oil-in-water (W1/O/W2) and oil-in-water-in-oil (O1/W/O2) double emulsions [1].
Due to their structure, they offer great potential for encapsulating valuable, sensitive substances, which can be released in a targeted manner during application. The main areas of application are cosmetics, pharmaceuticals and foods [2]. In these industries, the typical droplet diameter for the inner and outer droplets are 1 µm and 10 µm, respectively. However, due to their multiphase structure, double emulsions are prone to various instability mechanisms. Therefore, to date, there is no product on the market based on double emulsions [3].
The instability mechanisms that occur can be divided into two groups: Coalescence between or within one emulsion phase and diffusion between two phases [4].
To achieve good stability in double emulsions, coalescence and diffusion must be suppressed. Concerning diffusion, it is mainly the diffusion between the outer W2 phase and the inner W1 droplets which is observed in application systems as a destabilizing process [5]. The capillary pressure of the encapsulated water droplets leads to the diffusive release of inner water. Whether the encapsulated substances are also transported from the inner water phase to the outer water phase depends on their solubility in the oil phase and on the applied surfactants [6]. In common formulations, the diffusion from W1 to W2 is hindered by balancing the capillary pressure with an osmotic pressure by dissolving e.g., salts in the W1 phase [7]. The concentration of the osmotic active substances must be chosen with care, since too high osmotic pressure leads to the diffusion of water molecules from W2 to W1, which results in a swelling of the water droplets within the oil droplets. When this transport exceeds a certain level, osmotic swelling breakdown occurs [8,9]. This means, the double emulsion droplets invert their phases and an O/W emulsion with much smaller oil droplets remains, while the inner phase is released completely.
To hinder coalescence, both interfaces must be stabilized by surfactants. At the inner W1/O interface, oil soluble surfactants are used. At the outer O/W2 interface, more hydrophilic surfactants are applied [10]. Since the presence of the surfactant cannot be strictly limited to its corresponding interface, the interactions of the surfactant play a major role in double emulsion research [11,12].
Plenty of review papers are available that summarize the efforts of researchers in optimizing the formulations of double emulsions [3,10,13,14,15,16,17]. In brief, no general rules can be formulated how to produce a stable double emulsion. In the outer phase, polymeric surfactants are often preferred in comparison to short chain surfactants [18]. Strongly interfacial active short chain surfactants were found to increase W1–W2 coalescence and therefore limit the encapsulation efficiency in combination with some lipophilic surfactants [19]. However, many applications need short chain surfactants, either for fast stabilization in the production process or to avoid the increase in viscosity polymers bring with them. For polymeric surfactants, specific formulations with good stabilities are reported [20,21]. In terms of lipophilic surfactants, the choices are often limited, depending on the oil phase used. For triglycerides, PGPR and Span 80 are most widespread used [16]. Furthermore, for silicone oil, copolymers made of a silicone backbone in combination with a hydrophilic moiety are proposed [22].
The stability of double emulsions is usually determined by tracking the changes of both water and oil droplet sizes, as well as measuring the encapsulation efficiency of tracer substances [4].
Tracking the release of a marker substance gives interesting information for the application of a system. However, the diffusion of water is not detectable with this method. The release of the encapsulant may happen via diffusion [23] or via coalescence [24]. The responsible mechanism is not easily named and troubleshooting for a formulation is therefore often complicated and not target oriented. A major limitation is the dependence of the encapsulation efficiency on the encapsulated substance [25,26]. Therefore, systematic studies are always limited to the encapsulated substance examined.
A more elaborate method is the measurement of droplet sizes by confocal laser scanning microscopy (CLSM). The droplets are tagged with fluorescent markers and the droplet sizes are measured from the pictures. Since the pictures of the droplets are cross-sections of the droplets at an unknown position, the apparent droplet size must be corrected, which needs at least 2000 droplets to be examined [27]. When this is done properly, the double emulsion is completely described, and changes can be tracked reliably.
With pulsed-field-gradient nuclear magnetic resonance (PFG-NMR), the droplet sizes of the inner droplets can also be assessed [28]. By measuring the diffusion coefficients of inner and outer water, both the amount of inner water and the droplet sizes can be calculated [29]. While this method gives great insights into double emulsion droplets, the requirements for the samples are rather high. During the measurements, no creaming of the oil droplets should occur und a good overall stability of the emulsion is demanded [30].
Differential scanning calorimetry (DSC) also allows the measurement of the amount of inner water [31]. Since the small inner water droplets are unlikely to have any impurities to act as a heterogenous nucleus for crystallization, they need a higher supercooling than the outer water phase. Therefore, the peaks for W1 and W2 phase can be separated easily. As a limitation, this measurement technique can only be applied for freeze stable double emulsions, since many formulations show a significant release during the freezing of the W2 phase [32].
Because of the limitations each measurement method poses on the detection of the amount of inner water of double emulsions, novel methods are constantly looked for. As an alternative, Raman spectroscopy is promising, as it is a fast and non-destructive method [33], which can also be applied for inline measurements.
Raman spectroscopy is based on the electromagnetic interaction between photons and molecular bonds. The interaction raises the molecular bond to a virtual energy level. If it falls back to the initial energy level by emitting a photon, i.e., via Rayleigh radiation. If the molecular bond does not emit the complete energy through the emitted photon, the wavelength of the emitted photon is shifted to longer wavelengths compared to the excitation source. This shift is called Stokes shift. If the molecular bond is excited a second time after emitting a Stokes photon and, subsequently, emits more energy by a second photon, the wavelength of the second photon is shifted to a shorter wavelength compared to the excitation source. This is called anti-Stokes shift [34].
The respective shift distance depends on the excited molecular bond. As a result, each molecular bond has characteristic peaks in the spectrum, which makes it possible to differentiate between different molecular species and leads to the high selectivity of Raman spectroscopy. Since the peak height as well as the peak area correlate with the sample amount, samples can also be investigated quantitatively [35].
The properties of Raman spectroscopy are also advantageous for the analysis of double emulsions since the high selectivity enables distinguishing the individual phases and water does not negatively influence the measurements [36]. The oil phase itself and different solvates in both water phase can therefore be detected and quantified with their respective Raman peaks. One disadvantage, however, is the susceptibility to fluorescence of some materials that can overlay the Raman signal [34].
Two of our previous works already deal with the analysis of double emulsions using Raman spectroscopy. First, we investigated the influence of refractive index differences between the three phases on the signal strength of the inner phase [37]. In addition, we have shown that the filling degree of different double emulsions as well as the oil droplet diameter can be measured reliably [38].
This work presents another measurement method, based on Raman spectroscopy, which can be used to continuously monitor filling degree changes within a single double emulsion droplet.
To demonstrate its usefulness, we investigate whether the following known mechanisms for water diffusion within a double emulsion can be monitored:
  • The lower the osmolality of the inner water phase, the lower the relative filling degree change.
  • With increasing osmolality of the outer water phase, the relative filling degree change is also increasing.

2. Materials and Methods

2.1. Emulsion System and Material Properties of the Phases

The outer water phase consists of 2% polyvinyl alcohol Kuraray Poval 26—88 (Kovayal, Hattersheim am Main, Germany) and ammonium chloride, which was added at 5%, 10% and 15%. As oil phase, silicone oil (M10, CarlRoth, Karlsruhe, Germany) was used with 2% Dowsil Resin XR 0497 (DowCorning, Midland, MI, USA) as emulsifier. For the inner water phase, two variants were used. As first variant, 49% ammonium nitrate (CarlRoth, Karlsruhe, Germany) in water and, as second variant, 24.5% ammonium nitrate and 24.5% polyethylene glycol (CarlRoth, Karlsruhe, Germany) in water were applied.
This emulsion system is not based on an existing application but solely developed for the development and demonstration of the new measurement method, and therefore, it is optimized for Raman measurements. For example, the high solvate content of the inner water phase increases its refractive index to the same level as the oil one. As a result, the double emulsion droplet is transparent for the human eye and the interfaces between the inner water droplets and the oil phase don’t affect the Raman measurement.
The osmolalities of the different water phases could not be determined directly with a freezing point osmometer due to the high solvate concentrations. Corresponding solutions with a maximum solvate content of 7.5% were measured with the osmometer “Advanced® Micro Osmometer Model 3320” (Advanced Instruments Inc., Norwood, MA, USA) and the respective osmolalities of the used aqueous emulsion phases were extrapolated from these data.
The Raman spectra of the different emulsion phases were acquired with the Raman spectrometer “RNX-532” (Kaiser Optical Systems, Inc., Ann Arbor, MI, USA). The integration time was 0.5 s with three accumulations. The phases were placed in a standard spectroscopy cuvette (type: 100-10-40, Hellma Analytics, Müllheim, Germany), which was placed in a cuvette holder belonging to the spectrometer. This procedure allows the quantitative comparison of the spectra.

2.2. Optical Setup

A “gem532” laser (Novanta, Bedford, MA, USA) was used for excitation. The wavelength is 532 nm with an output power of 400 mW. The laser is focused into the “Kaiser NCO-0.5-VIS” backscatter probe (Kaiser Optical Systems, Inc., Ann Arbor, MI, USA), which in turn focuses it into the double emulsion droplets. The spot size of the probe is 55 µm, and the length of the focal volume is 500 µm. After the probe, the light is passed through a collimator (Thorlabs, Newton, NJ, USA) into a system of three 50:50 beam splitters (Thorlabs, Newton, NJ, USA). This splits the Raman signal into four equal parts. In addition, between the collimator and the first beam splitter, a long-pass filter is placed (AHF analysentechnik AG, Tübingen, Germany), which blocks the laser.
One of the four signals is focused into an optical fiber connected to the Raman spectrometer “RNX1-532” (Kaiser Optical Systems, Inc., Ann Arbor, MI, USA). The other three signals are applied directly to “Custom Photon Multipliers” (CPM) (ProxiVision, Bensheim, Germany). CPMs work much faster than a spectrometer, allowing much more time-resolved measurements. However, CPMs are not able to distinguish between different wavelengths. Therefore, a bandpass filter is mounted in front of each CPM, which transmits only one signal of the inner water phase, one signal of the oil phase and one signal of a reference. Details about the filters can be found in the appendix in Table A1. A scheme of the measurement setup is displayed in Figure 1.

2.3. Production of the Double Emulsion

The inner emulsions were produced in the “Megatron MT300” rotor-stator system (Kinematica AG, Malters, Switzerland) using a double-row gear rim geometry. It was set to 22,000 rpm, which corresponds to a maximum rotational speed of 29.9 m/s. During the ninety-second-long emulsification process, the emulsion was run in a closed circuit. The initial filling degree of the inner emulsions is 30%.
The droplet size distribution of the inner emulsions was determined by static light scattering using the "HORIBA LA-950 particle analyzer" (Microtrac Retsch GmbH, Germany). Since the refractive indices of the two applied water phases are matched with the refractive index of the oil phase, a direct measurement by static light scattering is not possible. Therefore, four inner emulsions with different solvate concentrations were prepared in the same way. For the first inner emulsion, the concentration of ammonium nitrate was 40% and 60%, respectively. For the second inner emulsion, the concentration of ammonium nitrate and polyethylene glycol was 20% and 30%, respectively. It can be assumed that the droplet size distributions of the two main inner emulsions are very similar.
The second emulsification step took place in the microfluidic LEGO® device [39], which is an optimization of the glass capillary devices [40]. The main components are two borosilicate capillaries (ID: 0.58 mm; OD: 1 mm; World Precision Instruments, Friedberg, Germany and ID: 1.12 mm, WPI, Sarasota, FL, USA), with the thinner capillary positioned inside the thicker one. The inner emulsion flows through the thinner capillary, and the outer water phase flows in the mantle flow between the capillaries. At the conical end of the inner capillary, both flows meet, resulting in the breakup of monodisperse double emulsions. Two syringe pumps (Legato 100, kdScientific Inc., Holliston, MA, USA) are used to feed both flows. The inner emulsion flows into the LEGO® device at 0.5 ml/h, the outer phase at 2.5 mL/h.
A square quartz capillary (ID: 1.00 mm, CM Scientific Ltd., Silsden, UK) is connected to the thicker capillary of the LEGO® device in which the Raman measurement is performed. The square quartz capillary prevents a negative influence on the measurement due to the curvature of the borosilicate capillary or the glass material.

2.4. Experimental Procedure

To start one experiment, the double emulsion is prepared according to the above description. When the syringe pumps are switched off, the time is recorded. As soon as a single double emulsion droplet is placed in the laser, the elapsed time is noted, and the measurement started.
The photometers measure continuously with an integration time of 100 ms at 10 iterations, resulting in one data point per second. The spectrometer starts a measurement every four minutes with an integration time of 2 min. After approximately one hour, the measurement is terminated.
Both inner emulsions are combined with all four outer water phases and measured in triplicate.

2.5. Data Analysis

To monitor changes in the filling degree, the signal of the oil phase is evaluated for both measuring methods.
For the spectrometric data, a baseline correction of the oil peak is first performed to obtain the integral of the oil peak without signal background [41]. For the baseline correction, one base point is set before the oil peak at 400 cm−1 and one behind the oil peak at 580 cm-1. The baseline is drawn between the two base points. Subsequently, the integral of the entire area between the base points as well as the integral below the baseline is calculated. The difference of these integrals gives the baseline corrected integral of the oil peak. This was done for all spectra, which were collected during one measurement, and each spectrum provides one data point.
For the photometric data, it is not necessary to perform any kind of data preparation prior to the evaluation.
The calculation of the filling degree curve is performed analogously for both measuring methods. Both methods provide measurement data over time. First, the oil signals are normalized to the value of the first oil measurement. Subsequently, the relative change of the filling degree at a certain time t is calculated by means of Equation (1)
F D r e l . ,   t = ( O 0 ,   n o r m . O t ,   n o r m . ) × 100 % .
The parameters in Equation (1) are the relative filling degree change at time t ( F D r e l . ,   t ), the first data point at time t = 0 ( O 0 ,   n o r m . ) , to which all further data points are normalized and all further normalized data points at time t ( O t ,   n o r m . ) .

3. Results

3.1. Raman Spectra of the Emulsion Phases

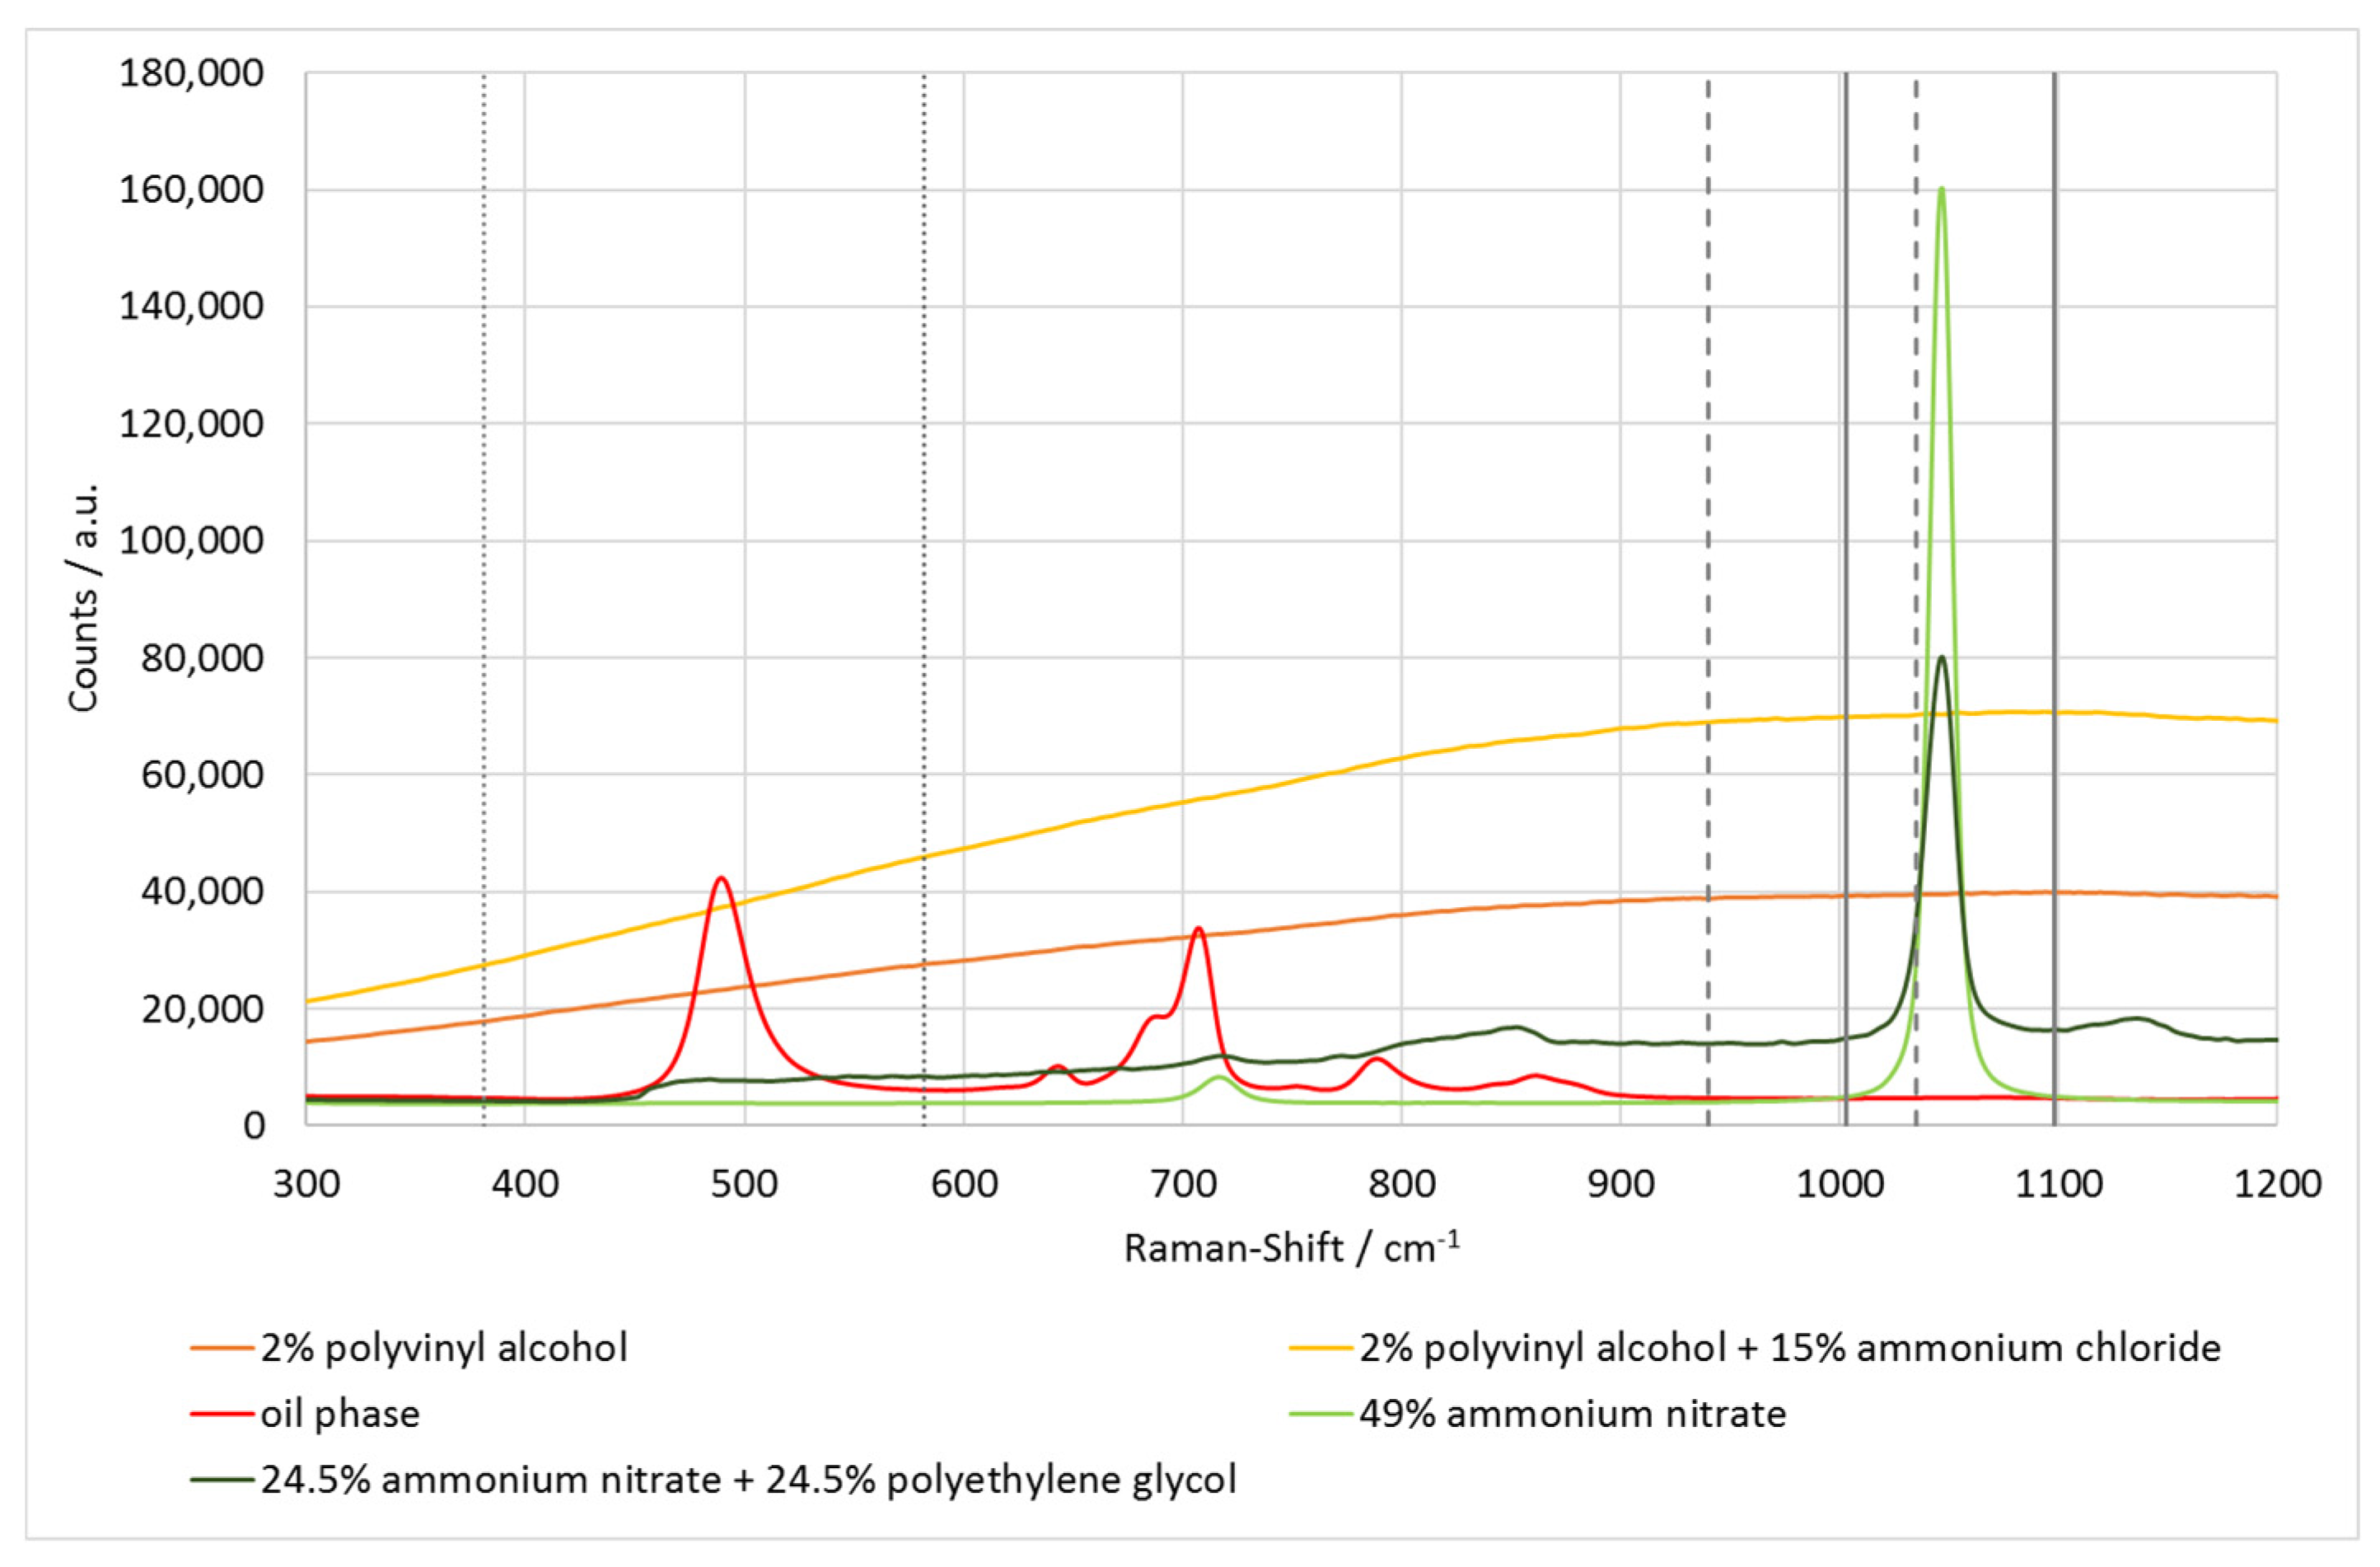
Figure 2 shows the Raman spectra of the individual emulsion phases. In addition, the limits of the used bandpass filters are marked. The two inner water phases each have a significant peak at 1047 cm−1, representing the binding of ammonium nitrate. For the inner phases containing only ammonium nitrate (light green), there are no further significant peaks. If polyethylene glycol is present (dark green) in addition to ammonium nitrate, the peak at 1047 cm−1 is proportionally smaller and the spectrum has a small offset.
The oil phase (red line) can be identified by two peaks at 400 cm−1 and 700 cm−1. Only the first, larger peak at 400 cm-1 is evaluated.
The outer water phases (yellow and gold) have no characteristic peaks. However, the offset is strong compared to the other phases. For a better overview, only the spectra of the outer phases without and with 15% ammonium chloride are shown.

3.2. Osmolalities of the Aqueous Phases

The respective osmolalities were measured or extrapolated for all six aqueous phases of the double emulsions. For each phase, different solutions with a maximum of 7.5% solvate content were measured, from which corresponding correlations were determined. The respective osmolalities are listed in Table 1. The coefficients of determination of the different correlations are at least R² = 0.9992. Detailed data are publicly archived [42].
The osmolalities of the two inner water phases are significantly higher than those of all outer water phases. Only between the inner water phase with 24.5% ammonium nitrate and 24.5% polyethylene glycol and the outer water phase with 15% ammonium chloride is there a small difference.

3.3. Droplet Size Distribution of Inner Emulsions

Figure 3 shows the droplet size distributions of the analysed inner emulsions, which do not differ within standard deviation of a typical laser diffraction measurement [43]. This is also shown by the respective Sauter diameters, which are in the range of 2.87–2.96 µm. As a result, it can be assumed that the droplet size distributions of the two used inner emulsions are almost identical. Furthermore, differences in the droplet size of the inner water droplets can be excluded as a significant influencing factor on the measurements.

3.4. Raman Spectra and Photometric Data of One Measurement

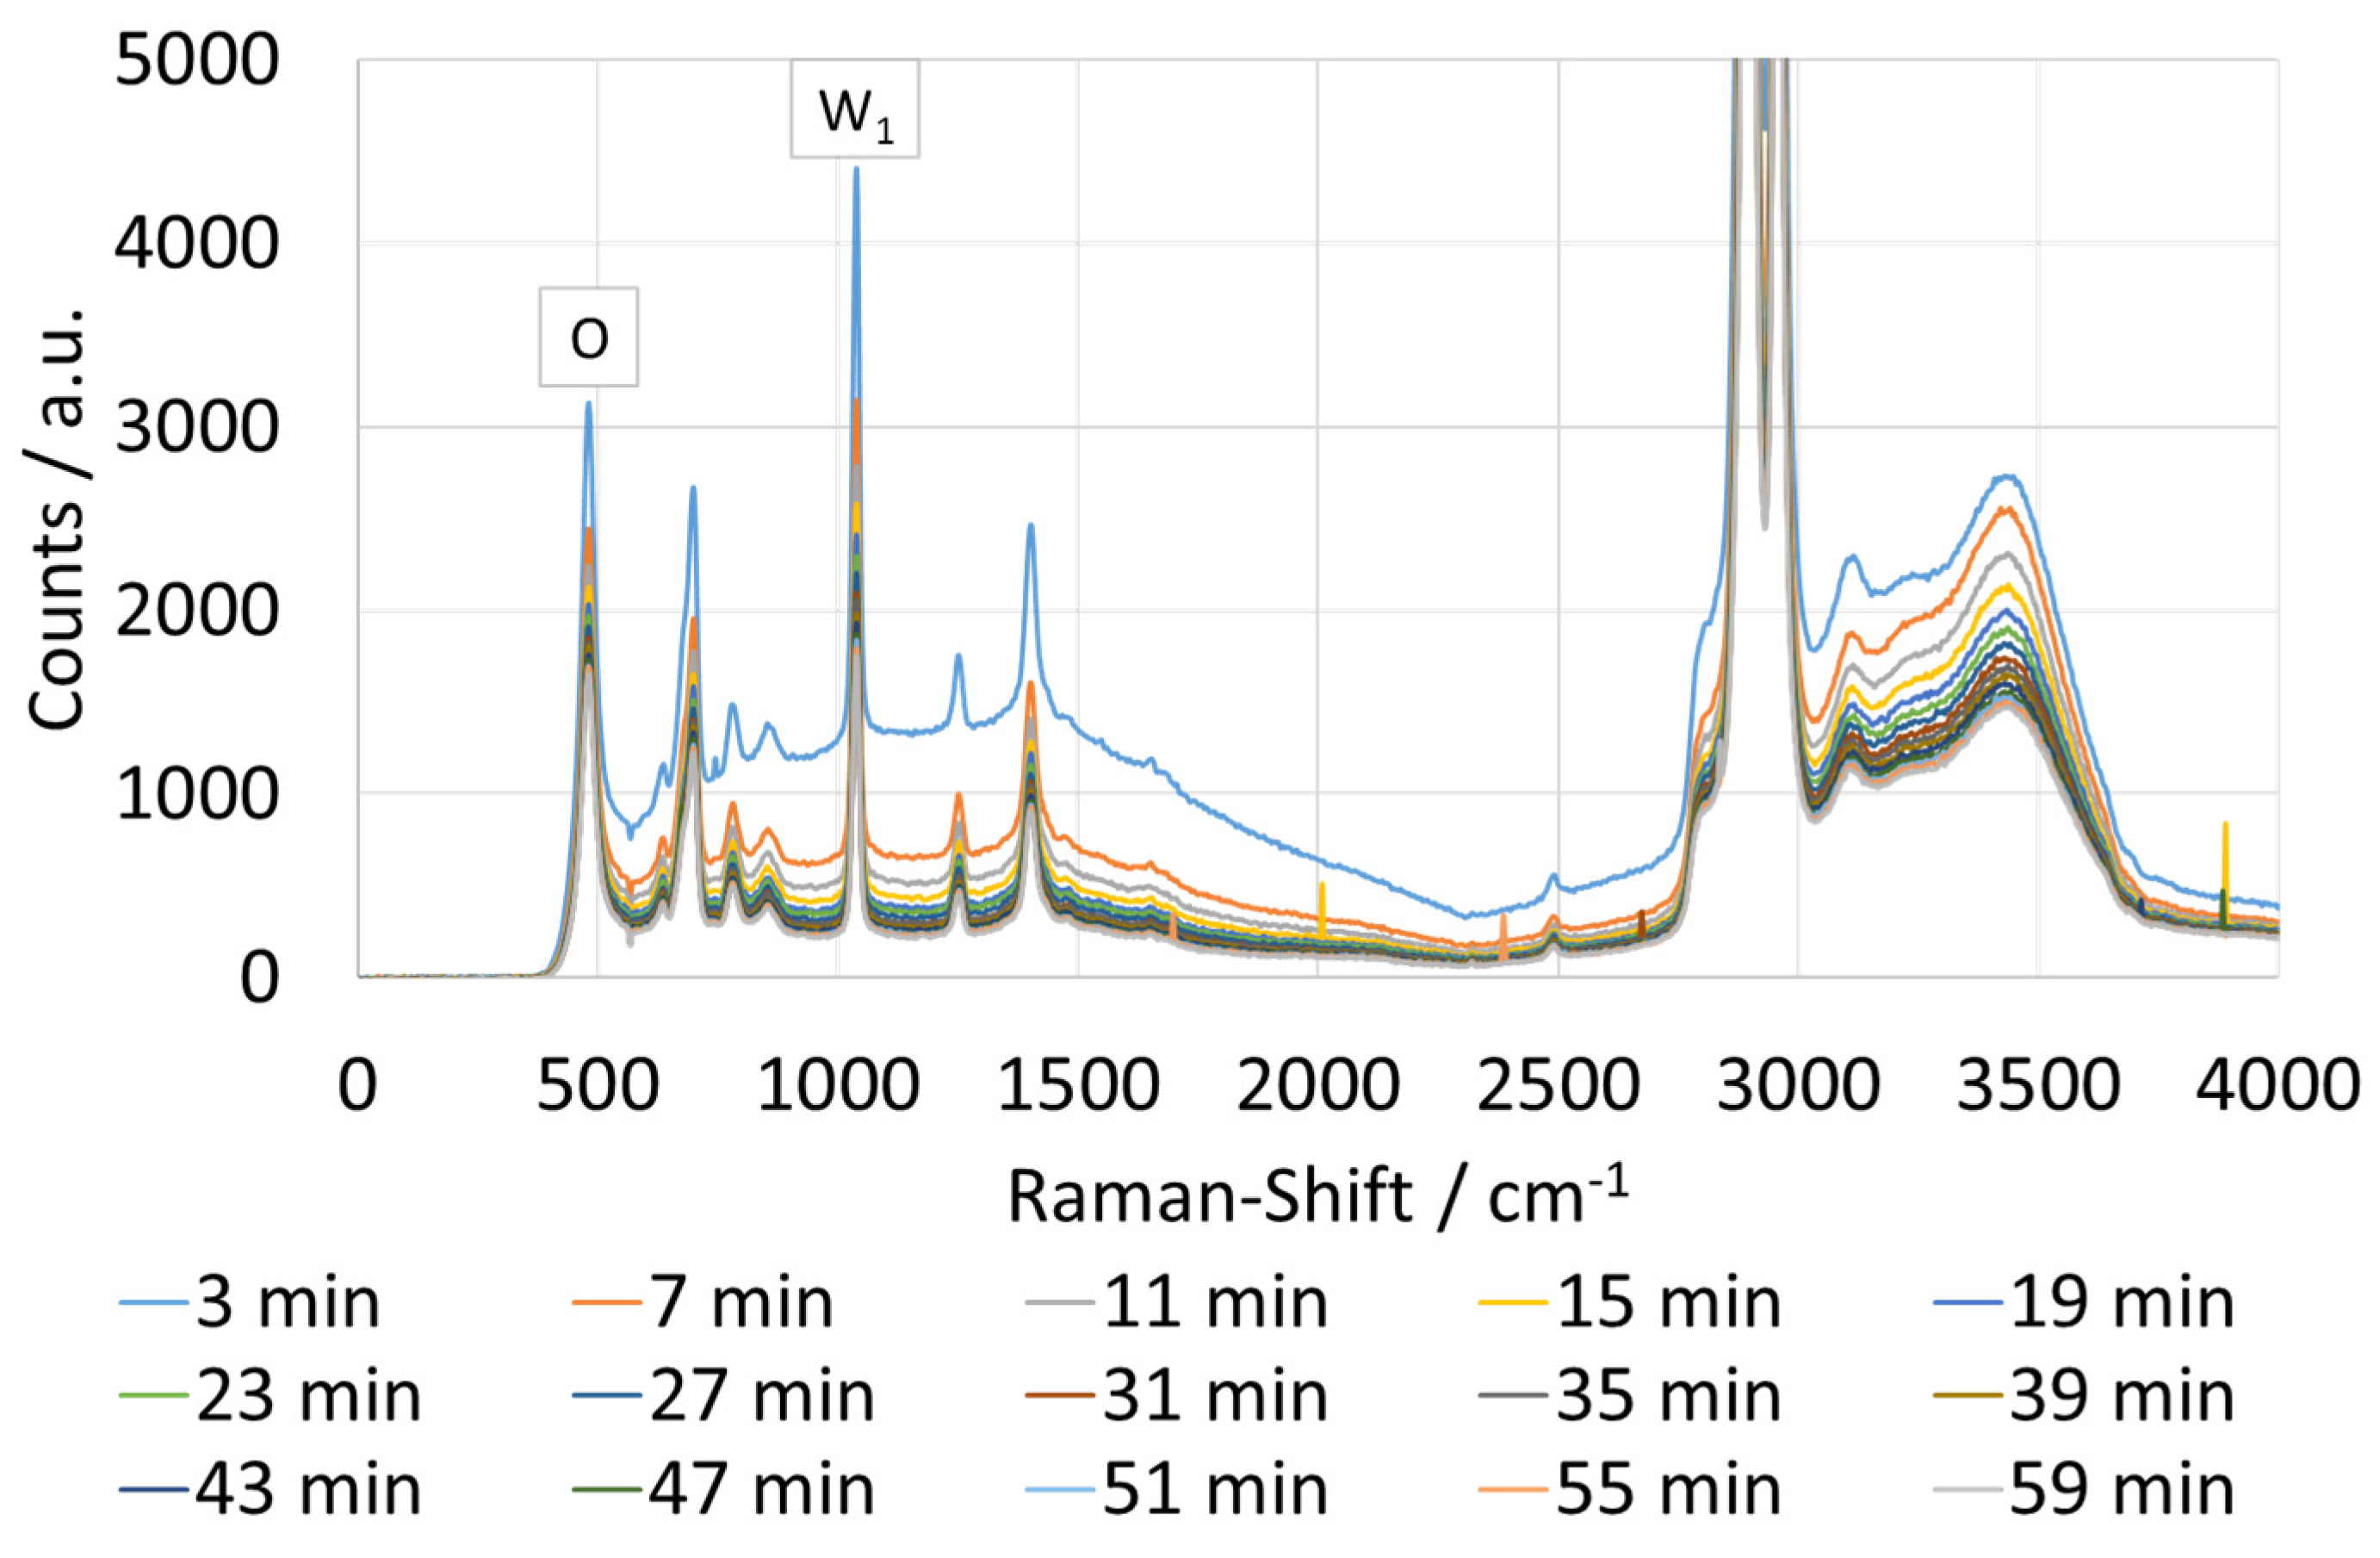
Figure 4 shows an example of the spectra from one measurement. The peak in the spectrum at 480 cm−1 is the oil peak, which is used to calculate filling degree changes. The changes in the internal water phase are tracked using the ammonium nitrate peak at 1047 cm−1. The spectra follow the trend that the peak heights decrease with increasing experimental time. Likewise, the offset, which is largest for the first measurements, decreases continuously.
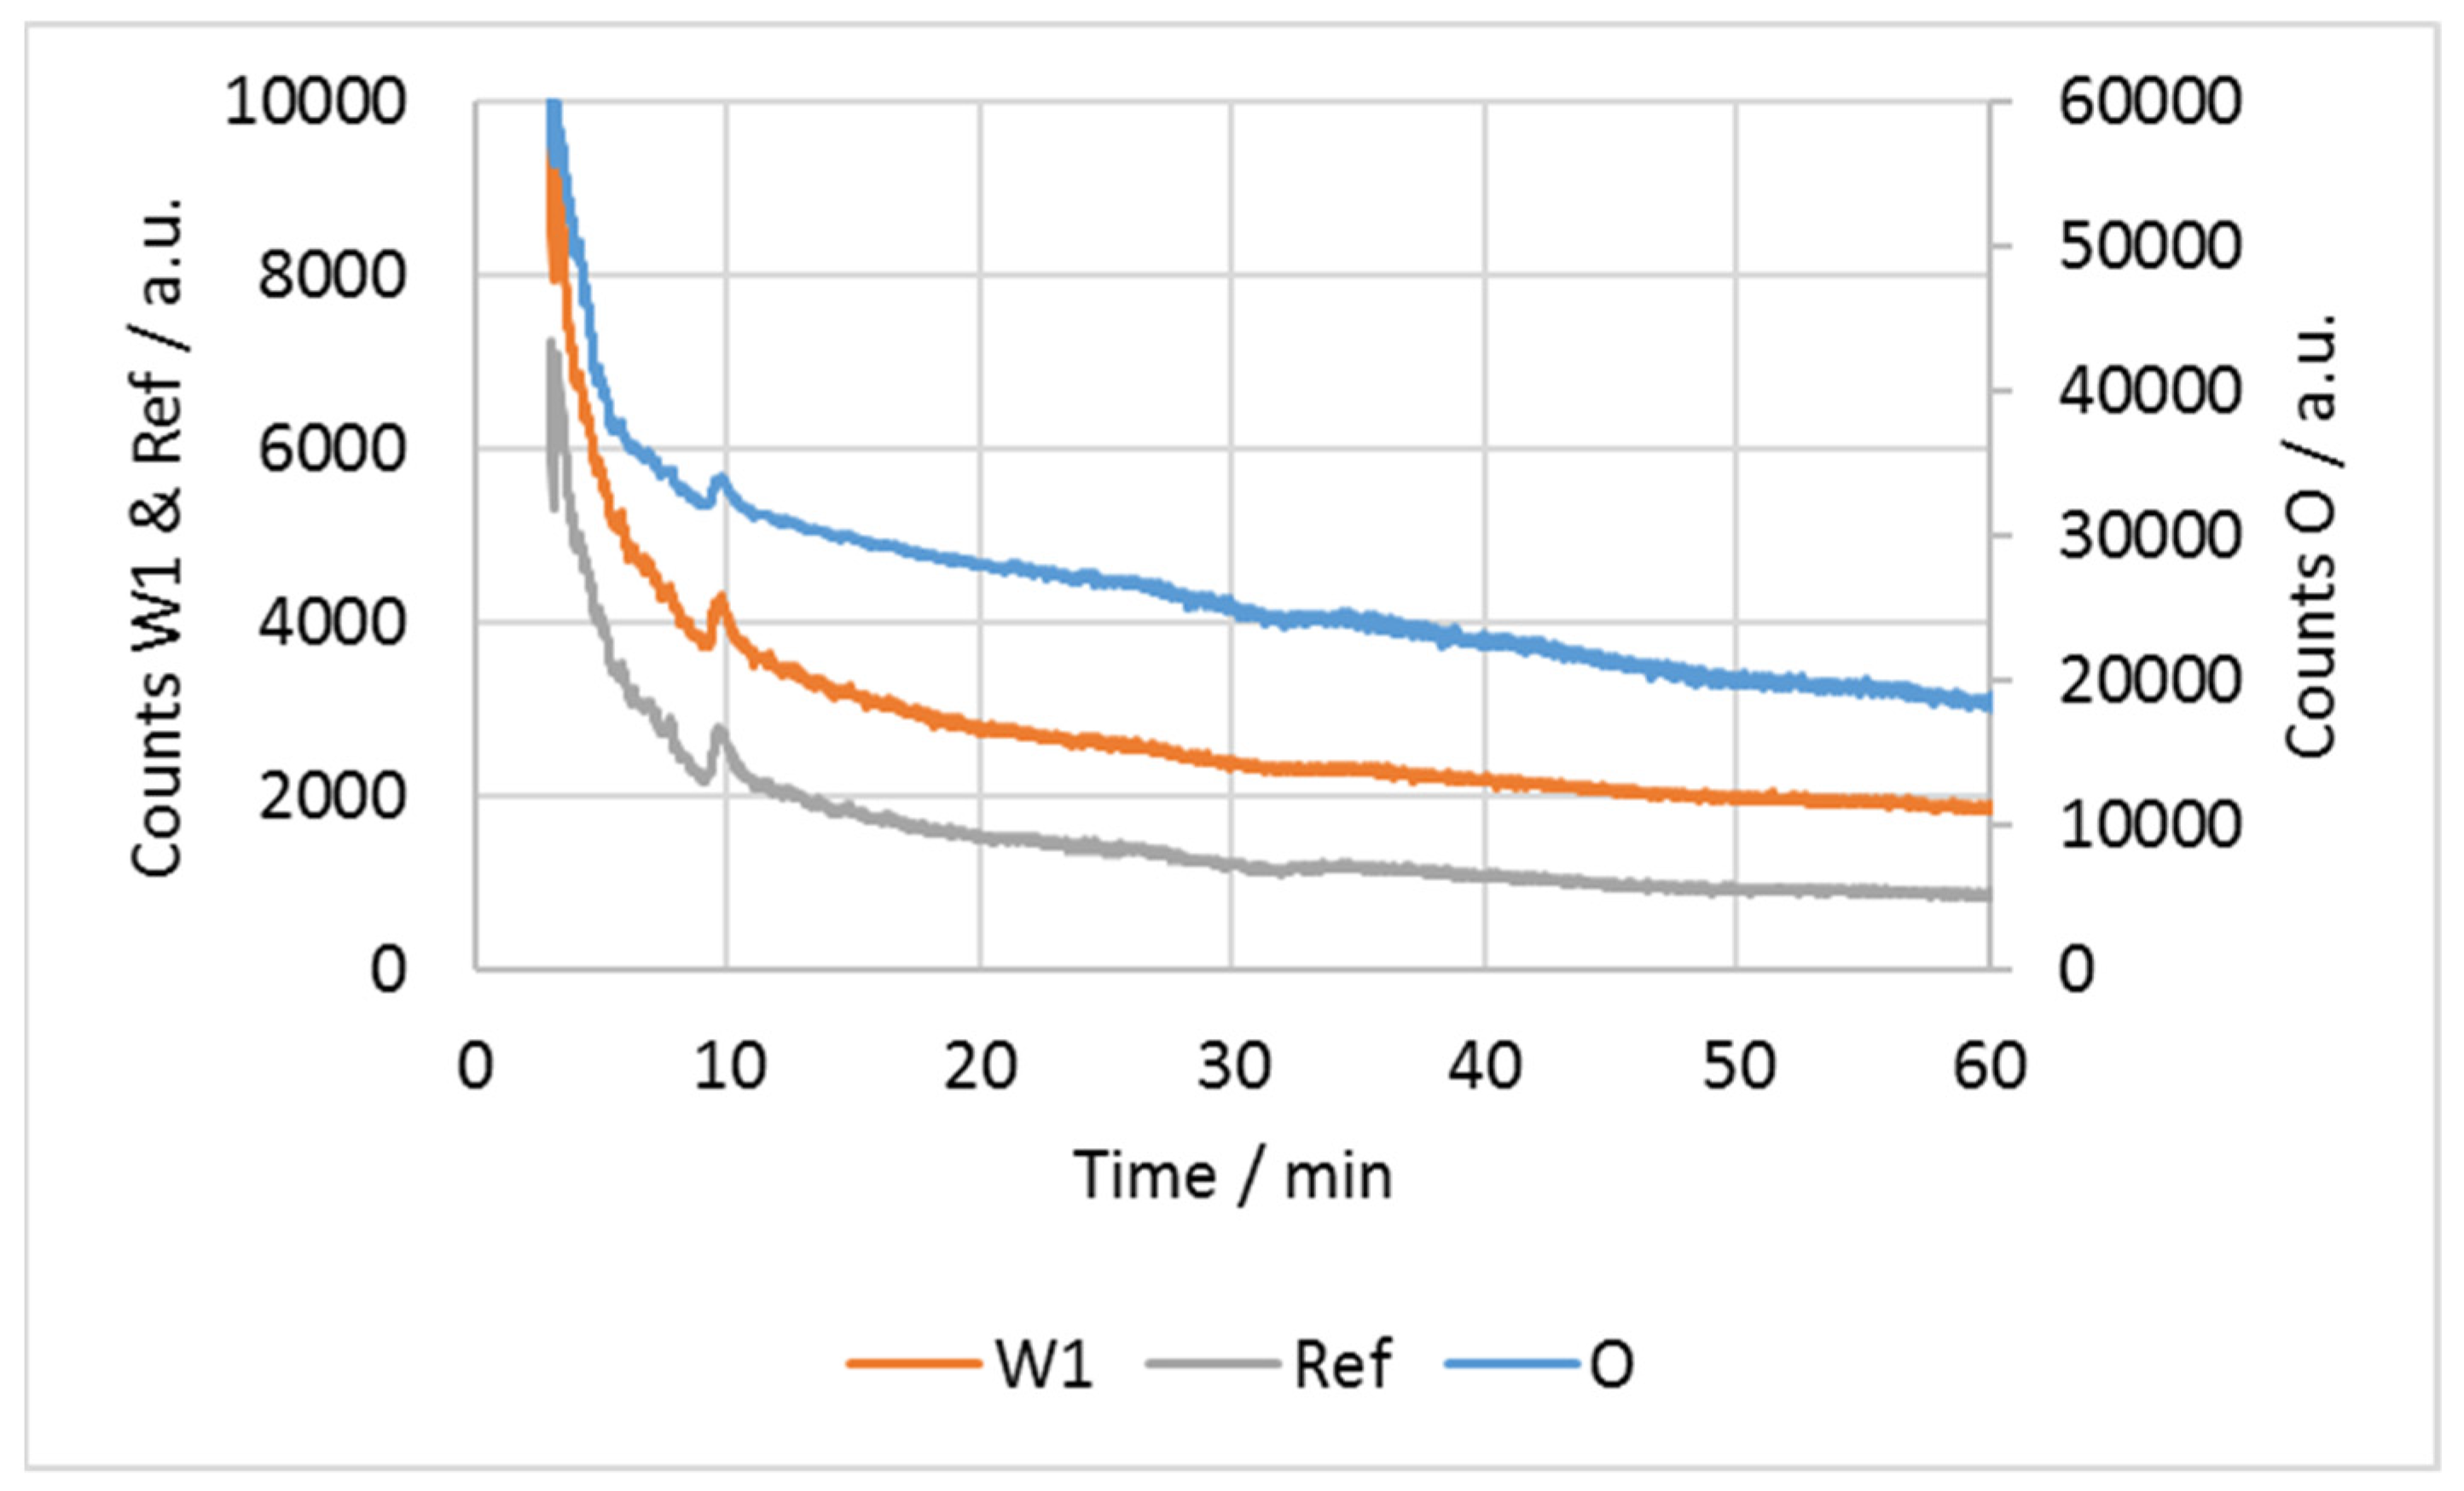
Figure 5 shows the course of the photometric data during a measurement. In the beginning, the signal decreases strongly, which indicates a pronounced water diffusion. After 10 min, the signal decreases less strongly, which indicates a decreasing difference in osmolalities between both water phases. Therefore, water diffusion is less pronounced.
Since the absolute values of the oil phase are significantly higher than those of the photometric data, they are plotted on a second y-axis. All three curves show the same course. Possible fluctuations, such as after just under 10 min, can be seen in each curve and can therefore be neglected as measurement artifacts.

3.5. Measured Relative Filling Degree Changes

The spectrometrically and photometrically measured relative filling degree change of a double emulsion droplet is shown in Figure 6. Both curves show a parallel progression, which initially rises sharply before changing to a slower growth. A clear maximum cannot be seen in either curve, which indicates an ongoing water diffusion.
Due to the significantly higher time resolution, the course of the photometric data is repeatedly subject to short-lived fluctuations, as can be seen, for example, after almost 10 min. These fluctuations are detected by all photometric channels and can therefore be neglected as measurement artifacts.

3.6. Changes in Filling Degree of Double Emulsion

Figure 7 summarizes all experiments. With increasing ammonium chloride content in the outer water phase, the filling degree of the double emulsions increases less strongly. A linear trend can be seen in each measurement series. Only for 15% ammonium chloride in the outer water phase, the trend is not observed. No trend can be seen for the standard deviations. They vary between 3% and 26% with a mean of 10%.
There is a significant difference between the two inner water phases. In the presence of PEG, the relative filling degree changes are smaller. It is also noticeable that the filling degrees determined by the photometer are substantially higher than those determined by the spectrometer.
Furthermore, the relative filling degree changes in one double emulsion droplet can be compared to the respective osmolality difference between the inner and outer water phase. As seen in Table 2, with decreasing osmolality difference, the relative filling degree change is decreasing, too. Again, for 15% ammonium chloride, the trend is broken.

4. Discussion

The measurement results in combination with the data evaluation in Figure 7 and Table 2 demonstrate the reliability of the Raman measurement method, both spectrometrically and photometrically. It is expected that the greater the difference in osmolalities, the greater the relative change. For all four measurement series, this trend can be observed for ammonium chloride concentrations from 0% to 10%.
For 15% ammonium chloride in the outer water phase, the trend is broken because of interactions of polyvinyl alcohol and ammonium chloride. A more detailed explanation is given in Section 4.1.
Therefore, the linear fit for each measurement series is based on three data points. However, since a linear fit with a Pearson coefficient of at least 0.96 is obtained four times, the linearity can be considered as valid.

4.1. Interactions of Ammonium Chloride and Polyvinyl Alcohol

The deviations of the relative filling degree changes at 15% ammonium chloride in the outer phase from the linear downward trend can be explained by an interaction between polyvinyl alcohol and ammonium chloride. In general, polyvinyl alcohol has a limited solubility for salts. Once the solubility limit is reached, polyvinyl alcohol coagulates, with the salt present above a specific threshold [44].
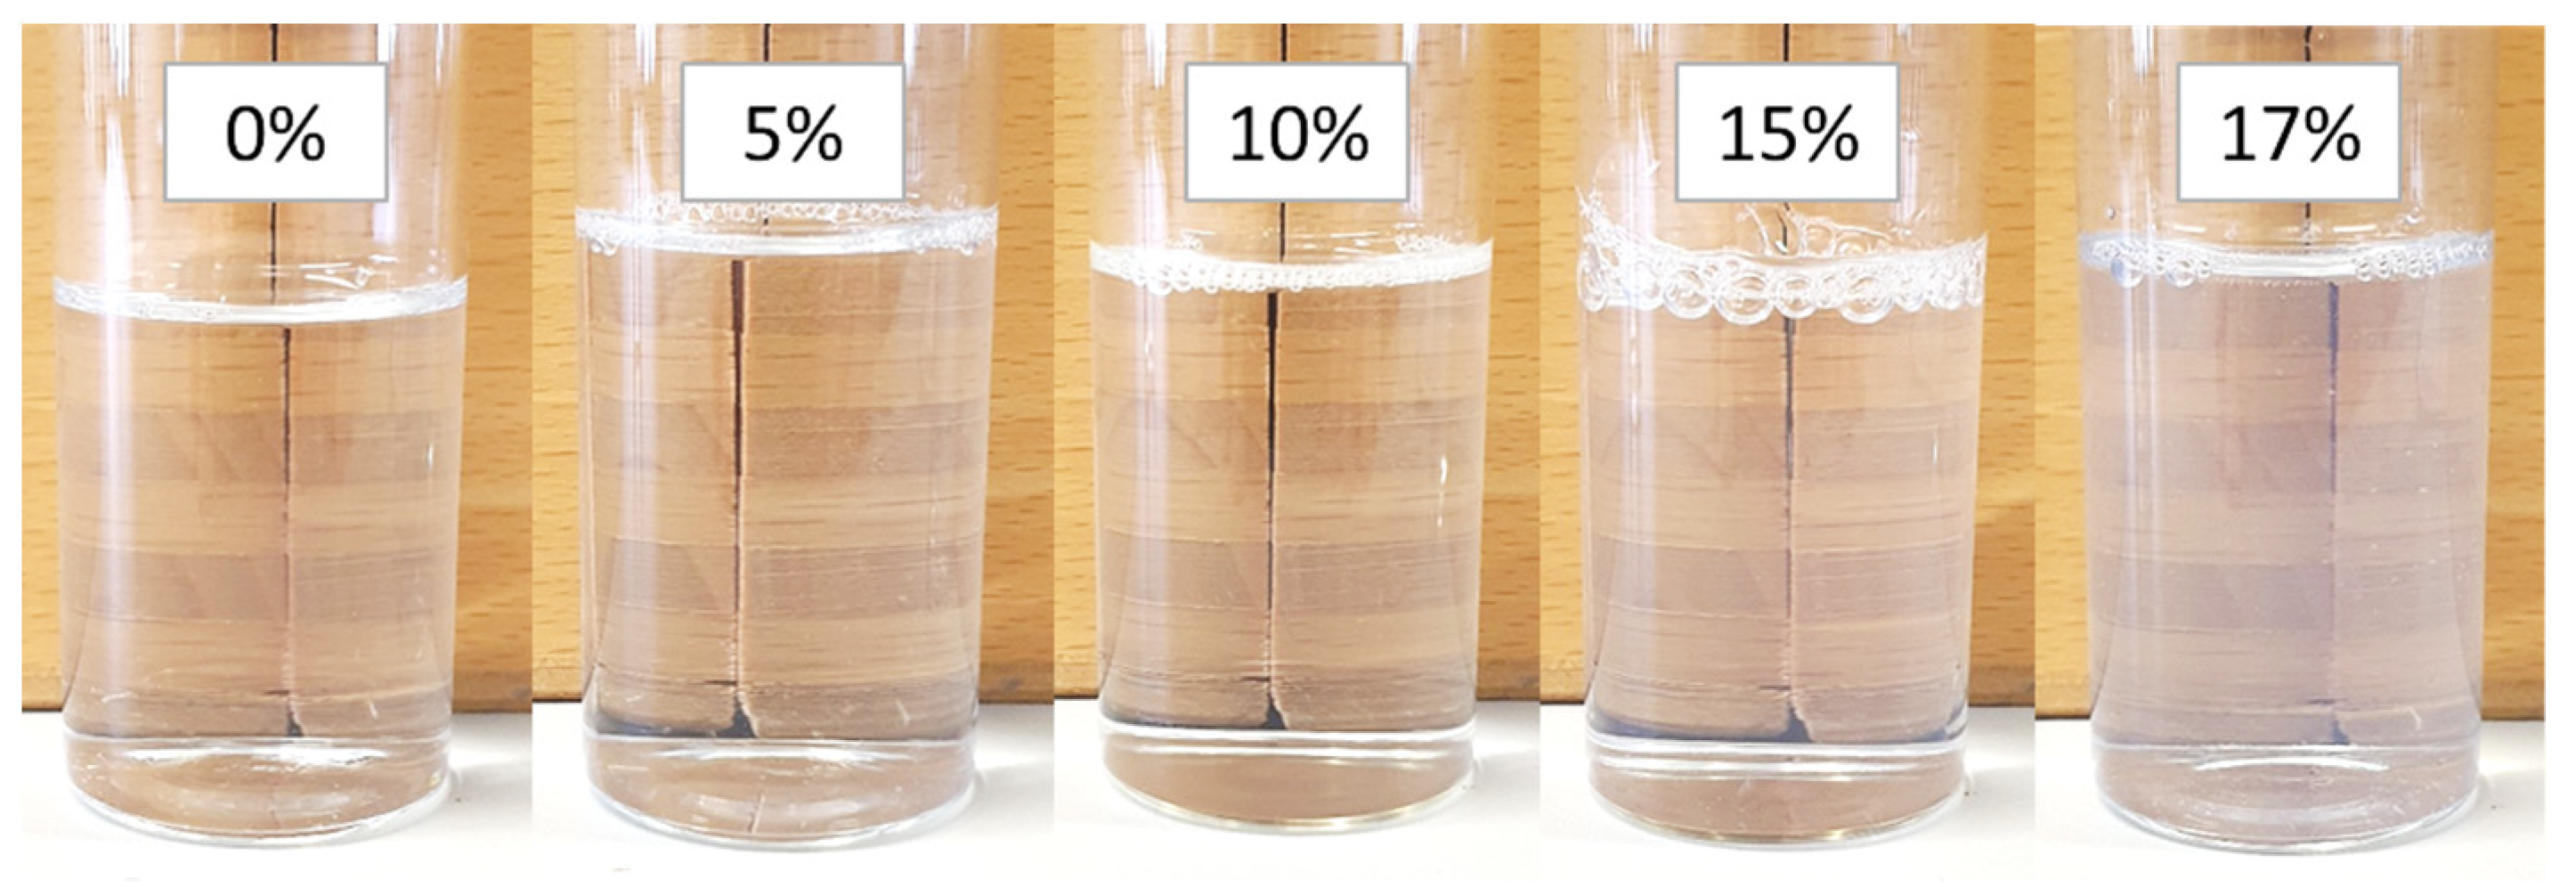
The solubility of ammonium chloride in a 2% PVOH solution was determined in advance of the experiments. At 15% ammonium chloride, a very weak and milky turbidity of the solution was observed, which represents the beginning of the coagulation. This is illustrated in Figure 8. At 17% ammonium chloride, a more pronounced turbidity can be seen, which indicates a progressive coagulation.
As a result of the coagulation, the measurements with 15% ammonium chloride in the outer water phase do not follow the downward trend as for 0%–10% ammonium chloride in the outer water phase. Since this is not a metrological but a chemical problem, the measurements with 15% ammonium chloride in the outer water phase are not considered in the evaluation.

4.2. Correlation between Decreasing Signal and Increasing Filling Degree

With increasing filling degree, the oil signals decrease. This phenomenon can be explained by the two schemes in Figure 9, showing the focal volume of the Raman probe, which is located inside the double emulsion droplets. Accordingly, the inner emulsion is in the focal volume. At the start of the experiment, small drops of water are present in the oil phase. When water diffuses from the outer water phase into these water droplets, these droplets become larger. As they swell, oil that was previously in the focus volume of the laser is displaced from it. Therefore, with increasing water diffusion, less oil is measured and its signal decreases accordingly.
The mass of solvate in the individual droplets remains constant during the measurement. However, while swelling, some inner water droplets will be displaced from the focal volume and the total solvate content in the focal volume decreases. This leads to a decrease in the ammonium nitrate signal.
The decreasing ammonium nitrate concentration leads to a decrease in the refractive index of the inner water phase. With increasing diffusion, an increasingly greater amount of laser emission is reflected at the phase boundary between the oil and the inner droplets, resulting in a decrease of the excitation and the Raman signal of the inner water phase. In order to exclude the refractive index influence on the filling degree change, only the signal of the oil phase is considered for the evaluation.

4.3. Difference between Spectrometric and Photometric Filling Degree Changes

Figure 6 shows the relative filling degree changes measured spectrometrically and photometrically. The difference between both datasets is striking, as the photometric values are approximately 20–25% higher than the spectrometric ones.
This can be explained by the different integration times in combination with the evaluation based on equation (1). In general, spectrometers require longer integration times than photometers. Accordingly, the integration times are 1 s for the photometer and 2 min for the spectrometer. Thus, the photometer provides the first data point after one second, when hardly any relative filling degree changes had occurred. In contrast, the spectrometer measures a changing signal for two minutes and produces an averaged data point. During the measurement time, relative filling degree chances had already occurred, resulting in a different first data point compared to the photometric one. Since all further data points are normalized to the respective first data point for evaluation, there will always be a difference between the two measurement methods. Because of the much higher time resolution, it can be assumed that the photometric signal is quantitatively more precise than the spectrometric signal. Nevertheless, with 2 min integration time, the spectrometric data provides accurate qualitative filling degree changes.

4.4. Decreasing Fluorescence during Measurement

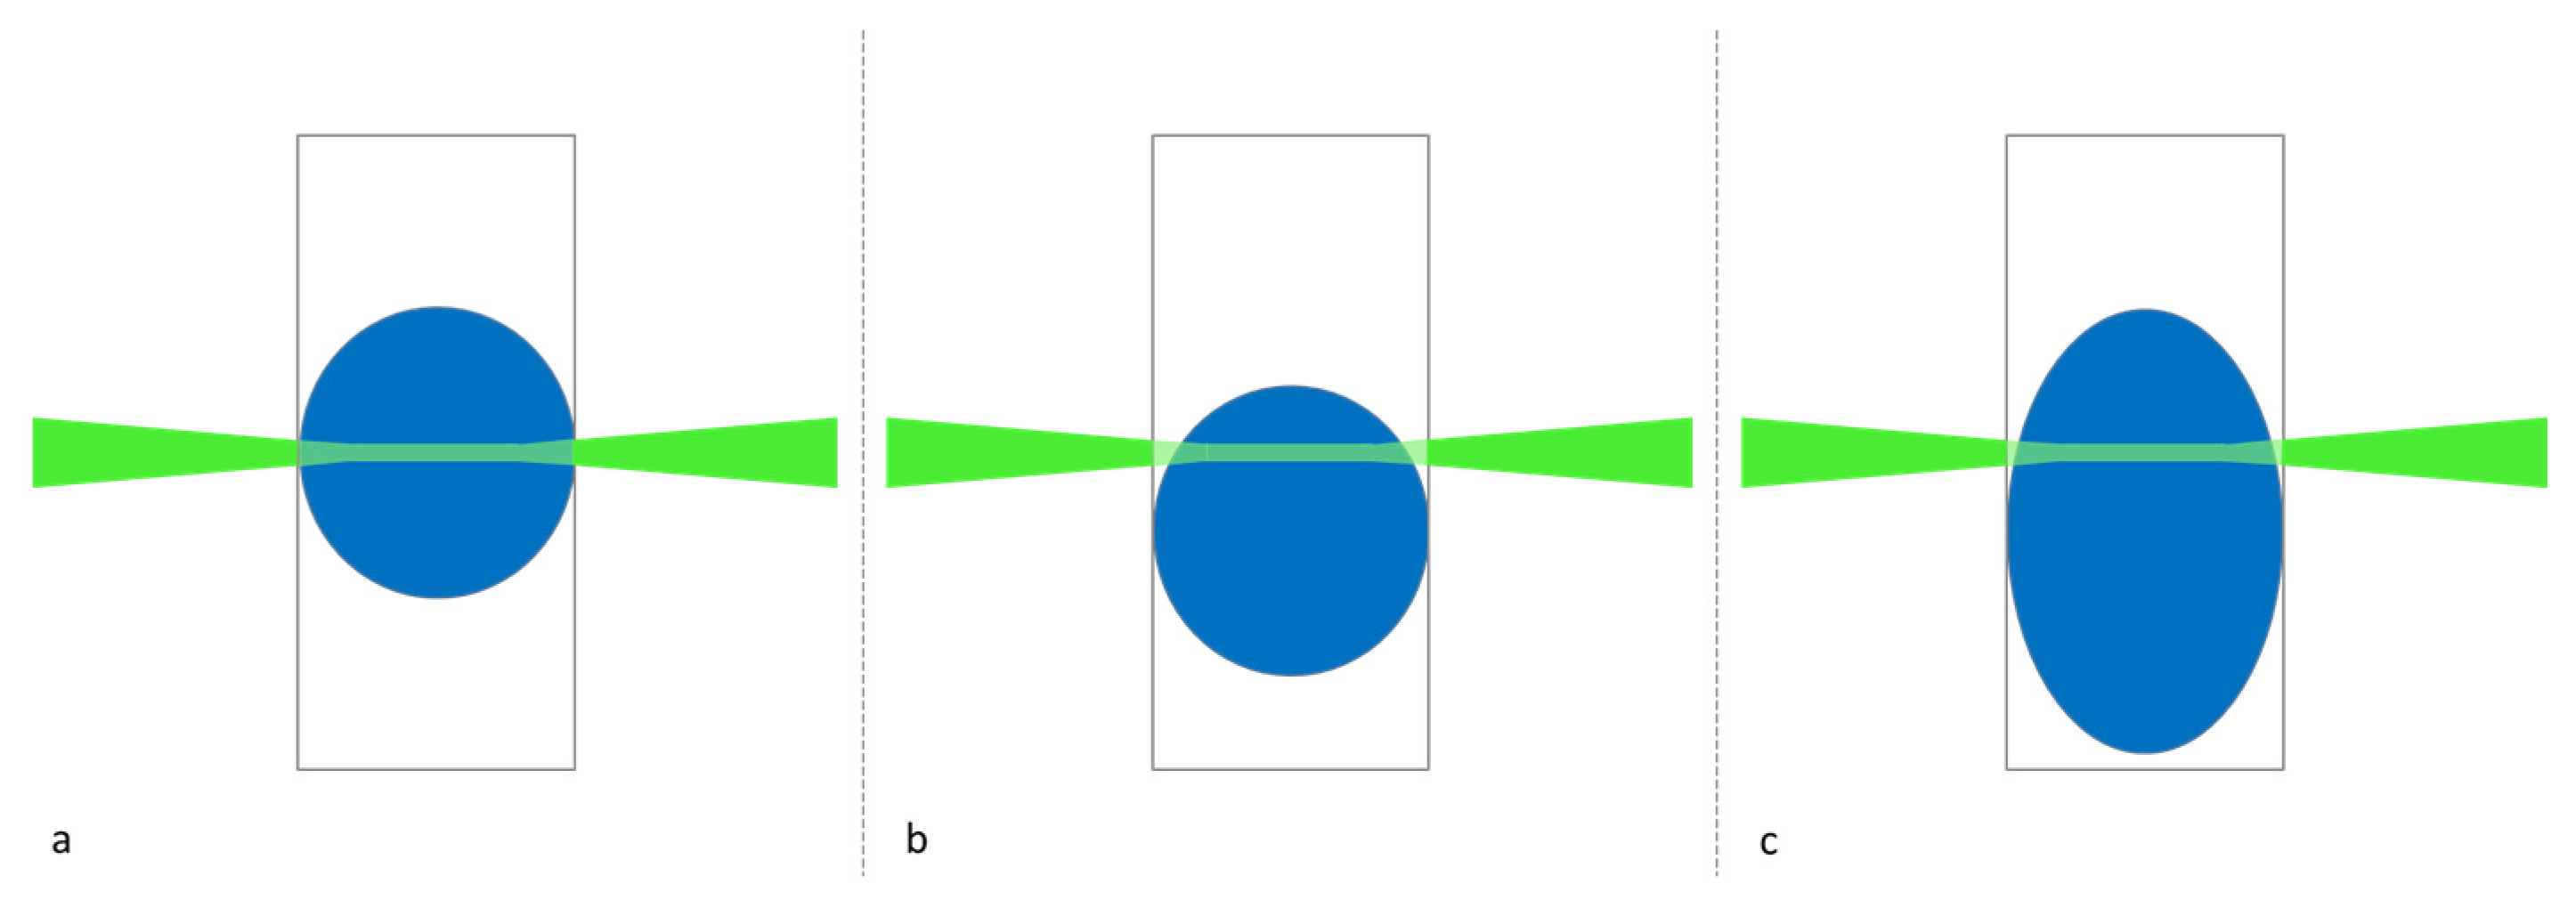
The occasionally strong fluorescence in the first measurements followed by measurements with less intense fluorescence, as seen in Figure 4, is caused by the manual positioning of the droplet in the laser and the resulting detection of the outer water phase. Figure 10 shows three measurement conditions schematically. In case (a), the laser hits the double emulsion droplet perfectly in the centre, so that the influence of the external phase is negligible.
Due to the manual positioning of the double emulsion droplet in the laser, it is not always hit exactly in the centre. Case (b) shows schematically what happens at the beginning of the measurement. The laser hits the droplet in the upper area. This also excites the outer phase, which fluoresces, and causes fluorescence in the spectrum. In the further course of the experiment, case c, the droplet swells due to water diffusion, so that the outer phase is displaced from the laser. Accordingly, the fluorescence input by the outer phase decreases and the offset in the spectrum is smaller.

5. Conclusions

In conclusion, for both Raman measurement methods, spectrometrically and photometrically, it is possible to reliably monitor filling degree changes in W1/O/W2 double emulsion droplets caused by water diffusion. This can be undertaken during the development of new formulations of double emulsions and to analyze existing double emulsion formulations, thereby creating more knowledge about diffusion in double emulsions and how it affects their stability. In doing so, both methods have their advantages and disadvantages.
Regarding the higher quantitative accuracy, the photometric method is preferred as it can track the filling degree changes more precisely due to its higher time resolution. However, the accuracy of the spectrometric method can be increased by reducing the integration time. Based on the size of the oil peak in Figure 4, it can also be expected that this can be significantly reduced. To obtain the shortest possible integration time for spectrometers, the signal to noise ratio needs to be considered for the oil peak. In general, a signal to noise ratio of 3 is sufficient for spectrometric measurements. Here, since the signal is decreasing, we would recommend a signal to noise ratio of 10.
An advantage of the spectrometer, on the other hand, is represented by Raman spectra, which, for example, also allow fluorescence influences to be detected. Possible improvements for fluorescence problems include, firstly, if possible, using non-fluorescent species in all double emulsion phase, which prevents the fluorescence input beforehand. Secondly, as long as the fluorescent species is only present in the outer water phase, initially larger double emulsion droplets or a smaller measurement capillary will reduce the impact of fluorescence.
Furthermore, the method of choice also depends on the experimental goal as well as the equipment and budget available, respectively.

Author Contributions

Conceptualization, T.H., N.L. and H.P.K.; methodology, T.H. and M.R.; validation, T.H.; formal analysis, T.H., N.L., M.R. and H.P.K.; investigation, T.H. and R.S.; resources, T.H.; data curation, T.H.; writing—original draft preparation, T.H. and N.L.; writing—review and editing, T.H., N.L., R.S., M.R. and H.P.K.; visualization, T.H.; supervision, M.R. and H.P.K.; project administration, T.H.; funding acquisition, N.L., M.R. and H.P.K. All authors have read and agreed to the published version of the manuscript.

Funding

This research received no external funding.

Institutional Review Board Statement

Not applicable.

Informed Consent Statement

Not applicable.

Data Availability Statement

The presented data is publicly archived in the KIT respiratory [42].

Acknowledgments

We acknowledge support by the KIT-Publication Fund of the Karlsruhe Institute of Technology. Special thanks are given to Goran Vladisavljević for providing the Lego®-Device.

Conflicts of Interest

The authors declare no conflict of interest.

Appendix A

Table A1. Details regarding the optical filters. *** Full width half maximum. ** Edge wavelength. *** AHF analysentechnik AG, Tübingen, Germany. **** Laser 2000, Wessling, Germany.
FilterCenter WavelengthFWHM*Supplier
Long pass filter542 nm **-AHF ***
Silicone oil546 nm12.9 nmAHF ***
Reference561 nm2Laser 2000 ****
Ammonium nitrate564 nm2Laser 2000 ****

References

  1. Tan, C.; McClements, D.J. Application of Advanced Emulsion Technology in the Food Industry: A Review and Critical Evaluation. Foods 2021, 10, 812. [Google Scholar] [CrossRef] [PubMed]
  2. Schuch, A.; Tonay, A.N.; Köhler, K.; Schuchmann, H.P. Influence of the second emulsification step during production of W/O/W multiple emulsions: Comparison of different methods to determine encapsulation efficiency in W/O/W emulsions. Can. J. Chem. Eng. 2014, 92, 203–209. [Google Scholar] [CrossRef]
  3. Bai, L.; Huan, S.; Rojas, O.J.; McClements, D.J. Recent Innovations in Emulsion Science and Technology for Food Applications. J. Agric. Food Chem. 2021, 69, 8944–8963. [Google Scholar] [CrossRef]
  4. Leister, N.; Karbstein, H.P. Evaluating the Stability of Double Emulsions—A Review of the Measurement Techniques for the Systematic Investigation of Instability Mechanisms. Colloids Interfaces 2020, 4, 8. [Google Scholar] [CrossRef] [Green Version]
  5. Rosano, H.; Gandolfo, F.G.; Hidrot, J.-D.P. Stability of W1/O/W2 multiple emulsions influence of ripening and interfacial interactions. Colloids Surf. A Physicochem. Eng. Asp. 1998, 138, 109–121. [Google Scholar] [CrossRef]
  6. Sela, Y.; Magdassi, S.; Garti, N. Release of markers from the inner water phase of W/O/W emulsions stabilized by silicone based polymeric surfactants. J. Control. Release 1995, 33, 1–12. [Google Scholar] [CrossRef]
  7. Eisinaite, V.; Duque Estrada, P.; Schroën, K.; Berton-Carabin, C.; Leskauskaite, D. Tayloring W/O/W emulsion composition for effective encapsulation: The role of PGPR in water transfer-induced swelling. Food Res. Int. 2018, 106, 722–728. [Google Scholar] [CrossRef] [PubMed]
  8. Khadem, B.; Khellaf, M.; Sheibat-Othman, N. Investigating swelling-breakdown in double emulsions. Colloids Surf. A Physicochem. Eng. Asp. 2020, 585, 124181. [Google Scholar] [CrossRef]
  9. Khadem, B.; Sheibat-Othman, N. Modeling droplets swelling and escape in double emulsions using population balance equations. Chem. Eng. J. 2020, 382, 122824. [Google Scholar] [CrossRef]
  10. Garti, N.; Bisperink, C. Double emulsions: Progress and applications. Curr. Opin. Colloid Interface Sci. 1998, 3, 657–667. [Google Scholar] [CrossRef]
  11. Neumann, S.M.; van der Schaaf, U.S.; Karbstein, H.P. Investigations on the relationship between interfacial and single droplet experiments to describe instability mechanisms in double emulsions. Colloids Surf. A Physicochem. Eng. Asp. 2018, 553, 464–471. [Google Scholar] [CrossRef]
  12. Leister, N.; Yan, C.; Karbstein, H.P. Oil Droplet Coalescence in W/O/W Double Emulsions Examined in Models from Micrometer- to Millimeter-Sized Droplets. Colloids Interfaces 2022, 6, 12. [Google Scholar] [CrossRef]
  13. Lamba, H.; Sathish, K.; Sabikhi, L. Double Emulsions: Emerging Delivery System for Plant Bioactives. Food Bioprocess. Technol. 2015, 8, 709–728. [Google Scholar] [CrossRef]
  14. McClements, D.J. Encapsulation, protection, and release of hydrophilic active components: Potential and limitations of colloidal delivery systems. Adv. Colloid Interface Sci. 2015, 219, 27–53. [Google Scholar] [CrossRef]
  15. Muschiolik, G.; Dickinson, E. Double Emulsions Relevant to Food Systems: Preparation, Stability, and Applications. Compr. Rev. Food Sci. Food Saf. 2017, 16, 532–555. [Google Scholar] [CrossRef] [Green Version]
  16. Saffarionpour, S.; Diosady, L.L. Multiple Emulsions for Enhanced Delivery of Vitamins and Iron Micronutrients and Their Application for Food Fortification. Food Bioprocess. Technol. 2021, 14, 587–625. [Google Scholar] [CrossRef]
  17. McClements, D.J.; Jafari, S.M. Improving emulsion formation, stability and performance using mixed emulsifiers: A review. Adv. Colloid Interface Sci. 2018, 251, 55–79. [Google Scholar] [CrossRef] [PubMed]
  18. Dickinson, E. Double Emulsions Stabilized by Food Biopolymers. Food Biophys. 2011, 6, 1–11. [Google Scholar] [CrossRef]
  19. Leister, N.; Karbstein, H.P. Influence of Hydrophilic Surfactants on the W1–W2 Coalescence in Double Emulsion Systems Investigated by Single Droplet Experiments. Colloids Interfaces 2021, 5, 21. [Google Scholar] [CrossRef]
  20. Kanouni, M.; Rosano, H.; Naouli, N. Preparation of a stable double emulsion (W1/O/W2): Role of the interfacial films on the stability of the system. Adv. Colloid Interface Sci. 2002, 99, 229–254. [Google Scholar] [CrossRef]
  21. Yafei, W.; Tao, Z.; Gang, H. Structural evolution of polymer-stabilized double emulsions. Langmuir 2006, 22, 67–73. [Google Scholar] [CrossRef] [PubMed]
  22. Nazir, H.; Zhang, W.; Liu, Y.; Chen, X.; Wang, L.; Naseer, M.M.; Ma, G. Silicone oil emulsions: Strategies to improve their stability and applications in hair care products. Int. J. Cosmet. Sci. 2014, 36, 124–133. [Google Scholar] [CrossRef] [PubMed]
  23. Garti, N. Progress in Stabilization and Transport Phenomena of Double Emulsions in Food Applications. LWT—Food Sci. Technol. 1997, 30, 222–235. [Google Scholar] [CrossRef]
  24. Schuch, A.; Wrenger, J.; Schuchmann, H.P. Production of W/O/W double emulsions. Part II: Influence of emulsification device on release of water by coalescence. Colloids Surf. A Physicochem. Eng. Asp. 2014, 461, 344–351. [Google Scholar] [CrossRef]
  25. Regan, J.O.; Mulvihill, D.M. Water soluble inner aqueous phase markers as indicators of the encapsulation properties of water-in-oil-in-water emulsions stabilized with sodium caseinate. Food Hydrocoll. 2009, 23, 2339–2345. [Google Scholar] [CrossRef]
  26. Hai, M.; Magdassi, S. Investigation on the release of fluorescent markers from w/o/w emulsions by fluorescence-activated cell sorter. J. Control. Release 2004, 96, 393–402. [Google Scholar] [CrossRef]
  27. Schuster, S.; Bernewitz, R.; Guthausen, G.; Zapp, J.; Greiner, A.M.; Köhler, K.; Schuchmann, H.P. Analysis of W1/O/W2 double emulsions with CLSM: Statistical image processing for droplet size distribution. Chem. Eng. Sci. 2012, 81, 84–90. [Google Scholar] [CrossRef]
  28. Guan, X.; Hailu, K.; Guthausen, G.; Wolf, F.; Bernewitz, R. Schuchmann HPPFG-NMR on W 1 /O/W 2 -emulsions: Evidence for molecular exchange between water phases. Eur. J. Lipid Sci. Technol. 2010, 112, 828–837. [Google Scholar] [CrossRef]
  29. Van Duynhoven, J.P.M.; Goudappel, G.J.W.; van Dalen, G.; van Bruggen, P.C.; Blonk, J.C.G.; Eijkelenboom, A.P.A.M. Scope of droplet size measurements in food emulsions by pulsed field gradient NMR at low field. Magn. Reson. Chem. 2002, 40, S51–S59. [Google Scholar] [CrossRef]
  30. Bernewitz, R. Charakterisierung von Doppelemulsionen Mittels NMR und CLSM-Struktur und Diffusion; Verlag Dr. Hut: Munich, Germany, 2013. [Google Scholar]
  31. Schuch, A.; Köhler, K.; Schuchmann, H.P. Differential scanning calorimetry (DSC) in multiple W/O/W emulsions. J. Anal. Calorim. 2013, 111, 1881–1890. [Google Scholar] [CrossRef]
  32. Neumann, S.M.; van der Schaaf, U.S.; Karbstein, H.P. Structure stability and crystallization behavior of water in oil in water (WOW) double emulsions during their characterization by differential scanning calorimetry (DSC). J. Therm. Anal. Calorim. 2018, 133, 1499–1508. [Google Scholar] [CrossRef]
  33. Goldrick, S.; Lovett, D.; Montague, G.; Lennox, B. Influence of Incident Wavelength and Detector Material Selection on Fluorescence in the Application of Raman Spectroscopy to a Fungal Fermentation Process. Bioengineering 2018, 5, 79. [Google Scholar] [CrossRef] [PubMed] [Green Version]
  34. Saletnik, A.; Saletnik, B.; Puchalski, C. Overview of Popular Techniques of Raman Spectroscopy and Their Potential in the Study of Plant Tissues. Molecules 2021, 26, 1537. [Google Scholar] [CrossRef] [PubMed]
  35. Petersen, M.; Yu, Z.; Lu, X. Application of Raman Spectroscopic Methods in Food Safety: A Review. Biosensors 2021, 11, 187. [Google Scholar] [CrossRef]
  36. Meyer, T.; Akimov, D.; Tarcea, N.; Chatzipapadopoulos, S.; Muschiolik, G.; Kobow, J.; Schmitt, M.; Popp, J. Three-dimensional molecular mapping of a multiple emulsion by means of CARS microscopy. J. Phys. Chem. B 2008, 112, 1420–1426. [Google Scholar] [CrossRef]
  37. Hufnagel, T.; Rädle, M.; Karbstein, H.P. Influence of Refractive Index Differences on the Signal Strength for Raman-Spectroscopic Measurements of Double Emulsion Droplets. Appl. Sci. 2022, 12, 9056. [Google Scholar] [CrossRef]
  38. Hufnagel, T.; Stoy, R.; Rädle, M.; Karbstein, H.P. Measurement of the Filling Degree and Droplet Size of Individual Double Emulsion Droplets Using Raman Technologies. Chemosensors 2022, 10, 463. [Google Scholar] [CrossRef]
  39. Bandulasena, M.V.; Vladisavljević, G.T.; Benyahia, B. Versatile reconfigurable glass capillary microfluidic devices with Lego® inspired blocks for drop generation and micromixing. J. Colloid Interface Sci. 2019, 542, 23–32. [Google Scholar] [CrossRef]
  40. Utada, A.S.; Lorenceau, E.; Link, D.R.; Kaplan, P.D.; Stone, H.A.; Weitz, D.A. Monodisperse double emulsions generated from a microcapillary device. Science 2005, 308, 537–541. [Google Scholar] [CrossRef] [Green Version]
  41. Guo, S.; Bocklitz, T.; Popp, J. Optimization of Raman-spectrum baseline correction in biological application. Analyst 2016, 141, 2396–2404. [Google Scholar] [CrossRef] [Green Version]
  42. Hufnagel, T.; Leister, N.; Stoy, R.; Rädle, M.; Karbstein, H.P. Research Data to “Monitoring of Osmotic Swelling Induced Filling Degree Changes in WOW Double Emulsions Using Raman Technologies”; Karlsruher Institut für Technologie (KIT): Karlsruhe, Germany, 2023. [Google Scholar]
  43. Kuchenbecker, P.; Gemeinert, M.; Rabe, T. Inter-laboratory Study of Particle Size Distribution Measurements by Laser Diffraction. Part. Part. Syst. Charact. 2012, 29, 304–310. [Google Scholar] [CrossRef]
  44. Kurary Poval™. Kuraray Poval™—Basic Physical Properties of PVOH Resin; Kurary Poval™: Tokyo, Japan, 2022. [Google Scholar]
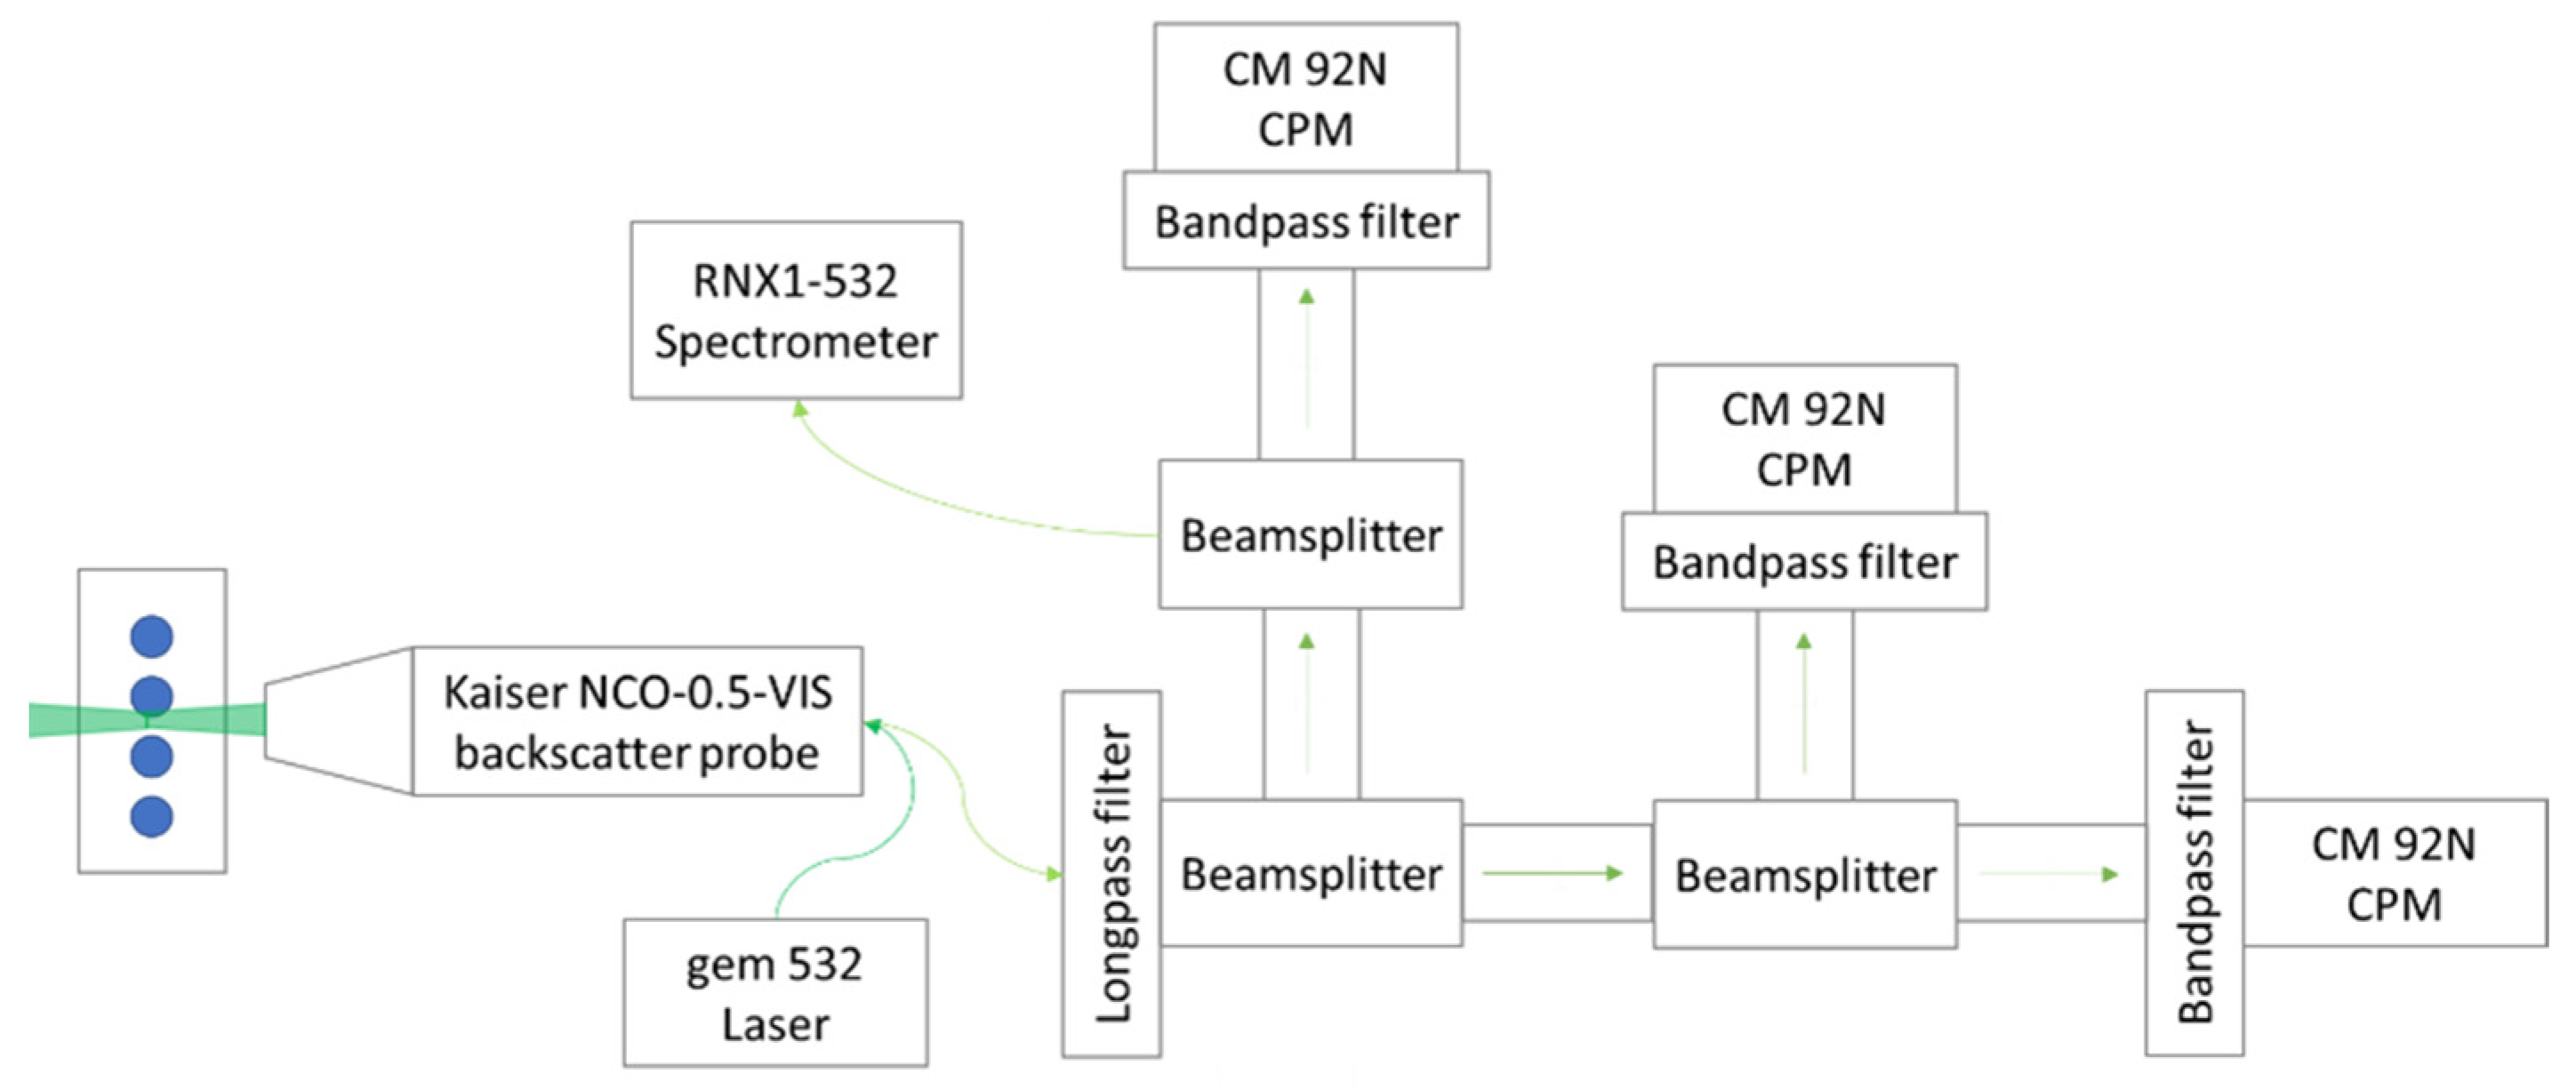
Figure 1. Schematic illustration of the measurement system. The focus is on the measurement technology components; details of the emulsification technology are not included [38].
Chemosensors 11 00206 g001
Figure 2. Section of the spectra of the individually measured phases of the double emulsions. In addition, the limits of the bandpass filters used are shown: dotted lines—oil phase; dashed lines—reference; solid lines—ammonium nitrate and inner water phase, respectively.
Chemosensors 11 00206 g002
Figure 3. Sum distributions of the droplet sizes of all inner emulsions. Each emulsion was measured threefold.
Chemosensors 11 00206 g003
Figure 4. Progress of the spectra of one measurement series. The inner water phase contained 49% ammonium nitrate, the concentration of ammonium chloride in the outer phase was 10%.
Chemosensors 11 00206 g004
Figure 5. Courses of the three photometric channels during an exemplary measurement. The inner phase contained 49% ammonium nitrate, the outer phase 10% ammonium chloride. A second y-axis was implemented for the oil phase to make it easier to visually compare the data sets. W1: signal of ammonium nitrate in inner water phase, Ref: signal of the reference, O: signal of the oil phase.
Chemosensors 11 00206 g005
Figure 6. Results of the spectrometric and photometric measurements of the relative filling degree change of one droplet. The inner phase contained 49% ammonium nitrate, the outer phase, besides polyvinyl alcohol, 10% ammonium chloride.
Chemosensors 11 00206 g006
Figure 7. Summary of all performed experiments. The relative change in filling degree versus the ammonium chloride concentration of the outer water phase is plotted. For the concentration range 0% to 10%, linear trend lines are also present, all with a Pearson coefficient of at least R = 0.9626. At 15% ammonium chloride in the external water phase, the linear trends are interrupted, which is why they are plotted separately.
Chemosensors 11 00206 g007
Figure 8. Comparison of the four outer water phases used plus another two percent polyvinyl alcohol solution with 17% ammonium chloride. No turbidity can be seen between 0% and 10%. At 15%, a very weak turbidity can be seen, which is more pronounced at 17%.
Chemosensors 11 00206 g008
Figure 9. Schematic representation of the diffusion processes in the focal volume. At the start of the measurement, t = 0 min, smaller water droplets with a high solvate concentration (dark blue) are present. As the measurement time progresses, t > 0 min, water diffuses from the outer phase into the inner droplets. This causes the droplets to swell and the solvate concentration to decrease (light blue).
Chemosensors 11 00206 g009
Figure 10. Effect of the positioning of the droplet in the laser. (a): The droplet is positioned centrally in the laser, thus the outer phase has no significant effect on the measurement. (b): The droplet is not positioned centrally in the laser. As a result, proportionally more outer phase is detected. (c): During the measurement, the droplet becomes larger, which means that less outer water phase is detected.
Chemosensors 11 00206 g010
Table 1. Summary of the osmolalities of the individual aqueous emulsion phases. * These values are extrapolated. ** These values are measured.
PhaseCompositionOsmolality [mOsm/kg]
W149% ammonium nitrate10,255 *
24.5% ammonium nitrate + 24.5% polyethyleneglycol5788 *
W22% poly vinylalcohol 26—886 **
2% poly vinylalcohol 26—88 + 5% ammonium chloride1877 **
2% poly vinylalcohol 26—88 + 10% ammonium chloride3717 *
2% poly vinylalcohol 26—88 + 15% ammonium chloride5581 *
Table 2. Comparison of the osmolality difference and relative filling degree change for each investigated double emulsion. AN: ammonium nitrate. ACL: ammonium chloride. PEG: Polyethylene glycol.
W1W2Osmolality Difference
W1 – W2/
mOsm/kg
Relative Filling Degree Change/%
SpectrometerPhotometer
49% AN0% ACL10,24956.589.8
5% ACL837850.984.3
10% ACL653843.873.3
15% ACL467439.571.7
24.5% AN
+
24.5% PEG
0% ACL578248.876.2
5% ACL391139.961.8
10% ACL207125.747.4
15% ACL20732.948.7
Disclaimer/Publisher’s Note: The statements, opinions and data contained in all publications are solely those of the individual author(s) and contributor(s) and not of MDPI and/or the editor(s). MDPI and/or the editor(s) disclaim responsibility for any injury to people or property resulting from any ideas, methods, instructions or products referred to in the content.