Abstract
A dinitrophenol-based colorimetric chemosensor sequentially sensing Cu2+ and S2−, HDHT ((E)-2-(2-(2-hydroxy-3,5-dinitrobenzylidene)hydrazineyl)-N,N,N-trimethyl-2-oxoethan-1-aminium), was designed and synthesized. The HDHT selectively detected Cu2+ through a color change of yellow to colorless. The calculated detection limit of the HDHT for Cu2+ was 6.4 × 10⁻² μM. In the interference test, the HDHT was not considerably inhibited by various metal ions in its detection of Cu2+. The chelation ratio of the HDHT to Cu2+ was determined as 1:1 by using a Job plot and ESI-MS experiment. In addition, the HDHT–Cu2+ complex showed that its color selectively returned to yellow only in the presence of S2−. The detection limit of the HDHT–Cu2+ complex for S2− was calculated to be 1.2 × 10⁻¹ μM. In the inhibition experiment for S2−, the HDHT–Cu2+ complex did not significantly interfere with other anions. In the real water-sample test, the detection performance of the HDHT for Cu2+ and S2− was successfully examined. The detection features of HDHT for Cu2+ and the HDHT–Cu2+ for S2− were suggested by the Job plot, UV–Vis, ESI-MS, FT-IR spectroscopy, and DFT calculations.
1. Introduction
Various detection methods for metal ions and anions are used, such as atomic absorption–emission spectrometry, surface-plasmon resonance detectors, the electrochemical method, inductively coupled plasma detectors and the fluorescence technique [1,2]. However, these methods need technical operators, costly equipment, and, in some cases, significant time and cost [3,4,5,6]. Compared to the methods above, the colorimetric chemosensing method is not only simple and fast but is also used for on-site tests [7,8,9,10].
Among the diverse trace metal ions, Cu2+ performs a significant role in living organisms [11,12,13]. However, the excessively accumulation of Cu2+ can result in significant damage to the nervous system, which induces Alzheimer’s, Menkes, and Wilson’s diseases [14,15,16,17,18]. Due to the hazardous effect of Cu2+, the Environmental Protection Agency (EPA) limits the acceptable Cu2+ concentration in drinking water to 20 µM [19]. Thus, the presence and quantities of Cu2+ should be continuously monitored [20]. Sulfide (S2−) is reported to perform an important role in biological systems, such as apoptosis, vasodilation, infections caused by inflammation, angiogenesis, and neurological disorders [21,22]. However, sulfide a high levels is known as a toxic and hazardous contaminant material [23,24,25]. The guideline of S2− in freshwater suggested by the WHO is 14.8 µM [26]. Nevertheless, sulfide is widely and easily detected in various environments, such as industries, pesticides, automobiles, bleaching powder, and even the natural environment [27,28,29]. Therefore, there is a need to develop methods to detect sulfide easily, quickly, and conveniently in both environmental and biological systems [30]. Interestingly, the chemosensors detecting Cu2+ could be used to detect S2− due to the formation of the stable CuS compound (Ksp = 6.3 × 10−36) [31]. Therefore, if a sensor detecting Cu2+ were to be developed, it could be used as a sensor for detecting S2−.
Several colorimetric chemosensors have been developed for sequential Cu2+ and S2− detection, to date (Table S1). These chemosensors have diverse chromophores, such as benzo[c][1,2,5]thiadiazole [1], benzo[d]thiazole [21], and fluorescein [32] moieties, as well as long conjugation systems [21,31,33], to induce dramatic color changes. In addition, the functional groups inducing the intramolecular-charge transfer (ICT) properties were applied to the design of colorimetric chemosensors [30,31,34,35]. However, many of them have difficulty in efficiently detecting Cu2+ and S2− in water due to their low solubility [1,36,37]. The poor water solubility of these chemosensors is a major drawback for their application to real environmental samples. Therefore, designing chemosensors to probe Cu2+ and S2− in water is a significant challenge.
From this point of view, we utilized the dinitrophenol and (hydrazinocarbonylmethyl)trimethylammonium chloride (Girard’s Reagent T) moieties to develop a highly water-soluble chemosensor based on ICT. A strong electron-withdrawing nitro group (-NO2) acts as an electron acceptor in electron-push-–pull design, and this property of the nitro group could be a useful chromophore [38,39,40]. Therefore, the dinitrophenol with two nitro groups was selected as a chromophore group. In addition, the nitro-phenol group may provide a chelating site for metal ions. Next, a very water-soluble molecule, Girard’s Reagent T, was selected as another functional group to increase the solubility of a designed chemosensor in water [41,42,43]. These characteristics of the compounds led us to expect that a molecule produced from the combination of the dinitrophenol and Girard’s reagent T could be used as a chemosensor to detect metal ions, such as Cu2+, in water.
In this paper, we present a newly synthesized dinitrophenol-based chemosensor, HDHT. The chemosensor HDHT could sense Cu2+ with a color change of yellow to colorless in near-perfect water. Moreover, the HDHT-Cu2+ could analyze S2− through the demetallation of Cu2+ from the HDHT-Cu2+ with a color change of colorless to yellow. Importantly, the detection limits (6.4 × 10⁻² μM and 1.2 × 10⁻¹ μM) of the HDHT for Cu2+ and S2− were below the guidelines (20 μM and 14.8 μM) suggested by the EPA and the WHO, respectively. The binding features of the HDHT to the Cu2+ and the HDHT-Cu2+ to the S2− were explained by UV–Visible titrations, Job plot, ESI-MS, FT-IR spectroscopy, and density-functional-theory calculations.
2. Experimental Section
2.1. Materials and Instrumentations
The (Hydrazinocarbonylmethyl)trimethylammonium chloride (Girard’s Reagent T) and 3,5-dinitrosalicyladehyde were obtained from Alfa Aesar and TCI. The Bis-tris buffer was acquired from Sigma Aldrich. Buffer solutions of pH 1–13 were obtained from Samchun in Korea. Varian and Perkin Elmer spectrometers were used to obtain 1H & 13C NMR and absorption spectra. Varian 640-IR and Thermo MAX instrument were used to obtain FT-IR and ESI-MS spectra.
2.2. Synthesis of Chemosensor HDHT ((E)-2-(2-(2-Hydroxy-3,5-dinitrobenzylidene)hydrazineyl)-N,N,N-trimethyl-2-oxoethan-1-aminium) Chloride)
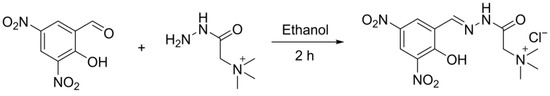
The HDHT was synthesized by the imine-formation reaction of Girard’s Reagent T and 3,5-dinitrosalicyladehyde. Girard’s reagent T (1.71 × 10² mg, 1 mmol) was added to ethanol 20 mL. Subsequently, 3,5-Dinitrosalicyladehyde (2.38 × 10² mg, 1.1 mmol) was added to the solution. The mixture was stirred for 3 h at 22 °C. The powder filtered was washed with ethanol. After drying in a vacuum, an orange powder was obtained. Yield: 332.9 mg (92 %). 1H NMR (400 MHz, DMF-d7): δ = 12.15 (s, 0.55 H), 9.02 (s, 0.56 H), 8.90 (d, 0.56 H), 8.86 (d, 0.56 H), 8.75 (d, 0.44 H), 8.68 (s, 0.44 H), 8.58 (d, 0.44 H), 5.10 (s, 0.88 H), 4.75 (s, 1.12 H), 3.60 (s, 3.96 H), 3.58(s, 5.06 H); 13C NMR (175 MHz, DMSO-d6): δ =165.47, 161.72, 160.45, 159.32, 145.53, 141.27, 137.83, 137.66, 135.70, 133.08, 127.08, 126.79, 124.30, 124.26, 123.68, 123.16, 63.10, 62.28, 53.61, 53.35. ESI-MS: m/z calcd for ([HDHT − H+])−, 360.07; found, 359.69 and ([HDHT + MeOH − H+])−, 392.10; found, 391.89.
2.3. UV–Vis Titration
The HDHT (3.7 mg, 1 × 10⁻⁵ mol) was dissolved in DMSO (1 mL) to make a 10-millimolar HDHT stock solution. To make 20 mM of a Cu2+ stock solution, Cu(NO3)2 (23.7 mg, 1 × 10⁻¹ mmol) was dissolved in 5.0 × 10⁻³ L of bis-tris buffer. The HDHT solution (30 µM) was produced by diluting 9 µL of 10 mM HDHT into a 2991-microliter buffer. Next, 0–58.5 µL of the Cu2+ stock (2 × 10⁻³ M) was added to 30 µM of the prepared HDHT solution. The UV–Vis titration was performed in 5 s.
For S2−, 3 mL of a 10-micromolar HDHT-Cu2+ stock was produced by diluting 1 mL of an HDHT stock (30 mM) and 1.95 mL of a Cu(NO3)2 stock (2 × 10⁻² M) to 0.05 mL buffer. In total, 9 μL of the prepared HDHT-Cu2+ stock (1 × 10⁻² M) was transferred to 2991 μL of the buffer. Next, 0–15.3 µL of Na2S stock (0.01 M) was added to 30 µM of complex stock solution. The UV–Vis titration was performed in 5 s.
2.4. Job-Plot Analysis
To prepare 1 mL of a 10-micromolar HDHT stock solution, HDHT (1 × 10⁻² mmol, 3.7 × 10⁻³ g) was dissolved in 1000 μL of DMSO. A Cu2+ solution (10 mM) with its nitrate salt was acquired in a 1000 = microliter buffer solution. In total, 3–27 μL of the HDHT stock were transferred to several quartzes. Furthermore, 3–27 μL of the Cu2+ solution were added to diluted HDHT. Each quartz was filled with bis-tris buffer to create a 3000-microliter solution with a total concentration of 0.1 mM. Next, UV–Vis spectra were collected.
2.5. UV–Vis Inhibition Tests
The HDHT (3.7 mg, 1 × 10⁻⁵ mol) was dissolved in DMSO (1000 μL). The various metal-cation stocks (Ni2+, Cu2+, Ga3+, Fe3+, In3+, Hg2+, Zn2+, Na+, Cd2+, Fe3+, Mg2+, Ca2+, Cr3+, Ag+, Pb2+, K+, Mn2+, Co2+, and Al3+) were prepared by dissolving 1 × 10⁻⁴ mol of each metal cation in 5 × 10⁻³ L of buffer, respectively. In total, 5.9 × 10⁻⁶ L of each metal ion (2 × 10⁻² M) and Cu2+ (20 mM) were added into 3 × 10⁻³ L buffer. Next, 9 × 10⁻⁶ L of the HDHT stock (10 mM) were added to the solution. After mixing the mixture for 5 s, an inhibition test was performed.
For S2−, the HDHT (1 × 10⁻⁵ mol, 3.7 mg) was dissolved in 1 mL DMSO, and Cu(NO3)2 (23.7 mg, 1 × 10⁻⁴ mmol) was dissolved in 5.0 mL of buffer. Next, 100 μL of the HDHT stock and 65 μL of the Cu2+ stock were diluted by 835 μL of buffer to make 1 mM of HDHT-Cu2+ complex solution. Stock solutions containing 100 mM of Et4NF, Et4NBr, Et4NCl, Et4NI, Et4NCN, Bu4N(OAc), Bu4N(H2PO4), Bu4N(SCN), Bu4N(BzO), Na2S, Bu4N(N3), and NaNO2 were prepared by dissolving 5 × 10⁻⁴ mol of each anion in 5.0 mL of buffer, respectively. Next, 1.5 μL of each anion (100 mM) and S2− (100 mM) were added into a 2.904-milliliter bis-tris buffer. A total of 90 μL of the HDHT-Cu2+ (1 mM) was transferred to the solution. An inhibition test was performed in 5 s.
2.6. pH Test
The HDHT (3.7 mg, 1 × 10⁻² mmol) was dissolved in DMSO (1.0 mL). To prepare 3 × 10⁻² mM 9 µL of the HDHT stock, (1 mM) was transferred to 2994 μL of each pH buffer. The Cu(NO3)2 (2.37 × 10⁻² g, 1 × 10⁻¹ mmol) was dissolved in 5 mL of buffer. Next, 6.5 × 10⁻² mL of the Cu2+ stock was transferred to the pH buffer solution. A pH test was performed in 5 s.
For S2−, HDHT (3.7 × 10⁻³ g, 1 × 10⁻² mmol) was dissolved in DMSO (1 × 10⁻³ L), and 23.7mg (0.1 mmol) of Cu(NO3)2 was liquefied in 5.0-milliliter bis-tris buffer. Next, 100 μL of the HDHT stock and 65 μL of the Cu2+ stock were diluted by 835 μL of buffer to prepare 1 mM of HDHT–Cu2+-complex solution. A S2− stock (100 mM) was prepared by dissolving Na2S (0.5 mmol, 1.22 × 10² mg) in 5 mL of the bis-tris buffer. A total of 90 µL of the HDHT-Cu2+ stock (1 × 10⁻³ M) was transferred to 2.91 × 10⁻³ L of each pH solution to make 3 × 10⁻² mM. Next, 1.5 × 10⁻³ mL of the Na2S stock (0.1 M) was added to each pH solution. A pH test was performed in 5 s.
2.7. Real-Water-Sample Detection
The drinking and tap water for the real-water-sample experiment was obtained in our laboratory. A 10-millimolar stock of HDHT was created by dissolving HDHT (3.7 × 10⁻³ g, 1 × 10⁻² mmol) in DMSO (1000 μL). The Cu(NO3)2 (23.7 mg, 100 μmol) was dissolved in 5 mL of buffer (10 mM, pH 7.00) to prepare a Cu2+ stock (20 mM). In total, 9 × 10⁻³ mL of the 10-micromolar HDHT stock were added to 2.997 mL of drinking or tap water, which contained Cu2+ (9.0 µM). The UV–Vis spectra were taken in 5 s.
For sulfide, 10 mM of a HDHT (3.7 × 10⁻³ g, 1 × 10⁻² mmol) stock dissolved in DMSO (1000 μL), and 20 mM of a Cu(NO3)2 (23.7 mg, 0.1 mmol) stock dissolved in 5.0 mL of buffer were prepared. Next, to make 1 mM of HDHT-Cu2+ stock, 100 μL of the HDHT stock and 65 μL of the Cu2+ stock were diluted in 835 μL of the buffer. A total of 90 μL of this diluted HDHT-Cu2+ (1 × 10⁻³ M) was added to 2940 μL of a sample solution containing S2− (4.5 μM). The UV–Vis spectra were taken in 5 s.
2.8. Theoretical Calculations
To investigate the detection mechanism of the HDHT for Cu2+, the Gaussian16 program was used for calculations based on B3LYP density functional [44,45,46]. Basis sets of 6–31G (d,p) [47,48] and Lanl2DZ [49] were employed for calculations of elements and Cu2+. Neither the HDHT-Na nor the HDHT-Cu2+ form exhibited imaginary frequencies, resulting in local minima. The effect of water as solvent was considered by employing IEFPCM [50]. With the optimized patterns of HDHT and HDHT-Cu2+, 20 of the lowest singlet states were calculated with TD-DFT method to study their transition states.
3. Results and Discussion
3.1. Synthesis and Structural Characteristics of HDHT
A novel nitrophenol-based chemosensor HDHT was produced via the condensation reaction of Girard’s Reagent T and 3,5-dinitrosalicyladehyde (Scheme 1). The HDHT was verified with 1H NMR, 13C NMR, and ESI-MS (Figures S1–S3). The HDHT showed two different structures with rotational isomers (syn and anti; Figures S1 and S2). The rotational isomers appear with the rotation of the C–N bond in amide [51,52]. The DFT calculations showed that the optimized anti isomer was slightly more stable than the syn isomer, by 2.95 kcal/mol (Figure S4). The calculation results were matched with the 1H NMR spectrum of the HDHT, resulting in a ratio of 44:56 (syn:anti) (Figure S1).
Scheme 1.
Synthesis of HDHT.
3.2. Application of HDHT with Cu2+
The colorimetric detection using HDHT was examined with various metal ions in a bis-tris buffer (pH = 7.0, Figure 1). As diverse cations were transferred to the HDHT, only the Cu2+ caused a remarkable decrease at 430 nm in the UV–Vis spectra (Figure 1a) and displayed a color change of yellow to colorless (Figure 1b). The zinc and cobalt ions showed a slight decrease in absorbance, and ferrous and ferric ions revealed their own pale orange color. These results demonstrated that HDHT can detect only Cu2+ with a color variation.
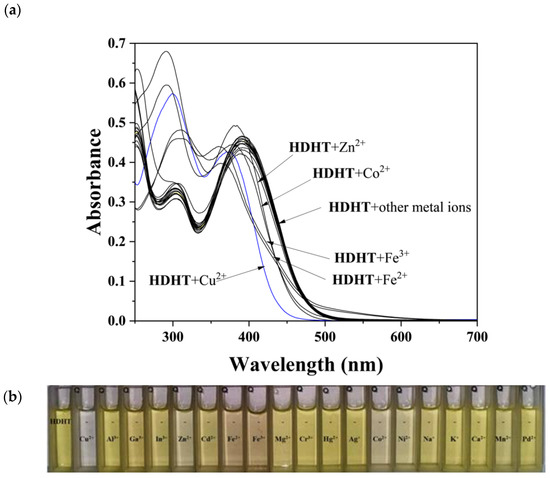
Figure 1.
(a) Absorbance spectra of HDHT (30 μM) with metal ions (39 μM). (b) Photograph of color changes of HDHT (30 μM) with metal ions (39 μM).
The UV–Vis titration was performed to study the chelating mode of the HDHT with Cu2+ (Figure 2). The free HDHT displayed two main absorbance bands at 305 and 394 nm (molar extinction coefficient: 11,183 M−1cm−1 and 15,623 M−1cm−1, respectively), indicating ICT transition. With the increment of the Cu2+, the absorbance at 304 nm increased and those at 430 nm and 250 nm decreased. This hypsochromic shift may have been caused by the Cu2+ interfering with the ICT process. The isosbestic point was checked at 373 nm, implying that the HDHT and Cu2+ generated the one chemical species. A Job-plot experiment was carried out to determine the complexation ratio of the HDHT with the Cu2+ (Figure 3). When the ratio of ([HDHT]/[HDHT] + [Cu2+]) was 0.5, the absorbance at 430 nm reached its maximum. This result indicated that the HDHT chelated with the Cu2+ in a 1:1 ratio. To support the binding ratio of the HDHT with the Cu2+, an ESI-MS analysis was performed (Figure S5). The peak of 484.44 (m/Z) was assignable to be [HDHT + Cu2+ − 2H+ + NO3−]− (calcd. 483.98). Based on the calibration curve with the Cu2+, the binding constant of the HDHT with the Cu2+ was calculated as 1.97 × 10⁴ M−1 by the Benesi–Hildebrand equation (Figure S6). The calculated binding constant was within the previously reported range (103–1012) for Cu2+ sensors [30,31,35,37,53]. The detection limit for Cu2+ was calculated to be 6.4 × 10⁻² μM in the range of 0–7.5 μM using the definition by IUPAC (CDL = 3σ/k; Figure 4). Importantly, the HDHT showed the lowest detection limit for Cu2+ among the color-changeable chemosensors sequentially operating for Cu2+ and S2− in near-perfect water (Table S1). To study the interaction of the HDHT with the Cu2+, a FT-IR analysis was carried out (Figure S7). The C=O bond of the carbonyl group assigned to the peak at 1712 cm−1 was moved to 1619 cm−1 [54,55], and the peak at 1609 cm−1 specified to the C=N bond was shifted to 1596 cm−1 [56]. The N-H and O-H with hydrogen-bonding character were observed in broad conformations. These results suggested that the Cu2+ coordinated with the hydroxyl, the imine, and the carbonyl groups. With the FT-IR analysis, the ESI-MS, and the Job plot, the probable features of HDHT with Cu2+ was proposed (Scheme 2).
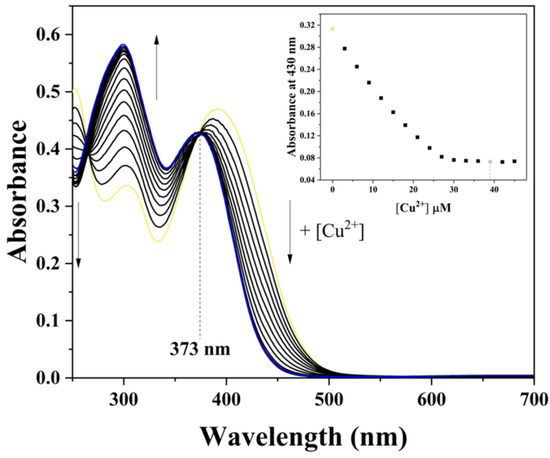
Figure 2.
Absorbance spectra of HDHT (30 μM) with different concentrations of Cu2+ (0–45 μM) (yellow line: HDHT; blue line: HDHT + 39 μM Cu2+).
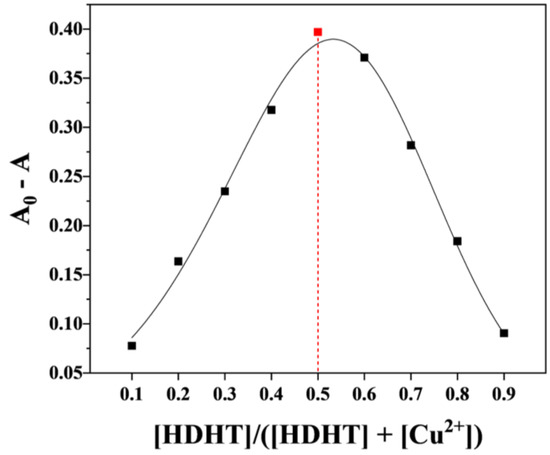
Figure 3.
Job-plot analysis for determining the stoichiometry of HDHT and Cu2+ at 430 nm (red line: ([HDHT]/[HDHT] + [Cu2+]) = 0.5).
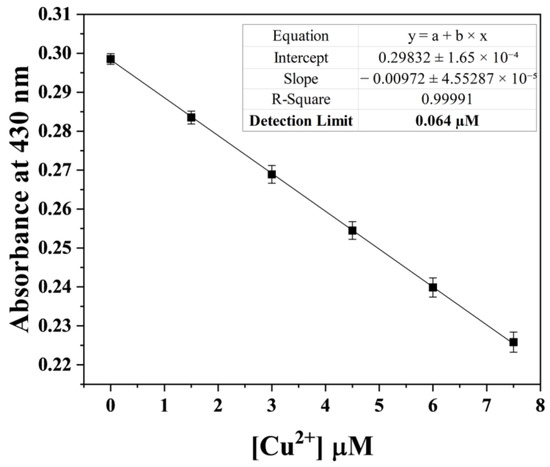
Figure 4.
Calibration curve for Cu2+ analysis using HDHT plotted against absorbance at 430 nm (n = 3).
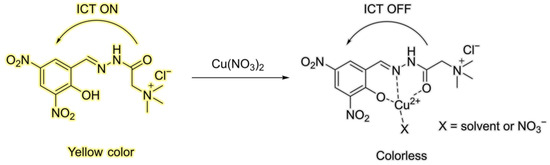
Scheme 2.
Proposed chelating mode of HDHT with Cu2+.
The competition experiment was undertaken to study the preferable selectivity of HDHT for Cu2+ in a competitive environment (Figure 5). None of the metal ions tested showed any competitive effect on the Cu2+ (Figure 5a). To the naked eye, except for the Cu2+, none of the metal ions showed a color change when added to the HDHT (Figure 5b). In the absence of any interference from other metal ions, HDHT can be used for the detection of Cu2+. The pH test was performed to examine the dependence of the sensing ability of the HDHT on the pH (Figure S8). The experiment results revealed that the HDHT worked suitably to detect Cu2+ in a pH range of 5–11. These results signified that the HDHT could efficiently detect the Cu2+ in the physiological pH range of 7.0–8.4, as well as in basic and acidic conditions. The recovery test was accomplished to study whether HDHT could quantify Cu2+ in real water samples, such as tap and drinking water (Table 1). The percentage of recovery and relative standard deviation (R.S.D.) indicated appropriate results, demonstrating that HDHT can properly determine Cu2+ in real water samples. Moreover, based on these results, HDHT can be applied to determine Cu2+ in a stream containing a variety of cations around an industrial complex.
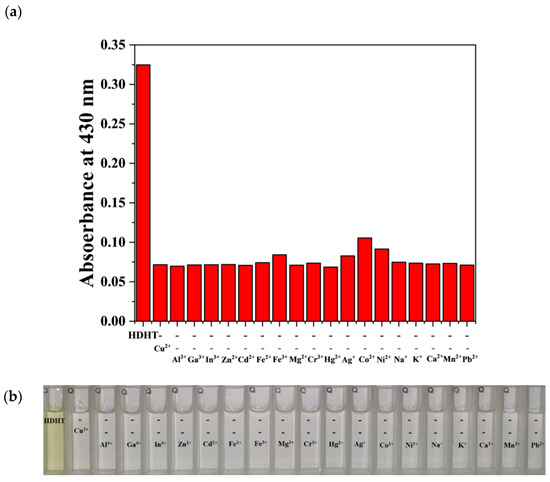
Figure 5.
Inhibition test. (a) Absorbance of HDHT (30 μM) at 430 nm in the presence of Cu2+ (39 μM) and other metal ions (39 μM). (b) Photograph of color changes of 30 μM HDHT solution in the presence of Cu2+ (39 μM) and other ions (39 μM).

Table 1.
Recovery-test results for Cu2+ in real water samples *.
3.3. Theoretical Study
In order to investigate the interaction between the HDHT and the Cu2+, a number of calculations were performed. The calculations of the HDHT–Cu2+ were based on the 1:1 chelation of HDHT and Cu2+, which was proposed by the ESI-MS and the Job plot. As shown in Figure S9, as a tridentate ligand, HDHT chelates Cu2+ using hydroxyl oxygen, imine nitrogen, and carbonyl oxygen. The HDHT–Cu2+ complex showed a square planar structure with one NO3−. With the optimized features, the TD-DFT calculations were performed to check the electronic transitions of the HDHT and the HDHT–Cu2+. For the HDHT, excited state 1 (409.32 nm) was regarded as the HOMO → LUMO transition, showing an ICT property (Figures S10 and S11). Its molecular orbitals indicated the shift of the electron cloud from the amide group to the 3,5-dinitrophenol moiety. The ICT character caused the yellow color of the HDHT. For the HDHT–Cu2+, excited state 16 (367.70 nm) consisted of HOMO → LUMO (alpha) and HOMO → LUMO+1 (beta), which showed π → π* characters (Figures S11 and S12). As shown in Figure S11, the energy-gap change in the HDHT (3.560 eV) and HDHT-Cu2+ (3.970 eV (alpha) and 3.930 eV (beta)) was clearly consistent with the hypsochromic shift in the experimental results. These results showed that the ICT process was inhibited due to the formation of a coordination bond between the HDHT and the Cu2+. Thus, the reason for the color change of the HDHT from yellow to colorless with the addition of Cu2+ can be explained by the repression of the ICT process. With the Job plot, ESI-MS, FT-IR, and DFT calculations, we suggested the mechanism of the colorimetric sensing of Cu2+ by HDHT (Scheme 2).
3.4. Application of HDH–Cu2+ Complex for S2− Sensing
For the HDHT–Cu2+ complex, the selectivity experiment was performed with various anions. When the anions were added to the complex solution, only S2− showed a significant increase in absorbance at 430 nm and a color change of colorless to yellow (Figure 6). These results suggested that the HDHT–Cu2+ had selectivity for S2−. The UV–Vis titration was performed for S2− (Figure 7). The absorbance of 300 nm decreased and that of 430 nm increased when S2− was added. The sensing mechanism of the HDHT–Cu2+ for S2− was further investigated by ESI-MS. As shown in Figure S13, the peak of 435.86 (m/Z) was assigned to [HDHT - H+ + Na+ + 3H2O]− (calcd. 436.09), which suggests that S2− binds and removes Cu2+ from the HDHT–Cu2+ complex. With the results of the experiment data, the plausible detection mechanism of HDHT–Cu2+ for S2− was proposed (Scheme 3). The obtained detection limit was 0.12 µM in the scope of 0 μM to 8 μM of sulfide (Figure 8). Remarkably, the HDHT showed the lowest detection limit for S2− among the color-variable chemosensors sequentially analyzing for Cu2+ and S2− in ultrapure water (Table S1). The interference study was performed to investigate whether the presence of other anions affects the detection of S2−. In the inhibition test, the HDHT-Cu2+ did not show significant interference in detecting S2− against other anions (Figure 9a). Observations using the naked eye revealed no interference with the detection of S2− in the presence of other anions (Figure 9b). To determine the effect of pH on S2− detection by the HDHT–Cu2+, the pH test was performed (Figure S14). At pH 3–12, it was confirmed that the HDHT–Cu2+ worked well, without any problems. This observation demonstrated that the HDHT can effectively detect not only Cu2+ but also S2− through sequential detection over a wide range of pH. The recovery test was conducted to examine whether the HDHT–Cu2+ could detect S2− in a real-water sample, such as drinking water (Table 2). The displayed result suggested that HDHT–Cu2+ can appropriately detect S2− in a real environment.
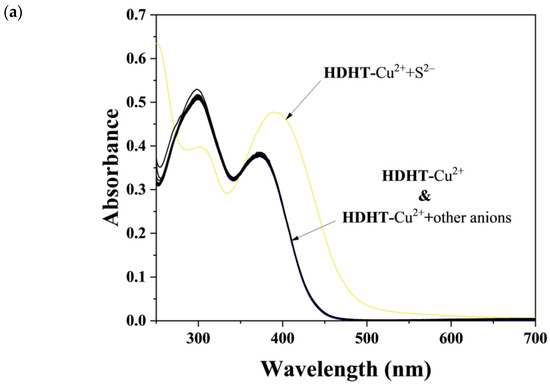
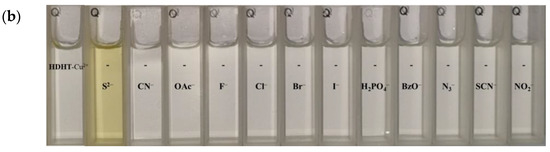
Figure 6.
(a) Absorbance spectra of HDHT–Cu2+ (30 μM) with a variety of anions (51 μM). (b) Photograph of color changes of HDHT–Cu2+ (30 μM) with a variety of anions (51 μM).
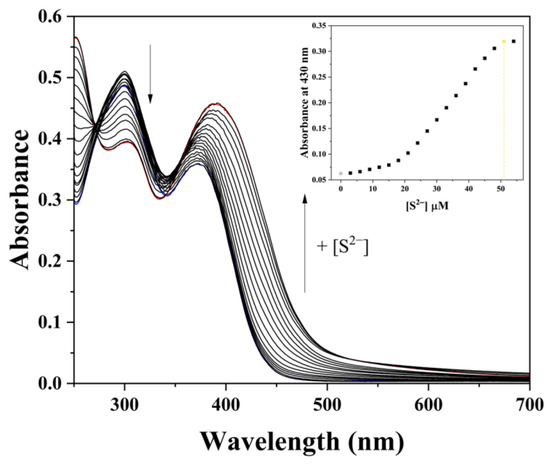
Figure 7.
Absorbance spectra of HDHT–Cu2+ complex (30 μM) with different concentrations of S2− (0–54 μM) (blue line: HDHT–Cu2+; red line: HDHT–Cu2+ + 51 μM S2–).
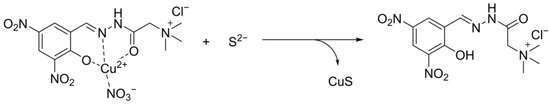
Scheme 3.
Proposed detection feature of HDHT–Cu2+ with S2−.
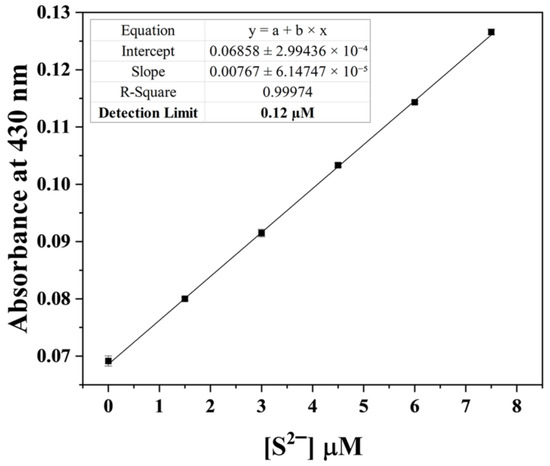
Figure 8.
Calibration curve for S2− analysis using HDHT–Cu2+ plotted against absorbance at 430 nm (n = 3).
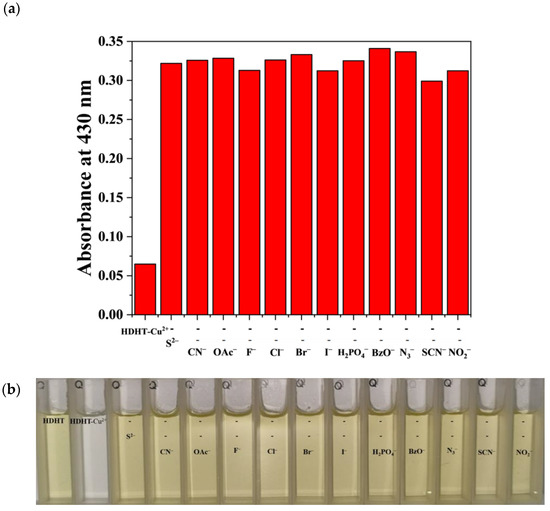
Figure 9.
Inhibition test. (a) Absorbance of HDHT–Cu2+ complex (30 μM) at 430 nm in the presence of S2− (51 μM) and other anions (51 μM). (b) Photograph of color changes of 30 μM HDHT-Cu2+ solution in the presence of S2− (51 μM) and other anions (51 μM).
Table 2.
Recovery-test results for S2− in the real-water sample *.
4. Conclusions
We addressed a dinitrophenol-based sequential colorimetric chemosensor, HDHT, which can clearly probe Cu2+ and S2−. With a Job plot and ESI-MS, the structure of the association of HDHT with Cu2+ was found to be a 1:1 ratio. The detection limit and binding constant of HDHT to Cu2+ were 6.4 × 10⁻² μM and 1.97 × 10⁴ M−1, respectively. The detection limit for Cu2+ was clearly below the EPA standard (20 μM). Importantly, the HDHT was able to detect the Cu2+ under weak-acid-to-strong-base conditions and quantify Cu2+ in real environments, such as tap and drinking water. Meanwhile, the HDHT–Cu2+ showed a sequential detection for S2−. The detection limit of the HDHT–Cu2+ to the S2− was 1.2 × 10⁻¹ μM. This detection limit was lower than the WHO freshwater guideline (14.8 μM) for S2−. It was noteworthy that the HDHT–Cu2+ was able to quantify S2− from pH 3 to pH 12 and detect S2− in real water. Most importantly, the HDHT showed the lowest detection limits for Cu2+ and S2− among color-changeable chemosensors sequentially operating for Cu2+ and S2− in near-perfect water. The sensing features of the HDHT for Cu2+ and S2− were described by a Job plot, ESI-MS, UV-vis, FT-IR, and calculations. Hence, we expect that these findings could provide inspiration for the development of a novel color-changeable chemosensor for sequentially detecting Cu2+ and S2− in water.
Supplementary Materials
The following supporting information can be downloaded at: https://www.mdpi.com/article/10.3390/chemosensors11020143/s1. Table S1. Examples of chemosensors for sequential detection of Cu2+ and S2− through color variation in aqueous solution [57]; Figure S1. 1H NMR spectrum of HDHT; Figure S2. 13C NMR spectrum of HDHT; Figure S3. Negative-ion ESI-MS spectra of HDHT (100 μM); Figure S4. Gibbs free energy (∆G°f) calculation for optimized isomers of HDHT; Figure S5. Negative-ion ESI-MS spectra of HDHT (100 μM) with Cu2+ (100 μM); Figure S6. The binding constant of HDHT (30 μM) with Cu2+ when using the Benesi–Hildebrand method. The absorbance spectrum at 430 nm is measured by the increasing equivalent of Cu2+; Figure S7. FT-IR spectra of HDHT (black line) and HDHT–Cu2+ (red line); Figure S8. The pH-stability test. (a) UV–Vis absorbance at 430 nm of HDHT (30 μM) and HDHT–Cu2+ (30 μM) in buffer solution from pH 1 to pH 13. (b) Color change of HDHT (30 μM) and HDHT–Cu2+ (30 μM) in buffer solution from pH 1 to pH 13; Figure S9. Energy-optimized structure of HDHT–Cu2+ complex; Figure S10. (a) The theoretical excitation energies and the experimental UV–Vis spectrum of HDHT. (b) The major electronic-transition energies and molecular orbital contributions for HDHT (H = HOMO and L = LUMO); Figure S11. Molecular-orbital diagrams and excitation energies of HDHT and HDHT–Cu2+; Figure S12. (a) The theoretical excitation energies and the experimental UV–Vis spectrum of HDHT–Cu2+. (b) The major electronic transition energies and molecular-orbital contributions for HDHT–Cu2+ (H = HOMO and L = LUMO); Figure S13. Negative-ion ESI-MS spectra of HDHT–Cu2+ (100 μM) with S2− (100 μM); Figure S14. The pH-stability test. (a) UV–Vis absorbance at 430 nm of HDHT–Cu2+ (30 μM) and HDHT–Cu2+ + S2− (30 μM) in buffer solution from pH 1 to pH 13. (b) Color changes of HDHT–Cu2+ (30 μM) and HDHT–Cu2+ + S2− (30 μM) in buffer solution from pH 1 to pH 13.
Author Contributions
H.N., S.M. and C.K. provided the initial idea for this work; H.N. contributed to the collection and analysis of the field-test data; H.N. and D.G. revised the paper; H.N., S.M. and C.K. wrote the paper. All authors have read and agreed to the published version of the manuscript.
Funding
This research was funded by the National Research Foundation of Korea, grant number 2020R1A6A1A0304274211.
Institutional Review Board Statement
Not applicable.
Informed Consent Statement
Not applicable.
Data Availability Statement
Not applicable.
Conflicts of Interest
The authors declare no conflict of interest.
References
- Choe, D.; Kim, C. A Benzothiadiazole-Based Colorimetric Chemosensor for Detecting Cu2+ and Sequential H2S in Practical Samples. Inorg. Chim. Acta 2022, 543, 121180. [Google Scholar] [CrossRef]
- He, L.; Tao, H.; Koo, S.; Chen, G.; Sharma, A.; Chen, Y.; Lim, I.T.; Cao, Q.Y.; Kim, J.S. Multifunctional Fluorescent Nanoprobe for Sequential Detections of Hg2+ Ions and Biothiols in Live Cells. ACS Appl. Bio Mater. 2018, 1, 871–878. [Google Scholar] [CrossRef] [PubMed]
- Sahu, M.; Manna, A.K.; Patra, G.K. A Fluorescent Colorimetric Vanillin Di-Schiff Base Chemosensor for Detection of Cu(II) and Isolation of Trinuclear Cu(II)-Dihydrazide. Mater. Adv. 2022, 3, 2495–2504. [Google Scholar] [CrossRef]
- Asadpour Chounechenan, S.; Mohammadi, A.; Ghafouri, H. A New and Efficient Diaminopyrimidine-Based Colorimetric and Fluorescence Chemosensor for the Highly Selective and Sensitive Detection of Cu2+ in Aqueous Media and Living Cells. Spectrochim. Acta A Mol. Biomol. Spectrosc. 2022, 267, 120507. [Google Scholar] [CrossRef]
- Kavitha, B.S.; Sridevi, S.; Makam, P.; Ghosh, D.; Govindaraju, T.; Asokan, S.; Sood, A.K. Highly Sensitive and Rapid Detection of Mercury in Water Using Functionalized Etched Fiber Bragg Grating Sensors. Sens. Actuators B Chem. 2021, 333, 129550. [Google Scholar]
- Guan, W.L.; Zhang, Y.F.; Zhang, Q.P.; Zhang, Y.M.; Wei, T.B.; Yao, H.; Lin, Q. A Novel Fluorescent Chemosensor Based on Naphthofuran Functionalized Naphthalimide for Highly Selective and Sensitive Detecting Hg2+ and CN−. J. Lumin. 2022, 244, 118722. [Google Scholar] [CrossRef]
- Abebe, F.; Gonzalez, J.; Makins-Dennis, K.; Shaw, R. A New Bis(Rhodamine)-Based Colorimetric Chemosensor for Cu2+. Inorg. Chem. Commun. 2020, 120, 108154. [Google Scholar] [CrossRef]
- Aysha, T.S.; Mohamed, M.B.I.; El-Sedik, M.S.; Youssef, Y.A. Multi-Functional Colorimetric Chemosensor for Naked Eye Recognition of Cu2+, Zn2+ and Co2+ Using New Hybrid Azo-Pyrazole/Pyrrolinone Ester Hydrazone Dye. Dyes Pigm. 2021, 196, 109795. [Google Scholar] [CrossRef]
- Tavallali, H.; Deilamy-Rad, G.; Karimi, M.A.; Rahimy, E. A Novel Dye-Based Colorimetric Chemosensors for Sequential Detection of Cu2+ and Cysteine in Aqueous Solution. Anal. Biochem. 2019, 583, 113376. [Google Scholar] [CrossRef] [PubMed]
- Zhao, M.; Zhang, Y.; Zheng, X.; Li, Z.; Xu, S. High Selective and Sensitive Optical Probe with Effective Recognition for Cu2+ Based on a Novel Aniline Squarylium Dye. Inorg. Chem. Commun. 2020, 121, 108198. [Google Scholar] [CrossRef]
- Hu, Z.F.; Dou, L.; Zhang, J.; Zhang, Y.; Sun, Y.X.; Dong, W.K. A Novel “on-off-on” Halogen-Substituted Bis(Salamo)-like Fluorogenic Chemosensor for Sequentially Identifying Cu2+ Ions and Cysteine. Inorg. Chim. Acta 2022, 541, 121090. [Google Scholar] [CrossRef]
- Ko, Y.G.; Mayank; Singh, N.; Jang, D.O. Single Chemosensor for Sensing Multiple Analytes: Selective Fluorogenic Detection of Cu2+ and Br−. Tetrahedron Lett. 2018, 59, 3839–3844. [Google Scholar] [CrossRef]
- Pungut, N.A.S.; Heng, M.P.; Saad, H.M.; Sim, K.S.; Lee, V.S.; Tan, K.W. From One to Three, Modifications of Sensing Behavior with Solvent System: DFT Calculations and Real-Life Application in Detection of Multianalytes (Cu2+, Ni2+ and Co2+) Based on a Colorimetric Schiff Base Probe. J. Mol. Struct. 2021, 1238, 130453. [Google Scholar] [CrossRef]
- Lee, J.C.; Gray, H.B.; Winkler, J.R. Copper (II) Binding to Alpha-Synuclein, the Parkinson’ s Protein. J. Am. Chem. Soc. 2008, 130, 6898–6899. [Google Scholar] [CrossRef]
- Kim, B.E.; Nevitt, T.; Thiele, D.J. Mechanisms for Copper Acquisition, Distribution and Regulation. Nat. Chem. Biol. 2008, 4, 176–185. [Google Scholar] [CrossRef]
- Kshtriya, V.; Koshti, B.; Pandey, D.K.; Kharbanda, S.; Chandra Kanth, P.; Singh, D.K.; Bhatia, D.; Gour, N. Sequential and Cellular Detection of Copper and Lactic Acid by Disaggregation and Reaggregation of the Fluorescent Panchromatic Fibres of an Acylthiourea Based Sensor. Soft Matter 2021, 17, 4304–4316. [Google Scholar] [CrossRef]
- Kim, A.; Kang, J.H.; Jang, H.J.; Kim, C. Fluorescent Detection of Zn(II) and In(III) and Colorimetric Detection of Cu(II) and Co(II) by a Versatile Chemosensor. J. Ind. Eng. Chem. 2018, 65, 290–299. [Google Scholar] [CrossRef]
- Cheah, P.W.; Heng, M.P.; Saad, H.M.; Sim, K.S.; Tan, K.W. Specific Detection of Cu2+ by a PH-Independent Colorimetric Rhodamine Based Chemosensor. Opt. Mater. 2021, 114, 110990. [Google Scholar] [CrossRef]
- Mohanasundaram, D.; Bhaskar, R.; Sankarganesh, M.; Nehru, K.; Gangatharan Vinoth Kumar, G.; Rajesh, J. A Simple Pyridine Based Fluorescent Chemosensor for Selective Detection of Copper Ion. Spectrochim. Acta A Mol. Biomol. Spectrosc. 2022, 265, 120395. [Google Scholar] [CrossRef]
- Ozmen, P.; Demir, Z.; Karagoz, B. An Easy Way to Prepare Reusable Rhodamine-Based Chemosensor for Selective Detection of Cu2+ and Hg2+ Ions. Eur. Polym. J. 2022, 162, 110922. [Google Scholar] [CrossRef]
- Rajasekaran, D.; Venkatachalam, K.; Periasamy, V. “On–off–on” Pyrene-Based Fluorescent Chemosensor for the Selective Recognition of Cu2+ and S2− Ions and Its Utilization in Live Cell Imaging. Appl. Organomet. Chem. 2020, 34, e5342. [Google Scholar] [CrossRef]
- Feng, S.S.; Wei, Y.X.; Li, M.; Dong, W.K. A Highly Selective Naphthalene-Fluorophore Salamo-Based Chemosensor for Sequential Identification of Cu2+ and S2− Ions in Water Applications. J. Mol. Struct. 2022, 1261, 132923. [Google Scholar] [CrossRef]
- Pan, Y.Q.; Xu, X.; Zhang, Y.; Zhang, Y.; Dong, W.K. A Highly Sensitive and Selective Bis(Salamo)-Type Fluorescent Chemosensor for Identification of Cu2+ and the Continuous Recognition of S2−, Arginine and Lysine. Spectrochim. Acta A Mol. Biomol. Spectrosc. 2020, 229, 117927. [Google Scholar] [CrossRef] [PubMed]
- Mu, H.R.; Yu, M.; Wang, L.; Zhang, Y.; Ding, Y.J. Catching S2− and Cu2+ by a Highly Sensitive and Efficient Salamo-like Fluorescence-Ultraviolet Dual Channel Chemosensor. Phosphorus Sulfur Silicon Relat. Elem. 2020, 195, 730–739. [Google Scholar] [CrossRef]
- Kargar, M.; Darabi, H.R.; Sharifi, A.; Mostashari, A. A New Chromogenic and Fluorescent Chemosensor Based on a Naphthol-Bisthiazolopyridine Hybrid: A Fast Response and Selective Detection of Multiple Targets, Silver, Cyanide, Sulfide, and Hydrogen Sulfide Ions and Gaseous H2S. Analyst 2020, 145, 2319–2330. [Google Scholar] [CrossRef]
- Jung, J.M.; Kang, J.H.; Han, J.; Lee, H.; Lim, M.H.; Kim, K.T.; Kim, C. A Novel “off-on” Type Fluorescent Chemosensor for Detection of Zn2+ and Its Zinc Complex for “on-off” Fluorescent Sensing of Sulfide in Aqueous Solution, in Vitro and in Vivo. Sens. Actuators B Chem. 2018, 267, 58–69. [Google Scholar] [CrossRef]
- Wang, P.; Zhou, D.; Xue, S.; Chen, B.; Wen, S.; Yang, X.; Wu, J. Rational Design of Dual-Functional Peptide-Based Chemosensor for Sequential Detection of Ag+ (AgNPs) and S2− Ions by Fluorescent and Colorimetric Changes and Its Application in Live Cells, Real Water Samples and Test Strips. Microchem. J. 2022, 177, 107326. [Google Scholar] [CrossRef]
- Chen, F.; Han, D.; Liu, H.; Wang, S.; Li, K.B.; Zhang, S.; Shi, W. A Tri-Site Fluorescent Probe for Simultaneous Sensing of Hydrogen Sulfide and Glutathione and Its Bioimaging Applications. Analyst 2018, 143, 440–448. [Google Scholar] [CrossRef]
- Thai, D.A.; Lee, N.Y. A Paper-Based Colorimetric Chemosensor for Rapid and Highly Sensitive Detection of Sulfide for Environmental Monitoring. Anal. Methods 2021, 13, 1332–1339. [Google Scholar] [CrossRef]
- Kim, M.S.; Jung, J.M.; Ahn, H.M.; Kim, C. A Simple Colorimetric Chemosensor for Relay Detection of Cu2+ and S2− in Aqueous Solution. J. Coord. Chem. 2018, 71, 355–370. [Google Scholar] [CrossRef]
- Singh, N.; Chandra, R. A Naked-Eye Colorimetric Sensor Based on Chalcone for the Sequential Recognition of Copper(II) and Sulfide Ions in Semi-Aqueous Solution: Spectroscopic and Theoretical Approaches. New J. Chem. 2021, 45, 10340–10348. [Google Scholar] [CrossRef]
- Wang, P.; Sun, L.; Wu, J.; Yang, X.; Lin, P.; Wang, M. A Dual-Functional Colorimetric and Fluorescent Peptide-Based Probe for Sequential Detection of Cu2+ and S2− in 100% Aqueous Buffered Solutions and Living Cells. J. Hazard. Mater. 2021, 407, 124388. [Google Scholar] [CrossRef] [PubMed]
- Sun, T.; Niu, Q.; Li, T.; Guo, Z.; Liu, H. A Simple, Reversible, Colorimetric and Water-Soluble Fluorescent Chemosensor for the Naked-Eye Detection of Cu2 + in ~ 100% Aqueous Media and Application to Real Samples. Spectrochim. Acta A Mol. Biomol. Spectrosc. 2018, 188, 411–417. [Google Scholar] [CrossRef] [PubMed]
- Park, S.; Choe, D.; Lee, J.J.; Kim, C. A Benzyl Carbazate-Based Colorimetric Chemosensor for Relay Detection of Cu2+ and S2− in near-Perfect Aqueous Media. J. Mol. Struct. 2021, 1240, 130576. [Google Scholar] [CrossRef]
- So, H.; Chae, J.B.; Kim, C. A Thiol-Containing Colorimetric Chemosensor for Relay Recognition of Cu2+ and S2− in Aqueous Media with a Low Detection Limit. Inorg. Chim. Acta 2019, 492, 83–90. [Google Scholar] [CrossRef]
- Parua, S.P.; Sinha, D.; Rajak, K.K. A Highly Selective “on-off-on” Optical Switch for Sequential Detection of Cu2+ and S2– Ions Based on 2, 6-Diformyl-4-Methyl Phenol and Catecholase Activity by Its Copper Complex. ChemistrySelect 2018, 3, 1120–1128. [Google Scholar] [CrossRef]
- Jin, X.; Chen, H.; Zhang, W.; Wang, B.; Shen, W.; Lu, H. A Novel Purine Derivative-Based Colorimetric Chemosensor for Sequential Detection of Copper Ion and Sulfide Anion. Appl. Organomet. Chem. 2018, 32, e4577. [Google Scholar] [CrossRef]
- Kwon, N.; Chen, Y.; Chen, X.; Kim, M.H.; Yoon, J. Recent Progress on Small Molecule-Based Fluorescent Imaging Probes for Hypochlorous Acid (HOCl)/Hypochlorite (OCl−). Dyes Pigm. 2022, 200, 110132. [Google Scholar] [CrossRef]
- Lee, S.; Jen, M.; Jang, T.; Lee, G.; Pang, Y. Twisted Intramolecular Charge Transfer of Nitroaromatic Push–Pull Chromophores. Sci. Rep. 2022, 12, 6557. [Google Scholar] [CrossRef]
- Kajetanowicz, A.; Grela, K. Nitro and Other Electron Withdrawing Group Activated Ruthenium Catalysts for Olefin Metathesis Reactions. Angew. Chemie Int. Ed. 2021, 60, 13738–13756. [Google Scholar] [CrossRef]
- Vojinović-Ješić, L.S.; Češljević, V.I.; Bogdanović, G.A.; Leovac, V.M.; Szécsényi, K.M.; Divjaković, V.; Joksović, M.D. Transition Metal Complexes with Girard Reagent-Based Ligands. Part V. Synthesis, Characterization and Crystal Structure of Pentagonal-Bipyramidal Manganese(II) Complex with 2,6-Diacetylpyridine Bis(Girard-T Hydrazone). Inorg. Chem. Commun. 2010, 13, 1085–1088. [Google Scholar] [CrossRef]
- Moussa, M.N.H.; El-Far, A.A.; El-Shafei, A.A. The Use of Water-Soluble Hydrazones as Inhibitors for the Corrosion of C-Steel in Acidic Medium. Mater. Chem. Phys. 2007, 105, 105–113. [Google Scholar] [CrossRef]
- Bogdanov, A.V.; Zaripova, I.F.; Voloshina, A.D.; Sapunova, A.S.; Kulik, N.V.; Voronina, J.K.; Mironov, V.F. Synthesis and Antimicrobial Study of Novel 1-Benzylated Water-Soluble Isatin-3-Hydrazones. Chem. Biodivers. 2018, 15, 1800088. [Google Scholar] [CrossRef] [PubMed]
- Frisch, M.J.; Trucks, G.W.; Schlegel, H.B.; Scuseria, G.E.; Robb, M.A.; Cheeseman, J.R.; Scalmani, G.; Barone, V.; Petersson, G.A.; Nakatsuji, H.; et al. Gaussian 16 Revision C.01; Gaussian, Inc.: Walingford, CT, USA, 2016. [Google Scholar]
- Becke, A.D. Density-functional Thermochemistry. III. The Role of Exact Exchange. J. Chem. Phys. 1993, 98, 5648–5652. [Google Scholar] [CrossRef]
- Lee, C.; Yang, W.; Parr, R.G. Development of the Colle-Salvetti Correlation-Energy Formula into a Functional of the Electron Density. Phys. Rev. B 1988, 37, 785–789. [Google Scholar] [CrossRef] [PubMed]
- Hariharan, P.C.; Pople, J.A. The Influence of Polarization Functions on Molecular Orbital Hydrogenation Energies. Theor. Chim. Acta 1973, 28, 213–222. [Google Scholar] [CrossRef]
- Francl, M.M.; Pietro, W.J.; Hehre, W.J.; Binkley, J.S.; Gordon, M.S.; DeFrees, D.J.; Pople, J.A. Self-consistent Molecular Orbital Methods. XXIII. A Polarization-type Basis Set for Second-row Elements. J. Chem. Phys. 1982, 77, 3654–3665. [Google Scholar] [CrossRef]
- Wadt, W.R.; Hay, P.J. Ab Initio Effective Core Potentials for Molecular Calculations. Potentials for Main Group Elements Na to Bi. J. Chem. Phys. 1985, 82, 284–298. [Google Scholar] [CrossRef]
- Klamt, A.; Moya, C.; Palomar, J. A Comprehensive Comparison of the IEFPCM and SS(V)PE Continuum Solvation Methods with the COSMO Approach. J. Chem. Theory Comput. 2015, 11, 4220–4225. [Google Scholar] [CrossRef]
- Ershov, A.Y.; Lagoda, I.V.; Yakimovich, S.I.; Pakal’Nis, V.V.; Zerova, I.V.; Dobrodumov, A.V.; Shamanin, V.V. Tautomerism and Conformational Isomerism of Mercaptoacetylhydrazones of Aliphatic and Aromatic Aldehydes. Russ. J. Org. Chem. 2009, 45, 660–666. [Google Scholar] [CrossRef]
- Gil, D.; Lee, J.J.; Lee, H.; Kim, K.-T.; Kim, C. Detection of Environmentally Hazardous Hypochlorite in Pure Water with a Novel Fluorescent Chemosensor: Application to Water Samples, Commercial Disinfectants, Test Strips, and Zebrafish. Dyes Pigm. 2022, 207, 110714. [Google Scholar] [CrossRef]
- Mahnashi, M.H.; Mahmoud, A.M.; Alkahtani, S.A.; Ali, R.; El-Wekil, M.M. A Novel Imidazole Derived Colorimetric and Fluorometric Chemosensor for Bifunctional Detection of Copper (II) and Sulphide Ions in Environmental Water Samples. Spectrochim. Acta A Mol. Biomol. Spectrosc. 2020, 228, 117846. [Google Scholar] [CrossRef]
- Rajendra Prasad, Y.; Kumar, P.P.; Kumar, P.R.; Rao, A.S. Synthesis and Antimicrobial Activity of Some New Chalcones of 2-Acetyl Pyridine. J. Chem. 2008, 5, 144–148. [Google Scholar]
- Rout, K.C.; Mondal, B. Copper(II) Complex as Selective Turn-on Fluorescent Probe for Nitrite Ion. Inorg. Chim. Acta 2015, 437, 54–58. [Google Scholar] [CrossRef]
- Nouri Moghadam, F.; Amirnasr, M.; Meghdadi, S.; Eskandari, K.; Buchholz, A.; Plass, W. A New Fluorene Derived Schiff-Base as a Dual Selective Fluorescent Probe for Cu2+ and CN−. Spectrochim. Acta A Mol. Biomol. Spectrosc. 2019, 207, 6–15. [Google Scholar] [CrossRef]
- Rha, C.J.; Lee, H.; Kim, C. An Effective Phthalazine-Imidazole-Based Chemosensor for Detecting Cu2+, Co2+ and S2− via the Color Change. Inorg. Chim. Acta 2020, 511, 119788. [Google Scholar] [CrossRef]


Disclaimer/Publisher’s Note: The statements, opinions and data contained in all publications are solely those of the individual author(s) and contributor(s) and not of MDPI and/or the editor(s). MDPI and/or the editor(s) disclaim responsibility for any injury to people or property resulting from any ideas, methods, instructions or products referred to in the content. |
© 2023 by the authors. Licensee MDPI, Basel, Switzerland. This article is an open access article distributed under the terms and conditions of the Creative Commons Attribution (CC BY) license (https://creativecommons.org/licenses/by/4.0/).