

Design of a Decision Support System to Operate a NO2 Gas Sensor Using Machine Learning, Sensitive Analysis and Conceptual Control Process Modelling

 , ,
, ,  ,
,  , ,
, , 
Abstract
:1. Introduction
2. Materials and Methods
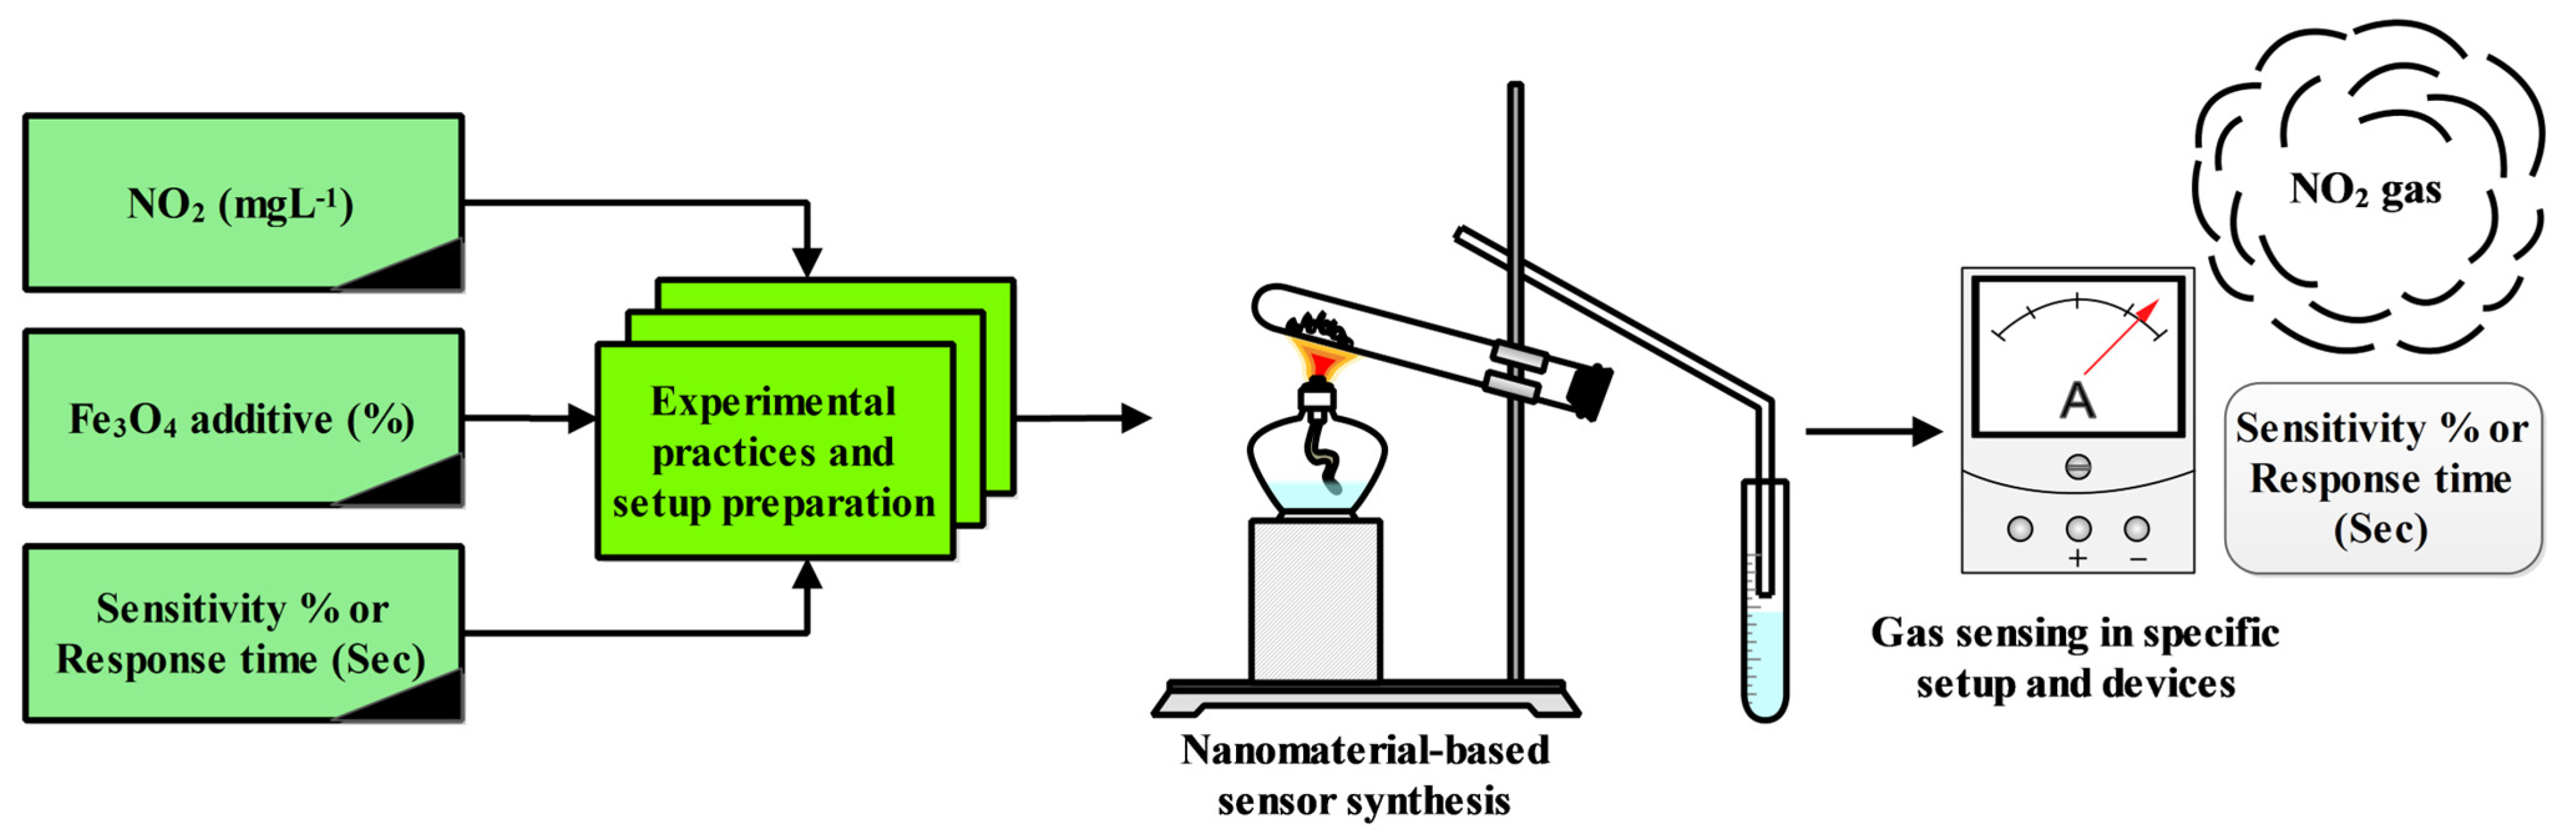
2.1. Mechanism of Sensor Creation
2.2. Optimization and Sensitive Analysis
2.3. Machine Learning Computations
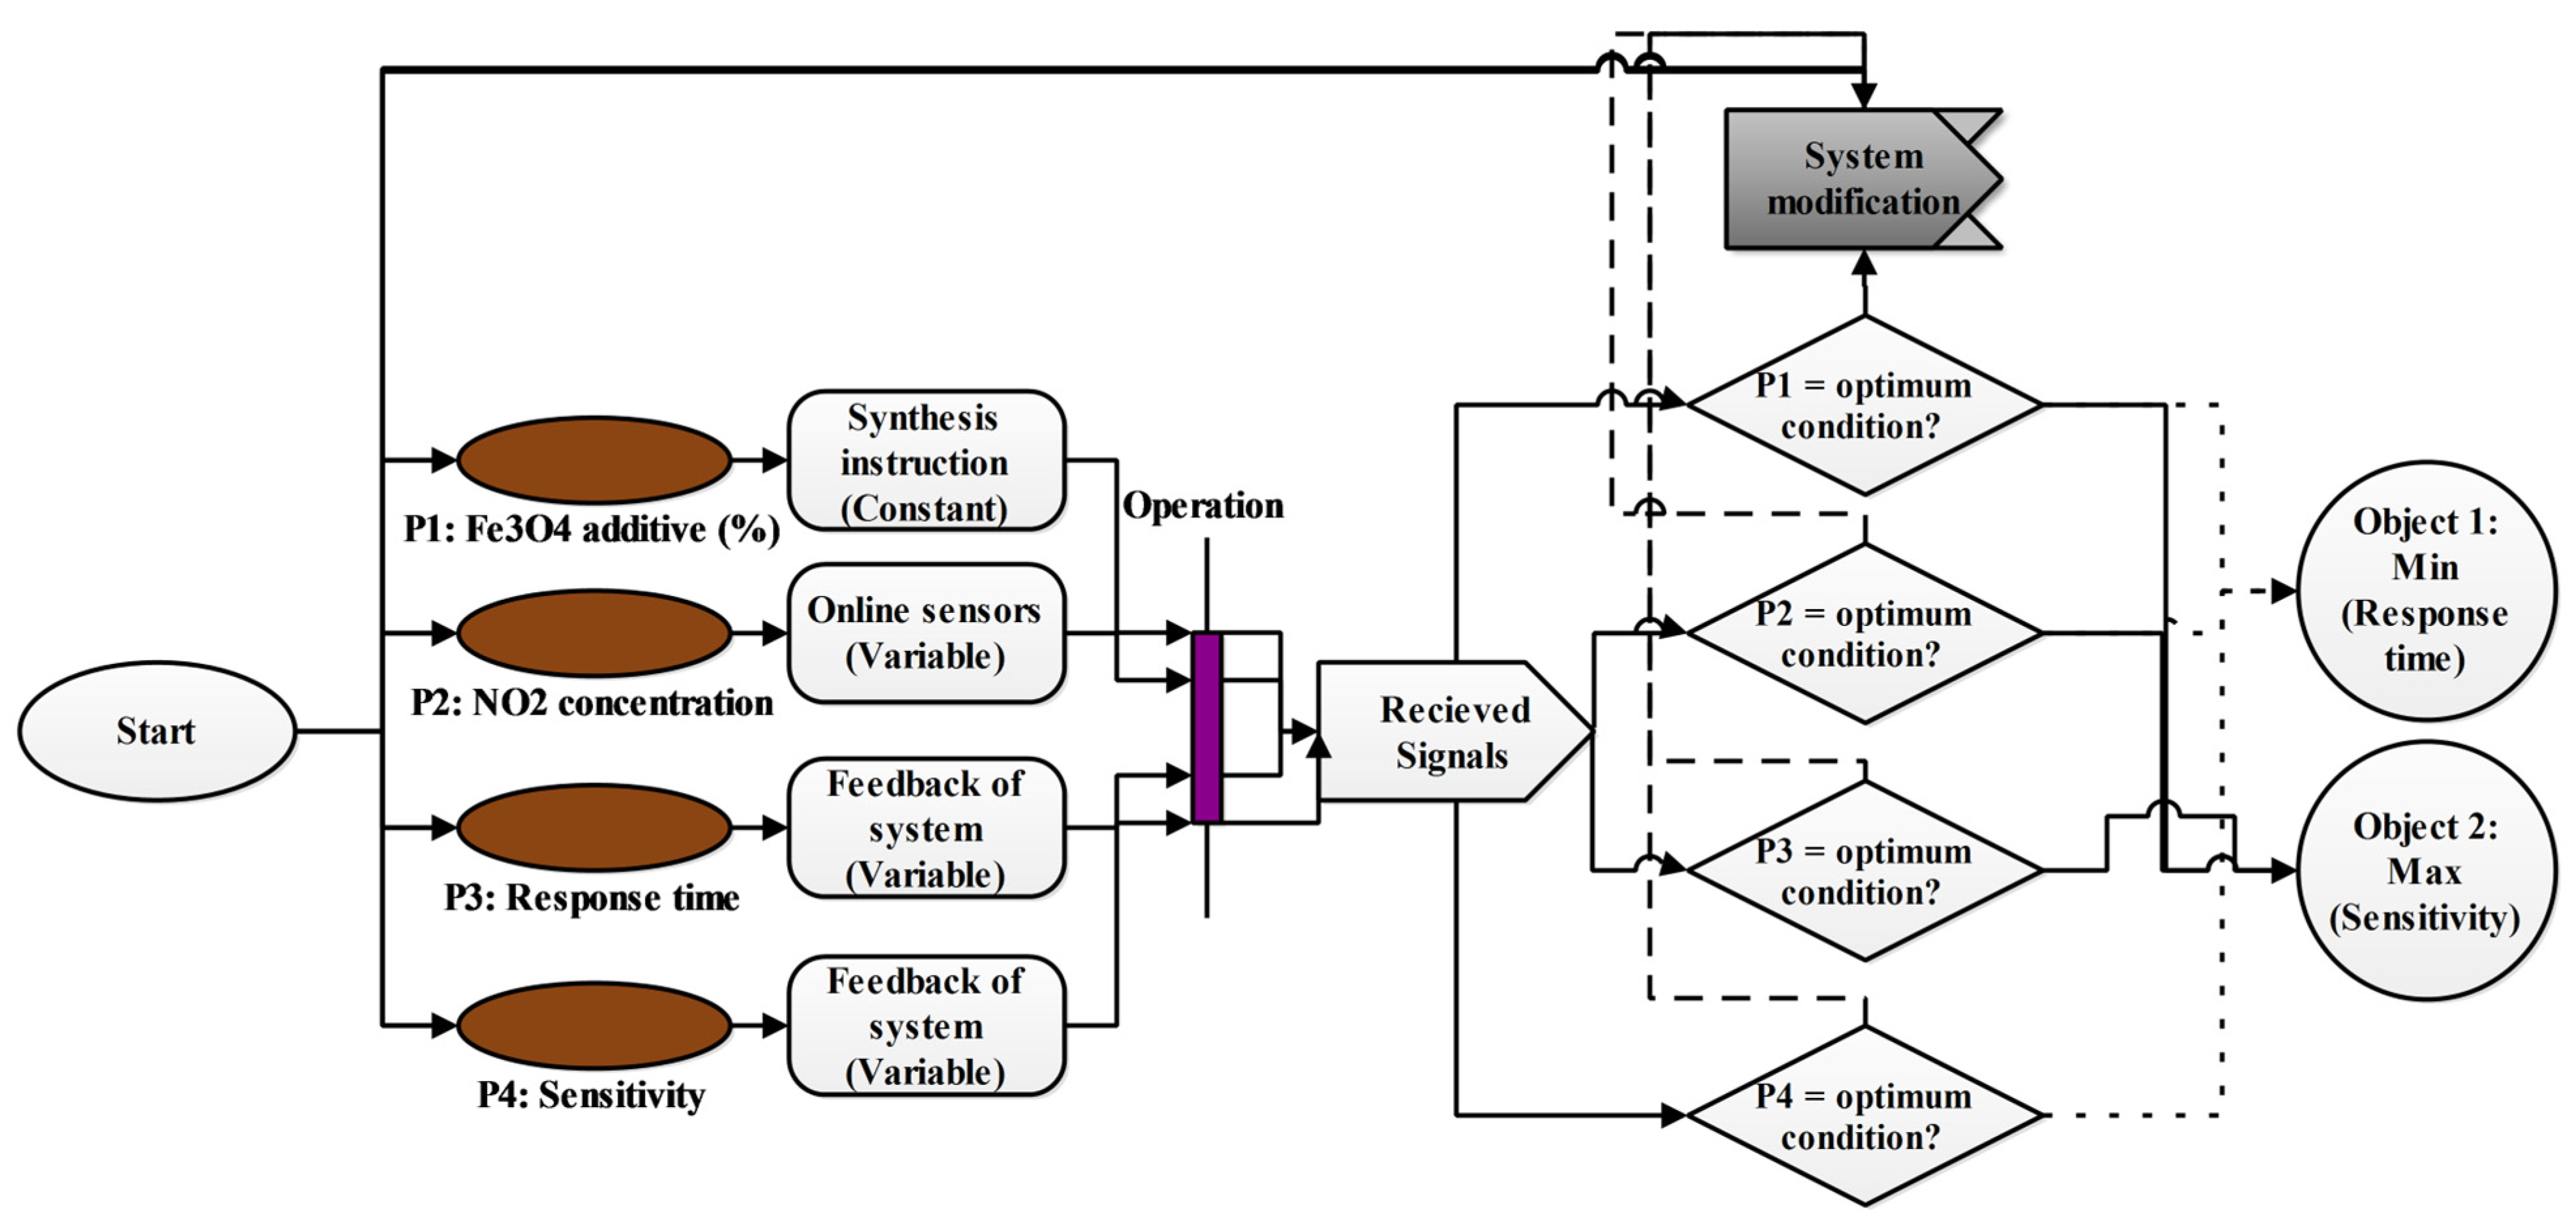
2.4. Controlling System of Sensor Network
3. Results and Discussions
3.1. Sensitive Analysis and Optimization
3.2. Soft-Computing
3.3. System Control of Gas-Sensor Operation by Jacobson
4. Conclusions
Supplementary Materials
Author Contributions
Funding
Institutional Review Board Statement
Informed Consent Statement
Data Availability Statement
Acknowledgments
Conflicts of Interest
References
- Ouyang, H.; Tang, X.; Kumar, R.; Zhang, R.; Brasseur, G.; Churchill, B.; Alam, M.; Kan, H.; Liao, H.; Zhu, T.; et al. Toward Better and Healthier Air Quality: Implementation of WHO 2021 Global Air Quality Guidelines in Asia. Bull. Am. Meteorol. Soc. 2022, 103, E1696–E1703. [Google Scholar] [CrossRef]
- Hu, F.; Guo, Y. Health impacts of air pollution in China. Front. Environ. Sci. Eng. 2020, 15, 74. [Google Scholar] [CrossRef]
- Zhang, Y.; Shi, T.; Wang, A.-J.; Huang, Q. Air Pollution, Health Shocks and Labor Mobility. Int. J. Environ. Res. Public Health 2022, 19, 1382. [Google Scholar] [CrossRef] [PubMed]
- Chen, X.-Y.; Wang, X.-Z.; Liu, F.-J.; Zhang, G.-S.; Song, X.-J.; Tian, J.; Cui, H.-Z. Fabrication of porous Zn2TiO4–ZnO microtubes and analysis of their acetone gas sensing properties. Rare Met. 2020, 40, 1528–1535. [Google Scholar] [CrossRef]
- Lin, Y.-C.; Cai, Y.; Huang, H.-Y.; Liang, D.; Li, J.; Tang, Y.; Hong, H.-C.; Yan, Q.; Huang, H.-D.; Li, Z. Air pollution and blood pressure in the elderly: Evidence from a panel study in Nanjing, China. Heliyon 2022, 8, e10539. [Google Scholar] [CrossRef]
- Baravati, Z.A.; Khanjani, N.; Malakootian, M. Air Pollution and Mortality in the Elderly in Kerman, Iran. Health Scope 2021, 10, e105567. [Google Scholar] [CrossRef]
- Chen, Y.; Cao, F.; Xiao, J.-P.; Fang, X.-Y.; Wang, X.-R.; Ding, L.-H.; Wang, D.-G.; Pan, H.-F. Emerging role of air pollution in chronic kidney disease. Environ. Sci. Pollut. Res. 2021, 28, 52610–52624. [Google Scholar] [CrossRef]
- Sillmann, J.; Aunan, K.; Emberson, L.; Bueker, P.; Van Oort, B.; O’Neill, C.; Otero, N.; Pandey, D.; Brisebois, A. Combined impacts of climate and air pollution on human health and agricultural productivity. Environ. Res. Lett. 2021, 16, 093004. [Google Scholar] [CrossRef]
- Chen, H.; Zeng, W.; Li, J.; Ma, T.; Liu, S.; Lei, G.; Gaiser, T.; Srivastava, A.K. Impact of Air Pollution on Maize and Wheat Production. Ecol. Chem. Eng. S 2022, 29, 237–256. [Google Scholar] [CrossRef]
- Rovella, N.; Aly, N.; Comite, V.; Randazzo, L.; Fermo, P.; Barca, D.; de Buergo, M.A.; La Russa, M.F. The environmental impact of air pollution on the built heritage of historic Cairo (Egypt). Sci. Total. Environ. 2020, 764, 142905. [Google Scholar] [CrossRef] [PubMed]
- Šetka, M.; Claros, M.; Chmela, O.; Vallejos, S. Photoactivated materials and sensors for NO2 monitoring. J. Mater. Chem. C 2021, 9, 16804–16827. [Google Scholar] [CrossRef]
- Laref, R.; Losson, E.; Sava, A.; Siadat, M. Empiric Unsupervised Drifts Correction Method of Electrochemical Sensors for in Field Nitrogen Dioxide Monitoring. Sensors 2021, 21, 3581. [Google Scholar] [CrossRef] [PubMed]
- Patel, S.; Park, H.; Bonato, P.; Chan, L.; Rodgers, M. A review of wearable sensors and systems with application in rehabilitation. J. Neuroeng. Rehabil. 2012, 9, 21. [Google Scholar] [CrossRef]
- Zhang, C.; Li, Y.; Liu, G.; Liu, K.; Wu, K. Room temperature NO2 sensing properties of ZnO1−α coating prepared by hydrogen reduction method. Ceram. Int. 2021, 47, 29873–29880. [Google Scholar] [CrossRef]
- Krishna, K.G.; Parne, S.; Pothukanuri, N.; Kathirvelu, V.; Gandi, S.; Joshi, D. Nanostructured metal oxide semiconductor-based gas sensors: A comprehensive review. Sens. Actuators A Phys. 2022, 341, 113578. [Google Scholar] [CrossRef]
- European Union. Directive 2008/50/EC of the European Parliament and of the Council of 21 May 2008 on ambient air quality and cleaner air for Europe. Off. J. Eur. Union 2008, 152, 1–44. [Google Scholar]
- European Parliament. Sampling Points for Air Quality; EU Publications: Luxembourg, 2019.
- Xia, T.; Catalan, J.; Hu, C.; Batterman, S. Development of a mobile platform for monitoring gaseous, particulate, and greenhouse gas (GHG) pollutants. Environ. Monit. Assess. 2020, 193, 7. [Google Scholar] [CrossRef] [PubMed]
- Chen, S.; Yuval; Broday, D.M. Re-framing the Gaussian dispersion model as a nonlinear regression scheme for retrospective air quality assessment at a high spatial and temporal resolution. Environ. Model. Softw. 2019, 125, 104620. [Google Scholar] [CrossRef]
- Samad, A.; Mimiaga, F.E.M.; Laquai, B.; Vogt, U. Investigating a Low-Cost Dryer Designed for Low-Cost PM Sensors Measuring Ambient Air Quality. Sensors 2021, 21, 804. [Google Scholar] [CrossRef]
- Russell, H.S.; Frederickson, L.B.; Kwiatkowski, S.; Emygdio, A.P.M.; Kumar, P.; Schmidt, J.A.; Hertel, O.; Johnson, M.S. Enhanced Ambient Sensing Environment—A New Method for Calibrating Low-Cost Gas Sensors. Sensors 2022, 22, 7238. [Google Scholar] [CrossRef]
- Sankar, V.; Balasubramaniam, K.; Ramaprabhu, S. Invasive Species Prosopis juliflora Derived Carbon Biomass/SnO2 based Hazardous NO2 Gas Sensor. In Proceedings of the 2021 IEEE Sensors, Sydney, Australia, 31 October–3 November 2021; pp. 1–4. [Google Scholar] [CrossRef]
- Gholami, P.; Rashidi, A.; Abbasabadi, M.K.; Pourkhalil, M.; Jahangiri, M.; Izadi, N. Synthesis and characterization of ZnO-functionalized multiwall carbon nanotubes nanocomposite as NOx gas sensor. Res. Chem. Intermed. 2020, 46, 3911–3927. [Google Scholar] [CrossRef]
- Pérez, R.; Ayala, C.; Park, J.-Y.; Choi, J.-W.; Warner, I. Coating-Based Quartz Crystal Microbalance Detection Methods of Environmentally Relevant Volatile Organic Compounds. Chemosensors 2021, 9, 153. [Google Scholar] [CrossRef]
- Mondal, B.; Meetei, M.; Das, J.; Chaudhuri, C.R.; Saha, H. Quantitative recognition of flammable and toxic gases with artificial neural network using metal oxide gas sensors in embedded platform. Eng. Sci. Technol. Int. J. 2015, 18, 229–234. [Google Scholar] [CrossRef]
- Minh, V.T.; Moezzi, R.; Owe, I. Fuel economy regression analyses for hybrid electric vehicle. Eur. J. Electr. Eng. 2018, 20, 363–377. [Google Scholar] [CrossRef]
- Spinelle, L.; Gerboles, M.; Villani, M.G.; Aleixandre, M.; Bonavitacola, F. Field calibration of a cluster of low-cost commercially available sensors for air quality monitoring. Part B: NO, CO and CO2. Sens. Actuators B Chem. 2017, 238, 706–715. [Google Scholar] [CrossRef]
- Zimmerman, N.; Presto, A.A.; Kumar, S.P.N.; Gu, J.; Hauryliuk, A.; Robinson, E.S.; Robinson, A.L.; Subramanian, R. A machine learning calibration model using random forests to improve sensor performance for lower-cost air quality monitoring. Atmospheric Meas. Tech. 2018, 11, 291–313. [Google Scholar] [CrossRef]
- Saab, S.; Fu, Y.; Ray, A.; Hauser, M. A Dynamically Stabilized Recurrent Neural Network. Neural Process. Lett. 2021, 54, 1195–1209. [Google Scholar] [CrossRef]
- Kusuma, V.; Privadi, A.; Budi, A.L.S.; Putri, V.L.B. Photovoltaic Power Forecasting Using Recurrent Neural Network Based on Bayesian Regularization Algorithm. IEEE Trans. Neural Netw. 2021, 21, 109–114. [Google Scholar] [CrossRef]
- Mirikitani, D.T.; Nikolaev, N. Recursive Bayesian Recurrent Neural Networks for Time-Series Modeling. IEEE Trans. Neural Networks 2009, 21, 262–274. [Google Scholar] [CrossRef] [PubMed]
- Aharoni, Z.; Rattner, G.; Permuter, H. Brief Announcement: Gradual Learning of Deep Recurrent Neural Network. In Proceedings of the International Symposium on Cyber Security, Cryptology, and Machine Learning, Beer-Sheva, Israel, 21–22 June 2018; pp. 274–277. [Google Scholar] [CrossRef]
- Fang, X.; Wang, Y.L.; Murphey, D.W.; MacNeille, P. Specific Humidity Forecasting using Recurrent Neural Network. In Proceedings of the 2014 International Joint Conference on Neural Networks (IJCNN), Beijing, China, 6–11 July 2014; pp. 955–960. [Google Scholar]
- Allende, H.; Moraga, C.; Nanculef, R.; Salas, R. Ensembles Methods for Machine Learning. Pattern Recognit. Mach. Vis. 2010, 6, 247–261. [Google Scholar]
- Barbez, A.; Khomh, F.; Guéhéneuc, Y.-G. A machine-learning based ensemble method for anti-patterns detection. J. Syst. Softw. 2019, 161, 110486. [Google Scholar] [CrossRef]
- Li, T.; Wang, Y.; Yuan, Q. Remote Sensing Estimation of Regional NO2 via Space-Time Neural Networks. Remote Sens. 2020, 12, 2514. [Google Scholar] [CrossRef]
- Ghahremanloo, M.; Lops, Y.; Choi, Y.; Yeganeh, B. Deep Learning Estimation of Daily Ground-Level NO2 Concentrations from Remote Sensing Data. J. Geophys. Res. Atmos. 2021, 126, e2021JD034925. [Google Scholar] [CrossRef]
- Beloconi, A.; Vounatsou, P. Bayesian geostatistical modelling of high-resolution NO2 exposure in Europe combining data from monitors, satellites and chemical transport models. Environ. Int. 2020, 138, 105578. [Google Scholar] [CrossRef] [PubMed]
- Pankratova, N.D.; Nedashkovskaya, N.I. A decision support system for evaluation of decision alternatives on basis of a network criteria model. In Proceedings of the 2017 IEEE First Ukraine Conference on Electrical and Computer Engineering (UKRCON), Kyiv, Ukraine, 29 May–2 June 2017; pp. 830–835. [Google Scholar] [CrossRef]
- Zhang, H.; Zhao, H.; Li, H.; Chen, Y.; Ai, J.; Wang, Q. A Decision Support System of Premium Power Supply Investment. In Proceedings of the 2020 5th Asia Conference on Power and Electrical Engineering (ACPEE 2020), Chengdu, China, 4–7 June 2020; pp. 934–939. [Google Scholar]
- Khodabakhshi, S.; Abbasabadi, M.K.; Heydarian, S.; Shirazi, S.G.; Marahel, F. Fe3O4 Nanoparticles as Highly Efficient and Recyclable Catalyst for the Synthesis of 4-Hydroxy-3-[aryloyl(benzamido)methyl]coumarin under Solvent-Free Conditions. Lett. Org. Chem. 2015, 12, 465–470. [Google Scholar] [CrossRef]
- Hummers, W.S., Jr.; Offeman, R.E. Preparation of Graphitic Oxide. J. Am. Chem. Soc. 1958, 80, 1339. [Google Scholar] [CrossRef]
- Abbasabadi, M.K.; Rashidi, A.; Khodabakhshi, S. Benzenesulfonic acid-grafted graphene as a new and green nanoadsorbent in hydrogen sulfide removal. J. Nat. Gas Sci. Eng. 2016, 28, 87–94. [Google Scholar] [CrossRef]
- Rashidi, A.; Tavakoli, Z.; Tarak, Y.; Khodabakhshi, S.; Abbasabadi, M.K. One-pot and Environmentally Friendly Synthesis of New Spiroindolones Using Functionalized Multiwall Carbon Nanotubes as Powerful Catalyst. J. Chin. Chem. Soc. 2016, 63, 399–403. [Google Scholar] [CrossRef]
- Abbasabadi, M.K.; Zand, H.R.E.; Khodabakhshi, S.; Gholami, P.; Rashidi, A. Synthesis of new functionalized reduced graphene oxide quantum dot composite for high-performance NO2 gas sensor. Res. Chem. Intermed. 2021, 47, 2279–2296. [Google Scholar] [CrossRef]
- Amdoun, R.; Khelifi, L.; Khelifi-Slaoui, M.; Amroune, S.; Asch, M.; Assaf-Ducrocq, C.; Gontier, E. The desirability optimization methodology: A tool to predict two antagonist responses in biotechnological systems: Case of biomass growth and hyoscy-amine content in elicited Datura starmonium hairy roots. Iran. J. Biotechnol. 2018, 16, e1339. [Google Scholar] [CrossRef]
- Eibe, F.; Hall, M.; Witten, I. The WEKA Workbench. Online Appendix for “Data Mining: Practical Machine Learning Tools and Techniques”, 4th ed.; Morgan Kaufmann: Burlington, MA, USA, 2016. [Google Scholar]
- Rajalakshmi, A.; Vinodhini, R.; Bibi, K.F. Data Discretization Technique Using WEKA Tool. IJCSET 2016, 6, 293–298. [Google Scholar]
- Song, N.; Zhu, M.; Zhou, G.; Guo, L.; Mu, Y.; Gao, J.; Zhang, K. Design and optimization of halbach permanent magnet array with rectangle section and trapezoid section. Int. J. Eng. Trans. B Appl. 2021, 34, 184–191. [Google Scholar] [CrossRef]
- Arab, M.; Akbarian, H.; Gheibi, M.; Akrami, M.; Fathollahi-Fard, A.M.; Hajiaghaei-Keshteli, M.; Tian, G. A soft-sensor for sustainable operation of coagulation and flocculation units. Eng. Appl. Artif. Intell. 2022, 115, 105315. [Google Scholar] [CrossRef]
- Mahmood, Y.; Hussein, M.A. Intrusion Detection System Based on K-Star Classifier and Feature Set Reduction. IOSR J. Comput. Eng. 2013, 15, 107–112. [Google Scholar]
- Taghavian, H.; Ranaei-Siadat, S.O.; Kalaee, M.R.; Mazinani, S.; Ranaei-Siadat, S.E.; Harati, J. Optimizing the activity of immobilized phytase on starch blended polyacrylamide nanofibers-nanomembranes by response surface methodology. Fibers Polym. 2015, 16, 1048–1056. [Google Scholar] [CrossRef]
- Taghavian, H.; Ranaei-Siadat, S.O.; Kalaee, M.R.; Mazinani, S. Investigation of the effects of starch on the physical and biological properties of polyacrylamide (PAAm)/starch nanofibers. Prog. Biomater. 2017, 6, 85–96. [Google Scholar] [CrossRef] [PubMed]
- Harati, J.; Ranaei Siadat, S.O.; Taghavian, H.; Kaboli, S.; Khorshidi, S. Improvement in biochemical characteristics of glycosylated phytase through immobilization on nanofibers. Biocatal. Agric. Biotechnol. 2017, 12, 96–103. [Google Scholar] [CrossRef]


| Source | Std. Dev. | R-Squared | Adjusted R-Squared | Predicted R-Squared | PRESS | |
|---|---|---|---|---|---|---|
| Linear | 68.95459 | 0.870631 | 0.85215 | 0.799389 | 154,836 | |
| 2FI | 39.13109 | 0.964289 | 0.952386 | 0.911022 | 68,675.3 | |
| Quadratic | 29.09954 | 0.983543 | 0.973669 | 0.78265 | 167,755.1 | Suggested |
| Cubic | 23.78363 | 0.996336 | 0.982411 | −0.32398 | 1,021,879 |
| Source | Std. Dev. | R-Squared | Adjusted R-Squared | Predicted R-Squared | PRESS | |
|---|---|---|---|---|---|---|
| Linear | 24.05909 | 0.716192 | 0.675649 | 0.534586 | 19,933.96 | |
| 2FI | 7.598312 | 0.975737 | 0.967649 | 0.915811 | 3605.856 | |
| Quadratic | 7.622766 | 0.97965 | 0.96744 | 0.875495 | 5332.603 | |
| Cubic | 2.11794 | 0.999476 | 0.997486 | 0.769755 | 9861.54 | Suggested |
| Number | Fe3O4 Additive | NO2 | Sensitivity | Response Time |
|---|---|---|---|---|
| 1 | 19.44 | 25.46 | 95.37 | 1.97617 |
| 2 | 11.41 | 42.33 | 125.7 | 19.98893 |
| 3 | 8.53 | 37.59 | 109.7 | 27.67409 |
| 4 | 9.92 | 47.13 | 114.57 | 25.29973 |
| 5 | 13.8 | 36.61 | 77.71 | 23.8952 |
| 6 | 11.82 | 40.25 | 93.28 | 18.28288 |
| Number | Fe3O4 Additive | NO2 | Response Time | Sensitivity |
|---|---|---|---|---|
| 1 | 16.06 | 36.48 | 38.24 | 99.99985 |
| 2 | 2.53 | 15.7 | 163.88 | 99.99991 |
| 3 | 4.07 | 24.2 | 57.59 | 99.99984 |
| 4 | 1.99 | 9.02 | 215.99 | 99.99991 |
| 5 | 8.36 | 22.53 | 49.91 | 99.99987 |
| 6 | 5.29 | 20.51 | 89.78 | 100.0001 |
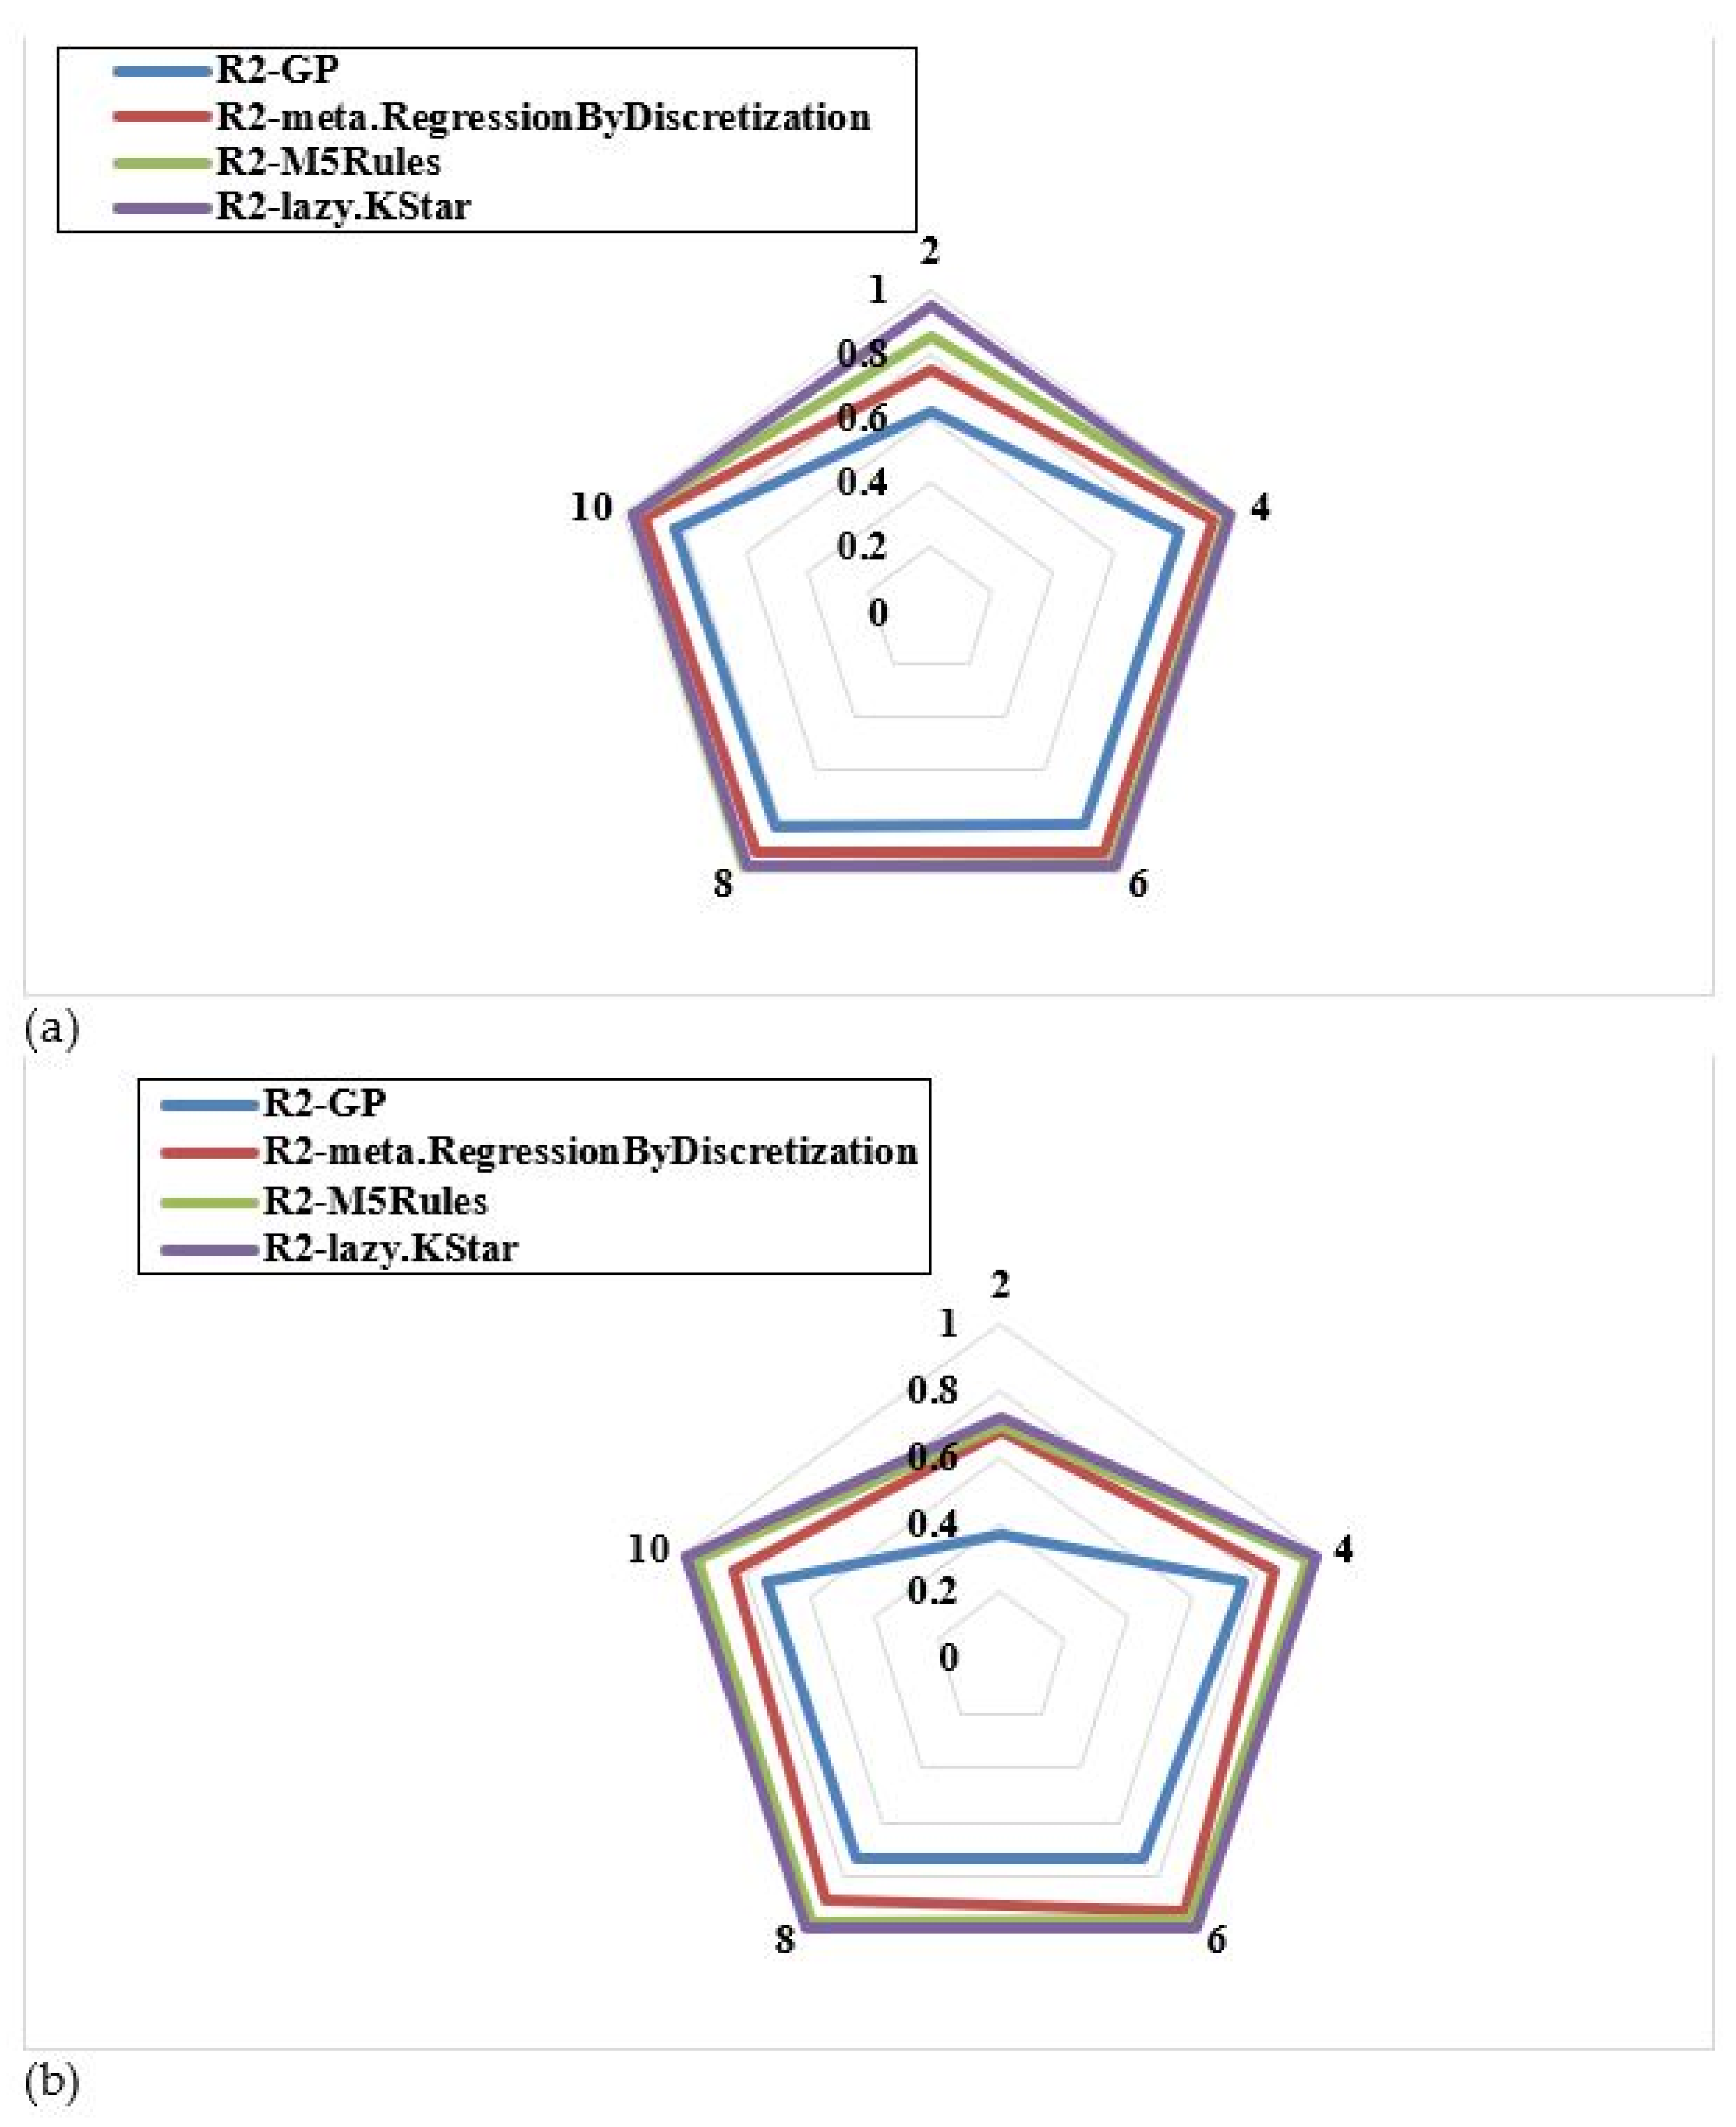
| Response Time—Statistical Indicators | GP | Meta.RegressionByDiscretization | M5Rules | Lazy.KStar |
|---|---|---|---|---|
| Correlation coefficient | 0.8306 | 0.9351 | 0.974 | 0.97 |
| Mean absolute error | 113.7162 | 49.2271 | 32.4638 | 37.5175 |
| Root mean squared error | 142.3465 | 63.0765 | 41.4937 | 47.3799 |
| Relative absolute error | 74.72% | 32.34% | 20.80% | 24.04% |
| Root relative squared error | 76.51% | 33.90% | 22.10% | 25.23% |
| Sensitivity—Statistical Indicators | GP | Meta.RegressionByDiscretization | Rules.M5Rules | Lazy.KStar |
|---|---|---|---|---|
| Correlation coefficient | 0.7555 | 0.9299 | 0.9621 | 0.9888 |
| Mean absolute error | 21.06 | 10.6165 | 9.125 | 4.8856 |
| Root mean squared error | 27.64 | 18.0346 | 11.299 | 10.3669 |
| Relative absolute error | 60.19% | 29.73% | 26.32% | 13.96% |
| Root relative squared error | 61.81% | 39.70% | 25.48% | 23.18% |
Disclaimer/Publisher’s Note: The statements, opinions and data contained in all publications are solely those of the individual author(s) and contributor(s) and not of MDPI and/or the editor(s). MDPI and/or the editor(s) disclaim responsibility for any injury to people or property resulting from any ideas, methods, instructions or products referred to in the content. |
© 2023 by the authors. Licensee MDPI, Basel, Switzerland. This article is an open access article distributed under the terms and conditions of the Creative Commons Attribution (CC BY) license (https://creativecommons.org/licenses/by/4.0/).
Share and Cite
Gheibi, M.; Taghavian, H.; Moezzi, R.; Waclawek, S.; Cyrus, J.; Dawiec-Lisniewska, A.; Koci, J.; Khaleghiabbasabadi, M. Design of a Decision Support System to Operate a NO2 Gas Sensor Using Machine Learning, Sensitive Analysis and Conceptual Control Process Modelling. Chemosensors 2023, 11, 126. https://doi.org/10.3390/chemosensors11020126
Gheibi M, Taghavian H, Moezzi R, Waclawek S, Cyrus J, Dawiec-Lisniewska A, Koci J, Khaleghiabbasabadi M. Design of a Decision Support System to Operate a NO2 Gas Sensor Using Machine Learning, Sensitive Analysis and Conceptual Control Process Modelling. Chemosensors. 2023; 11(2):126. https://doi.org/10.3390/chemosensors11020126
Chicago/Turabian StyleGheibi, Mohammad, Hadi Taghavian, Reza Moezzi, Stanislaw Waclawek, Jindrich Cyrus, Anna Dawiec-Lisniewska, Jan Koci, and Masoud Khaleghiabbasabadi. 2023. "Design of a Decision Support System to Operate a NO2 Gas Sensor Using Machine Learning, Sensitive Analysis and Conceptual Control Process Modelling" Chemosensors 11, no. 2: 126. https://doi.org/10.3390/chemosensors11020126
APA StyleGheibi, M., Taghavian, H., Moezzi, R., Waclawek, S., Cyrus, J., Dawiec-Lisniewska, A., Koci, J., & Khaleghiabbasabadi, M. (2023). Design of a Decision Support System to Operate a NO2 Gas Sensor Using Machine Learning, Sensitive Analysis and Conceptual Control Process Modelling. Chemosensors, 11(2), 126. https://doi.org/10.3390/chemosensors11020126