Article

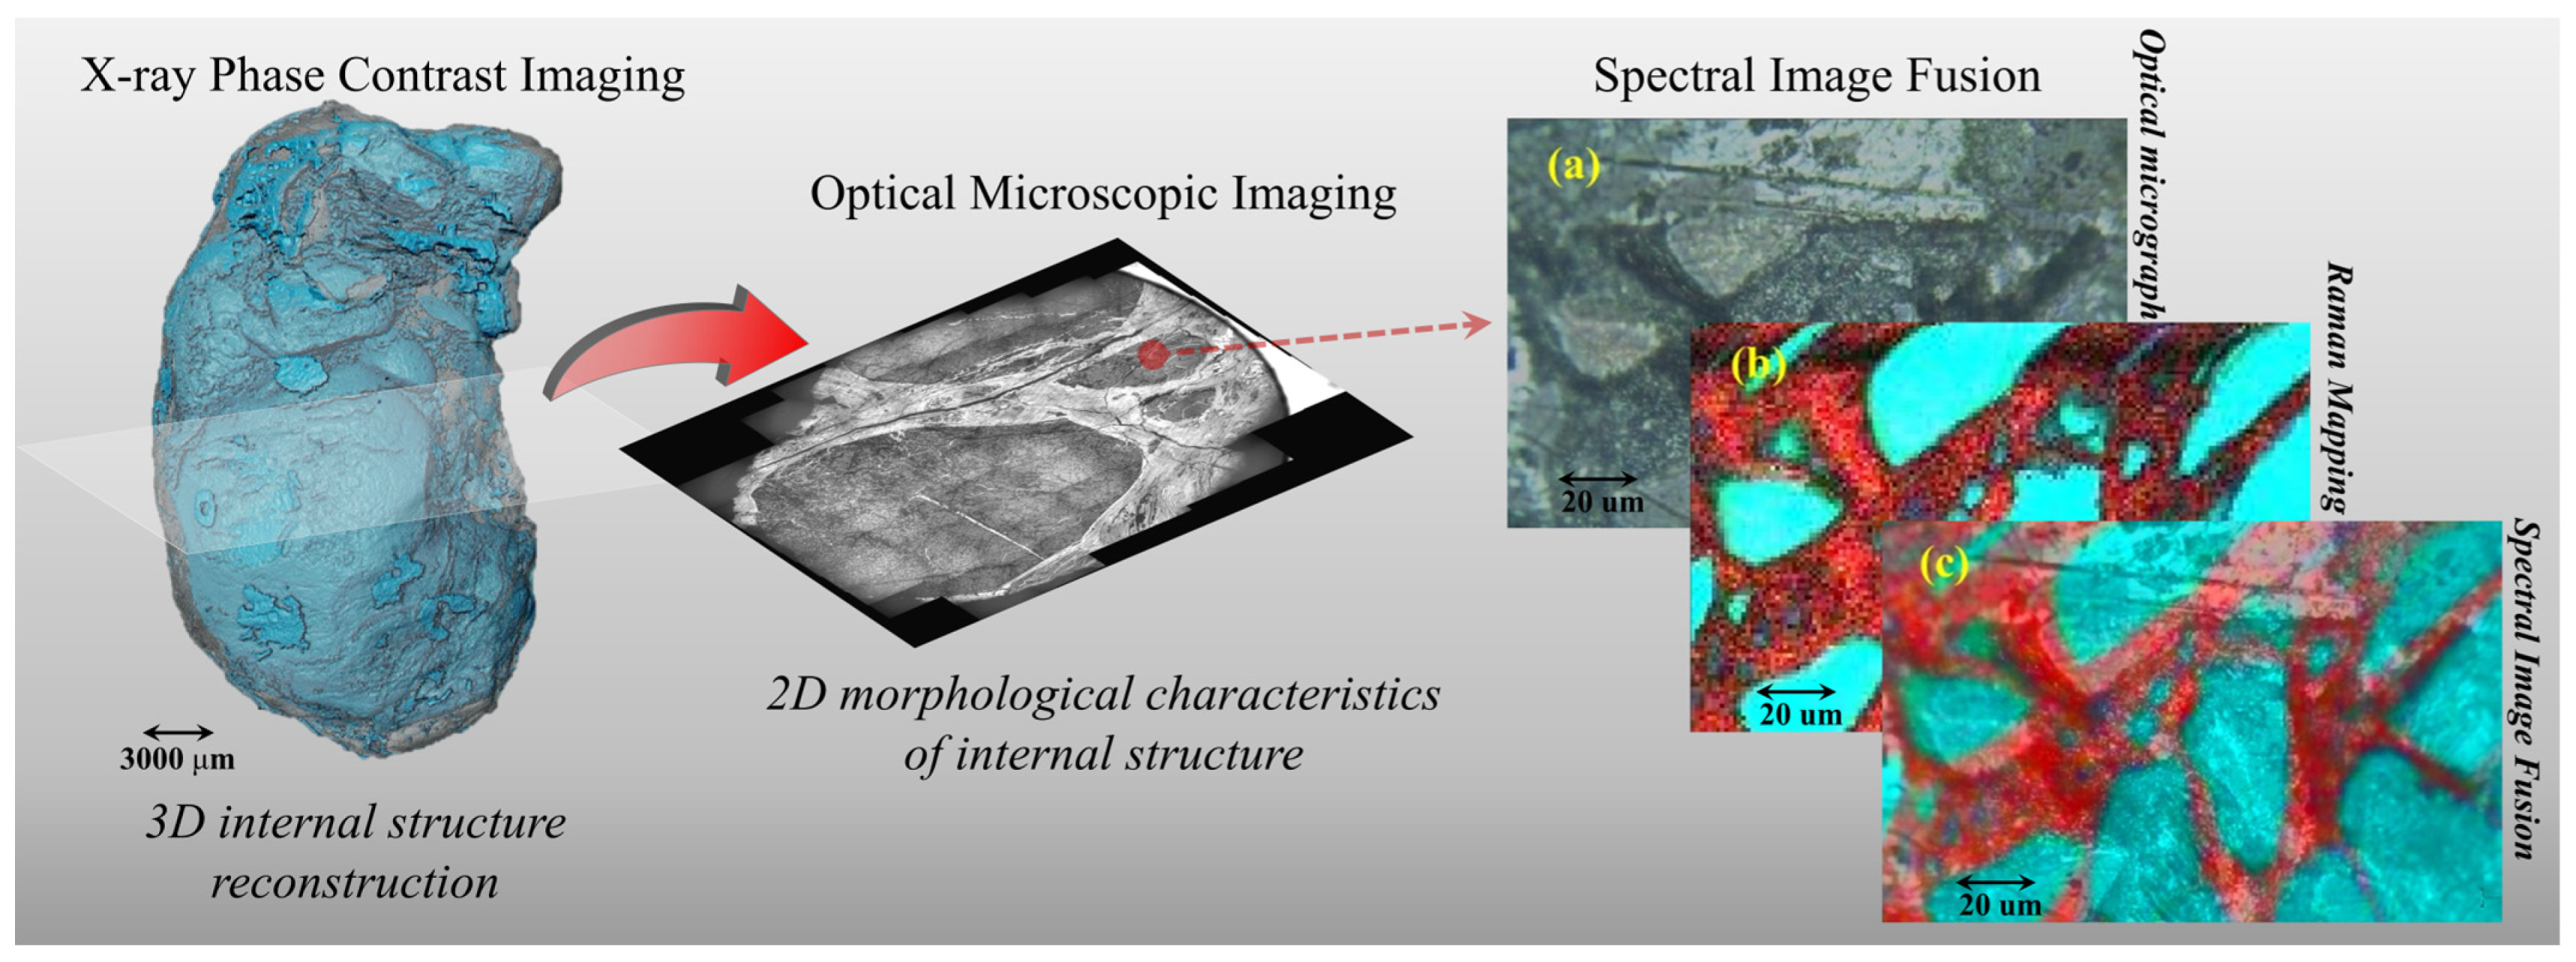
Rapid Determination of Meteorolite Composition Based on X-ray Phase Contrast Imaging-Assisted Raman Spectroscopy

1
Key Laboratory of Space Active Opto-Electronics Technology of the Chinese Academy of Sciences, Shanghai Institute of Technical Physics, Chinese Academy of Sciences, Shanghai 200083, China
2
College of Surveying and Geo-Informatics, Tongji University, Shanghai 200092, China
3
Key Laboratory of Systems Health Science of Zhejiang Province, School of Life Science, Hangzhou Institute for Advanced Study, University of Chinese Academy of Sciences, Hangzhou 310024, China
4
University of Chinese Academy of Sciences, Beijing 100049, China
5
HT-NOVA Co., Ltd., Beijing 101312, China
6
Shanghai Synchrotron Radiation Facility, Shanghai Advanced Research Institute, Chinese Academy of Sciences, Shanghai 201204, China
*
Authors to whom correspondence should be addressed.
These authors contributed equally to this work.
Chemosensors 2023, 11(11), 563; https://doi.org/10.3390/chemosensors11110563
Submission received: 25 August 2023 / Revised: 4 November 2023 / Accepted: 8 November 2023 / Published: 12 November 2023

Abstract

:
Returning extraterrestrial samples to Earth has become essential for future deep space exploration. Achieving a comprehensive evaluation of the physical and chemical properties of samples with minimal damage is key to analyzing extraterrestrial samples in the future, as well as to the future sampling and returning of heterogeneous solid samples. This article aims to reconstruct the three-dimensional internal structure of high-contrast objects, select sections of interest through internal structure and detail features, and then analyze the physical and chemical properties of the samples based on laser spectroscopy technology. This paper proposes a strategy based on Raman mapping and X-ray phase-contrast imaging technology to reconstruct the three-dimensional internal structure of a heterogeneous solid sample and detect the substance composition of the region of interest. This study takes meteorite samples as an example and uses X-ray phase-contrast imaging technology to distinguish and reconstruct the spatial distribution of different components in the meteorite, providing a three-dimensional visualization reference with a high spatial resolution for the spatial positioning of the region of interest. Raman spectroscopy, in combination with LIBS, was used to further identify the meteorite as pallasite and to achieve the spectral image fusion of high spatial and high spectral resolutions. The experimental results show that the unknown meteorite’s three-dimensional structure and its components’ spatial distribution can be evaluated based on Raman mapping combined with X-ray phase-contrast imaging technology. This article provides a highly valuable analytical strategy by which to analyze samples returned from deep space exploration.

1. Introduction

Cutting meteorites into slices or processing broken samples are classical methods by which to analyze their physical properties and chemical compositions by. For some meteorites with high scientific research value or jades with high economic value, rock ore slices are usually selected for refined analysis to reduce irreversible structural damage as much as possible. In general, the cutting of rocks and jade depends on the operator’s experience and professional background. It relies on subjective judgment based on experience, with a certain randomness, similar to cutting “gambling stones”. To explore a meteorite’s internal microstructure, one needs to conduct a detailed analysis by cutting it. However, one cannot analyze the composition information stored in a meteorite before cutting it. Therefore, the question of how to cut, and from which angle to cut, directly affects the internal presentation of the specific details. Likewise, the question of how, and from which angle, to cut directly affects the subsequent mineral’s internal representation of the detailed information. Therefore, we propose a comprehensive evaluation method for a mineral’s spatial structure and composition distribution based on Raman mapping and X-ray phase-contrast imaging technology. X-ray three-dimensional imaging technology, especially when combined with CT, has been used to image biological remains in fossils and identify special biological resources [1,2]. These techniques have unique advantages when assessing the internal structure of an opaque body. However, they cannot reveal the composition of the spatial inter-texture or achieve high spatial resolution imaging of the internal components. Raman mapping is an optical imaging technique using Raman spectral detection and scanning imaging, such as single-point and line scanning [3,4,5]. However, it is based on micro- and nano-scale microstructures and is limited to the small field of view and low imaging flux on a sample’s surface. Additionally, Raman spectroscopy, as a molecular detection technique, has an essential advantage in molecular mineral recognition [6,7] but is ineffective with regard to metallic materials [8]. In the past decade, there have been many studies involving molecular detection based on micro-Raman spectroscopy in different application scenarios, such as analyses of prehistoric rock art [9,10,11], biological tissue or cell [12,13,14], meteorites [15,16], and others [17,18]. Raman spectroscopy is a spectroscopic technology suitable for the detection of mineral molecules. This technology has an advantage in offering non-destructive, in situ detection and microscopic analysis. Most importantly, Raman mapping can be realized by combining the point scanning detection method. The application of Raman spectroscopy combined with X-ray phase-contrast imaging technology in mineral samples has yet to be reported. Nevertheless, the study of X-ray fluorescence and laser-induced breakdown spectroscopy-assisted Raman spectroscopy technology has been applied to characterize the mineral phases of meteorites [19].
In this work, X-ray phase contrast imaging technology and Raman mapping have been used to analyze a mineral’s spatial structure and composition detection. X-ray phase contrast imaging technology can provide a complete view of the interior structure of the mineral, give an informed choice for sample cutting and guide the accurate location of a region of interest. Raman spectroscopy is used to characterize the mineral composition of the slice, which can then be correlated with the 3D internal structure reconstruction model to speculate the overall characteristics of the mineral.

2. Materials and Methods

The pallasite came from the Boyuan geological specimen studio and was discovered in the wild. It should be emphasized that this meteorite has yet to be certified by international professional institutions, but this does not affect research on methodological exploration. The research route and scheme adopted in this paper to comprehensively conduct the mineral research are as follows. Firstly, the internal morphologies of the minerals are determined with the combination of X-ray phase contrast imaging technology. The cutting surface is located using three-dimensional morphology reconstruction. Secondly, Raman mapping, combined with microscopic imaging, is used to detect molecular structures and distribution in a small area. Finally, we determine the detection of element composition and distribution characteristics in a small area to realize the mineral from macro-3D reconstruction to micro-optics and spectroscopy 2D imaging, and complete the detection of the element, molecular composition, and distribution characteristics. The entire research process proceeds from the macro to the micro before completing the micro-scale imaging and phase characterization, as shown in Figure 1.
The experimental parameters of the specific technology in this article are as follows:

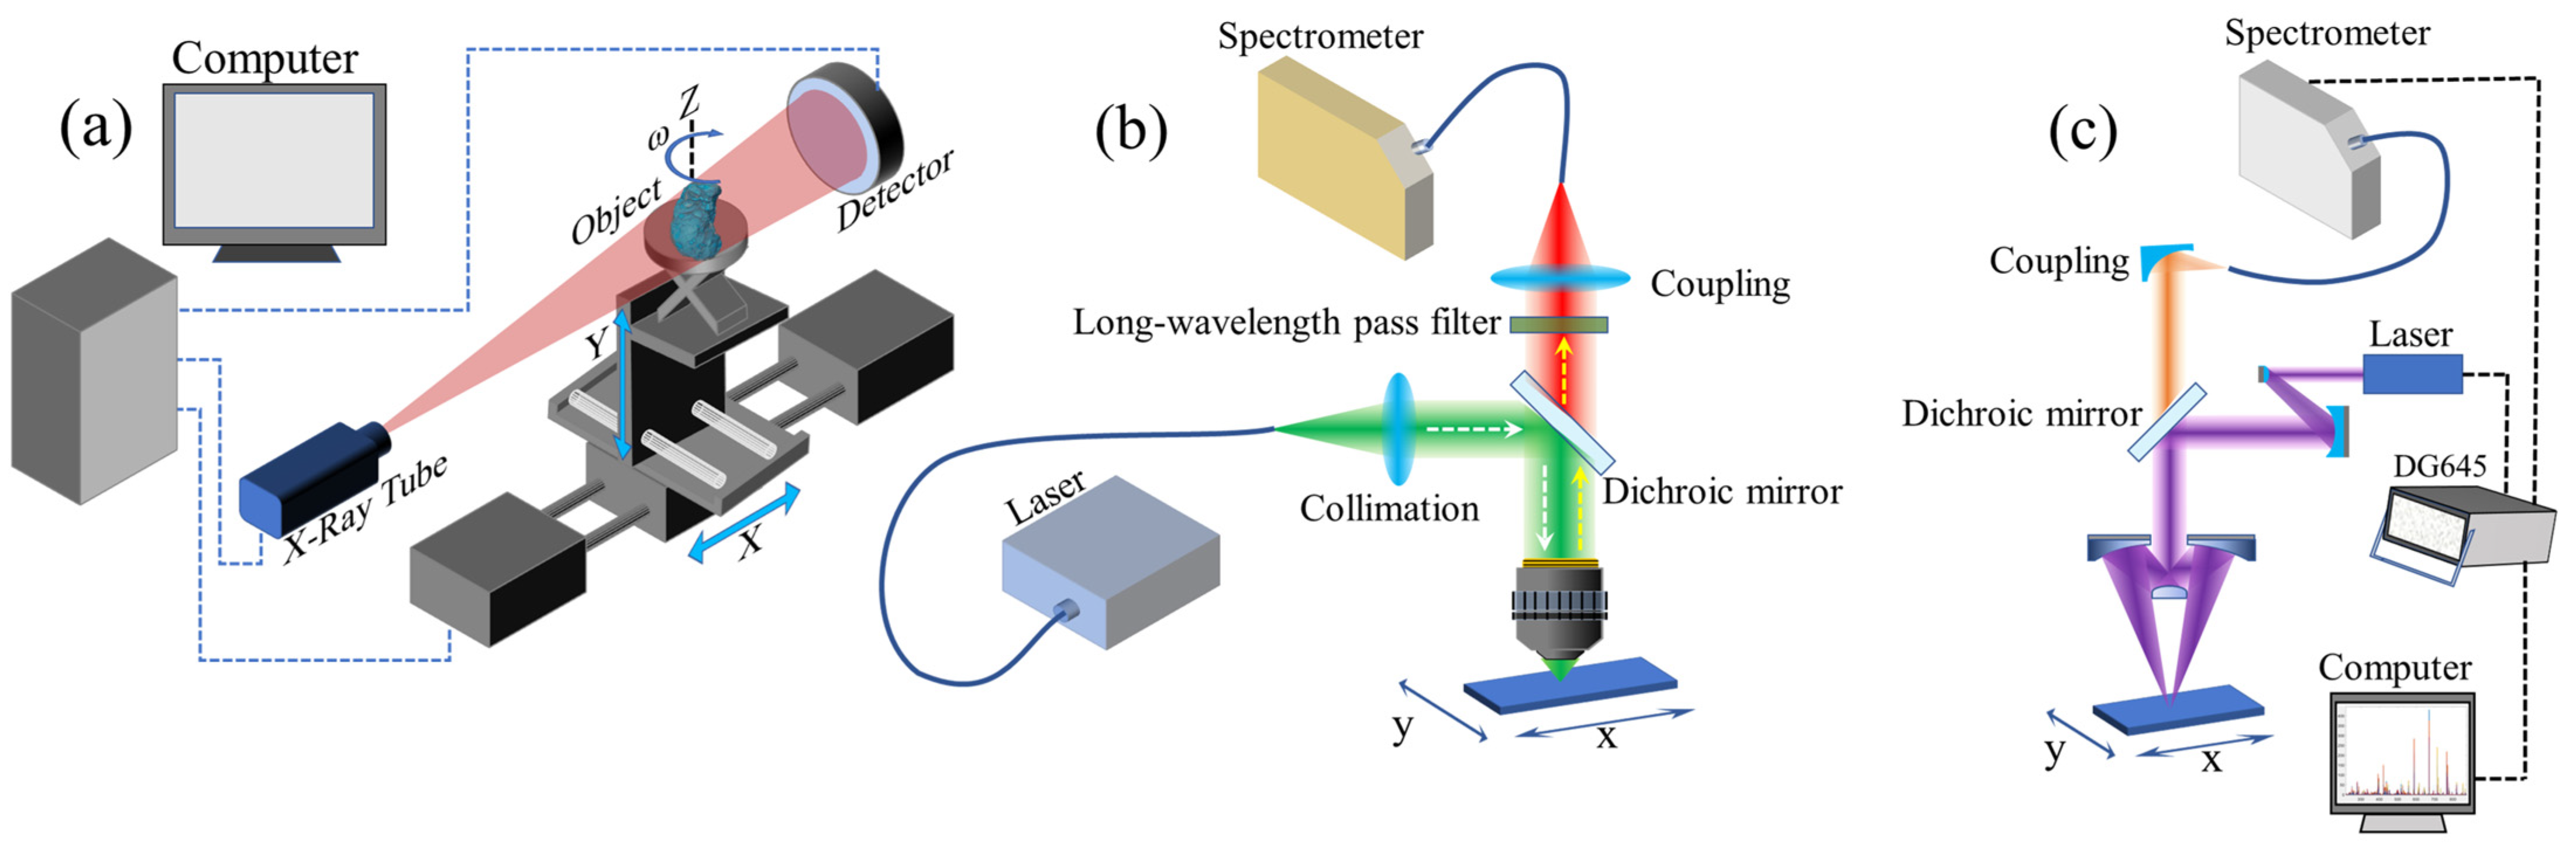
2.1. X-ray Phase Contrast Imaging Technology

(1) A home-built X-ray phase contrast imaging system was used. The micro-focus transmission tungsten target X-ray tube (XWT-225-THE Plus, X-ray WorXGmbH, Garbsen, Germany) was used in the hardware system. The voltage range of this tube is 20~225 kV, current content is 20~1000 μA, focus size is 2 μm, maximum target power is 50 W, X-ray angle is 160°, and the X-ray source can continuously provide a stable X-ray beam for 4 h. The extensive field-of-view high-resolution imaging was realized using a complementary metal oxide semiconductor (CMOS) X-ray (Rad-icon 2329, Teledyne DALSA, Milpitas, USA) on GdOS scintillate, where the single-pixel size of the detector is 49.5 μm, the pixel array is 4608 × 5890, and the imaging plane is 291 mm.
(2) In the system, the X-ray source, the sample table, and the detector are all placed on the same axis upon which the X-ray source is fixed. The sample table can perform x, y, z along a three-dimensional translation and w along a one-dimensional rotation and four-dimensional motion. At the same time, the sample stage and detector can be moved along the x-direction to adjust the source–object distance (SOD) and the source–detector distance (SDD) to adjust the geometric magnification of the imaging system arbitrarily. The minimum SOD is 10 mm and the maximum SDD is 1570 mm. The maximum geometric magnification is 157×, and the corresponding adequate pixel size is 0.32 μm. The exposure time can range from a few hundred milliseconds to more than ten seconds, depending on the imaging conditions. The specific experimental parameters are provided in Table 1 below.

2.2. Microphotograph

An Olympus IX73 manual inverted microscope was equipped with an achromatic microscope objective (UPLFLN 4X, Olympus, Tokyo, Japan), and a Tucsen camera (Fuzhou Tucsen Photonics Co.,Ltd, Fuzhou, China) to take gray images. The picture resolution is 1280 pixel × 952 pixel, the photo exposure time is 280 μs, and the gain is 11.967 db.

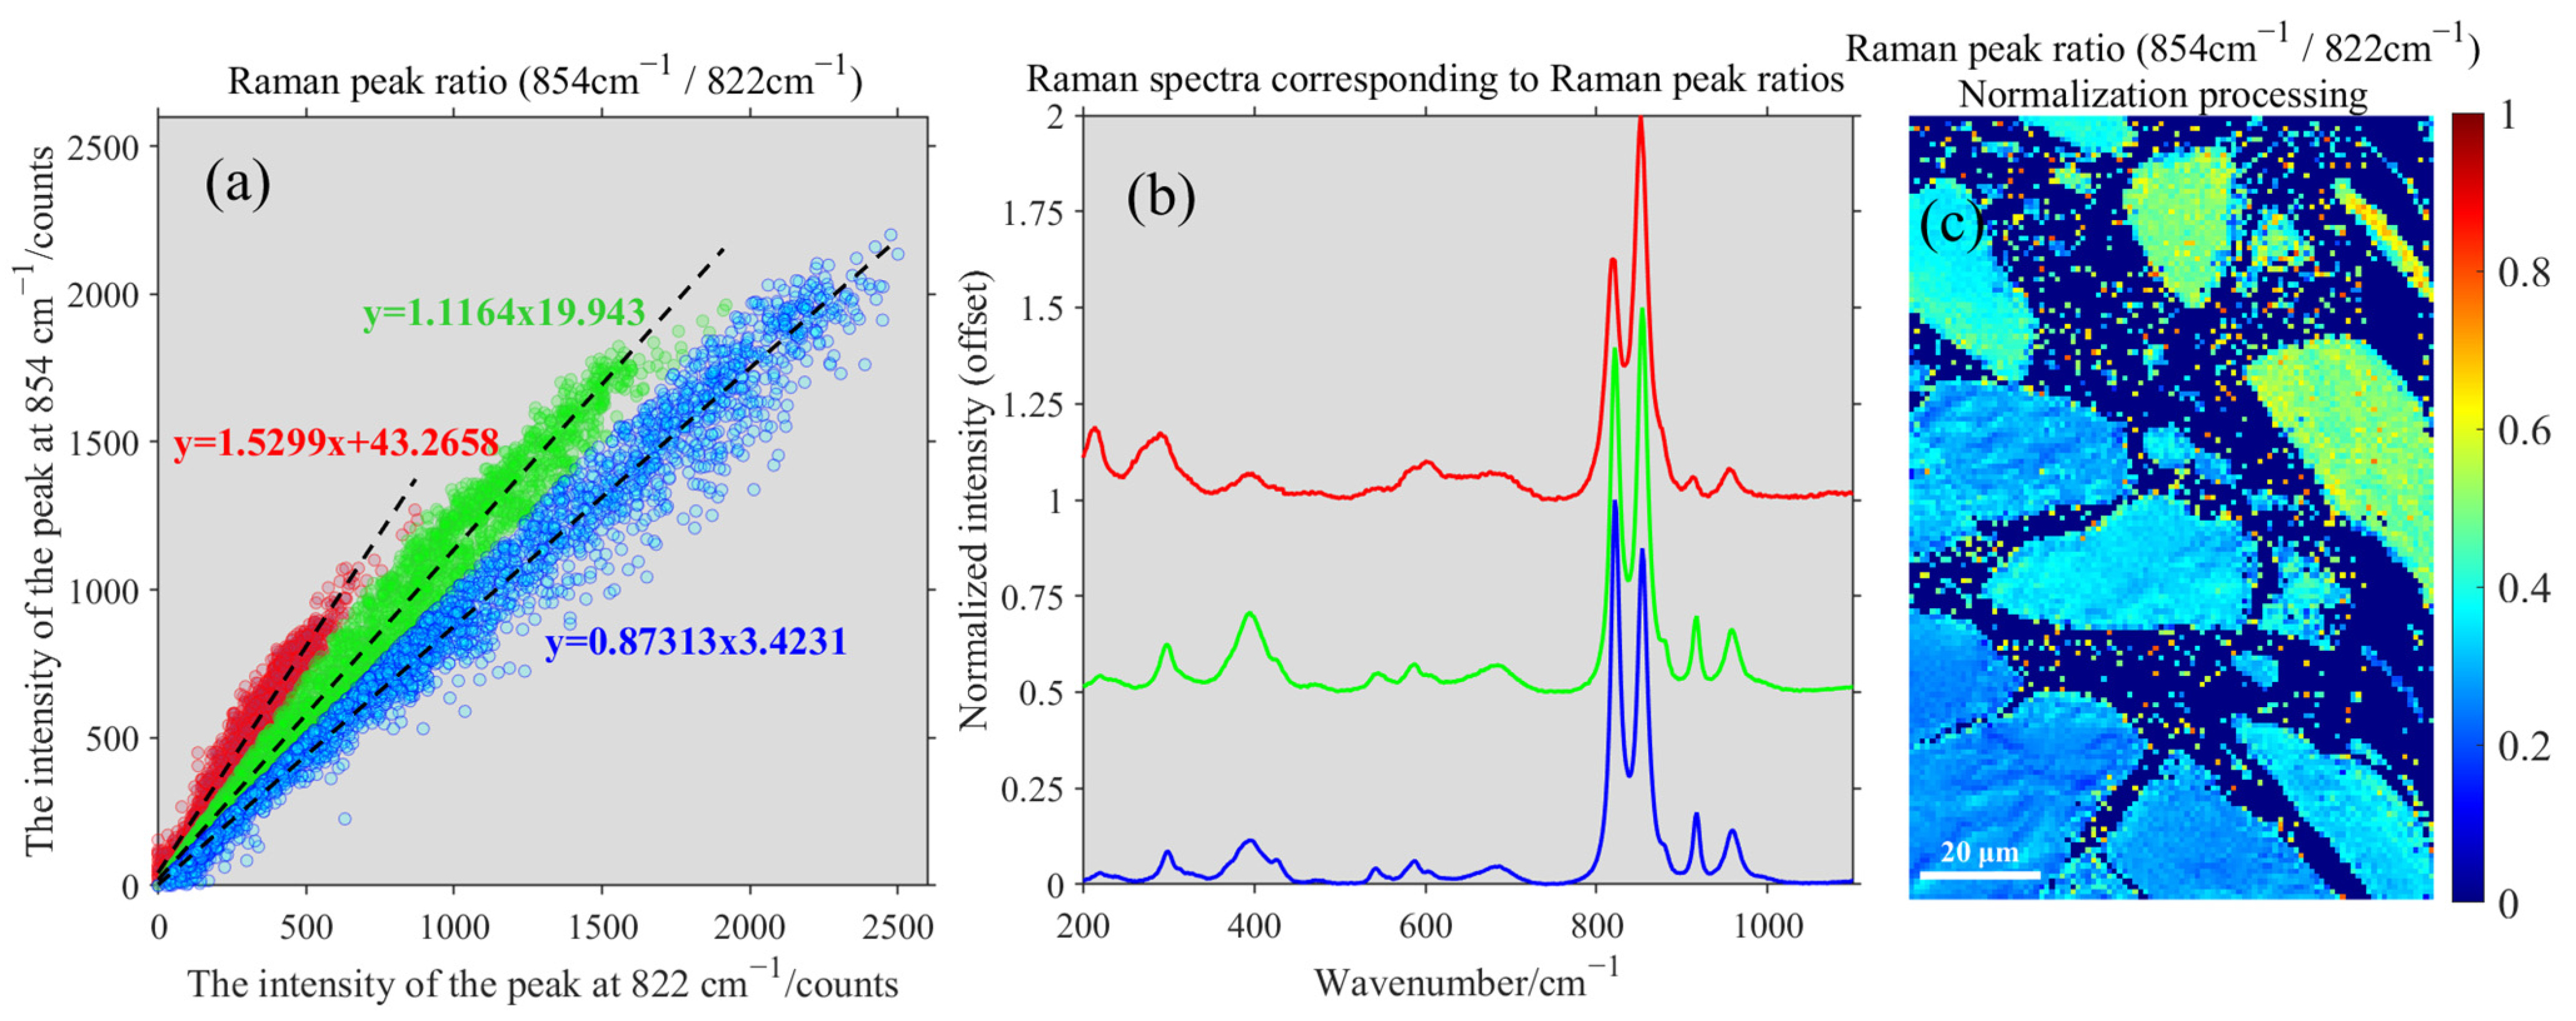
2.3. Raman Mapping Technology

A home-built laser confocal micro-Raman spectrometer system was used. The parameters of the system are as follows: The wavelength of the laser is 532 nm, the spectral line width is better than 0.00001 nm, the focused energy is 10 mW, the effective diameter of the laser focusing spot is 1 μm, the wavelength range of the spectrometer is 100~1868 cm−1, the resolution is better than 1.5 cm−1, and the integration time is 100 ms.

2.4. Laser-Induced Breakdown Spectroscopy Technology

A home-built laser-induced breakdown spectrometer system was used. The parameters of the system are as follows: the wavelength of the laser is 266 nm, the single pulse energy is better than 12 μJ at 1 kHz, the repetition frequency 1 kHz, the pulse width less than 1.0 ns, pulse-to-pulse RMS less than 2% at 1 kHz and the beam diameter 900 ± 200 µm. The UV laser was focused on the meteorite profile through a cassegrain microscope objective (REFLX OBJ. 10X/0.23NA DUV INFIN (Edmund Optics®, Barrington, IL, USA), DUV-enhanced aluminum coating (150~11,000 nm), NA: 0.22, aperture diameter: 8.6 mm, focal length: 19.3 mm, and working distance: 30.56 mm). The spectrometer was an AvaSpec-ULS2048x64TEC (Avantes Technology, Apeldoorn, Netherlands) with a 1200 lines/mm grating in a range of 347~600 nm, the signal-to-noise ratio was 550:1, the resolution was better than 0.1 nm, and the integration time was 100 ms. The model of the 266 nm laser BrightLine® single-edge laser dichroic beamsplitter (IDEX Health & Science, LLC, Rochester, NY, USA) is Di01-R266-25×36, and its reflection band is 200~1000 nm, reflectivity is better than 94%, transmission band is 277~1200 nm, and transmittance is better than 90%. The model of the 266 nm RazorEdge® ultra-steep long-pass edge filter (IDEX Health & Science, LLC, Rochester, NY, USA) is LP02-266RU-25, the transmission band is 272.4~600 nm, the transmittance is better than 90%, and the edge wavelength is 268.6 nm. The coupler was a UV-reflective collecting mirror. The spot diameter of the LIBS system is 20 μm, and the diameter of the ablation hole is 40 μm.

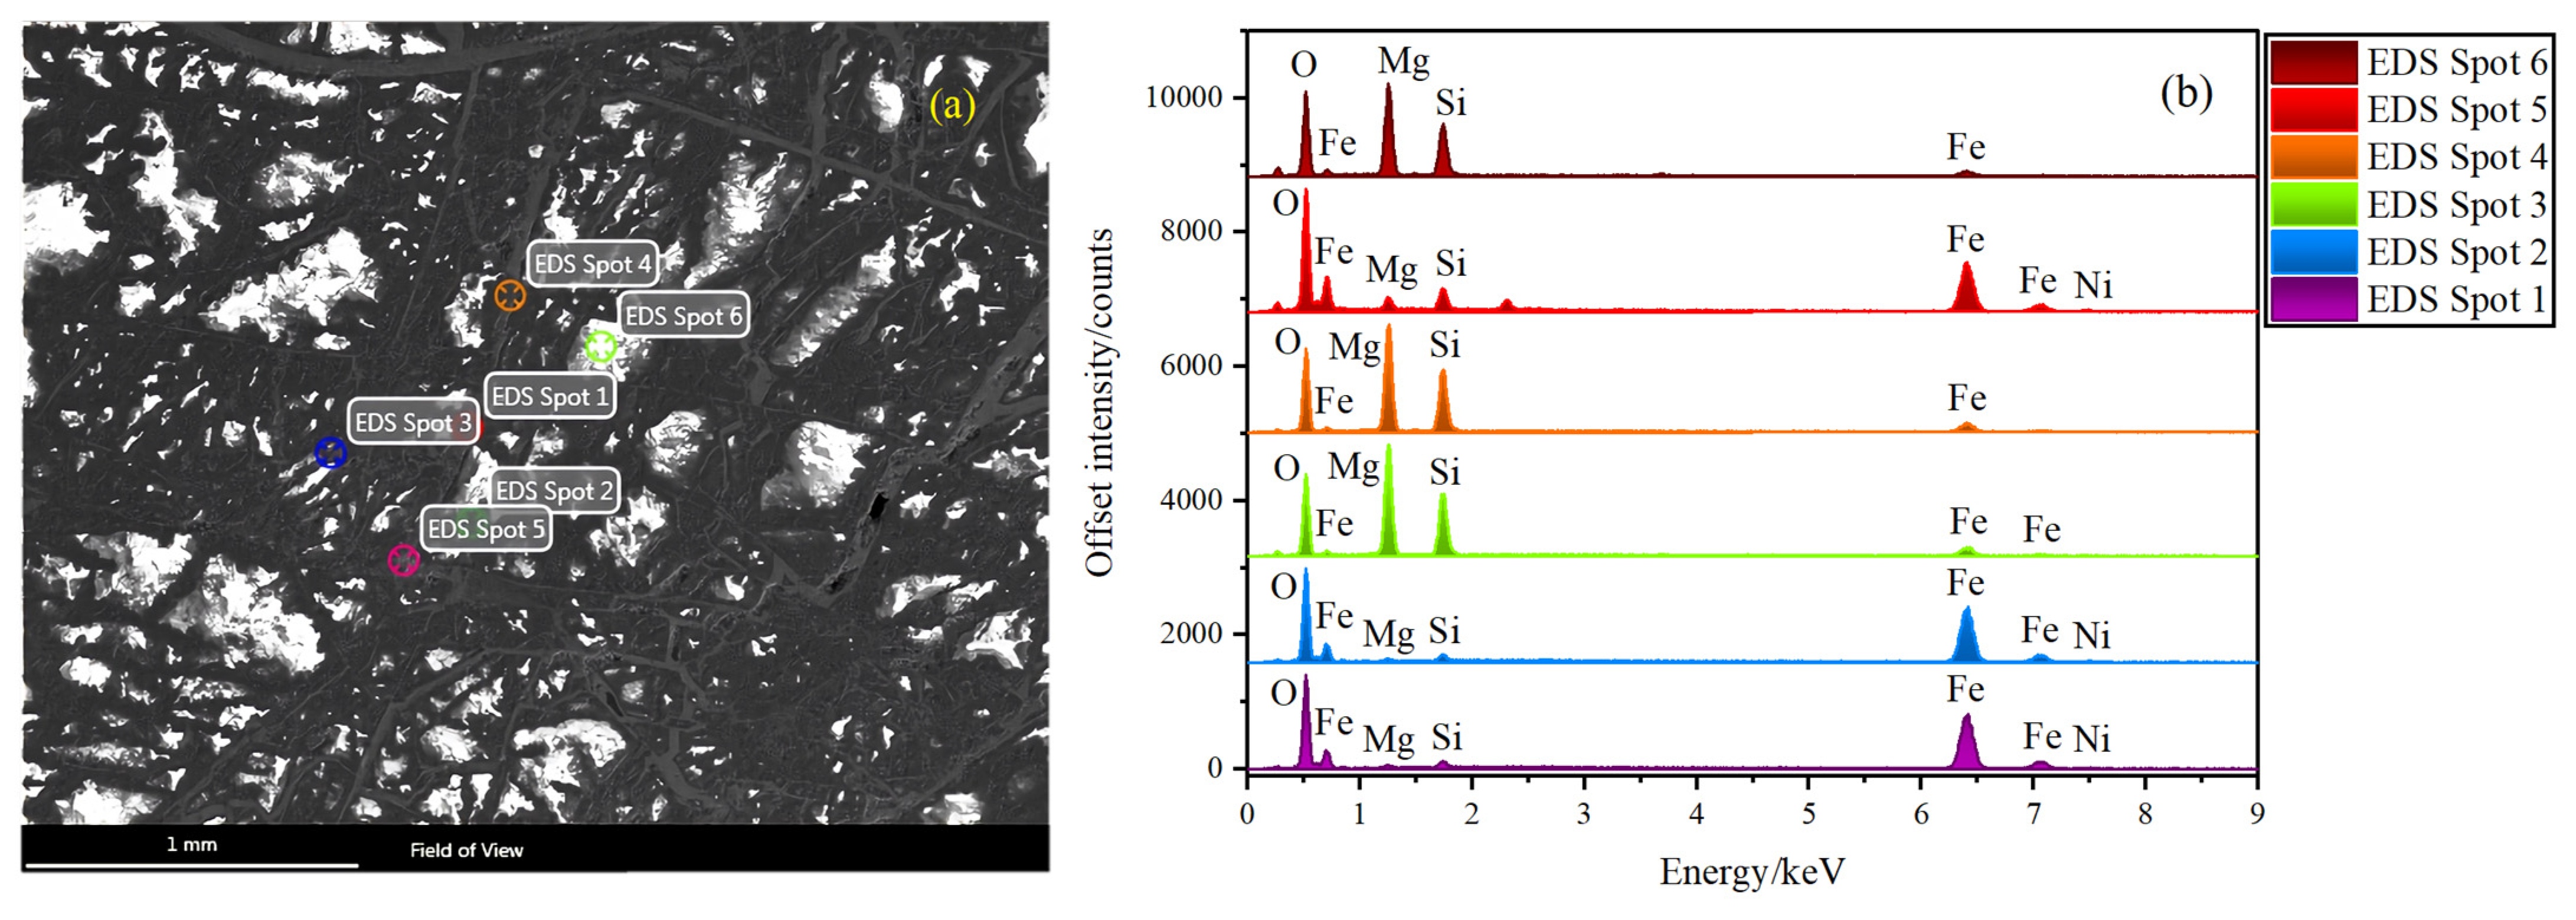
2.5. Energy Dispersive Spectroscopy (EDS)

Backscattered electron (BSE) images were captured using a JSM-IT500 SEM (JEOL Ltd., Showashima City, Tokyo, Japan) at Macau University of Science and Technology. Energy dispersive spectrometers installed on the SEM were employed to identify minerals and acquire X-ray elemental mappings. The resolution of the electron microscope (SEM) is approximately 20 nm with high vacuum mode.
The structural diagram of the instruments is shown in Figure 2.

3. Results

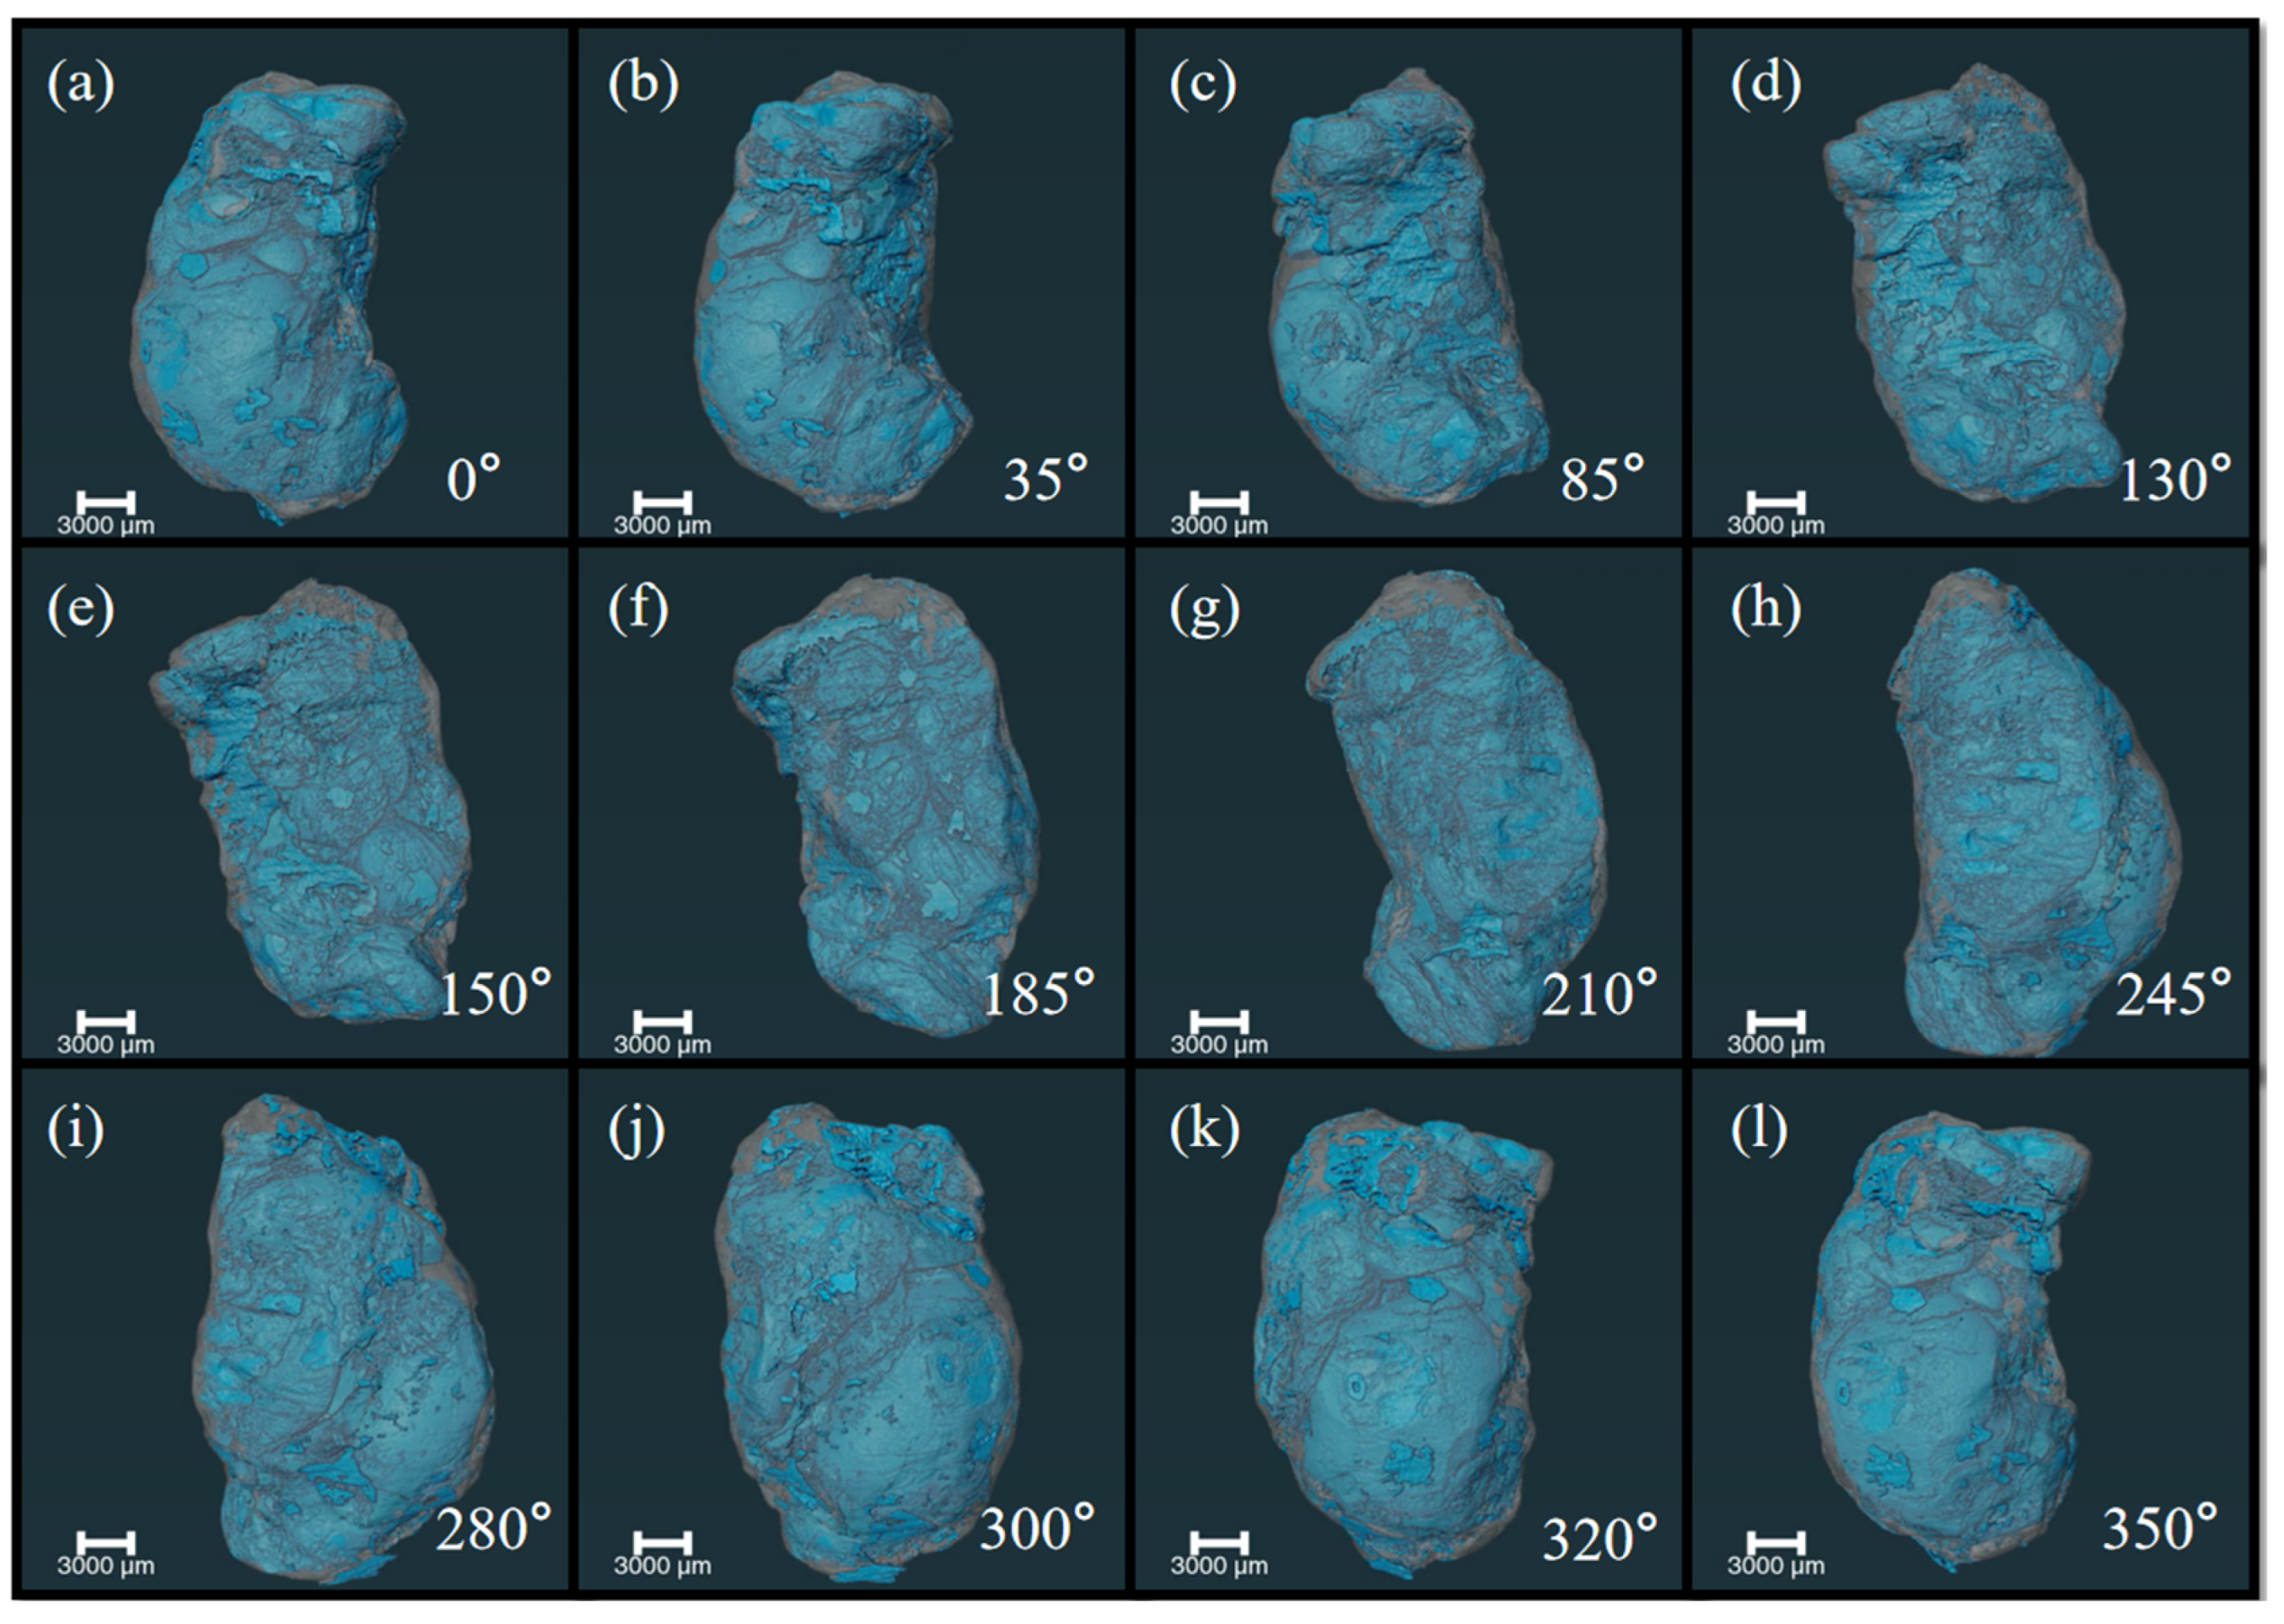
3.1. X-ray Phase Contrast Imaging Technology

Figure 3a–l shows a 360-degree perspective view of the internal structure of the mineral. It can be seen that the mineral is filled with irregular strip materials.

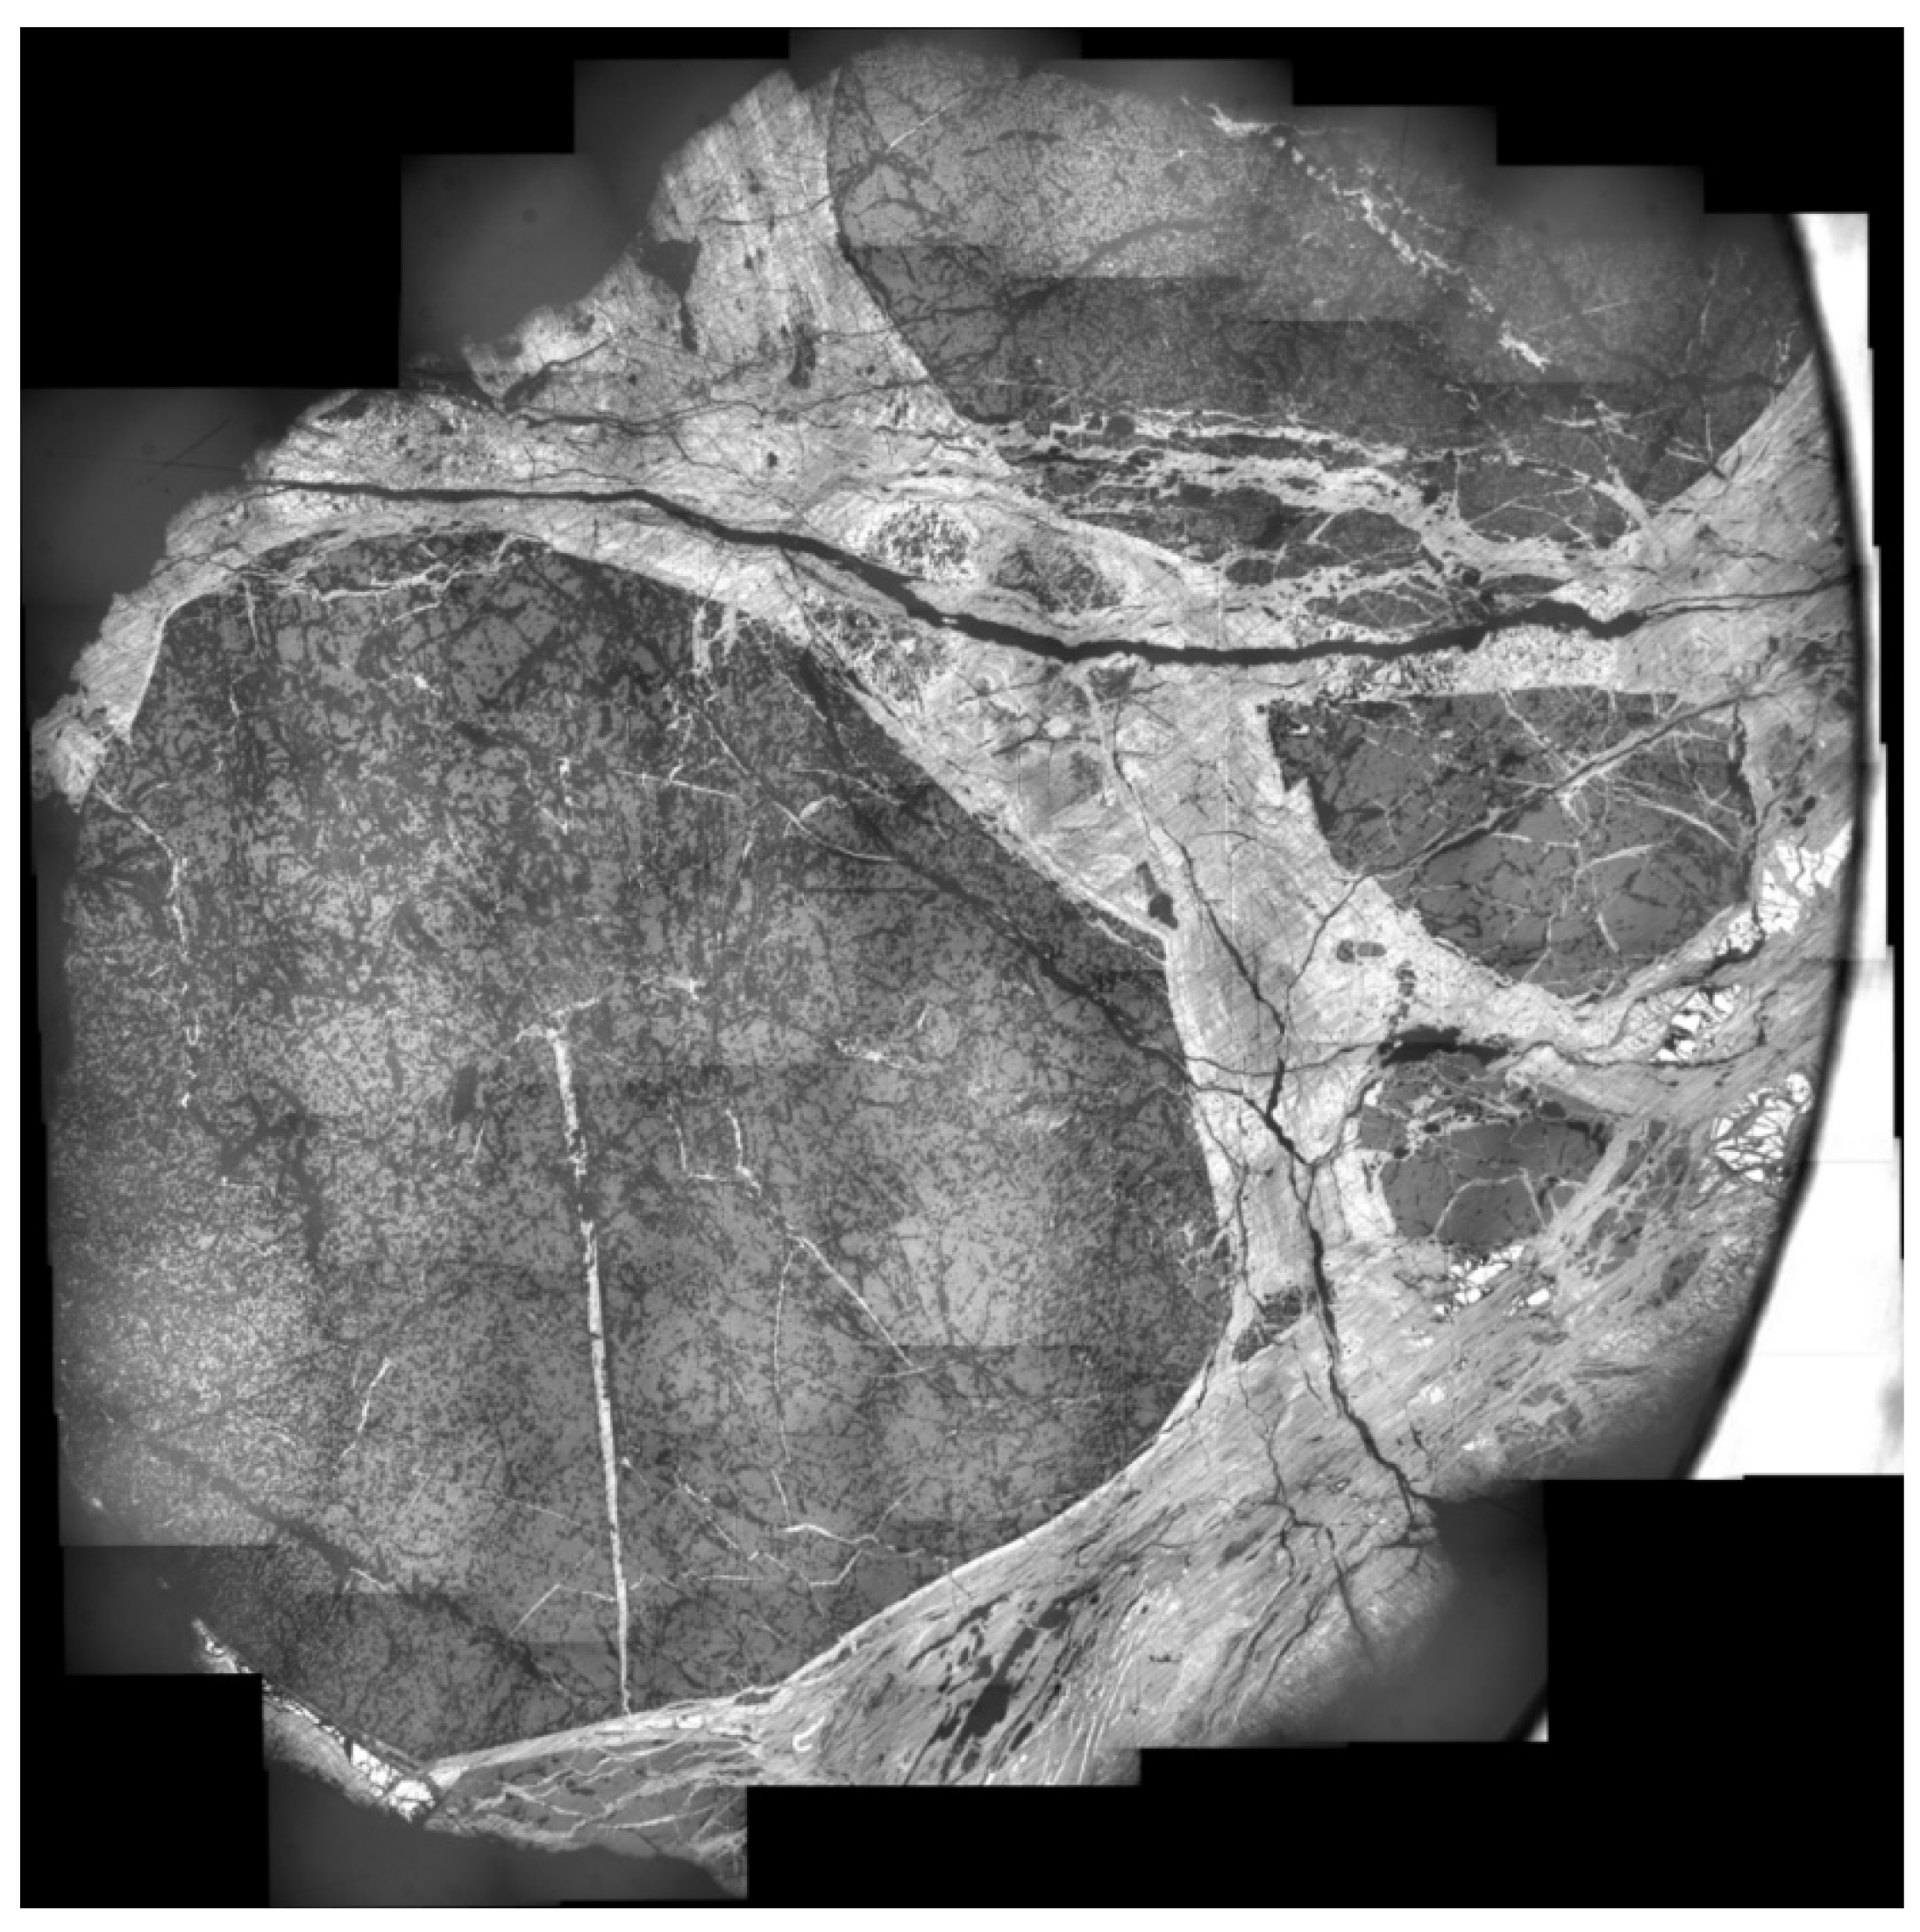
3.2. Microphotograph

X-ray phase contrast imaging technology reconstructed the internal structure of the meteorite, providing three-dimensional visualization information for researchers to use when selecting areas of interest and assisting them in locating potential cutting surfaces of high scientific value. The section shown in Figure 4 was located through internal structural reconstruction. Figure 4 shows the stitching of the complete section micrograph. The OMI provides the spatial distribution of detailed texture and other information in some areas.

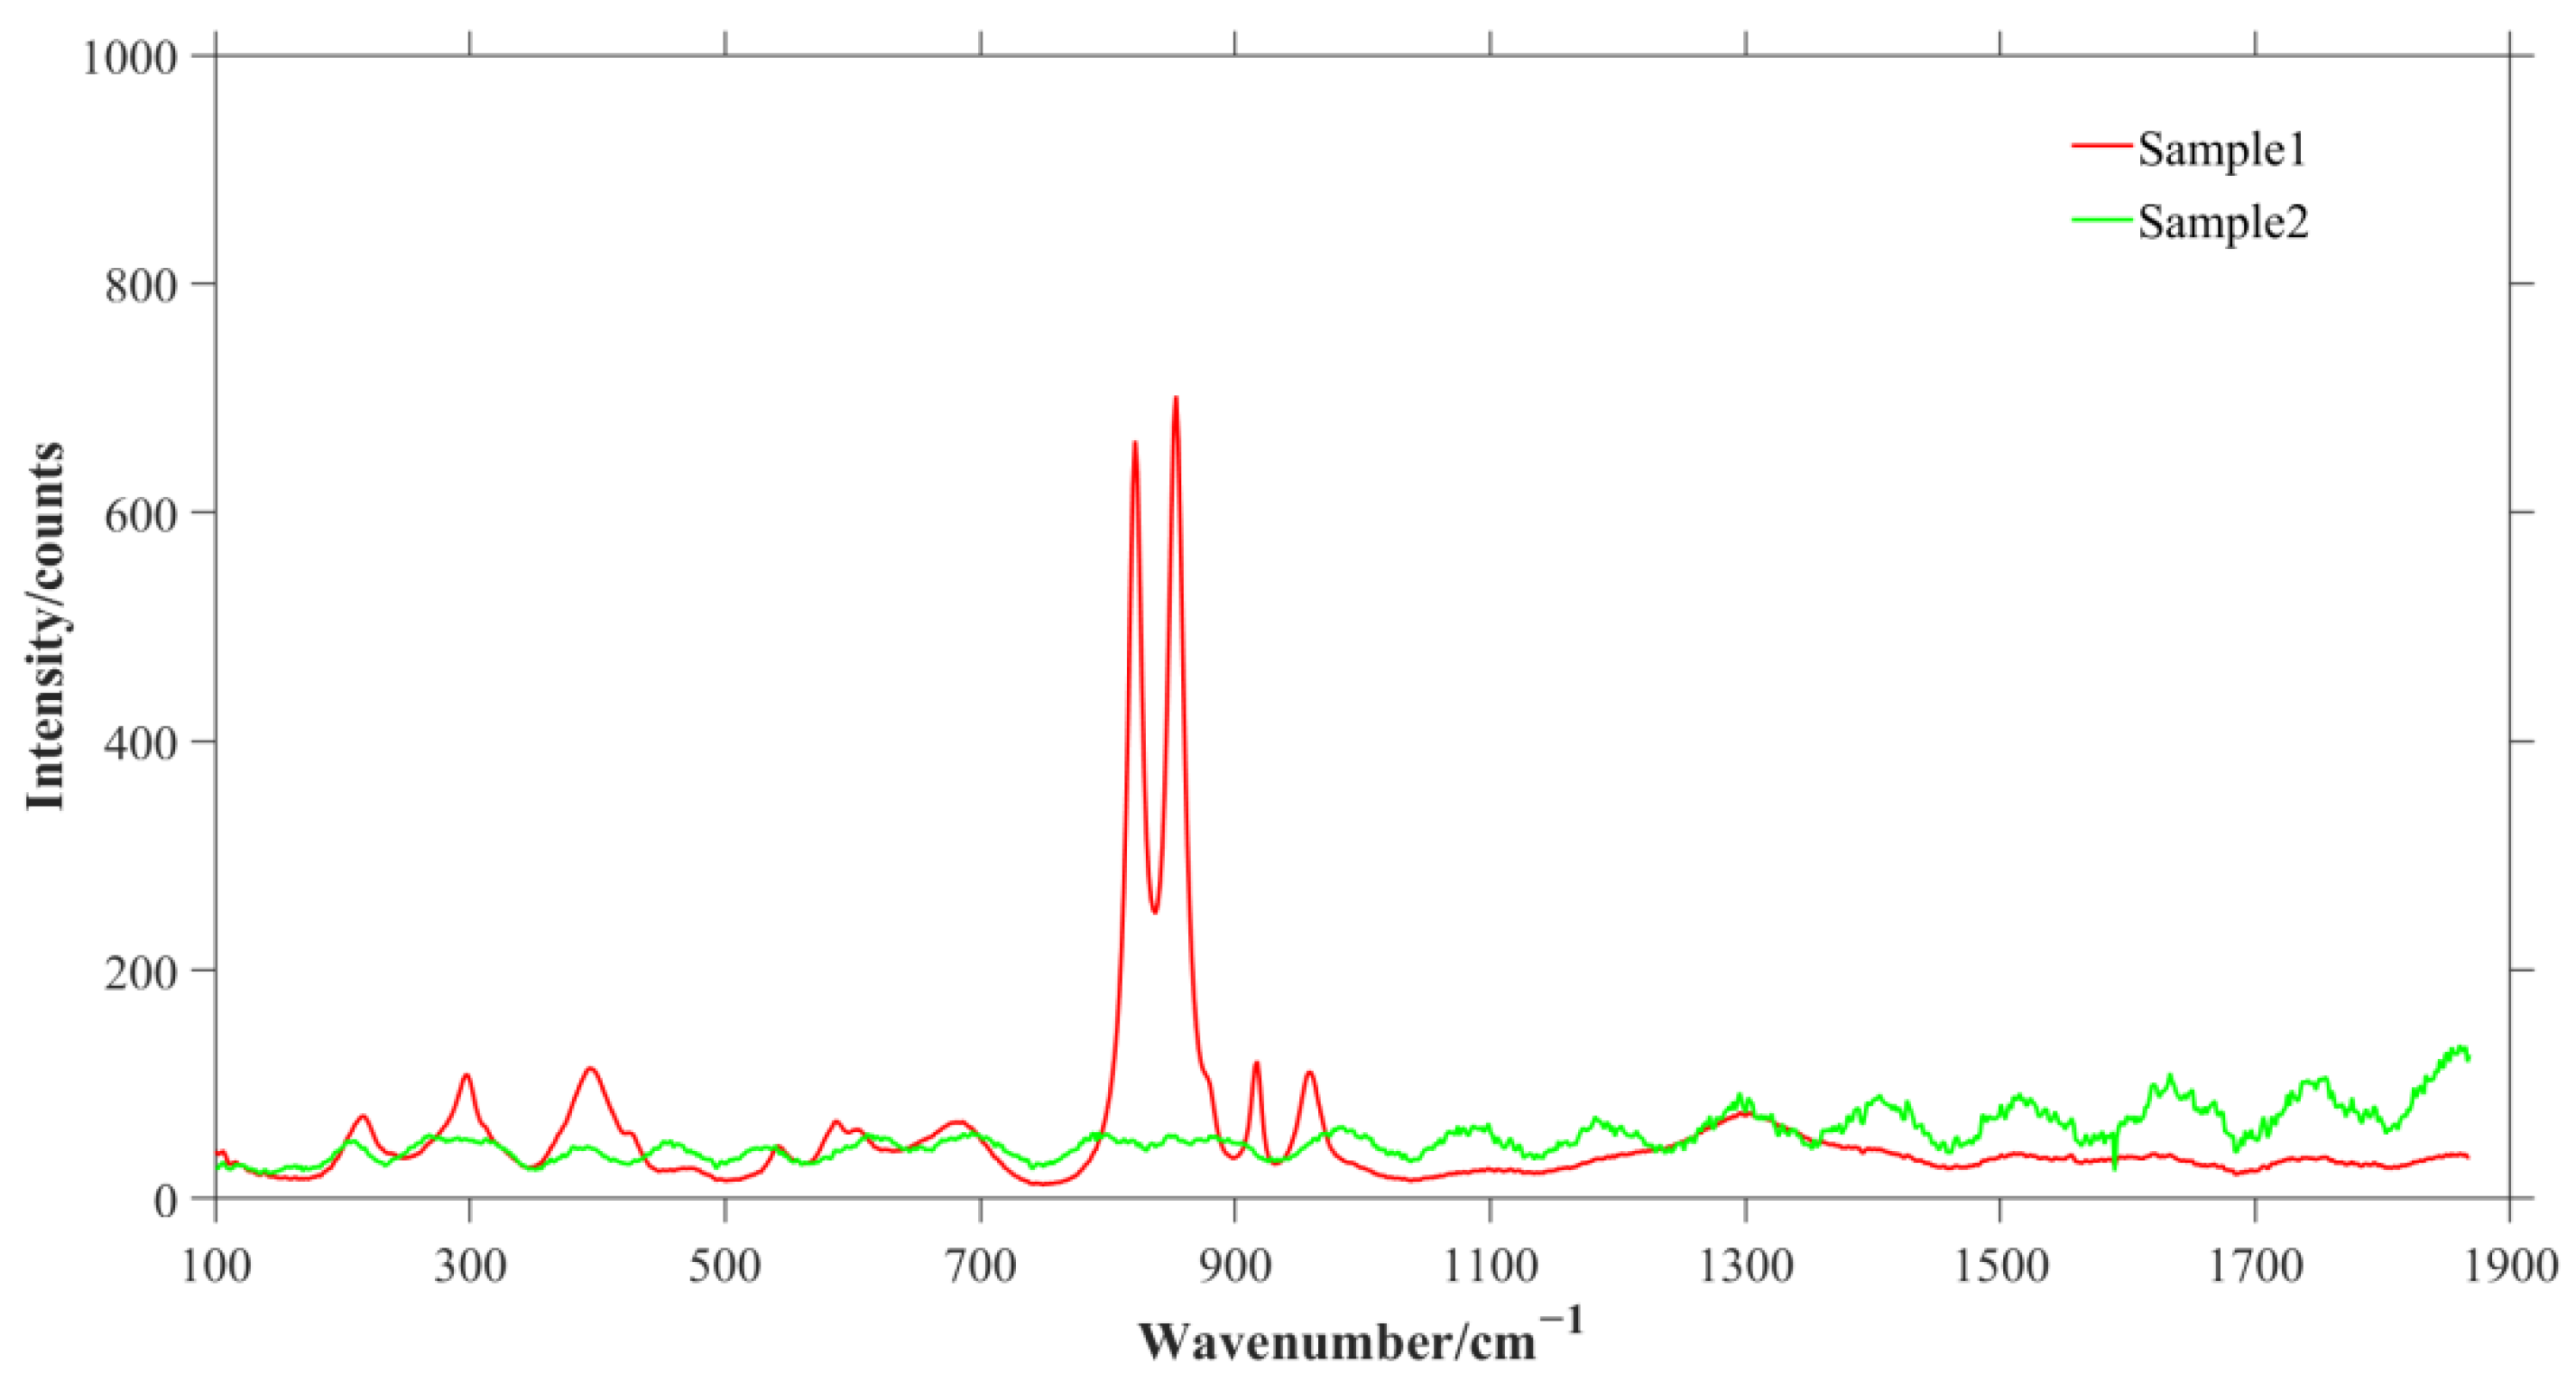
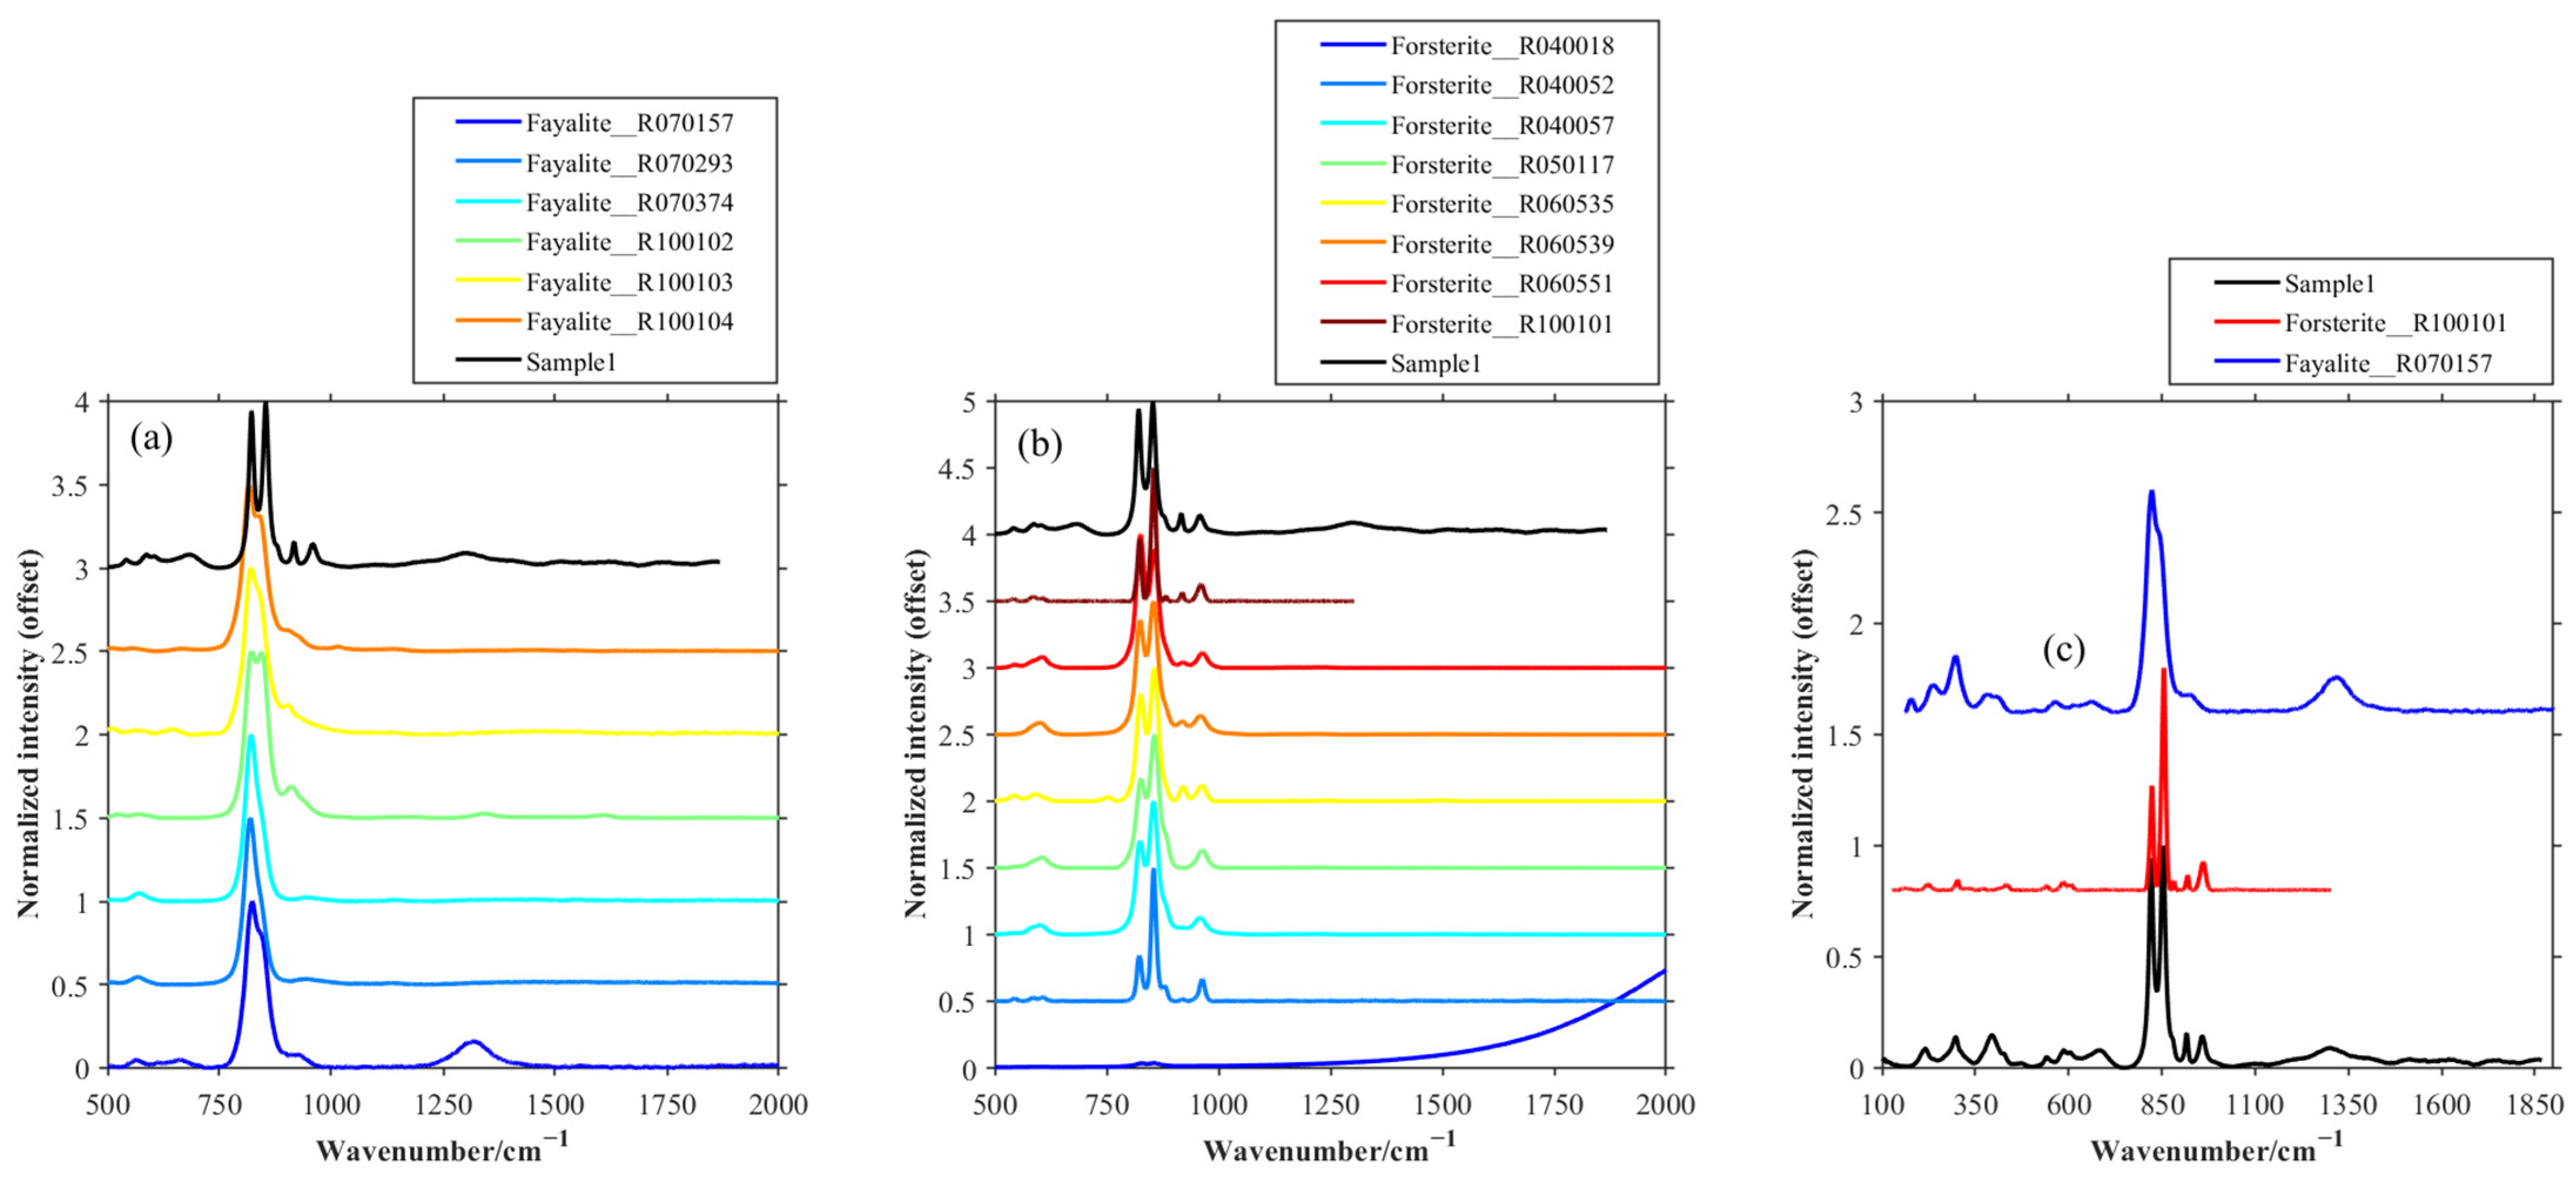
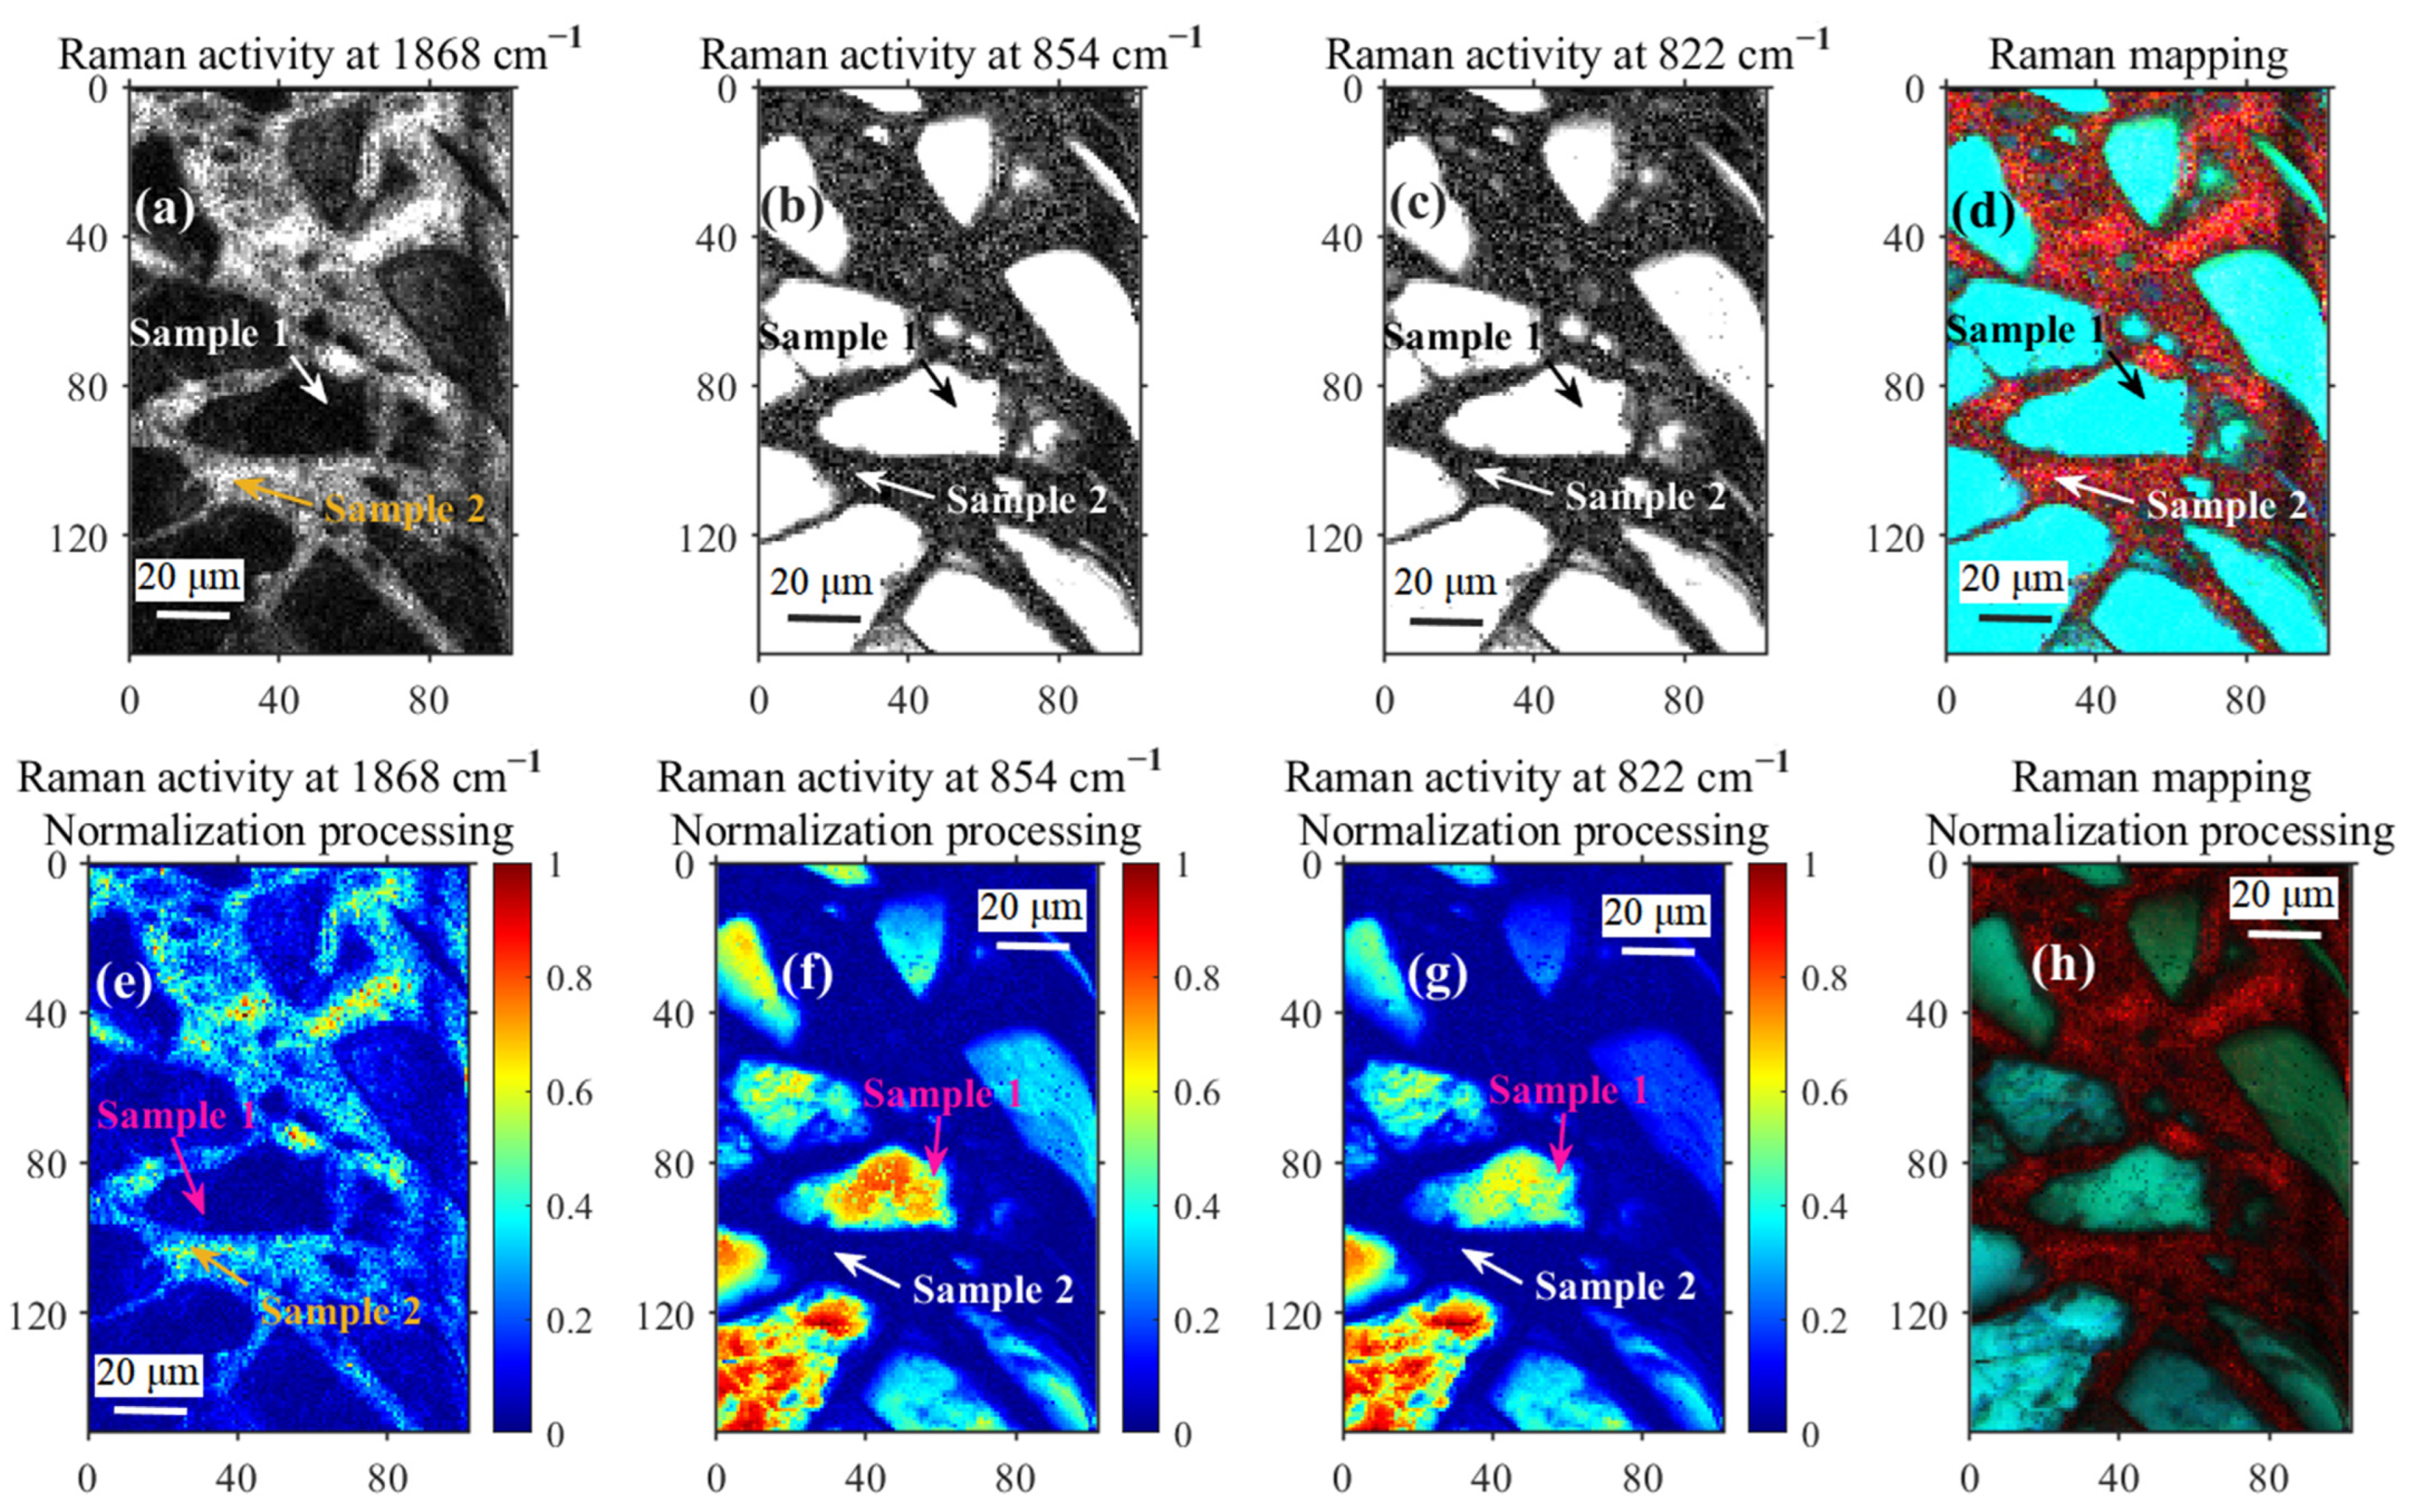
3.3. Spectroscopy Technology

According to the microscopic images of OMI, the region of interest (ROI) with potential typical ore bodies and their transition zones is selected for Raman mapping, and the excitation wavelength is 532 nm. The Raman imaging area is set to 151 μm × 101 μm. The scanning step is 1 μm. The integration time of a single spectrum at each scanning point is 100 ms. As a result, a hyperspectral matrix can be obtained (each pixel of the detector represents a channel). For reference, Raman spectra of substances in the scanning regions are shown in Figure 5.
The scanning area contains two main types of objects: One mineral with strong Raman activity (Sample 1) and the other with no Raman activity (Sample 2). By matching with the RRUFF Project website’s Raman Spectrum Database, we discovered the Raman active substance of magnesium iron silicate (Sample 1), as shown in Figure 6. ‘The Database The RRUFF™ Project is creating a complete set of high-quality spectral data from well-characterized minerals and is developing the technology to share this information with the world. The collected data serves as a standard for mineralogists, geoscientists, gemologists, and the public in identifying minerals on earth and for planetary exploration’ [20]. Therefore, the average spectral data of two species are chosen for retrieval in mineral matching. Because each Raman spectrum contains 1015 pixels, we can obtain hyperspectral images of 1015 channels, given that the area mainly comprises two minerals, the intensities of 1868, 854 and 822 cm−1 are selected as R, G, and B information, respectively, of RGB. The intensity of 1868 cm−1 represents Sample 2, which has a strong baseline signal at 1868 cm−1. The intensities of 854 and 822 cm−1 represent the magnesium iron silicate minerals, which have strong Raman peaks at 854 and 822 cm−1, respectively, as shown in Figure 7.
The original pseudo-color map, shown in Figure 7d, clearly distinguishes the spatial distribution characteristics of the two substances. Even after image normalization, the content differences in the spatial distribution of magnesium iron silicate can be observed.
Although OMI has a high spatial resolution, it cannot characterize the distribution of molecular components. In contrast, Raman mapping has the attributes with which to indicate the spatial distribution of molecular bonds. However, the spatial resolution of the mapping image is often affected by such factors as focusing spot, scanning step, and so on. As a result, the mapping image does not have the exact spatial resolution as the OMI, i.e., the spectral resolution of the Raman mapping image is higher, but the spatial resolution is low, whereas the spatial resolution of the OMI is high. Therefore, to proceed to the next step of spectral image fusion, one must extend the dimensions of the Raman mapping data to the same as those of the optical micrograph, extending the 151 pixels × 101 pixels of the pseudo-color map generated by Raman mapping to the 711 pixels × 472 pixels of the optical micrograph in the same region (Figure 8a). The intensity–hue–saturation (IHS) algorithm is a mature spatial transformation algorithm that was developed very early in the history of image fusion technology [21,22,23,24]. The image fusion of OMI and Raman mapping is realized based on the IHS algorithm. The fused image not only preserves the Raman spectra information of material molecules but also improves the spatial resolution of the picture. Raman mapping with low spatial resolution and an optical microscope with high spatial resolution can be fused in IHS space to transform Raman mapping from an RGB image to an IHS model. The components reflecting Raman mapping spatial resolution are connected with panchromatic images in IHS space, and the results are converted back to RGB space, as shown in Figure 8. The texture and composition distribution features of the mineral section’s key research area are realized through the fusion of OMI and Raman mapping technology. Raman molecular spectroscopy allows for the precise location of the transition zones and the characterization of the molecular spatial distribution of the orebodies.
According to the factor group analysis, the magnesium iron silicate structure with Pnma symmetry has 36 Raman-active vibration modes: 11Ag + 11B1g + 7B2g + 7B3g [25]. The Raman spectra of the silicate crystals have a characteristic set of two intense lines near 858–837 cm−1 (K1: Si-O asymmetric stretching band Ag (Si-O)a-str) and 825–808 cm−1 (K2: Si-O symmetric stretching band Ag (Si-O)s-str) [26].
It is worth noting that the 15,251 spectra in the Raman mapping region are divided into two categories by cluster analysis [27]. Therefore, the average Raman spectra of each class are used to match the typical minerals in the search for molecules. The average Raman spectra of Sample 1 are consistent with those of forsterite in the mineral database. The results reveal that Sample 1 was forsterite-dominated olivine. The ratio of the two Raman characteristic peaks of 854 and 822 cm−1 could reflect the content difference between forsterite and fayalite in olivine [28]. By calculating the Raman peak ratio (Figure 9), it is found that the peak ratios of the two Raman characteristic peaks, 854 and 822 cm−1, are mainly concentrated in three regions (fitting the three regression equations by the partial least squares regression method), the contents of forsterite and fayalite in the scanned area were mainly classified into three categories. The color image (Figure 9c) generated by the Raman peak ratio normalization index can more intuitively represent the spatial distribution characteristics of this content difference. With the help of the positive correlation between Raman characteristic peak and concentration, Raman mapping can determine the spatial positioning of mineral types and characterize the spatial distribution of a specific kind of mineral content.
Sample 2 cannot be identified using Raman spectra, but their strong reflectance can characterize their spatial distribution. Due to its physical properties and non-Raman molecular activity, it can be preliminarily determined as a metallic substance. Therefore, laser-induced breakdown spectroscopy (LIBS) is used to preliminarily determine the elemental composition and content of the substance. Almost all element analyses can be performed using LIBS. LIBS technology uses a laser to focus and ablate the sample, resulting in plasma luminescence. It has the advantages of remote sensing, in situ analysis, a powerful signal, high efficiency, less sample pretreatment, and low interference from the environmental background [29,30,31]. Although it has a high spectral resolution, its spatial resolution is low, making it difficult to detect the distribution of elements with high spatial resolution in a short period. In this paper, the micro-region LIBS technique is used to collect 50 LIBS data randomly from two kinds of minerals classified in the Raman spectroscopy experiment, determine the elemental composition of Sample 2 and verify the predicted results of Sample 1. Through the LIBS experiment, the detection of each mineral element component is realized and the results are shown in Figure 10.
Based on the strong reflectance of Sample 2 in the Raman spectroscopy experiment and the matching of the characteristic spectral lines of Sample 2 and iron in the LIBS experiment, it can be concluded that Sample 2 is a metal material dominated by iron. Sample 1 contains elements of magnesium, silicon, and iron. In addition, trace sodium spectral lines (589.3/589.89 nm) were found in both Sample 1 and Sample 2. When combined with the experimental results of Raman mapping, the following results are obtained: (1) Sample 2 is a metal material dominated by iron; (2) Sample 1 is a silicate mineral dominated by forsterite, and the presence of iron suggests that it is doped with a small amount of Fe2SiO4. Combined with the three-dimensional reconstruction model of the internal structure derived from X-ray phase contrast imaging, we can comprehensively evaluate the composition of this mineral and its spatial distribution characteristics.

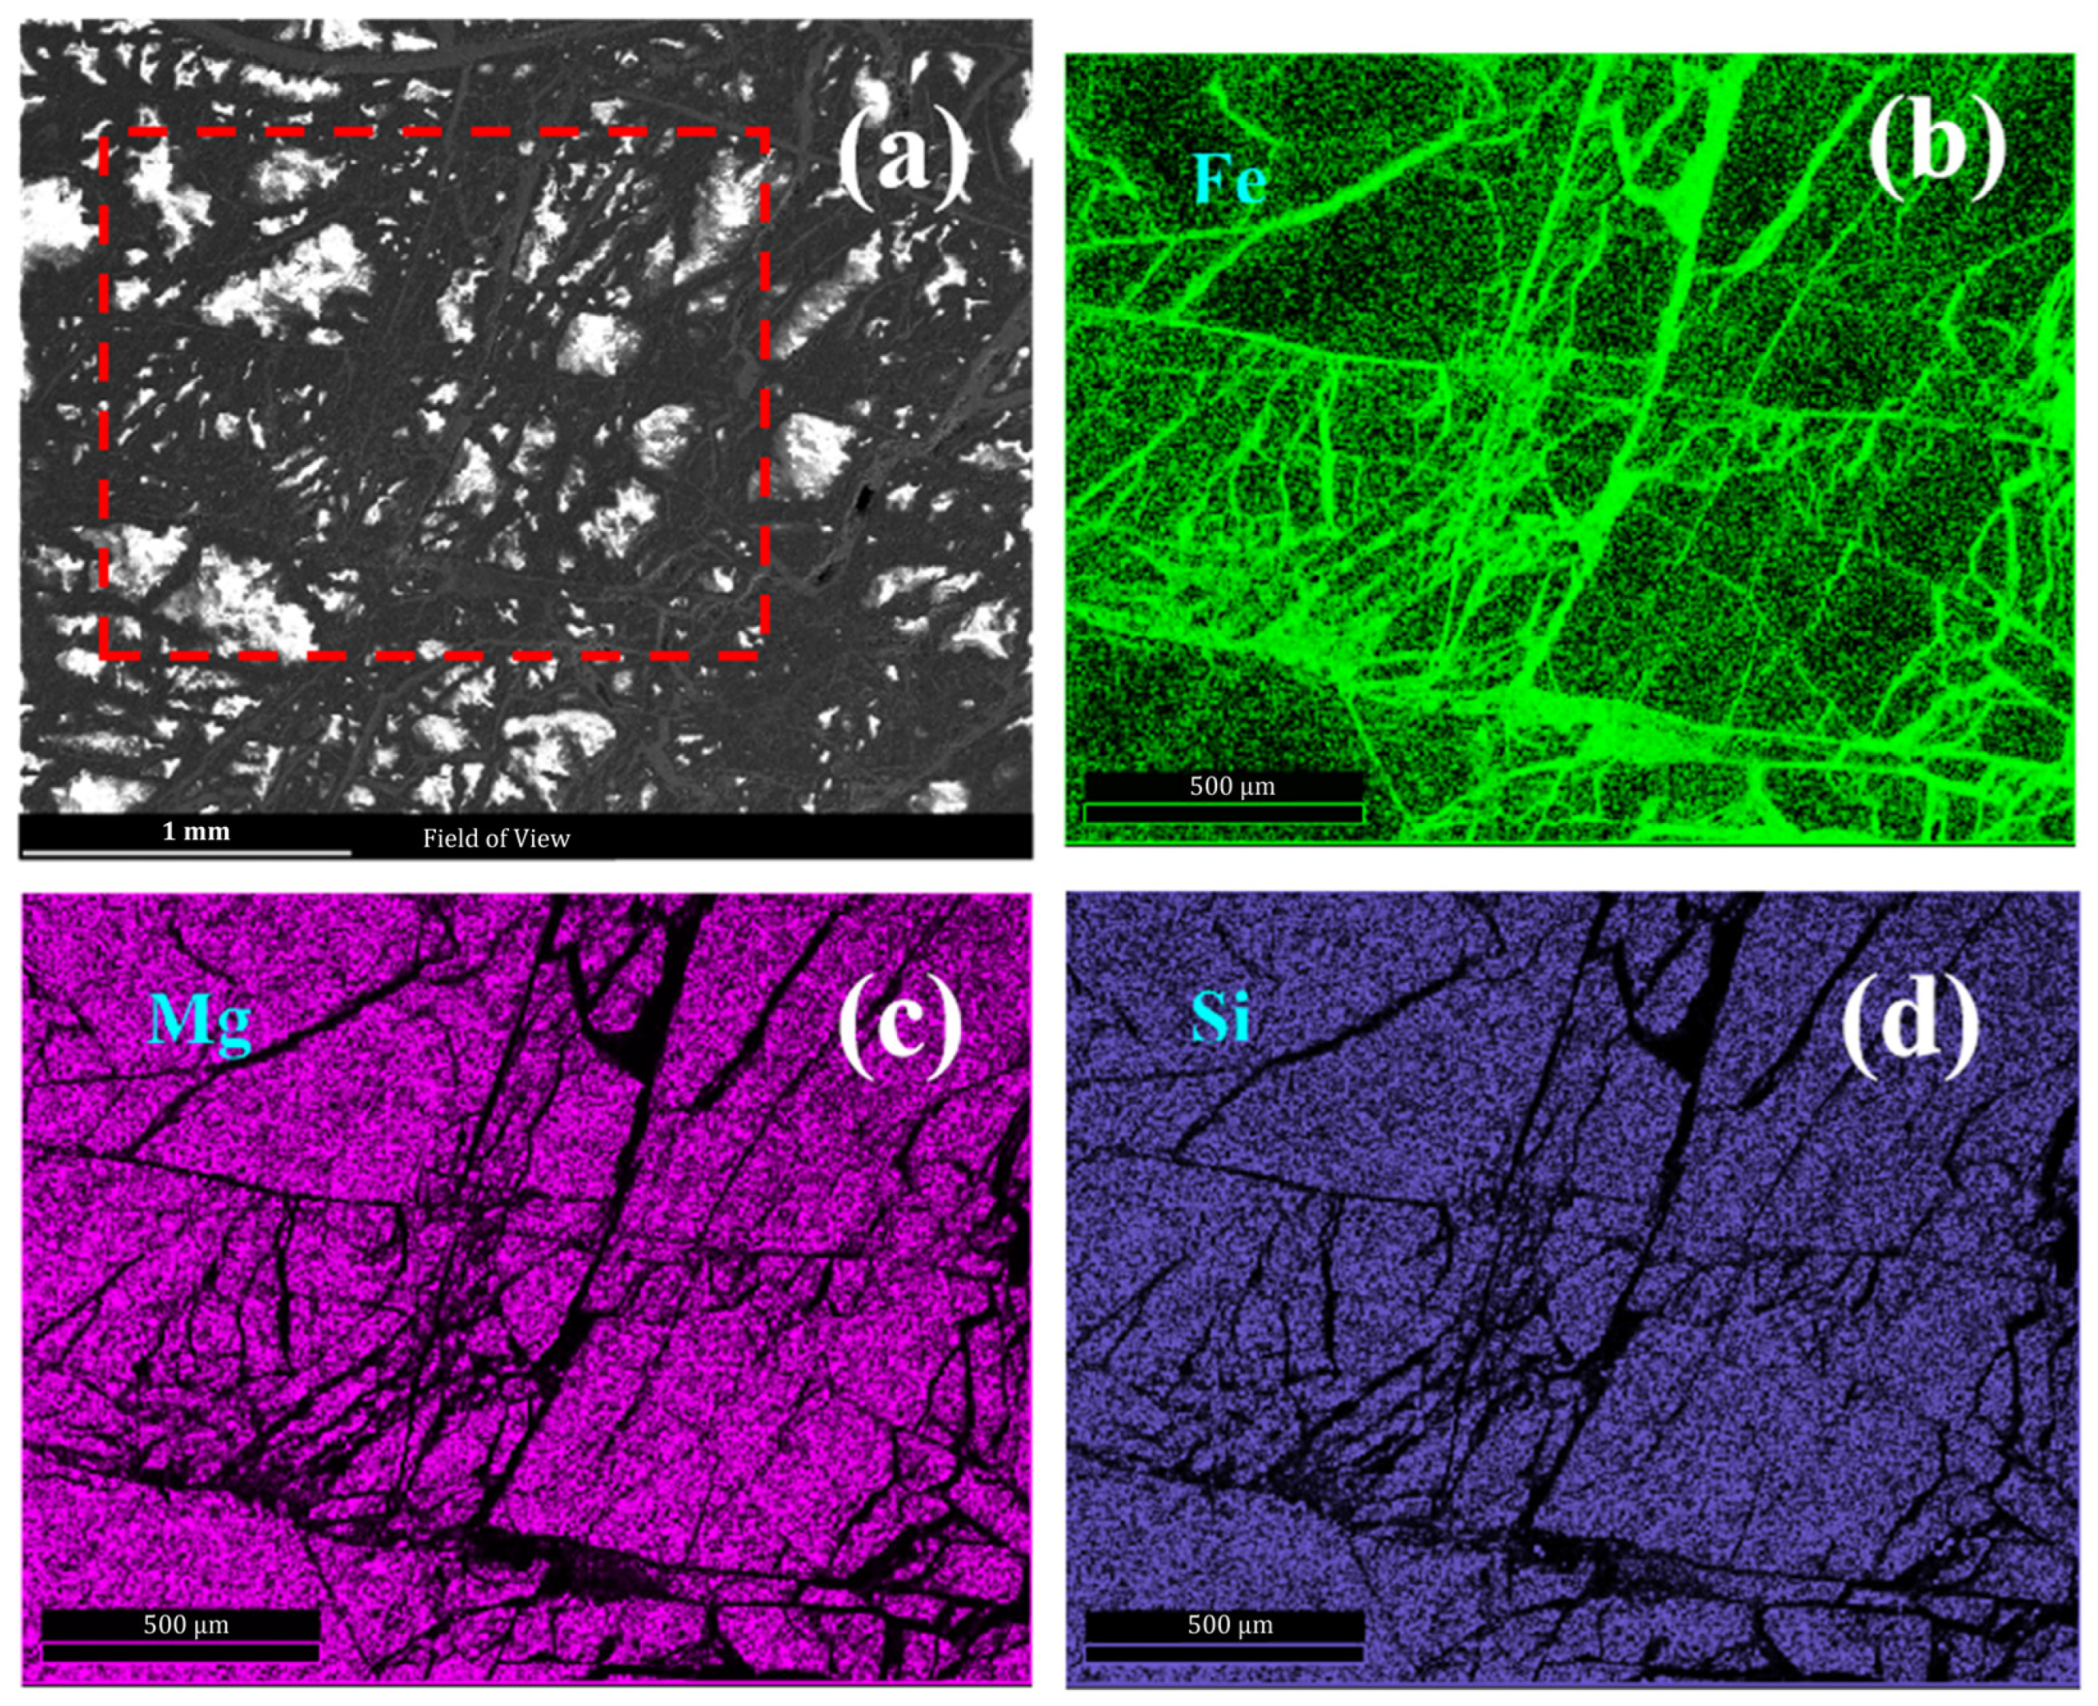
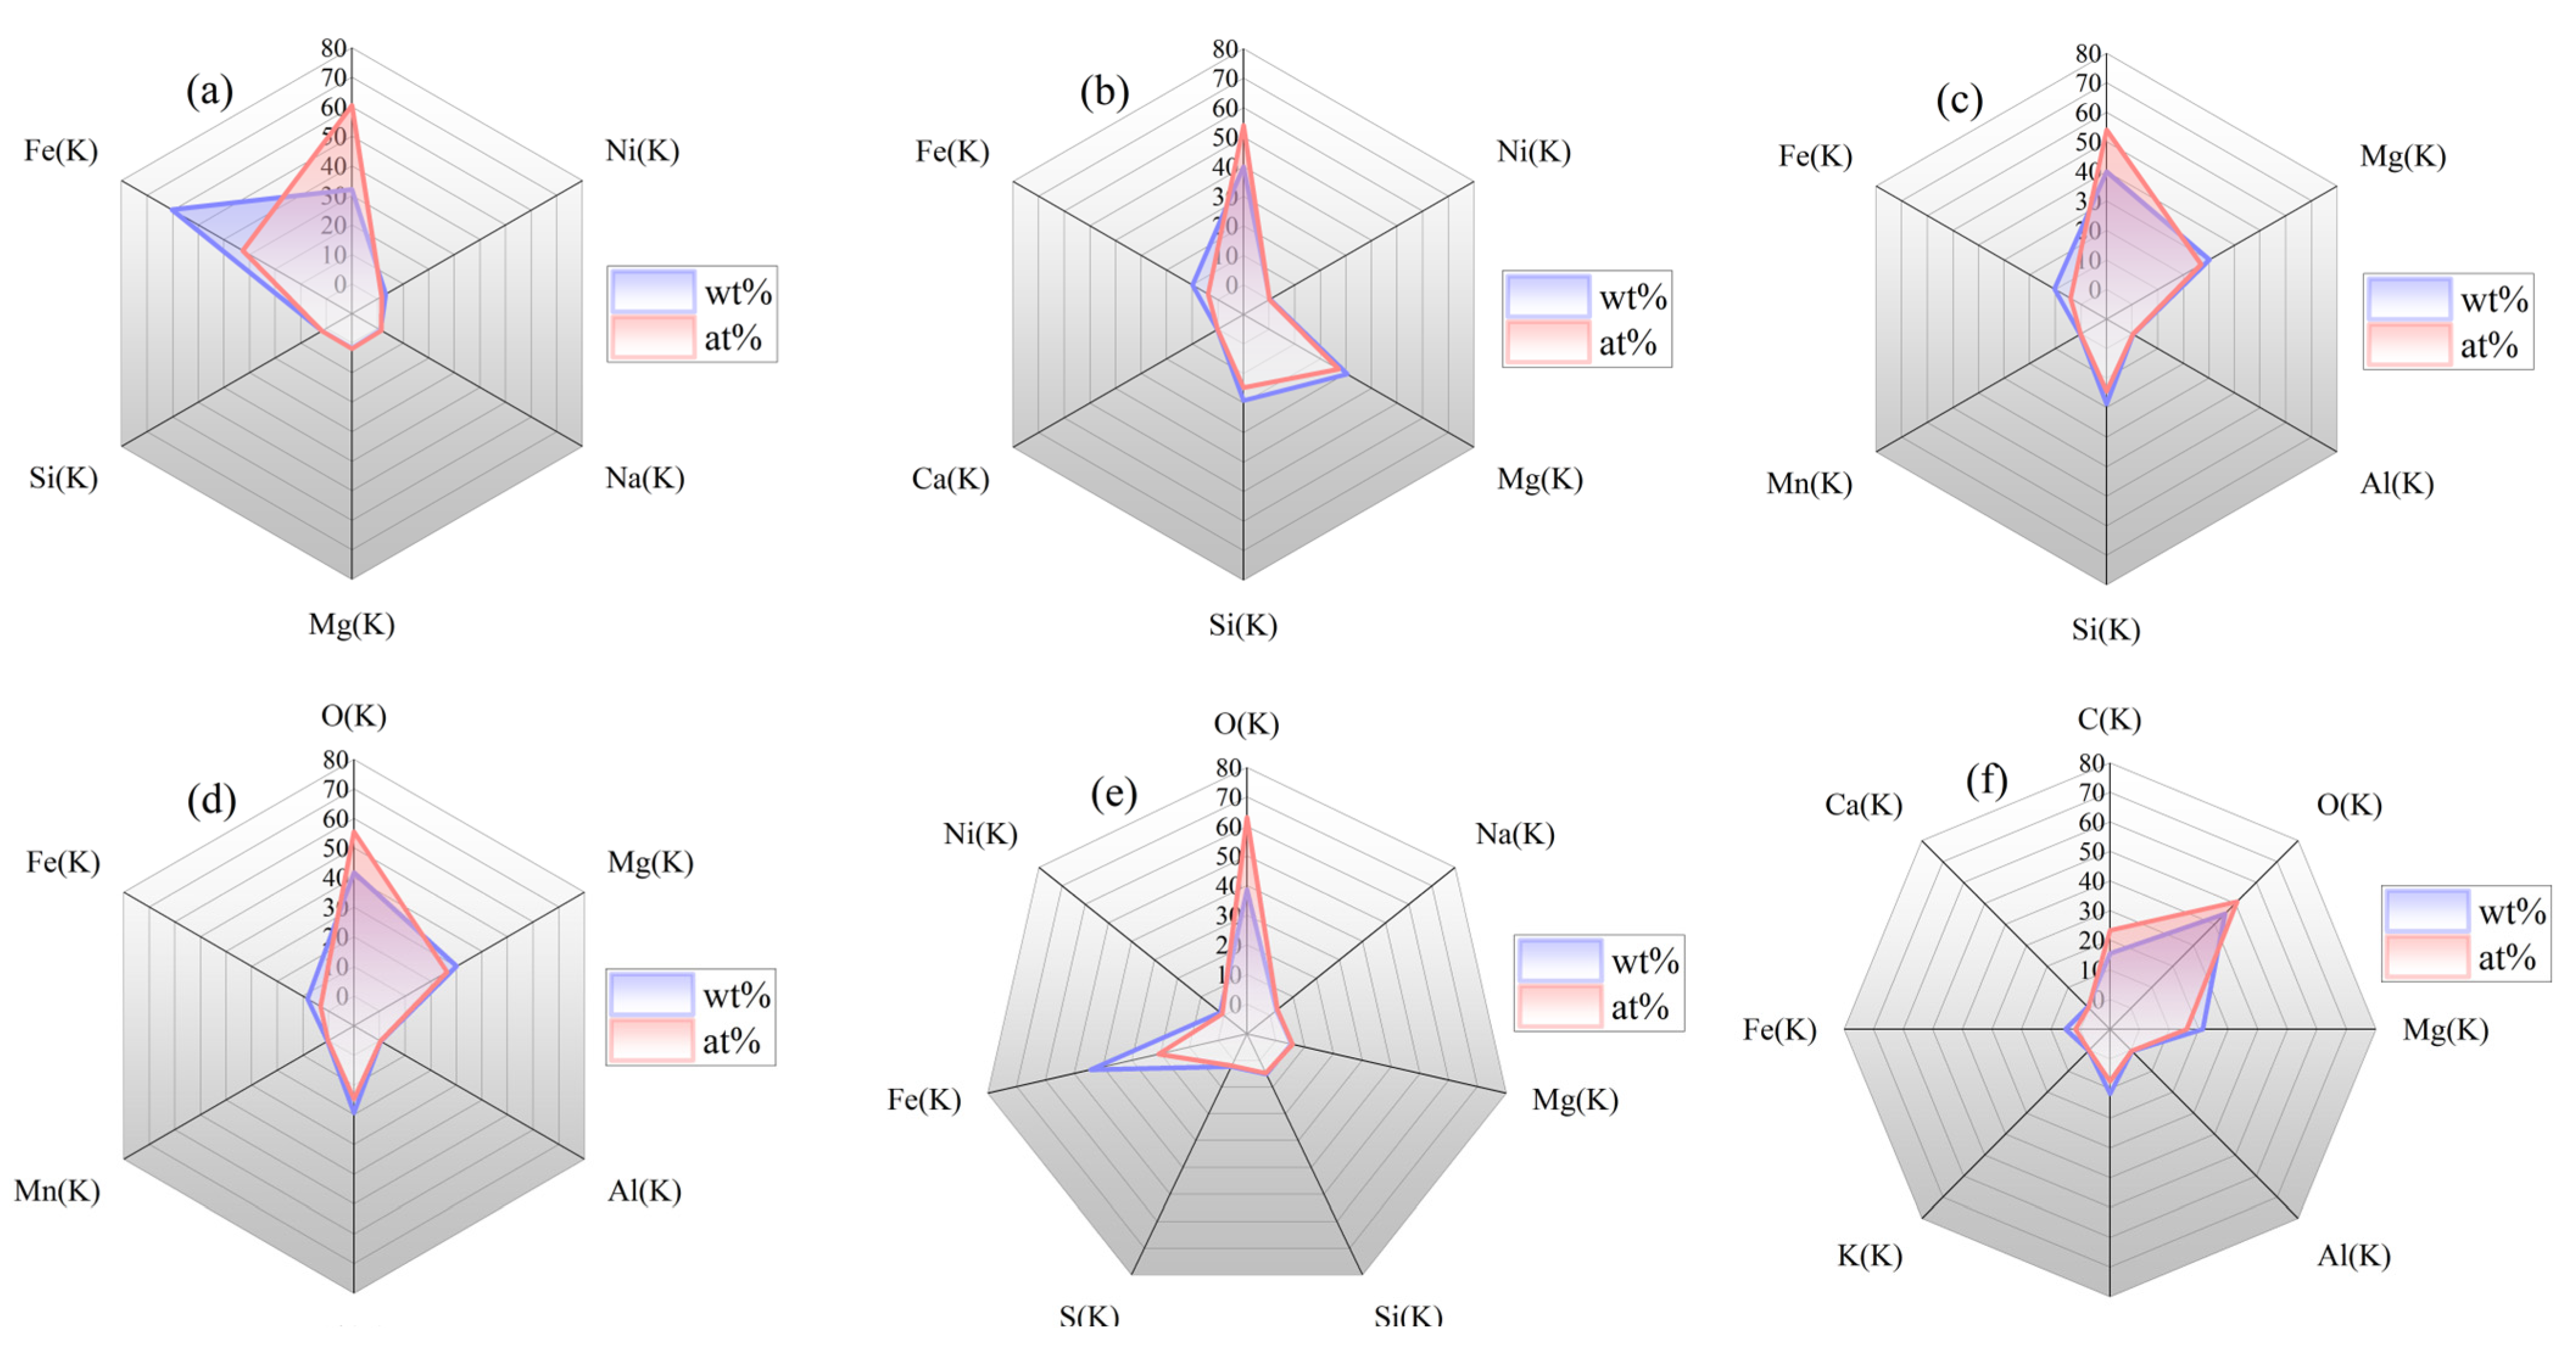
3.4. Energy Dispersive X-ray Spectroscopy Technology

Energy dispersive X-ray spectroscopy (EDS) is selected to compare the detection results of Raman spectroscopy and LIBS in order to verify the feasibility of this technical scheme. EDS is a well-known non-destructive X-ray technique with which to determine the elemental composition of materials. EDS is a technique primarily used with SEM and transmission electron microscopy (TEM) to find relationships between components, microstructures, and elemental spectra [32]. Combined with the experimental results of Raman and LIBS and based on EDS technology, the high spatial resolution detection of constituent elements was carried out, as shown in Figure 11. The spatial distribution of silicon and magnesium elements exhibits a high degree of consistency, while the spatial distribution of iron elements complements it.

4. Discussion

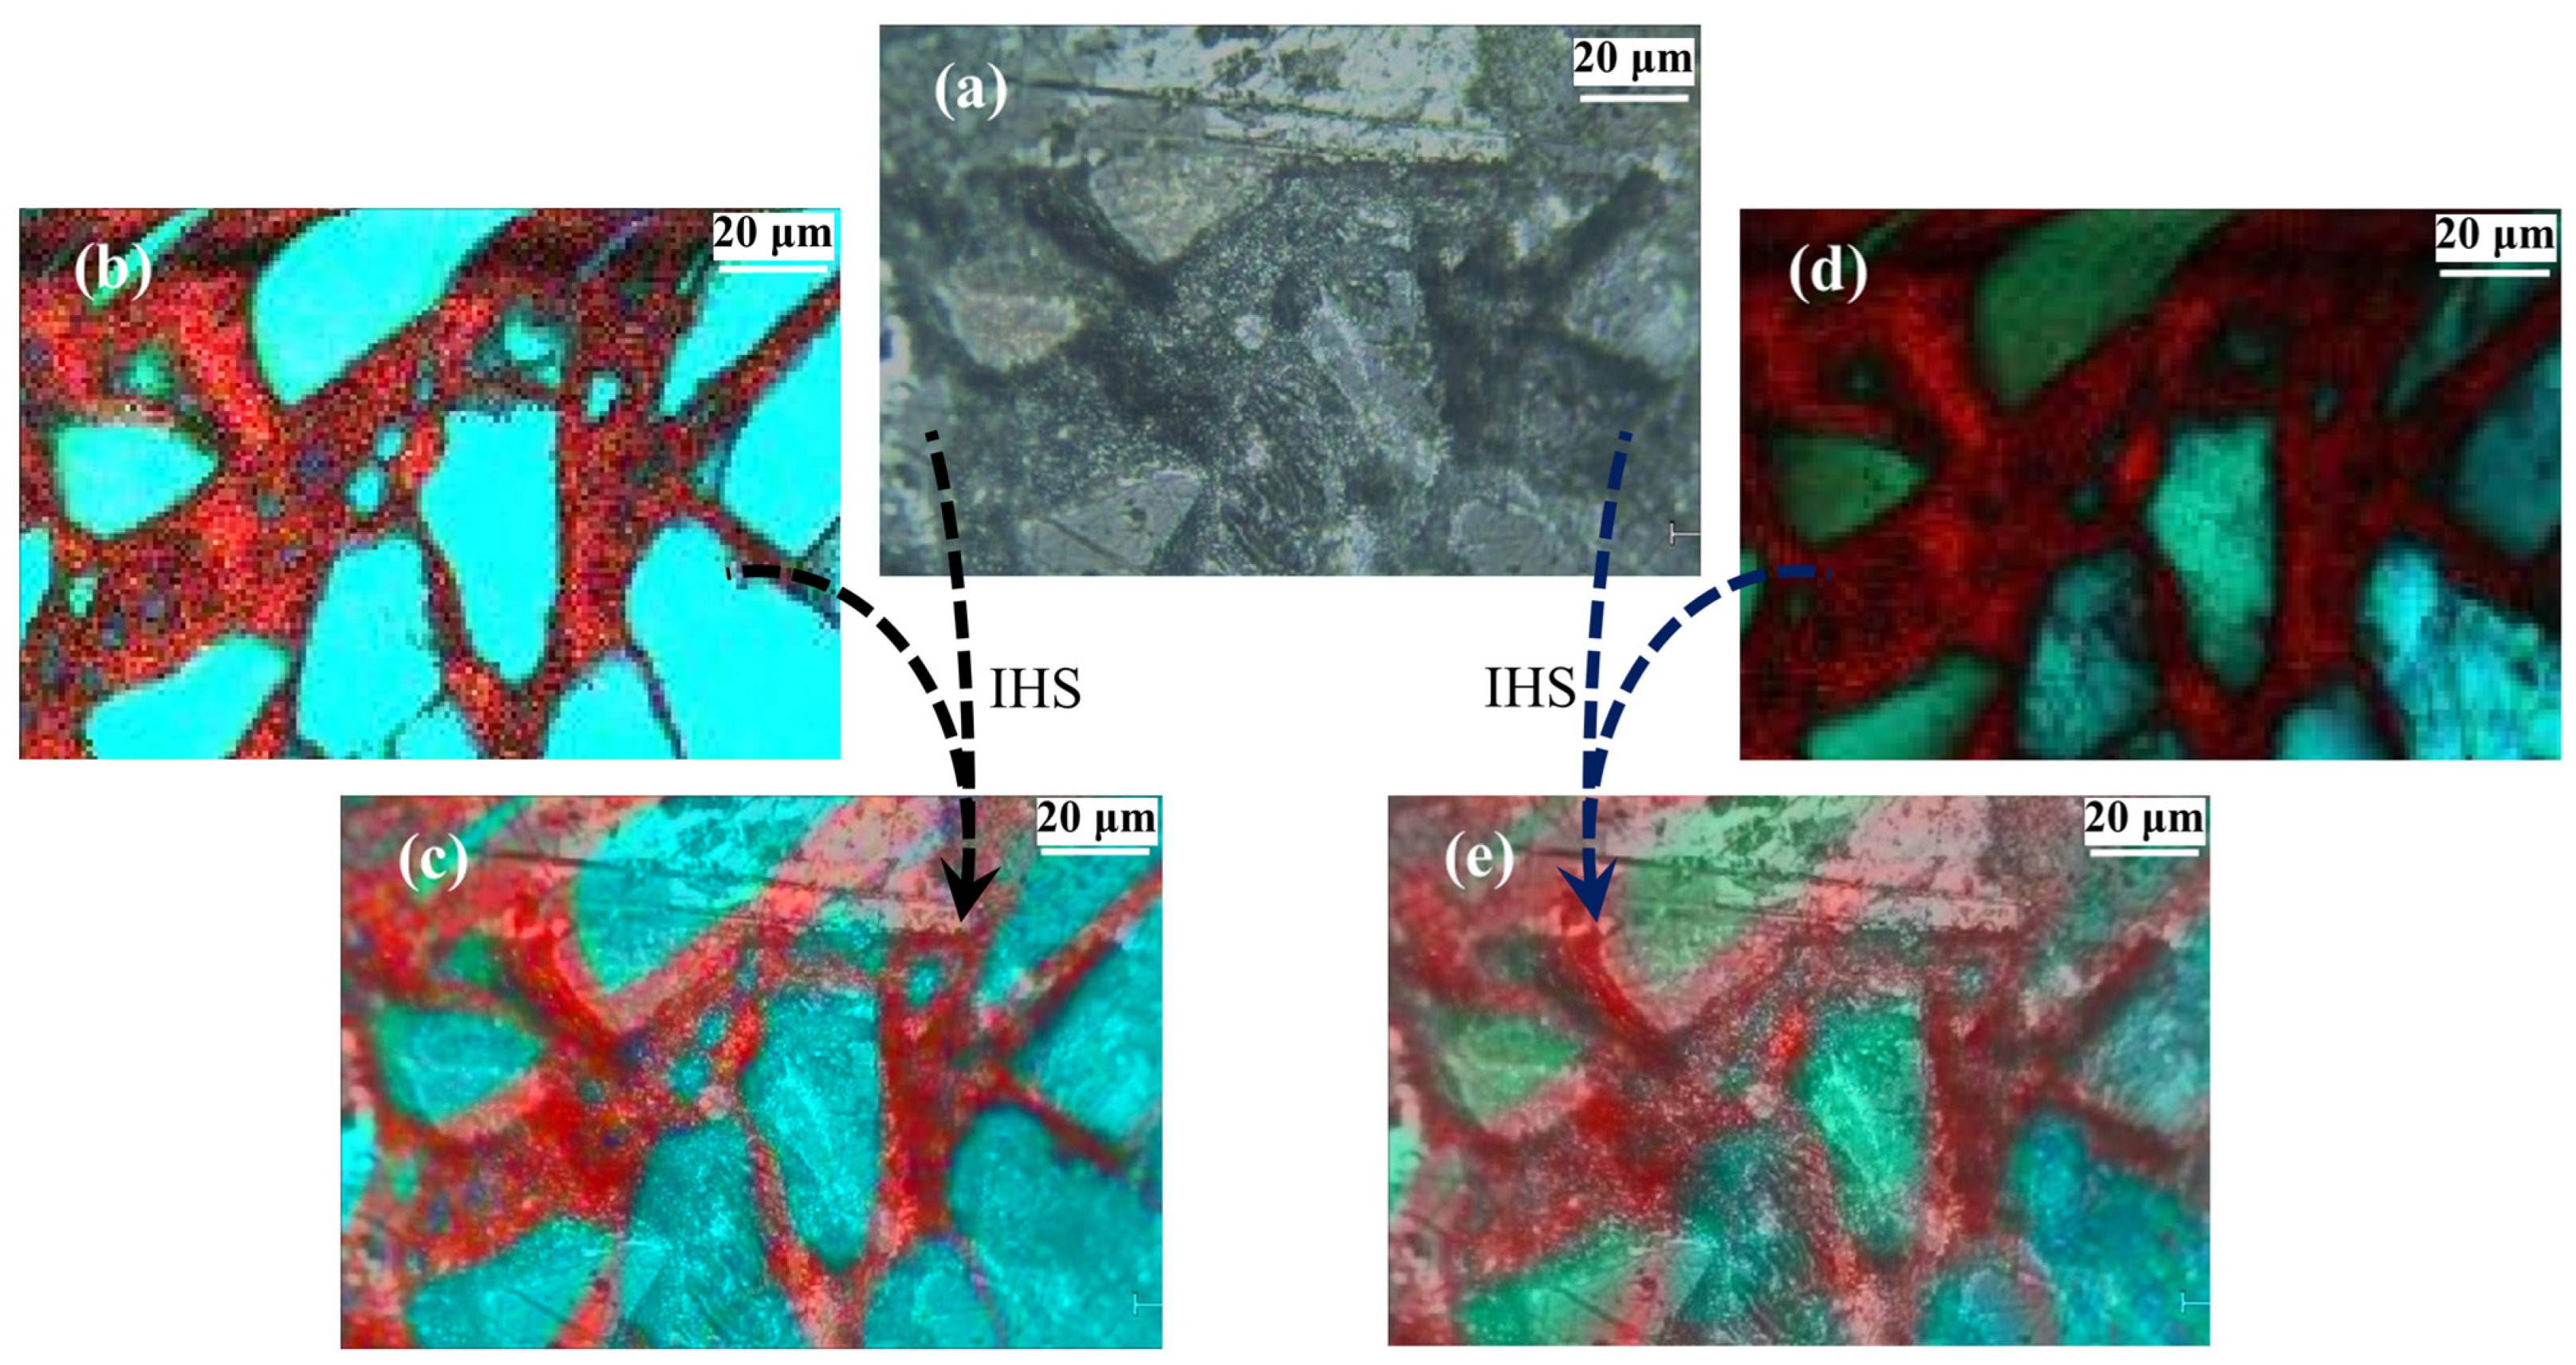
4.1. Discussion on X-ray Phase Contrast Imaging-Assisted Raman Spectroscopy

We can obtain a two-dimensional section detail with higher contrast, as shown in Figure 12. As the depth of the section increases, we notice that the embedded block has fine cracks as if invaded by ‘homogeneous’ matter. X-ray phase contrast imaging offers much reference information for the selection of cut surfaces and the prediction of the composition and structure of minerals.

4.2. Third Party Test Verification

First, one must identify the region of interest to be detected and complete the SEM analysis. Second, six characteristic points in the specific area and transition area of minerals are selected based on the spectral detection results in order to complete the point detection and calculate the elements’ weight percentage (wt%) and atomic percentage (at%), as show in Figure 13. The experimental results (Figure 14) of EDS confirm the metal material such as Fe found in the LIBS experiment and also show that these were doped with a small amount of Co and Ni. The consistent distribution of Mg and Si elements further confirms the result of the Raman spectroscopy experiment. Forsterite is the main mineral, and a small amount of fayalite is mixed with it.

5. Conclusions

Pallasites are stony irons composed of roughly equal amounts of silicate, dominated by olivine, and metal plus troilite. We developed a method based on laser spectroscopy combined with X-ray techniques to analyze the internal morphology and chemical characteristics of pallasites. This method could help researchers to scientifically evaluate the physical chemistry features of pallasites based on a composite of multiple factors. The internal structure of the pallasite was reconstructed using X-ray phase contrast imaging, and the fault reconstruction of the mineral section could be obtained from any angle in order to provide a reference for the researchers to select the region of interest and cut the section. Raman mapping can reveal the composition and two-dimensional spatial distribution of the material in the cut section of the pallasite, as well as the recognition and spatial distribution of the pallasite molecules. Raman spectroscopy is ineffective for detecting metal materials. However, meteorites are rich in metals, so LIBS technology with full element detection capability can be used to detect the single point LIBS on the cutting surface, as a complementary technology to Raman spectroscopy. In addition, the compatibility and complementarity of these technologies were demonstrated by SEM-EDS. Accurately locating hidden areas of scientific interest and analyzing their physical chemistry properties requires the rapid mapping the internal structure of opaque samples such as minerals.

Author Contributions

Conceptualization, H.W., P.F., Y.W., Y.X. (Yingjian Xin), S.X., S.L. and Y.X. (Yanling Xue); methodology, H.W., P.F., Y.W., Y.X. (Yingjian Xin), S.X., S.L. and L.Z.; software, H.W., P.F., L.Z. and X.W.; validation, H.W., P.F., Y.W., Y.X. (Yingjian Xin), S.X., S.L. and Y.X. (Yanling Xue); formal analysis, H.W., P.F., Y.W., Y.X. (Yingjian Xin), S.X., S.L. and Y.X. (Yanling Xue); investigation, H.W., P.F., Y.W., Y.X. (Yingjian Xin), S.X., S.L. and Y.X. (Yanling Xue); resources, L.Z. and X.W.; data curation, H.W. and Y.X. (Yanling Xue); writing—original draft preparation, H.W. and X.W.; writing—review and editing, H.W. and L.Z.; visualization, H.W. and P.F.; supervision, Y.X. (Yanling Xue), X.W. and L.Z.; project administration, L.Z. and X.W.; funding acquisition, X.W., Y.X. (Yanling Xue) and L.Z. All authors have read and agreed to the published version of the manuscript.

Funding

This research was funded by the National Key Research and Development Program of China (Grant No. 2021YFA0716100, 2021YFF0601201 and 2021YFF0601202) and the National Natural Science Foundation of China (Grant No. U1931211, 42074210 and 42241130) and was sponsored by the Natural Science Foundation of Shanghai (Grant No. 21ZR1473700), the Shanghai Municipal Science and Technology Major Project (Grant No. 2019SHZDZX01), the Shanghai Pilot Program for Basic Research—Chinese Academy of Science, Shanghai Branch (Grant No. JCYJ-SHFY-2021-04), and the Shanghai Rising-Star Program (Grant No. 21QA1409100). This work was also supported by the Youth Innovation Promotion Association of the Chinese Academy of Sciences.

Institutional Review Board Statement

Not applicable.

Informed Consent Statement

Not applicable.

Data Availability Statement

Data underlying the results presented in this paper are not publicly available at this time but may be obtained from the authors upon reasonable request.

Conflicts of Interest

The authors declare no conflict of interest.

References

  1. Abderrazak, E.A.; Gabriela, M.M.; Luis, A.B.; Stefan, B.; Armelle, R.; Andrey, B.; Kurt, K.; Timothy, L.; Claire, R.-B.; Olabode, B.; et al. Organism motility in an oxygenated shallow-marine environment 2.1 billion years ago. Proc. Natl. Acad. Sci. USA 2019, 116, 3431–3436. [Google Scholar]
  2. Xu, M.; Xue, Y.; Chen, R.; Li, K.; Du, G.; Deng, B.; Xie, H.; Xiao, T. A biometrics recognition instrument using X-ray phase contrast imaging for biosafety inspection. Nucl. Tech. 2021, 44, 0802021–08020210. [Google Scholar]
  3. Bernard, S.; Beyssac, O.; Benzerara, K. Raman Mapping Using Advanced Line-Scanning Systems: Geological Applications. Appl. Spectrosc. 2008, 62, 1180–1188. [Google Scholar] [CrossRef] [PubMed]
  4. Clarke, F.C.; Jamieson, M.J.; Clark, D.A.; Hammond, S.V.; Jee, R.D.; Moffat, A.C. Chemical Image Fusion. The Synergy of FT-NIR and Raman Mapping Microscopy to Enable a More Complete Visualization of Pharmaceutical Formulations. Anal. Chem. 2001, 73, 2213–2220. [Google Scholar] [CrossRef] [PubMed]
  5. Zhang, R.; Wu, H.; Su, Y.; Qiu, L.; Ni, H.; Xu, K.-M.; Zhao, W. In-situ high-precision surface topographic and Raman mapping by divided-aperture differential confocal Raman microscopy. Appl. Surf. Sci. 2021, 546, 149061. [Google Scholar] [CrossRef]
  6. Portillo, H.; Zuluaga, M.C.; Ortega, L.A.; Alonso-Olazabal, A.; Murelaga, X.; Martinez-Salcedo, A. XRD, SEM/EDX and micro-Raman spectroscopy for meteorite ogical and chemical characterization of iron slags from the Roman archaeological site of Forua (Biscay, North Spain). Microchem. J. 2018, 138, 246–254. [Google Scholar] [CrossRef]
  7. Veneranda, M.; Lopez-Reyes, G.; Manrique-Martinez, J.A.; Sanz-Arranz, A.; Medina, J.; Pérez, C.; Quintana, C.; Moral, A.; Rodríguez, J.A.; Zafra, J.; et al. Raman spectroscopy and planetary exploration: Testing the ExoMars/RLS system at the Tabernas Desert (Spain). Microchem. J. 2021, 165, 106149. [Google Scholar] [CrossRef]
  8. Cialla-May, D.; Schmitt, M.; Popp, J. Theoretical principles of Raman spectroscopy. Phys. Sci. Rev. 2019, 4, 20170040. [Google Scholar] [CrossRef]
  9. Prinsloo, L.; Toumié, A.; Colombam, P.; Paris, C.; Bassett, S. In search of the optimum Raman/IR signatures of potential ingredients used in San/Bushman rock art paint. J. Archaeol. Sci. 2013, 40, 2981–2990. [Google Scholar] [CrossRef]
  10. Iriarte, M.; Hernanz, A.; Gavira-Vallejoa, J.M.; Alcolea-González, J.; de Balbín-Behrmannb, R. μ-Raman spectroscopy of prehistoric paintings from the El Reno cave (Valdesotos, Guadalajara, Spain). J. Archaeol. Sci. Rep. 2017, 14, 454–460. [Google Scholar] [CrossRef]
  11. Rosina, P.; Collado, H.; Garcês, S.; Gomes, H.; Eftekhari, N.; Nicoli, M.; Vaccaro, C. Benquerencia (La Serena—Spain) rock art: An integrated spectroscopy analysis with FTIR and Raman. Heliyon 2019, 5, e02561. [Google Scholar] [CrossRef] [PubMed]
  12. Wang, H.; Fang, P.; Yan, X.; Zhou, Y.; Cheng, Y.; Yao, L.; Jia, J.; He, J.; Wan, X. Study on the Raman spectral characteristics of dynamic and static blood and its application in species identification. J. Photochem. Photobiol. B Biol. 2022, 232, 112478. [Google Scholar] [CrossRef] [PubMed]
  13. Mistek, E.; Halámková, L.; Doty, K.C.; Muro, C.K.; Lednev, I.K. Race Differentiation by Raman Spectroscopy of a Bloodstain for Forensic Purposes. Anal. Chem. 2016, 88, 7453–7456. [Google Scholar] [CrossRef]
  14. Pereira, A.F.M.; Rodrigues, B.V.M.; Neto, L.P.; Medeiros de OLopes, L.; da Costa, A.L.F.; Santos, A.S.; Viana, B.C.; Tosato, M.G.; da Silva, G.C.; Gusmão, G.O.M.; et al. On the effect of excessive solar exposure on human skin: Confocal Raman spectroscopy as a tool to assess advanced glycation end products. Vib. Spectrosc. 2021, 114, 103234. [Google Scholar] [CrossRef]
  15. Voropaev, S.A.; Eliseev, A.A.; Petukhov, D.I. Mineralogy of meteorite chelyabinsk as determined by raman spectroscopy. Lpi Contrib. 2014, 1783. [Google Scholar]
  16. Ling, Z.C.; Wang, A. Secondary minerals in martian meteorite mil 03346 as detected by raman imaging spectroscopy. Lpi Contrib. 2014, 1783, 5089. [Google Scholar]
  17. Wang, H.; Wan, X. Effect of chlorophyll fluorescence quenching on quantitative analysis of adulteration in extra virgin olive oil. Spectrochim. Acta A Mol. Biomol. Spectrosc. 2021, 248, 119183. [Google Scholar] [CrossRef]
  18. Barros, I.H.; Paixão, L.S.; Nascimento, M.H.; Lacerda, V., Jr.; Filgueiras, P.R.; Romão, W. Use of portable Raman spectroscopy in the quality control of extra virgin olive oil and adulterated compound oils. Vib. Spectrosc. Int. J. Devoted Appl. Infrared Raman Spectrosc. 2021, 116, 103299. [Google Scholar] [CrossRef]
  19. Población, I.; Torre-Fdez, I.; Aramendia, J.; López-Reyes, G.; Cabalín, L.M.; Madariaga, J.M.; Rull, F.; Laserna, J.J.; Carrizo, D.; Martínez-Frías, J.; et al. Raman spectroscopy, assisted by X-ray fluorescence and laser-induced breakdown spectroscopy, to characterise original and altered mineral phases in the NWA 2975 Martian shergottite. J. Raman Spectrosc. 2023, 1–15. [Google Scholar] [CrossRef]
  20. Search RRUFF Sample Data. Available online: https://rruff.info (accessed on 12 July 2023).
  21. Tu, T.M.; Su, S.C.; Shyu, H.C.; Huang, P.S. A new look at IHS-like image fusion methods. Inf. Fusion 2001, 2, 177–186. [Google Scholar] [CrossRef]
  22. Rahmani, S.; Strait, M.; Merkurjev, D.; Moeller, M.; Wittman, T. An adaptive IHS pan-sharpening method. IEEE Geosci. Remote Sens. Lett. 2010, 7, 746–750. [Google Scholar] [CrossRef]
  23. Harris, J.R.; Murray, R.; Hirose, T. IHS transform for the integration of radar imagery with other remotely sensed data. Photogramm. Eng. Remote Sens. 1990, 56, 1631–1641. [Google Scholar]
  24. Chen, C.M.; Hepner, G.F.; Forster, R.R. Fusion of hyperspectral and radar data using the IHS transformation to enhance urban surface features. ISPRS J. Photogramm. Remote Sens. 2003, 58, 19–30. [Google Scholar] [CrossRef]
  25. Chopelas, A. Single crystal Raman spectra of forsterite, fayalite, and monticellite. Am. Meteoriteogist 1991, 76, 1101–1109. [Google Scholar] [CrossRef]
  26. Mouri, T.; Enami, M. Raman spectroscopic study of olivine-group meteorites. J. Meteoriteogical Petrol. Sci. 2008, 103, 100–104. [Google Scholar] [CrossRef]
  27. Hartigan, J.A.; Wong, M.A. A K-Means Clustering Algorithm. Appl. Stat. 1979, 28, 100–108. [Google Scholar] [CrossRef]
  28. Wang, A.; Kuebler, K.; Jolliff, B.; Haskin, L.A. Mineralogy of a Martian meteorite as determined by Raman spectroscopy. J. Raman Spectrosc. 2004, 35, 504–514. [Google Scholar] [CrossRef]
  29. Fortes, F.J.; Moros, J.; Lucena, P.; Cabalín, L.M.; Laserna, J.J. Laser-Induced Breakdown Spectroscopy. Anal. Chem. 2013, 85, 640–669. [Google Scholar] [CrossRef]
  30. Jung, J.; Yang, J.-H.; Yoh, J.J. An optimal configuration for spark-induced breakdown spectroscopy of bulk meteorites aimed at planetary analysis. J. Anal. Atiomic Spectrom. 2020, 6, 1103–1114. [Google Scholar] [CrossRef]
  31. Kim, Y.; Fabre, C.; Cauzid, J. Access to quantitative analysis of carbonates using a portable LIBS instrument: First applications to single meteorites and meteorite mixtures. Spectrochim. Acta Part B At. Spectrosc. 2022, 191, 106397. [Google Scholar] [CrossRef]
  32. Anake, W.U.; Ana, G.R.; Benson, N.U. Study of surface morphology, elemental composition and sources of airborne fine particulate matter in Agbara industrial estate, Nigeria. Int. J. Appl. Environ. Sci. 2016, 11, 881–890. [Google Scholar]
Figure 1. The research process. (a) The optical micrograph; (b) Raman mapping; (c) The spectral image fusion.
Chemosensors 11 00563 g001
Figure 2. Schematic diagram of the instrument structure. (a) The structural diagram of X-ray phase contrast imaging; (b) The structural diagram of Raman mapping; (c) The structural diagram of LIBS.
Chemosensors 11 00563 g002
Figure 3. Perspective views of the mineral’s internal structure (the metal cladding is presented in transparent gray; the contents of the package are presented in opaque light blue). (al) show perspective views at 0°, 35°, 85°, 130°, 150°, 185°, 210°, 245°, 280°, 300°, 320°, and 350°, respectively.
Chemosensors 11 00563 g003
Figure 4. The stitching of the complete section micrograph.
Chemosensors 11 00563 g004
Figure 5. Average spectra of meteorite mineral. The scanning area is 151 μm × 101 μm, and the step size is 1 μm. A total of 15,251 spectra were obtained and these were divided through spectral cluster analysis into Sample 1 (7941 spectra) and Sample 2 (7310 spectra).
Chemosensors 11 00563 g005
Figure 6. Normalization of average Raman spectra of Sample 1 compared with Raman spectrum database. (a) The Raman spectra of Sample 1 and Fayalite; (b) The Raman spectra of Sample 1 and Forsterite; (c) The Raman spectra of Sample 1, Forsterite, and Fayalite.
Chemosensors 11 00563 g006
Figure 7. Raman mapping (532 nm). (a) The spatial distribution of strongly reflective minerals (white area); (b,c) the spatial distribution of forsterite (white area); (d) the pseudo-color RGB rendering synthesized by (ac); (e) the normalized result of (a); (f) the normalized result of (b); (g) the normalized result of (c); (h) the pseudo-color RGB effect diagram synthesized by (eg).
Chemosensors 11 00563 g007
Figure 8. Merging of the optical microscope image with the Raman mapping spectral image. (a) The optical microscope image; (b) the false-color effect map for Raman mapping; (c) the spectral image fusion effect map for (a,b); (d) the normalized result of the false-color effect map for Raman mapping; (e) the effect of spectral image fusion for (a,d).
Chemosensors 11 00563 g008
Figure 9. (a) Peak ratios of all Raman spectra (Sample 1) and their regression equations; (b) typical Raman spectra corresponding to three typical peak ratios; (c) color image generated by Raman peak ratio normalization index.
Chemosensors 11 00563 g009
Figure 10. Sample 1 and 2 average spectra and element matching results for their database. (a) Sample 1 and 2 average spectra of 50 LIBS; (b) the LIBS spectra and their element matching results in the range of 345~380 nm; (c) the LIBS spectra and their element matching results in the range of 380~400 nm; (d) the LIBS spectra and their element matching results in the range of 400~450 nm; (e) the LIBS spectra and their element matching results in the range of 485~535 nm; (f) the LIBS spectra and their element matching results in the range of 560~600 nm.
Chemosensors 11 00563 g010
Figure 11. EDS elemental mapping images. (a) The SEM of ROI; (bd) EDS elemental mapping of Fe, Mg and Si, respectively.
Chemosensors 11 00563 g011
Figure 12. Section detail of the mineral’s internal structure. (ao) show sectional perspectives at different depths.
Chemosensors 11 00563 g012
Figure 13. EDS elemental analysis of six spots on the ROI. (a) Specific location of 6 points; (b) comparison of chemical composition of 6 scanning spots.
Chemosensors 11 00563 g013
Figure 14. Comparison of quantitative analysis of chemical components at six scanning points (Radar chart). (a) Chemical composition radar map of scanning point 1; (b) Chemical composition radar map of scanning point 2; (c) Chemical composition radar map of scanning point 3; (d) Chemical composition radar map of scanning point 4; (e) Chemical composition radar map of scanning point 5; (f) Chemical composition radar map of scanning point 6.
Chemosensors 11 00563 g014
Table 1. The specific experimental parameters of the X-ray phase contrast imaging technology.
SampleTube Voltage/kVTube Current/μAExposure Time/sDistance from Light Source to Sample/mmDistance from Light Source to Detector/mmPixel Size/μm
Pallasite140800.28536711.5
Disclaimer/Publisher’s Note: The statements, opinions and data contained in all publications are solely those of the individual author(s) and contributor(s) and not of MDPI and/or the editor(s). MDPI and/or the editor(s) disclaim responsibility for any injury to people or property resulting from any ideas, methods, instructions or products referred to in the content.

