Article

Engineering Branched Au@Ag Nanostar Plasmonic Array for Coupling Electromagnetic Enhancement and SERS Trace Detection of Polystyrene in Aquatic Environments

1
School of Chemistry and Chemical Engineering, Hefei University of Technology, 193 Tunxi Road, Hefei 230009, China
2
Anhui Aochuang Environment Testing Co., Ltd., Weisan Road, Fuyang Economic and Technological Development Zone, Fuyang 236000, China
*
Author to whom correspondence should be addressed.
Chemosensors 2023, 11(10), 531; https://doi.org/10.3390/chemosensors11100531
Submission received: 30 August 2023 / Revised: 4 October 2023 / Accepted: 7 October 2023 / Published: 9 October 2023
(This article belongs to the Special Issue Portable Fast Detection Platforms Based on SERS Technology)

Abstract

:
Micro/nanoplastics are widespread in the environment and may cause severe damage to creatures and human beings. Micro/nanoplastic pollution has become a global focus issue; hence, the rapid and accurate detection of micro/nanoplastics is an essential step to ensure health. Herein, we report a surface-enhanced Raman scattering (SERS) technique to sensitively and quantitatively identify micro/nanoplastics in environmental water samples. A three-dimensional hierarchical Au@Ag nanostar (NSs) was synthesized and employed as an efficient SERS substrate. The “lightning rod effect” generated by tip branches of the nanostars and the coupling effect of the neighboring branches of the nanostar array enabled the ultra-trace detection of crystal violet (CV) down to 10−9 M, even with a portable Raman device. Moreover, the hydrophobic property of the SERS substrate endowed it with a desirable enrichment effect, which meant an increase in the concentration or quantity of the micro/nanoplastic particles. And thereafter, the SERS sensor achieved a highly sensitive detection of polystyrene (PS) particle standard solution at a low concentration of 25 μg/mL or 2.5 μg/mL. Importantly, the detected concentration and the SERS intensity followed a nearly linear relationship, indicating the capability of quantitative analysis of micro/nanoplastics. In addition, the SERS sensor was successfully extended to detect PS particles in environmental water samples, including tap water, sea water, and soil water, and the detection concentration was determined to be 25 μg/mL, 2.5 μg/mL, and 25 μg/mL, respectively. The present Au@AgNSs array substrate with a two-order magnitude signal amplification further exhibited significant advantages in the label-free analysis of micro/nanoplastics in real water samples.

1. Introduction

Plastic products are used worldwide and end up in landfills or in nature [1]. Once entering the environment, the discarded plastics will be gradually broken and degraded into smaller microplastics (<5 mm), and even nanoplastics (<1 μm) [2], under physical and chemical actions [3]. These micro/nanoplastics are ubiquitous and widely distributed in the atmosphere [4], water, and soil [5], and will enter the body of organisms along with human respiration [6], diet, and drinking water, thus causing severe harm and even an increased risk of death [7]. It has already been reported that micro/nanoplastics have been detected in human blood [8,9,10]. Micro/nanoplastics have become an environmental pollution problem of global concern, and therefore rapid qualitative and quantitative analysis is urgent. However, micro/nanoplastics are small in size and come in many varieties. In addition, due to the adsorption and desorption processes, micro/nanoplastics can become carriers of other pollutants, such as heavy metals, organic pollutants, and additives [11]. In this way, analytical methods are particularly important due to the differences in detection limits, sample preparation, consumables, working hours, field capabilities, and even potentially higher upfront costs [12,13,14,15,16,17]. Nevertheless, the regular detection strategies require tricky pattern pretreatment tactics and complicated instruments, so it is imperative to develop an efficient and reliable approach to analyze the micro/nanoplastics.
Surface-enhanced Raman spectroscopy (SERS) is a fingerprint analytical technique with ultrahigh sensitivity, even down to single-molecule concentration levels [18,19,20]. Over the years, SERS has proved to be a powerful technique for quantitative and microanalysis of molecules [21]. In recent years, SERS has been used to identify micro/nanoplastics in aquatic environments. For example, Zhang’s group [22] demonstrated the detection and identification of single micro/nanoplastics by taking advantage of SERS on a Klarite substrate using Clarite (Au) and a silicon wafer substrate; Liu’s team [23] investigated AgNPs on silicon wafers for rapid and detailed analysis of nanoplastics; You’s lab [24] used AuNRs or silver nanowires (AgNWs) on regenerated cellulose to improve the detection limit of PS particles; He’s group constructed mesoporous spike Au nanocrystal membranes for highly sensitive detection of micro/nanoplastics [25]; Hsieh’s team used SERS to evaluate PE polymer particles, of which the lowest detected concentration was 1.6 ng/mL [26]. However, the above SERS substrates were designed for the detection of a specific type of micro/nanoplastic, indicating a lack of standardization analytical methods for a variety of micro/nanoplastics with SERS [27]. Regarding this issue, there are many challenges to exploring a rapid and quantitative SERS analytical strategy, especially in a portable Raman spectrometer.
For portable and quantitative SERS analysis, an ideal SERS substrate with high sensitivity and high uniformity is crucial. Generally, roughed noble metal nanoparticles can generate an enormous electromagnetic field [28], and SERS enhancement is highly dependent on the shape of the metal nanoparticles. Nanostructures with rich tips tend to exhibit unique advantages in concentrated electromagnetic fields, known as the “lightning rod effect”. The “lightning rod effect” is usually the field enhancement after the potential gradient caused by the curvature and bending of the metal interface [29]. For example, surfaces with sharp curvatures allow electromagnetic fields to be concentrated at the tips. Accordingly, nano triangular plates [30], nanocubes [31], nanorods [32], and nanowires [33], etc., have been developed and prepared as highly sensitive SERS substrates. In addition, an ordered array of SERS substrate can minimize the fluctuation and produce uniform and reproducible Raman signals. Self-assembly technology is considered one of the most simple and efficient methods for arranging the metal nanostructures into a periodic array.
In this work, we select multidendritic nanostar structures as a SERS substrate to maximize electromagnetic field enhancement. Au nanostars (AuNSs) were first prepared, and then a Ag shell was coated on the prepared Au@Ag nanostars (Au@AgNSs), as shown in Figure 1a. Subsequently, Au@AgNSs were self-assembled onto the silicon wafer to form a three-dimensional Au@AgNSs array, and used for SERS detection of micro/nanoplastics. The self-assembled Au@AgNSs array generated a large number of hot spots by regulating the distance between nanostars, which further amplified the SERS signal. Additionally, the hydrophobic property of the prepared Au@AgNSs array enabled the preconcentration of the micro/nanoplastic solution, so as to improve the detection limit. The experimental results show that the Au@Ag nanostar array had high sensitivity and reproducibility. In addition, it can be used in the quantitative analysis of micro/nanoplastics in environmental water samples.

2. Experimental Section

2.1. Materials

Chloroauric acid (HAuCl4•3H2O), hexadecyl trimethyl ammonium bromide (CTAB), hexadecyl trimethyl ammonium chloride (CTAC), crystal violet (C25H30ClN3, CV), trisodium citrate dehydrate (SC), tris(hydroxymethyl)-amino-methane (TB), ascorbic acid (AA), silver nitrate (AgNO3), methanol, and absolute ethanol were analytical reagents purchased from Sinopharm Chemical Reagent Co., Ltd. (Shanghai, China). L-Cysteine (L-Cys); 1H,1H,2H,2H-perfluorodecthiol (PFT) and n-hexane were purchased from Shanghai Aladdin Biochemical Technology Co., Ltd. (Shanghai, China). Polystyrene (PS) plastic dispersions were purchased from Zhongkeleiming Technology Co., Ltd. (Beijing, China).

2.2. Preparation of the AuNSs

AuNPs were used as the core for the subsequent growth of AuNSs. AuNPs were first prepared according to the previously reported method, with some modifications [34]. Trisodium citrate dehydrate (2.2 mM) was dissolved in 140 mL deionized water for boiling. Then, 1 mL of 25 mM fresh HAuCl4 solution was added and stirred for 60 s. Subsequently, 5 mL of 0.1 M TB solution was added and reacted at 137 °C for 15 min under constant stirring. After that, the mixture was cooled to 100 °C. For every 20 min, 1 mL of 25 mM HAuCl4 solution was added twice. The product was stabilized for 30 min and stored at 4 °C for further use.
Then, AuNSs were synthesized according to the previous literature, with minor modification [35]. Under stirring, CTAB (16 mL, 0.1 M) and fresh HAuCl4 (1.6 mL, 25 mM) solutions were added to 79 mL of deionized water. Then, AA (9.5 mL, 0.1 M) solution and L-Cys (0.5 mL, 1 mM) were injected successively. After 30 s, the above prepared AuNPs colloid (1 mL) was added, and the mixture was maintained in a water bath at 30 °C for 2 h. The product was centrifuged at 4000 rpm twice for 15 min and dispersed in a CTAB solution (60 mL, 1 mM).

2.3. Fabrication of the Au@AgNSs and Self-Assembly of Au@AgNSs Array

An amount of 5 mL of the above AuNSs solution was put into a beaker, followed by adding (50 μL, 0.01 M) AgNO3 solution. Then, 100 μL of 0.1 M AA solution was injected and ultrasonically dispersed for 1 min. The mixture was maintained in a water bath at 65 °C for 4 h. When finished, the products were washed with distilled water after centrifugation at 6000 rpm twice for 15 min. Finally, 5 mL of the bottom residue of centrifugation was dispersed in a CTAC (60 mL, 1 mM) solution.
Au@AgNSs arrays were assembled on a silicon wafer by a simple oil–water interface self-assembly method. Briefly, 3 mL of AuNSs was diluted into 2 mL of the deionized water in a 50 mL beaker. An amount of 5 mL of n-hexane was slowly dropped onto the above solution surface to form an oil–water interface. Then, 10 μL of PFT solution was added, followed by injecting 5 mL of ethanol into the water layer at a constant rate to trigger the self-assembly of the Au@AgNSs, leading to the formation of a uniformly and densely arranged Au@AgNSs array on the solution surface. Lastly, the array was transferred onto the silicon wafer through lifting, and dried for subsequent use.

2.4. Materials Characterization and SERS Measurements

Scanning electron microscopy (SEM) images and energy dispersive spectroscopy (EDS) were obtained with a Gemini 500 SEM. TEM characterizations were performed using a field emission TEM (JEM-2100F, JEOL, Tokyo, Japan) at an accelerating voltage of 200 kV. UV/VIS absorption spectra were measured in a Shimadzu DUV-3700 spectrophotometer.
SERS performance was taken on a portable Raman spectrometer with a 785 nm laser source (i-Raman plus, B&W Tek Inc., Newark, DE, USA). The objective lens of the microscope was 20× and the integration time was 3 s. The laser power was 30 mW. For model molecule (CV) detection, the substrate was immersed totally in the solution for 1.5 h. After that, it was taken out and dried in air for SERS measurements. For micro/nanoplastics detection, 10 μL of micro/nanoplastic dispersion was dripped onto the surface of the substrate for natural drying and then for SERS signals collection.
The electric field distribution of Au@Ag nanostars was mapped with the finite element method using Comsol Multiphysics in some selected areas. The incident plane wave propagated from the top of the Au@Ag nanostars to the bottom with 2D hot spot nanostructures. The wavelength was 785 nm, which was the excitation wavelength of the Raman spectrometer. The diameter of the Au core and Ag shell of Au@Ag nanostars were 30.45 and 98.61 nm, respectively. The Ag branches were modeled as triangles with a height of 63.04 nm. The selected areas were ~500 nm × 1000 nm, which was the size of the area used for the calculation. The surrounding medium was set as air to simulate the real environment.

3. Results and Discussion

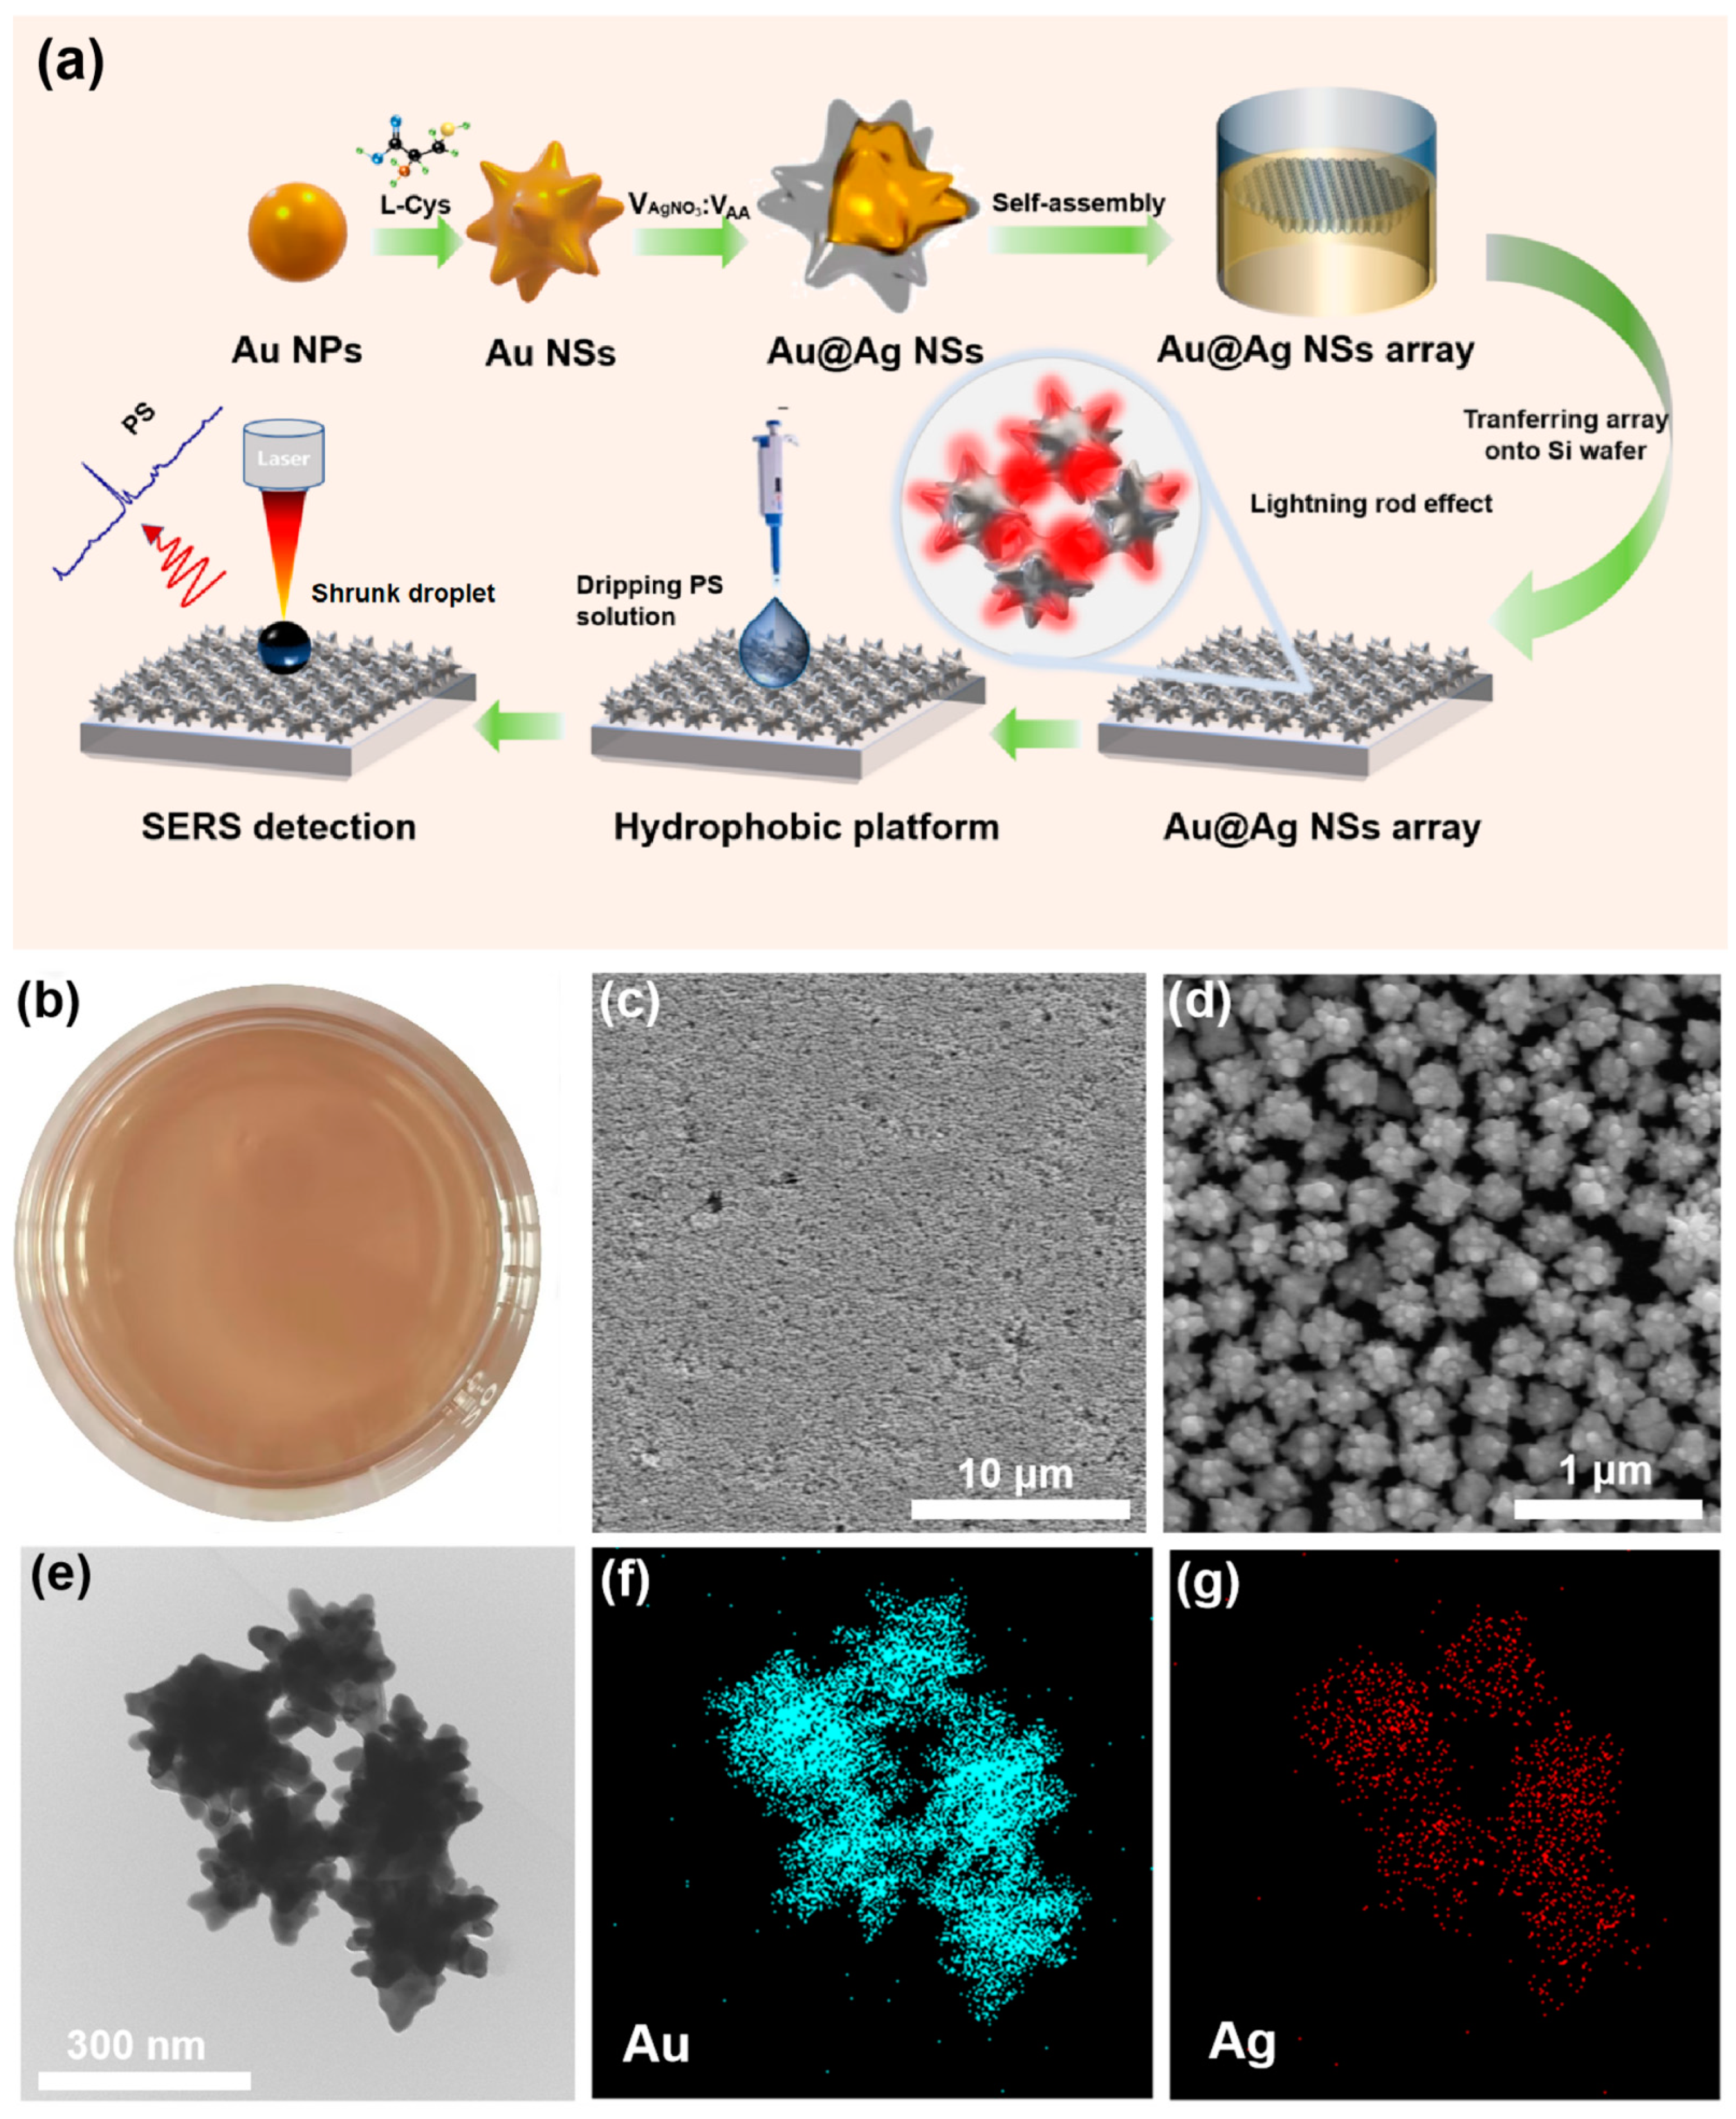
3.1. Characterizations of the Three-Dimensional Au@Ag Nanostar Array

In order to obtain a high-quality hot spot coupling in 3D nanostar arrays compared with that of non-self-assembled ones [36], an interfacial assembly of Au@AgNSs was conducted to generate a highly strong and uniform electromagnetic coupling. Here, an oil–water interface self-assembly strategy was adopted, in which PFT was employed to promote the rapid array formation of the nanoparticles at the interface while maintaining the integrity and uniformity of the array film [35]. A low dielectric constant of ethanol was used as the solvent to overcome the kinetic energy barrier and reduce the surface charge density of the nanoparticles [37]. As shown in Figure 1b, the signal Au@AgNS particles were assembled into a scale-up monolayer film at the water–hexane interface by injecting ethanol into the Au@AgNSs solution under control. Instantly, the macroscopic and uniform “golden film” was visible, and the assembly area was as large as approximately 30 cm2. Additionally, the SEM images (Figure 1c,d) demonstrated the high uniformity of the 3D Au@AgNSs arrays. The microstructure of the Au@AgNSs was further characterized by transmission electron microscopy (TEM), as shown in Figure 1e and Figure S3a,b. It was clearly observed that the Au@AgNS had an average diameter of 230 nm with a hierarchical multidendritic structure. Moreover, the elemental mapping was used to characterize the composition and element distribution (Figure S3c), which indicated that the Au nanostar surface was coated with a dense layer of Ag to form the Au@AgNS nanostructure. Lastly, UV/VIS spectra of the AuNPs and Au@AgNSs were measured, as displayed in Figure S1c. A plasmonic resonance peak at 528 nm was observed, whereas it red-shifted to 834 nm for the Au@AgNSs, which was suitable for the selection of a 785 nm laser source in the SERS measurements.

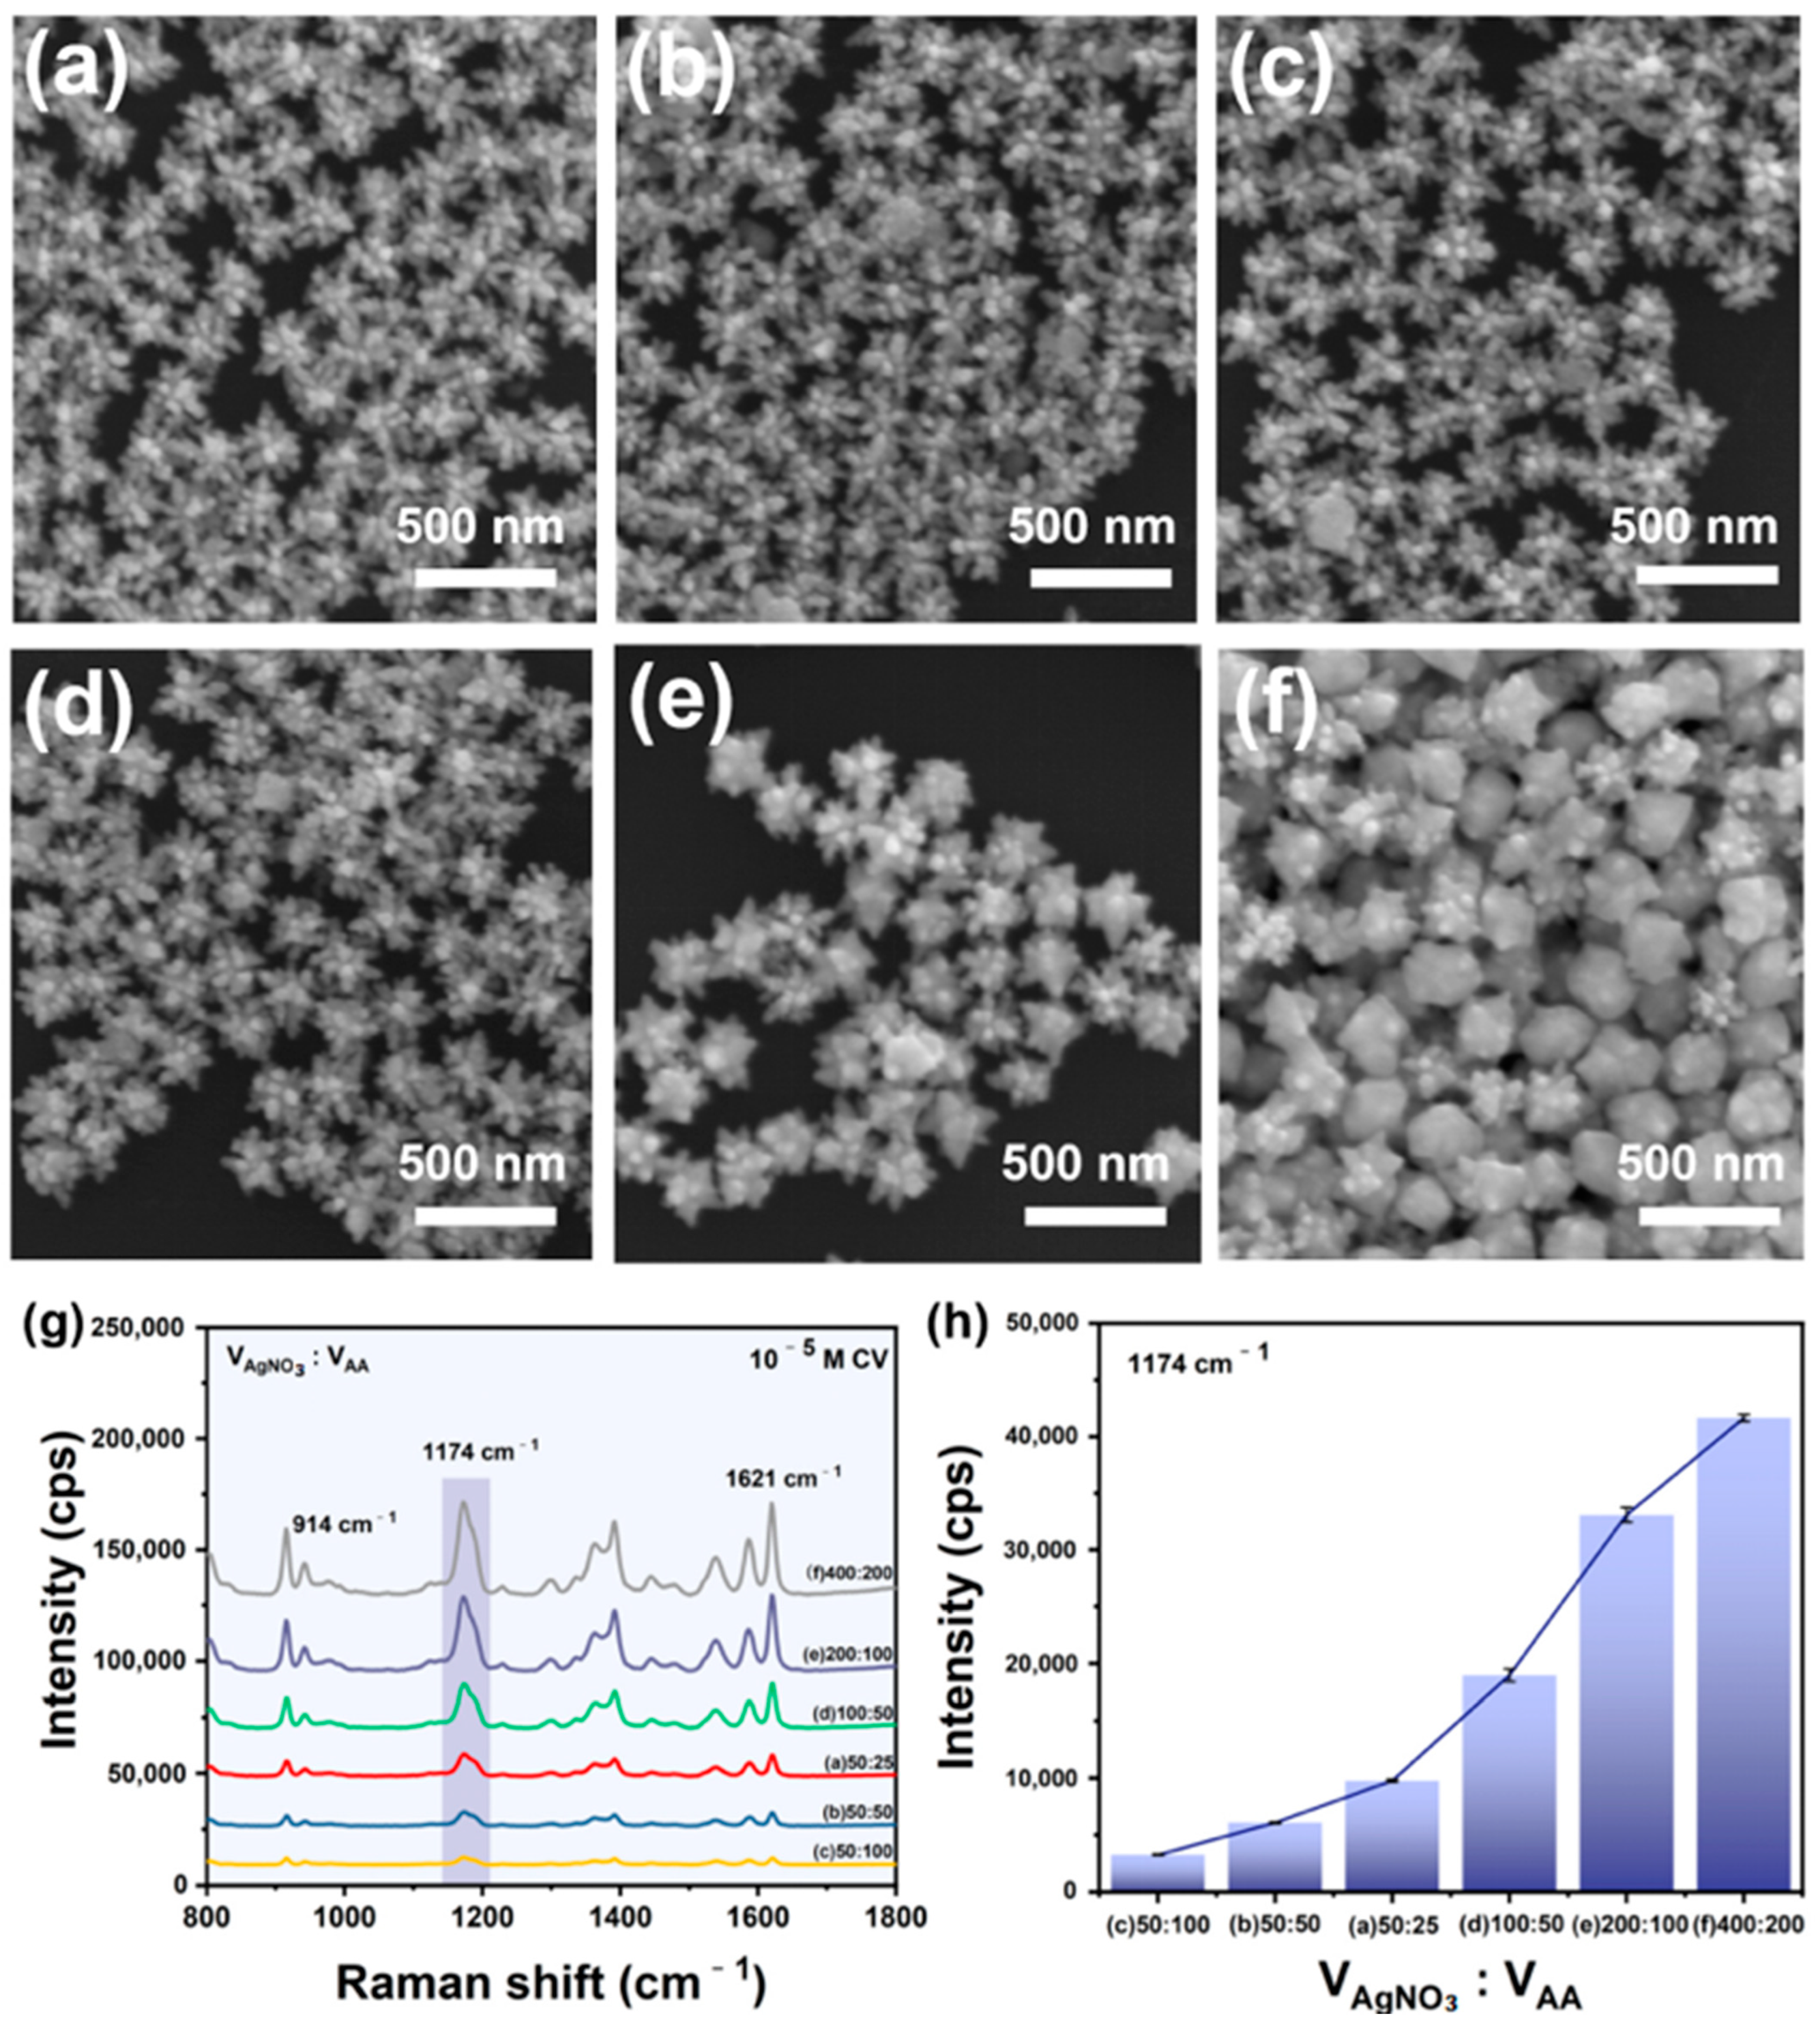
3.2. Shape-Dependent SERS Performance and the Optimization of the Au@AgNSs

Compared with gold nanoparticles, silver nanoparticles have more advantages, such as stronger LSPR absorption with higher plasmon energy and more intense local electric field enhancement [38]. Additionally, coating a layer of Ag on the surface of Au nanobars brings out a higher refractive index sensitivity in comparison with the pure Au nanobars [39]. In order to obtain substrates with a more excellent SERS performance, we tried to grow a Ag layer on the surface of the AuNSs. It should be emphasized that we first discussed Au@AgNSs and AuNSs assemblage before self-assembly. Figure S5 shows the SERS spectra of CV (10−5 M) on the Au@AgNSs and AuNS, respectively. It was evident that the sensitivity of Au@AgNSs was higher than AuNSs. Therefore, we took advantage of the electronic hot spots on the AuNSs and the high SERS efficiencies of the Ag. By combining them, an improved electromagnetic field around the metal surface was realized. The stronger surface plasma response and enhanced coupling effect between Au-Ag nanostructures will generate enormous SERS enhancement, which will play a vital role in SERS trace detection [32].
SERS enhancement of plasmonic nanostructures mainly depends on the electromagnetic mechanism (EM), which involves the excitation of the localized surface plasmon resonance (LSPR) near the roughed metallic surfaces. And the LSPR frequencies of AuNPs, AgNPs, or their alloys can be easily tuned by changing their shape, size, and surface fine structures. Therefore, we prepared AuNSs with different branching numbers by adjusting the concentration of L-Cys. During the continuous synthesis of gold nanoparticles, L-Cys selectively adsorbs on the surface of gold, modifies the growth direction through strong interaction forces, and provides anisotropic deformation in the nanoparticles, thus forming L-Cys-induced gold nanostar particles. It is worth noting that the number of branches of AuNSs is highly dependent on the concentration of L-Cys [40]. Because the concentrations of Cys can affect the kinetics of chirality formation, in this work, L-Cys was added to the AuNPs solution to form a stable chemical Au-S bond [41], which was used to control the subsequent growth of the multibranched AuNSs. AuNPs, with a mean diameter of 30 nm (Figure S1a), were synthesized and employed as the core for the growth of AuNSs. Figure 2a–d show the SEM images of Au@AgNSs prepared at different L-Cys concentrations. With the increase in the concentration of L-Cys, the number of branches of Au@AgNSs increased gradually and then decreased (Figure S2). The average particle sizes for Au@AgNSs prepared with different concentrations of L-Cys were 0.5 mM, 1 mM, 2 mM, and 4 mM (208 nm, 194 nm, 189 nm, and 189 nm), respectively. Figure 2e,f show the corresponding SERS responses of the products, which suggest that the products prepared with 1 mM of L-Cys generated the highest SERS enhancement. This can be explained by the fact that the AuNSs product had the largest number of branches, and the tips could produce an enormous electromagnetic field for Raman signal enhancement. In addition, according to the FDTD simulation, with the increase in the number of nanostar branches, more hot spots were generated, varying from two to four; therefore, the SERS performance of the nanostar was enhanced (Figure S4).
For Au@AgNSs configuration, precise regulation of the particle size and shell thickness of the nanoscale is important to obtain a highly efficient SERS performance. Accordingly, we first fabricated Au@Ag nanostars with different particle sizes by adjusting the volume ratio of AgNO3 to AA. Figure 3a–c show the SEM images of the prepared Au@AgNSs at the ratio of 50:25, 50:50, and 50:100, respectively. The morphological features indicated that the volume ratio of 2:1 produced large particle sizes with long and sharp tips of branches, which was in favor of generating a stronger electromagnetic field enhancement. As expected, we examined the respective SERS response of the products, as shown in Figure 3g, which validated the tip-enhanced Raman theory. Moreover, we synthesized different Ag thickness of Au@AgNSs by tuning the dosage of the AgNO3 and AA. Figure 3d–f display the SEM images of Au@AgNSs prepared at dosages of 100:50, 200:100, and 400:200. The average particle size for Au@AgNSs prepared at dosages of 50:25, 100:50, 200:100, and 400:200 was 219 nm, 221 nm, 236 nm, and 244 nm, respectively. It can be seen that the Ag shell thickness increased with the increase in dosages, and the SERS activity increased accordingly (Figure 3f,g). The UV/VIS absorption spectra are shown in Figure S6. The result was consistent with the previous work reported by Li et al. [42].

3.3. Aggregation-Induced Enhancement of the Three-Dimensional Au@Ag Nanostar Arrays

On the basis of the above experiments, we synthesized Au@AgNSs on a large scale with the optimized parameters. And the as-prepared Au@AgNSs were used to construct macroscopic and uniform plasmonic monolayer arrays by a facile interfacial assembly (Figure 1c,d). The non-self-assembled Au@AgNSs and the Au@AgNSs array were further fabricated by SERS sensoring to carry out sensing analysis, as displayed in Figure 4a,b. It was evident that the former could detect the CV solution at a low concentration of 10−7 M, while the latter achieved a 10−9 M detection concentration, which was two orders of magnitude stronger than the former. Furthermore, the enhancement factor (EF) of the Au@AgNSs array was calculated to be 3.80 × 10⁷, which was 365-fold stronger than that of the non-self-assembled Au@AgNSs (EF of 1.04 × 10⁵). The detailed calculation process is shown in the supporting information. This was reasonable because of the rich hot spots generated by the so-called “lightning-rod effect” [30] in a single nanostar particle and the coupling effect from the nanogaps formed between tips and tips and spherical surfaces in the Au@AgNSs array structure, which was proved by Javier Aizpurua’s team [43]. Furthermore, FDTD simulation was used to further analyze their electromagnetic field enhancement, and the results are inset in Figure 4c,d. Clearly, the Au@AgNSs array exhibited a larger number of electromagnetic hot spots between adjacent tips. In addition, by comparison of EF for different SERS substrates with different shapes (Table 1), our substrate demonstrated superior SERS enhancement capability.

3.4. The Signal Uniformity and Stability of the Substrate

Signal uniformity or reproducibility of the substrate is a key factor in quantitative analysis. In order to evaluate the SERS performance of the Au@AgNSs array and confirm its potential in analyzing nanoplastics, CV was selected as the Raman probe, and the SERS spectra was randomly collected from 20 points on the substrate. Figure 5a shows that Raman spectra distribution at different locations in the substrate were uniform. Additionally, we calculated the relative standard deviations (RSD) for the vibration intensity of three major peaks at these 20 points. The RSD values of the peaks at 914 cm−1, 1174 cm−1, and 1619 cm−1 were calculated to be 8.2%, 4.4%, and 9.5%, respectively (Figure 5b–d), which indicated their superior signal reproducibility. Then, the stability of the Au@AgNSs array substrate was examined, as shown in Figure 5e,f. The Raman intensity variations of the peaks at 914 cm−1, 1174 cm−1, and 1619 cm−1 decreased by 12%, 8%, and 10% after storage for 15 days, which demonstrated superior long-term stability. Above all, the excellent signal uniformity and the storage stability of the SERS substrate met the requirements of the routine analysis and could be applied to the trace detection of nanoplastics.

3.5. Quantitative Analysis of PS Standard Solutions

To evaluate the detection potentials of the Au@AgNSs substrate for micro/nanoplastics, we investigated the SERS detection of PS standard solutions of different particle sizes and concentrations, respectively. Figure 6a shows the SERS spectra of the polystyrene (PS) standard solutions of different particle sizes (1000 nm, 800 nm, 400 nm, and 200 nm) on the optimal Au@Ag nanostar array substrate. It can be seen from Figure 6a that the strongest characteristic peak at 1000 cm−1 originated from its C-C ring breathing mode of PS spheres, and the 621 cm−1, 1029 cm−1, 1445 cm−1, and 1601 cm−1 were from the ring deformation mode, the CH- in plane deformation band, ν19b or δ(CH2), and the C-C stretching vibrations [23,47]. The results show that the substrate successfully discerned the PS nanoplastics, and the SERS signal decreased with the decreasing particle size of PS. In addition, we examined the SERS sensitivity of the Au@Ag nanostar array substrate for detection of different concentrations of PS (size of 800 nm), and the SERS spectra is shown in Figure 6b. Obviously, the substrate realized the trace detection of PS nanoplastics down to 25 μg/mL, even with a portable Raman spectrometer, suggesting that our substrate has the potential for detecting micro/nanoplastics. Due to the hydrophobic property of the Au@AgNSs array, the PS solution can be concentrated on the nanoarray surface during the evaporation process, which is conducive to the trace detection of micro/nanoplastics (Inset in Figure 6b). To avoid having too few micro/nanoplastics in the sample to be detected, preconcentration will be taken, collecting PS to be measured from the solution into a smaller volume in order to increase its content above the determination limit. In our work, we took advantage of the hydrophobicity of the designed substrate Au@AgNSs array to concentrate PS into droplets. As time went by, the water evaporated, leaving dense PS particles on the substrate, which played a major role in the effective boost of the PS Raman signal detection (Figure S8). More importantly, the substrate was explored to detect PS concentrations from 500 μg/mL to 200 μg/mL (Figure 6c), and there was a good linear relationship between the SERS intensity and the PS concentration, with an R2 value of 0.99 (Figure 6d), confirming the quantitative detection ability of micro/nanoplastics. It is worth noting that only in the range of 200–500 mg/mL was quantitative detection for 800 nm PS valid.

3.6. Simulation Detection of PS Nanospheres in Environmental Water Samples

Based on the fingerprint feature and the trace detection capability of the Au@AgNSs array, we therefore conducted SERS detection of PS nanoplastics in environmental water samples, including tap water, sea water, and soil water. Tap water was obtained from local areas for direct use. For the simulation detection of PS in tap water, a certain amount of PS was spiked in the water samples to form different concentrations of environmental water samples, and then was examined by our Au@AgNSs array SERS substrate, as shown in Figure 7a. The results show that the detection concentration for PS nanospheres in tap water was as low as 25 μg/mL. In the case of simulation of the detection of PS in the sea water and soil water, a simple pretreatment was needed before SERS analysis, because the environmental water samples contained some impurities, including ionic elements, trace bacteria, inorganic salts, and dissolved organic matter, etc. Seawater was obtained from Bohai Sea and diluted 10 times with water. The soil sample was filtered with water dispersion, and the upper clear layer was taken for the preparation of different concentrations of water samples. In Figure 7b,c, SERS measurements demonstrated that the SERS substrate could still identify PS in sea water and soil water at low concentrations of 2.5 μg/mL and 25 μg/mL, respectively, even with the complex matrix interferences. The above results show that the Ag@AgNSs array substrate has great potential in the detection of micro/nanoplastics from the actual water environment.

4. Conclusions

In this work, we prepared 3D Au@AgNSs and self-assembled uniform Au@AgNSs arrays as highly sensitive SERS substrates. Due to the abundant hotspots generated by the “lightning-rod effect” of the branches and the coupling effect from the nanogaps formed between the tips formed in the Ag@AuNSs array structure, it showed a two-order magnitude stronger than the Au@AgNSs, thus exhibiting high sensitivity to CV model molecules down to 10−9 M, even with a portable Raman device. Moreover, the hydrophobicity of the array endowed the capability of the enrichment and preconcentration of analytes, which was a great benefit to lower the detection limitation of PS. And the Au@AgNSs array was successfully applied in the identification and quantitative detection of PS plastics. Importantly, the SERS substrate achieved practical trace detection of PS nanoparticles in environmental water samples. This work demonstrated that the applicability of the method in water pollution monitoring is relative to this type of nanoplastic. However, this rapid, portable, and sensitive SERS method may have great potential application in the analysis of micro/nanoplastics in real water samples.

Supplementary Materials

The following supporting information can be downloaded at: https://www.mdpi.com/article/10.3390/chemosensors11100531/s1, Figure S1: SEM images of (a) AuNPs; (b) Au@AgNSs; (c) UV/VIS spectra of AuNPs and Au@AgNSs; Figure S2: The plot between the average number of branches of Au@AgNSs and L-Cys concentration; Figure S3: (a) and (b) TEM of Au@AgNSs; (c) Energy dispersive spectroscopy image; Figure S4: FDTD simulation of nanostars with different branch numbers (a) 3, (b) 4, (c) 5, (d) 7; Figure S5: (a) The average SERS spectrum of CV (10−5 M) on the Au@AgNSs and AuNSs; (b) SERS intensity variation of 914 cm−1, 1174 cm−1 and 1619 cm−1 peaks; Figure S6: UV-vis spectra of the Au@AgNSs with different volume ratio of AgNO3 to AA: (a) 50:25, (b) 50:50, (c) 50:100; and (d) 100:50, (e) 200:100, (f) 400:200; Figure S7: SERS spectrum of 800 nm PS on different substrates, (a) Au@AgNSs array, (b) AuNSs, (c) bulk PS; Figure S8: Change of PS solution with time (a) 0 min, (b) 90 min; Figure S9: SERS spectra of PS standard solution (2.5 mg/mL) with different particle size on the silicon substrate; Figure S10: (a,b) SERS spectra used to calculate EF. The spectrum labelled as “control” is the normal Raman spectrum of CV (10−1 M) spread on the glass.

Author Contributions

Conceptualization, M.W.; Methodology, M.W.; Formal analysis, M.W.; Data curation, Y.Y. and G.N.; Writing—original draft, M.W.; Writing—review & editing, M.Z.; Visualization, J.L., D.Z., Z.L. and Z.Z.; Supervision, Y.S. All authors have read and agreed to the published version of the manuscript.

Funding

This research was funded by the National Natural Science Foundation of China (62275072), Key Research and Development Projects of Anhui Province (202104g01020009, 2022i01020024). And The APC was funded by the Natural Science Foundation of Anhui Province (2208085MB35).

Institutional Review Board Statement

Not applicable.

Informed Consent Statement

Not applicable.

Data Availability Statement

SEM images of AuNPs and Au@AgNSs; UV/VIS spectra of AuNPs and Au@AgNSs solutions; TEM image of Au@AgNS; (c) energy dispersive spectroscopy image of Au@AgNS; detailed calculation of SERS enhancement factor (EF). The data presented in this study are available in article or Supplementary Material.

Acknowledgments

This work was financially supported by the National Natural Science Foundation of China (62275072), Key Research and Development Projects of Anhui Province (202104g01020009, 2022i01020024), and the Natural Science Foundation of Anhui Province (2208085MB35).

Conflicts of Interest

The authors declare no conflict of interest.

References

  1. Geyer, R.; Jambeck, J.R.; Law, K.L. Production, use, and fate of all plastics ever made. Sci. Adv. 2017, 3, 7. [Google Scholar] [CrossRef]
  2. Primpke, S.; Lorenz, C.; Rascher-Friesenhausen, R.; Gerdts, G. An automated approach for microplastics analysis using focal plane array (FPA) FTIR microscopy and image analysis. Anal. Methods 2017, 9, 1499–1511. [Google Scholar] [CrossRef]
  3. Schmid, C.; Cozzarini, L.; Zambello, E. Microplastic’s story. Mar. Pollut. Bull. 2021, 162, 111820. [Google Scholar] [CrossRef] [PubMed]
  4. Patil, S.M.; Rane, N.R.; Bankole, P.O.; Krishnaiah, P.; Ahn, Y.; Park, Y.-K.; Yadav, K.K.; Amin, M.A.; Jeon, B.-H. An assessment of micro- and nanoplastics in the biosphere: A review of detection, monitoring, and remediation technology. Chem. Eng. J. 2022, 430, 132913. [Google Scholar] [CrossRef]
  5. Alimi, O.S.; Farner Budarz, J.; Hernandez, L.M.; Tufenkji, N. Microplastics and Nanoplastics in Aquatic Environments: Aggregation, Deposition, and Enhanced Contaminant Transport. Environ. Sci. Technol. 2018, 52, 1704–1724. [Google Scholar] [CrossRef]
  6. Amato-Lourenço, L.F.; Carvalho-Oliveira, R.; Júnior, G.R.; dos Santos Galvão, L.; Ando, R.A.; Mauad, T. Presence of airborne microplastics in human lung tissue. J. Hazard. Mater. 2021, 416, 126124. [Google Scholar] [CrossRef]
  7. Vethaak, A.D.; Legler, J. Microplastics and human health. Science 2021, 371, 672–674. [Google Scholar] [CrossRef]
  8. Leslie, H.A.; Van Velzen, M.J.; Brandsma, S.H.; Vethaak, A.D.; Garcia-Vallejo, J.J.; Lamoree, M.H. Discovery and quantification of plastic particle pollution in human blood. Environ. Int. 2022, 163, 107199. [Google Scholar] [CrossRef]
  9. Pironti, C.; Notarstefano, V.; Ricciardi, M.; Motta, O.; Giorgini, E.; Montano, L. First Evidence of Microplastics in Human Urine, a Preliminary Study of Intake in the Human Body. Toxics 2023, 1, 40. [Google Scholar] [CrossRef]
  10. Yang, Y.; Xie, E.; Du, Z.; Peng, Z.; Han, Z.; Li, L.; Zhao, R.; Qin, Y.; Xeu, M.; Li, F.; et al. Detection of Various Microplastics in Patients Undergoing Cardiac Surgery. Environ. Sci. Technol. 2023, 57, 10911–10918. [Google Scholar] [CrossRef]
  11. Yin, K.; Wang, Y.; Zhao, H.; Wang, D.; Guo, M.; Mu, M.; Liu, Y.; Nie, X.; Li, B.; Li, J.; et al. A comparative review of microplastics and nanoplastics: Toxicity hazards on digestive, reproductive and nervous system. Sci. Total. Environ. 2021, 774, 145758. [Google Scholar] [CrossRef]
  12. Cai, H.; Xu, E.G.; Du, F.; Li, R.; Liu, J.; Shi, H. Analysis of environmental nanoplastics: Progress and challenges. Chem. Eng. J. 2021, 410, 128208. [Google Scholar] [CrossRef]
  13. Ng, E.L.; Lwanga, E.H.; Eldridge, S.M.; Johnston, P.; Hu, H.W.; Geissen, V.; Chen, D. An overview of microplastic and nanoplastic pollution in agroecosystems. Sci. Total. Environ. 2018, 627, 1377–1388. [Google Scholar] [CrossRef] [PubMed]
  14. Mintenig, S.M.; Bauerlein, P.S.; Koelmans, A.A.; Dekker, S.C.; Wezel, A.P. Closing the gap between small and smaller: Towards a framework to analyse nano- and microplastics in aqueous environmental samples. Environ. Sci. Nano. 2018, 5, 1640–1649. [Google Scholar] [CrossRef]
  15. Lv, L.; He, L.; Jiang, S.; Chen, J.; Zhou, C.; Qu, J.; Lu, Y.; Hong, P.; Sun, S.; Li, C. In situ surface-enhanced Raman spectroscopy for detecting microplastics and nanoplastics in aquatic environments. Sci. Total Environ. 2020, 728, 138449. [Google Scholar] [CrossRef]
  16. Primpke, S.; Christiansen, S.H.; Cowger, W.; De Frond, H.; Deshpande, A.; Fischer, M.; Holland, E.B.; Meyns, M.; O’Donnell, B.A.; Ossmann, B.E.; et al. Critical Assessment of Analytical Methods for the Harmonized and Cost-Efficient Analysis of Microplastics. Appl. Spectrosc. 2020, 74, 1012–1047. [Google Scholar] [CrossRef]
  17. Sobhani, Z.; Zhang, X.; Gibson, C.; Naidu, R.; Megharaj, M.; Fang, C. Identification and visualisation of microplastics/nanoplastics by Raman imaging (i): Down to 100 nm. Water Res. 2020, 174, 115658. [Google Scholar] [CrossRef]
  18. Shuming, N.; Steven, R.E. Probing Single Molecules and Single Nanoparticles by Surface-Enhanced Raman Scattering. Science 1997, 275, 1102–1106. [Google Scholar]
  19. Kneipp, K.; Wang, Y.; Kneipp, H.; Perelman, L.T.; Itzkan, I.; Dasari, R.R.; Feld, M.S. Single Molecule Detection Using Surface-Enhanced Raman Scattering (SERS). Phys. Rev. Lett. 1997, 78, 1667. [Google Scholar] [CrossRef]
  20. Schlücker, S.A. Surface-Enhanced Raman Spectroscopy: Concepts and Chemical Applications. Chem. Int. Ed. 2014, 53, 4756–4795. [Google Scholar] [CrossRef]
  21. Langer, J.; Jimenez de Aberasturi, D.; Aizpurua, J. Present and Future of Surface-Enhanced Raman Scattering. ACS Nano 2020, 14, 28–117. [Google Scholar] [CrossRef] [PubMed]
  22. Xu, G.; Cheng, H.; Jones, R.; Feng, Y.; Gong, K.; Li, K.; Fang, X.; Ali Tahir, M.; Kolev Valev, V.; Zhang, L. Surface-Enhanced Raman Spectroscopy Facilitates the Detection of Microplastics <1 μm in the Environment. Environ. Sci. Technol. 2020, 54, 15594. [Google Scholar] [PubMed]
  23. Zhou, X.X.; Liu, R.; Hao, L.T.; Liu, J.F. Identification of polystyrene nanoplastics using surface enhanced Raman spectroscopy. Talanta 2021, 221, 121552. [Google Scholar] [CrossRef] [PubMed]
  24. Jeon, Y.; Kim, D.; Kwon, G.; Lee, K.; Oh, C.S.; Kim, U.J.; You, J. Detection of nanoplastics based on surface-enhanced Raman scattering with silver nanowire arrays on regenerated cellulose films. Carbohydr. Polym. 2021, 272, 118470. [Google Scholar] [CrossRef] [PubMed]
  25. Qin, Y.; Qiu, J.; Tang, N.; Wu, Y.; Yao, W.; He, Y. Controllable preparation of mesoporous spike gold nanocrystals for surface-enhanced Raman spectroscopy detection of micro/nanoplastics in water. Environ. Res. 2023, 228, 115926. [Google Scholar] [CrossRef]
  26. Lin, P.Y.; Wu, I.H.; Tsai, C.Y.; Kirankumar, R.; Hsieh, S. Detecting the release of plastic particles in packaged drinking water under simulated light irradiation using surface-enhanced Raman spectroscopy. Anal. Chim. Acta 2022, 1198, 339516. [Google Scholar] [CrossRef]
  27. Xie, L.; Gong, K.; Liu, Y.; Zhang, L. Strategies and Challenges of Identifying Nanoplastics in Environment by Surface-Enhanced Raman Spectroscopy. Environ. Sci. Technol. 2023, 57, 25–43. [Google Scholar] [CrossRef]
  28. Ding, S.Y.; You, E.M.; Tian, Z.Q.; Moskovits, M. Electromagnetic theories of surface-enhanced Raman spectroscopy. Chem. Soc. Rev. 2017, 46, 4042–4076. [Google Scholar] [CrossRef]
  29. Go, S.; Yoo, S.; Son, J.; Lee, S.; Lee, J.; Lee, S.; Kim, J.; Park, M.; Park, W.; Kim, J.-M.; et al. Ring-in-a-Triangle Nanoframes: Integrating with Intra- and Interhotspots for Highly Amplified Near-Field Focusing. Nano Lett. 2022, 22, 1734–1740. [Google Scholar] [CrossRef]
  30. Chen, Y.F.; Chang, W.R.; Lee, C.J.; Chiu, C.W. Triangular gold nanoplates /two-dimensional nano mica platelets with a 3D lightning-rod effect as flexible nanohybrid substrates for SERS bacterial detection. J. Mater. Chem. 2022, 10, 9974–9983. [Google Scholar] [CrossRef]
  31. Romo-Herrera, J.M.; González, A.L.; Guerrini, L.; Castiello, F.R.; Alonso-Nuñez, G.; Contreras, O.E.; Alvarez-Puebla, R.A. Correction: A study of the depth and size of concave cube Au nanoparticles as highly sensitive SERS probes. Nanoscale 2017, 9, 5020-5020. [Google Scholar] [CrossRef]
  32. Yang, Y.; Song, L.; Huang, Y.; Chen, K.; Cheng, Q.; Lin, H.; Xiao, P.; Liang, Y.; Qiang, M.; Su, F.; et al. Asymmetrical Molecular Decoration of Gold Nanorods for Engineering of Shape-Controlled AuNR@Ag Core-Shell Nanostructures. Langmuir 2019, 35, 16900–16906. [Google Scholar] [CrossRef] [PubMed]
  33. Anju, K.N.; Bhavitha, K.B.; Sreekanth, P.; Pranitha, S.; Didier, R.; Kala, M.S.; Sabu, T.; Nandakumar, K. Multifunctional nitrogen sulfur co-doped reduced graphene oxide-Ag nano hybrids (sphere, cube and wire) for nonlinear optical and SERS applications. Carbon 2018, 132, 380–393. [Google Scholar]
  34. Lu, X.; Huang, Y.; Liu, B.; Zhang, L.; Song, L.; Zhang, J.; Zhang, A.; Chen, T. Light-Controlled Shrinkage of Large-Area Gold Nanoparticle Monolayer Film for Tunable SERS Activity. Chem. Mater. 2018, 30, 1989–1997. [Google Scholar] [CrossRef]
  35. Lee, H.E.; Ahn, H.Y.; Mun, J.; Lee, Y.Y.; Kim, M.; Cho, N.H.; Chang, K.; Kim, W.S.; Rho, J. Amino-acid- and peptide-directed synthesis of chiral plasmonic gold nanoparticles. Nature 2018, 556, 360–365. [Google Scholar] [CrossRef]
  36. Si, S.; Liang, W.; Sun, Y.; Huang, J.; Ma, W.; Liang, Z.; Bao, Q.; Jiang, L. Facile Fabrication of High-Density Sub-1-nm Gaps from Au Nanoparticle Monolayers as Reproducible SERS Substrates. Adv. Funct. Mater. 2016, 26, 8137–8145. [Google Scholar] [CrossRef]
  37. Song, L.; Xu, B.B.; Cheng, Q.; Wang, X.; Luo, X.; Chen, X.; Chen, T.; Huang, Y. Instant interfacial self-assembly for homogeneous nanoparticle monolayer enabled conformal “lift-on” thin film technology. Sci. Adv. 2021, 7, 2852. [Google Scholar] [CrossRef]
  38. Moskovits, M.; Srnová-Śloufová, I.; Vlčkova, B. Bimetallic Ag-Au nanoparticles: Extracting meaningful optical constants from the surface-plasmon extinction spectrum. J. Chem. Phys. 2002, 116, 10435–10446. [Google Scholar] [CrossRef]
  39. Lee, Y.H.; Chen, H.; Xu, Q.H.; Wang, J. Refractive Index Sensitivities of Noble Metal Nanocrystals: The Effects of Multipolar Plasmon Resonances and the Metal Type. J. Phys. Chem. C 2011, 115, 7997–8004. [Google Scholar] [CrossRef]
  40. Lee, H.-E.; Kim, R.M.; Ahn, H.-Y.; Lee, Y.Y.; Byun, G.H.; Im, S.W.; Mun, J.; Rho, J. Cysteine-encoded chirality evolution in plasmonic rhombic dodecahedral gold nanoparticles. Nat Commun. 2020, 11, 263. [Google Scholar] [CrossRef]
  41. Song, L.; Qiu, N.; Huang, Y.; Cheng, Q.; Yang, Y.; Lin, H.; Su, F.; Chen, T. Macroscopic Orientational Gold Nanorods Monolayer Film with Excellent Photothermal Anticounterfeiting Performance. Adv. Opt. Mater. 2020, 8, 1902082. [Google Scholar] [CrossRef]
  42. Li, J.J.; Wu, C.; Zhao, J.; Weng, G.J.; Zhu, J.; Zhao, J.W. Synthesis and SERS activity of super-multibranched AuAg nanostructure via silver coating-induced aggregation of nanostars. Spectrochim. Acta A Mol. Biomol. Spectrosc. 2018, 204, 380–387. [Google Scholar] [CrossRef] [PubMed]
  43. Urbieta, M.; Barbry, M.; Zhang, Y.; Koval, P.; Sánchez-Portal, D.; Zabala, N.; Aizpurua, J. Atomic-Scale Lightning Rod Effect in Plasmonic Picocavities: A Classical View to a Quantum Effect. ACS Nano 2018, 12, 585–595. [Google Scholar] [CrossRef]
  44. Yuan, K.; Zheng, J.; Yang, D.; Jurado Sanchez, B.; Liu, X.; Guo, X.; Liu, C.; Dina, N.E.; Jian, J.; Bao, Z.; et al. Self-Assembly of Au@Ag Nanoparticles on Mussel Shell to Form Large-Scale 3D Supercrystals as Natural SERS Substrates for the Detection of Pathogenic Bacteria. ACS Omega 2018, 3, 2855–2864. [Google Scholar] [CrossRef] [PubMed]
  45. Lin, S.; Lin, X.; Han, S.; He, L.; Zhao, H.; Zhang, J.; Hasi, W.; Wang, L. Width and length dependent SERS performance of core-shell Au@Ag nanorod self-assembled monolayers. J. Alloys Compd. 2019, 805, 318–326. [Google Scholar] [CrossRef]
  46. Lin, S.; Lin, X.; Liu, Y.; Zhao, H.; Hasi, W.; Wang, L. Self-assembly of Au@ Ag core–shell nanocubes embedded with an internal standard for reliable quantitative SERS measurements. Anal. Methods 2018, 10, 4201–4208. [Google Scholar] [CrossRef]
  47. Chang, L.; Jiang, S.; Luo, J.; Zhang, J.; Liu, X.; Lee, C.Y.; Zhang, W. Nanowell-enhanced Raman spectroscopy enables the visualization and quantification of nanoplastics in the environment. Environ. Sci. Nano 2022, 9, 542–553. [Google Scholar] [CrossRef]
Figure 1. (a) Synthetic scheme of the preparation of 3D Au@Ag nanostar arrays and micro/nanoplastics detection; (b) optical photography, (c,d) SEM images, and (e) TEM image of the Au@Ag nanostars; the corresponding elemental mappings of (f) Au and (g) Ag.
Chemosensors 11 00531 g001
Figure 2. SEM images of Au@AgNSs prepared with different concentrations of L-Cys: (a) 0.5 mM, (b) 1 mM, (c) 2 mM, and (d) 4 mM; (e) the corresponding SERS spectra of CV (10−5 M) absorbed on the products of a–d; (f) histogram of Raman intensities at 1174 cm−1 peak of CV.
Chemosensors 11 00531 g002
Figure 3. SEM images of Au@AgNSs prepared at different volume ratios of AgNO3 to AA: (a) 50:25, (b) 50:50, (c) 50:100, (d) 100:50, (e) 200:100, (f) 400:200; (g) SERS spectra of CV (10−5 M) absorbed on the products of a–f; (h) histogram of the Raman intensities at 1174 cm−1 peak of CV.
Chemosensors 11 00531 g003
Figure 4. SERS spectra of CV with different concentrations adsorbed on (a) the non-self-assembly Au@AgNSs, (b) the self-assembly Au@AgNSs array, and the corresponding histogram of Raman intensities at a 1174 cm−1 peak of CV on (c) Au@AgNSs and (d) Au@AgNSs arrays. The spectrum labeled as “control” is the Raman spectrum obtained by focusing the laser onto the Au@AgNSs substrates with no substance deposited on them. The insets in (c,d) are the respective FDTD simulation results.
Chemosensors 11 00531 g004
Figure 5. (a) SERS spectra of CV (10−6 M) on Au@AgNSs obtained from 20 different points; (bd) the RSD values of 914 cm−1, 1174 cm−1, and 1619 cm−1 peaks; (e) SERS spectra of CV (10−5 M) collected on the newly prepared substrate and that stored for 15 days; (f) SERS intensity variation of 914 cm−1, 1174 cm−1, and 1619 cm−1 peaks.
Chemosensors 11 00531 g005
Figure 6. (a) SERS spectra of PS standard solution (2.5 mg/mL) with different particle sizes on the substrate, and the spectra labeled as “control” is the normal Raman spectra of standard solution (2.5 mg/mL) with different particle sizes on the silicon; (b) SERS spectra of different concentrations of PS nanosphere (800 nm) on the substrate; (c) SERS spectra of PS nanospheres (800 nm) with different concentrations; (d) relationships between PS concentration and SERS intensity.
Chemosensors 11 00531 g006
Figure 7. SERS spectra of PS nanosphere in environmental water samples on Au@AgNSs array substrate: (a) tap water; (b) sea water; (c) soil water. The spectrum labeled as “control” is the normal Raman spectrum of PS in environmental water samples on the silicon.
Chemosensors 11 00531 g007
Table 1. Comparison of different SERS substrates with different shapes.
SERS Substrate with Different ShapesMolecularLODEFReference
Au@Ag NPsRhodamine 6G10−9 M1.02 × 107[44]
Au@Ag NRsCrystal violet10−6 M6.3 × 105[45]
Au@Ag NCsCrystal violet10−7 M1.45 × 106[46]
Au@Ag NSs arrayCrystal violet10−9 M3.8 × 107In this work
Disclaimer/Publisher’s Note: The statements, opinions and data contained in all publications are solely those of the individual author(s) and contributor(s) and not of MDPI and/or the editor(s). MDPI and/or the editor(s) disclaim responsibility for any injury to people or property resulting from any ideas, methods, instructions or products referred to in the content.

