Article

Thyroxine Quantification by Using Plasmonic Nanoparticles as SERS Substrates

by
Paulina De Leon Portilla
1,2,
Ana L. González
2 and
Enrique Sanchez-Mora
1,*
1
Instituto de Física-Ecocampus Valsequillo, Benemérita Universidad Autónoma de Puebla, Independencia O 2 Sur No. 50, San Pedro Zacachimalpa, 72960 Puebla, Mexico
2
Instituto de Física, Benemérita Universidad Autónoma de Puebla, Av. San Claudio y 18 Sur, Ciudad Universitaria, 72570 Puebla, Mexico
*
Author to whom correspondence should be addressed.
Chemosensors 2023, 11(10), 516; https://doi.org/10.3390/chemosensors11100516
Submission received: 3 June 2023 / Revised: 1 August 2023 / Accepted: 30 August 2023 / Published: 30 September 2023
(This article belongs to the Special Issue Surface-Enhanced Raman Spectroscopy for Bioanalytics)

Abstract

:
Functionalized Au and Ag nanoparticles (NPs) with ascorbic and tannic acid, respectively, were used as SERS substrates (SS). Several SS were fabricated with different loads of metal NPs deposited on silicon wafers. We focused on the thyroxine (T4) band at 1044 cm−1 and tracked its intensity and position at concentrations from 10 pM to 1 mM. For all SS, the band intensity decreased as the T4 concentration decreased. Additionally, the band shifted to larger wavenumbers as the NP loads increased. In the case of Au, the SS with the highest load of NPs, the minimum concentration detected was 1 μM. The same load of the Ag NP SS showed a better performance detecting a concentration of 10 pM, an outcome from a SERS-EF of 109. The NP spatial distribution includes mainly isolated NPs, quasi-spherical clusters, and semi-linear arrays of NPs in random orientations. From the numerical simulations, we conclude that the hot spots at the interparticle gaps in a linear array of three NPs are the most intense. The Ag NP SS demonstrated good sensitivity, to allow the detection of pM concentrations. Therefore, its complementation to any immunoassay technique provides an interesting alternative for point-of-care implementations, such as test strips.

1. Introduction

Thyroxine (T4) is a hormone, which is secreted by the thyroid gland and is made up of phenyls, iodine, carboxyl, hydroxyl, ether, and amino groups. T4 is crucial for the right development of reproductive organs, neurons, etc. [1,2], in addition to, for the proper functioning of the human body. A deficiency (T4 < 64 nM) promotes growth issues in humans, whereas in excess (T4 > 141 nM), it contributes to the development of various diseases, such as thyroiditis, and cancer nodules, among others [2,3]. Therefore, it is vital to detect concentration levels of T4 out of the normal range in the bloodstream. Additionally, focusing attention on the T4 hormone (free or bound), it is important to track triiodothyronine (T3)—both bound and free forms—the thyroid stimulating hormone (TSH, also named thyrotropin), and the thyroid releasing hormone (TRH), to make a proper diagnosis of thyroid gland function. As reference values, we can indicate normal, hypothyroid, and hyperthyroid hormone conditions at 1.2 ng/mL, 0.2 ng/mL, and 2.2 ng/mL, respectively, for the T3 concentration, and 70 ng/mL, 30 ng/mL, and 140 ng/mL for the T4 concentration, respectively [4]. Normal ranges for thyroid tests may vary slightly among different laboratories. In [5], the normal values are indicated as 0.5 to 5.0 mIU/L for TSH, 0.7 to 1.9 ng/dL for FT4 (free T4), 5.0 to 12.0 μg/dL for total T4, and 80.0 to 220 ng/dL for total T3.
The T3, T4, and TSH concentrations are routinely measured by a blood test. Some clinical tests are based on the use of radioimmunoassay and immunoradiometric analyses. Using these methods, it has been possible to detect FT3, FT4, and TSH at normal and hypothyroidism levels [4,6,7,8,9]. However, some drawbacks of these tests are that patients may receive intravenous iodine as a contrast medium before the serum thyroxine test, long assay and sample preparation times, expensive instruments, and the employment of radioactive tracers. At the research level, innumerable efforts have been made to improve the precision and accuracy of measurements, especially at low concentrations, by looking for simple, reliable, and label-free methods. Literature can be found that reports on thyroid hormones (a small molecule type) in human or animal serum, urine, or tissues, either in its pure or synthetic form, by using sensors or methods that are the outcome of combining more than two techniques and at least one kind of antibody, all of them with the aim of contributing to the understanding of hypo- and hyperthyroidism. In that sense, a list of techniques includes chromatography coupled with mass spectroscopy [10,11,12,13,14,15], immunoassays with magnetic or plasmonic nanoparticles [16,17,18], electrochemical or chemiluminescence techniques complemented with immunoassays and/or nanoparticles [19,20,21,22,23,24], among others. Some of those techniques require pretreatment, purification, or labeling of the sample, while others use high-pressure conditions, which generate an increase in the analysis costs [10,12,13,16].
Particularly, T4 (free or bound) quantification has reached limits of detection of hundreds of pM [13], tens of pM [22,25], and even a few pM [20]. The common factor in those studies, excluding [13], is the use of nanoparticles, either magnetic or plasmonic. Gold and silver are noble plasmonic metals par excellence; their main feature is the large electric field enhancement on and close to their surface when they are in resonance with the incident light, which gives origin to the electromagnetic mechanism of the surface-enhanced Raman scattering (SERS) phenomenon [26]. SERS occurs when the analyte is in very close proximity to the plasmonic surface, and under in-resonance conditions the Raman signal can be enhanced several orders of magnitude. The most important feature is that the Raman spectrum is specific to each molecule, which is a potential advantage of multiplexed labeling [27].
SERS promoted by Au or Ag NPs and coupled to immunoassays or other analysis techniques has been addressed for sensing macromolecules, such as proteins, viruses, DNA, heavy metals, and tumors [28,29,30]. By using Au NPs of about 37 nm in diameter, estradiol (limit of detection, LOD, of 2.4 pM) and TSH (LOD of 33 μM) hormones have been studied; see [31,32] for details, respectively. S. M. Kim and colleagues reported the detection of T4 with Au–tellurium earthworm-like structures, yet a LOD value was not indicated [33].
Even though SERS is a relatively simple, reliable, and inexpensive technique, the enhancement of the Raman signal (SERS-EF) depends on several key factors, such as the power and wavelength laser, exposure time, the chemical structure and composition of the molecule, and the metal surface roughness [26]. The shape, size, and material of the NPs play a pivotal role in fabricating a vast diversity of SERS substrates. For example, with wire-like clusters of small Ag NPs (size of 17 nm) and a laser of 488 nm, a SERS-EF of 108–1010 was enough to detect methylene blue molecules [34]. That range of SERS-EF values is sufficient to trace a single molecule. The great performance of that specific Ag structure lies in a large number of hot spots (high-intensity electric field zones), which originate at each interparticle gap (1.7 nm) along the wire-like clusters. With spherical Au NPs of various sizes, from 17 nm to 80 nm, 4-aminothiophenol was detected with SERS-EFs in the order of 10–105. From an optimization study of SERS measurements, the optimal Au NP size to obtain the largest SERS-EF was 50 nm; under off-resonance conditions (the laser wavelength was 647 nm) [35].
There are several options for synthesizing metallic NPs that vary in size and shape; some of which are nanolithography techniques [36,37], Turkevich [38], and seed-mediated growth methods [39]. The last is a good option for obtaining spherical Au and Ag NPs; the size can be controlled by the number of growth stages [39,40].
In this work, we report on the detection and quantification of T4 using Au and Ag NPs as SERS platforms. Functionalized spherical NPs of about 50 nm were synthesized by the seed-mediated growth method. Intensity changes and frequency shifts are observed in the SERS response for SERS substrates (SS) fabricated with different numbers of metal NPs. For an excitation wavelength of 632 nm, Ag NP SS showed a larger sensitivity because the lowest T4 concentration detected with it was 10 pM, while for the Au NP SS, it was 1 μM.
Therefore, under specific conditions and without labeling target substances, T4 was successfully detected at levels linked to hypothyroidism conditions, meaning this simple SERS platform is a potential candidate for sensing other small analytes. It is also a prospect to complement immunoassay analysis for sensor devices.

2. Materials and Methods

Chloroauric acid (Sigma-Aldrich, St. Louis, MO, USA, 99.9%), L-ascorbic acid (Sigma-Aldrich, 98%), and polyvinylpyrrolidone (PVP, Sigma-Aldrich, average molar weight 10,000) were used to synthesize Au NPs. Ag NPs were obtained using silver nitrate (Riedel-de-Haën, Seelze, HAJ, DE, 98%), tannic acid (Sigma-Aldrich, 99%), and sodium citrate dihydrate (J. T. Baker, Center Valley, PA, USA, 99.98%). To support the NPs, p-type silicon wafers (SW) with a resistivity of 0.01–0.02 Ω cm were employed. Thyroxine precursor was provided by Sigma-Aldrich (99%).

2.1. Au NPs Synthesis

Au NPs were synthesized using the seed-mediated growth method. First, 35 mg of PVP and 60 mg of L-ascorbic acid were mixed in 6 mL of deionized water. Then, 3 mL of chloroauric acid (1 mM) was added to the solution and allowed to react for 3 h to obtain Au seeds. Subsequently, the seeds were subjected to two stages of growth, each one by adding 3 mL of chloroauric acid and giving it 3 h to react. The whole process occurred at a constant temperature of 90 °C. Finally, the Au NPs were centrifuged (Hermle LaborTechnik Z 36 HK) at 18,000 rpm for 15 min and redispersed in 20 mL of deionized water (18.2 MΩ cm).

2.2. Ag NPs Synthesis

We followed a previously reported Ag NP synthesis method [41]. Briefly, the procedure is described as follows: Firstly, 50 mL of tannic acid (0.1 mM), 50 mL of sodium citrate (45 mM), and 1 mL of silver nitrate (25 mM) were mixed for 15 min at 90 °C. Then, the seed solution was centrifuged to further redisperse it in deionized water. Four growths were made, for each growth 20 mL of the seed solution (0.21 M), 16 mL of deionized water, 500 μL of sodium citrate (25 mM), 1.5 mL of tannic acid (2.5 mM), and 1 mL of silver nitrate (25 mM) were used. The whole process was carried out at a constant temperature of 90 °C. Finally, Ag NPs were centrifuged and redispersed in 20 mL of deionized water.

2.3. Preparation of SERS Substrates of Au and Ag NPs

A silicon wafer (SW) with a surface area of 1 cm2 was used to support metal NPs. First, a SW was washed with xylene (Sigma-Aldrich, 98%), acetone (Sigma-Aldrich, 98%), and ethanol (Sigma-Aldrich) for 10 min. Then, it was rinsed with deionized water and further dried in a muffle at 100 °C. Subsequently, a fixed volume of metal NPs (VNP) in solution was deposited on the wafer. The solvent present in the solution was evaporated using a tubular oven (Thermo Scientific, Lindberg Blue M) at 60 °C, under a nitrogen flow (0.2 mL/s) for 30 min. Finally, without further treatment, the SW with NPs on it was viewed under an electronic microscope. To fabricate various SS, a similar procedure was repeated by using VNP = 50, 100, 150, 200, and 250 μL of Au or Ag NP solution.

2.4. Deposition of T4 on Different Substrates

Initially, we measured the Raman signal of the T4 precursor, as follows: As obtained directly from the reagent bottle, T4 crystals were used to completely cover a SW (pretreated as detailed above). Then, the SW was put in the Raman equipment to be characterized. Separately, dilute solutions of T4 with concentrations from 10 μM to 1 mM were also prepared. They were obtained from a mixture of methanol (Sigma-Aldrich, 98%) and deionized water (18.2 MΩ cm), at a ratio of 1:1 V:V. Afterward, 50 μL of T4 dilute solution was deposited on a nude SW (pretreated). The solvent was evaporated at 50 °C in a tubular oven with a nitrogen flow (0.5 mL/s) for 3 h. Finally, each sample was characterized by the Raman technique.

SERS Substrate Preparation

Once each SS was fabricated, as indicated in Section 2.3, 50 μL of T4 concentrations from pM to mM were deposited onto it. Afterward, the solvent was evaporated at 50 °C for 3 h in a tubular oven with a nitrogen flow (0.5 mL/s). Finally, each sample was characterized by the Raman technique. For each substrate, the Raman spectrum was the average response over ten spots on its surface.

2.5. Equipment

A UV-Vis-NIR Agilent-Varian-Cary 5000 spectrophotometer was used to measure the absorbance spectra of the metal NP solutions.
To visualize the shape, size, and spatial distribution of metal NPs, on the SW, a JEOL scanning electron microscope (SEM) was used (model JSM 7800F) with a 5 keV voltage.
For all experiments, a HORIBA Jobin Yvon Micro-Raman LabRam HR was used to capture the Raman signal. The equipment has an OLYMPUS BX41 microscope with a magnification of 100×, to focus on the area under study. The samples were irradiated with a monochromatic He–Ne laser (632.8 nm and power of 6 mW). The capture time was 10 s for 5 cycles. No filters were used.

2.6. Theoretical-Numerical Calculations

Theoretical-numerical modeling was performed by employing the discrete dipole approximation (DDA) under its free numerical implementation, named ddscat 7.0. Over the previous decades, DDA has been used to study the optical response of organic and inorganic materials. The dimensions of those materials span from angstroms to millimeters, and even centimeters. A list of targets includes nanotubes, nanoparticles, bacteria, red blood cells, and graphite grains [42,43,44,45,46].
There is a great variety of articles where the fundamentals of DDA have been exposed in great detail. In brief, DDA is a tool for solving Maxwell’s equations by using a set of N-point dipoles to mimic the solid target. The induced dipoles radiated by an incident electromagnetic plane wave generate their own electric field. The coupled dipoles are related to the incident and induced fields through a 3 N complex equation system [41,47,48]. This approximation allows the modeling of optical response in the far (scattering, absorption, extinction, reflection, and transmission) and near (electric field in and close to the particle’s surface) regimes.
After a study of convergence, we employed point dipoles of about 2 × 10⁵ to mimic each target. Extinction efficiencies and electric field were calculated for systems of 1 to 3 NPs of 50 nm in diameter, with a surface-to-surface separation distance of 1 nm. For the dielectric function of gold and silver, the finite size correction to the bulk material was considered because for this size the electronic confinement is not negligible [49].

3. Results and Discussion

Figure 1 shows the absorbance spectra of the Au (green line) and Ag (orange line) NPs in solution. The band observed at 537 nm is an Au surface plasmon feature [50,51]. While the band located at 421 nm corresponds to the Ag NP localized surface plasmons. Moreover, in both spectra, there are two optical bands below 300 nm. The Ag NPs are assigned to the presence of tannic acid as the functionalizing agent (see Figure S1 in the Electronic Supplementary Material (ESM)) [41,52] and to the electronic interband transitions of silver [53]. In the case of the Au NP spectrum, the two bands observed correspond to L-ascorbic acid as the functionalizing agent (see Figure S2 in ESM) and the Au interband transitions [53].
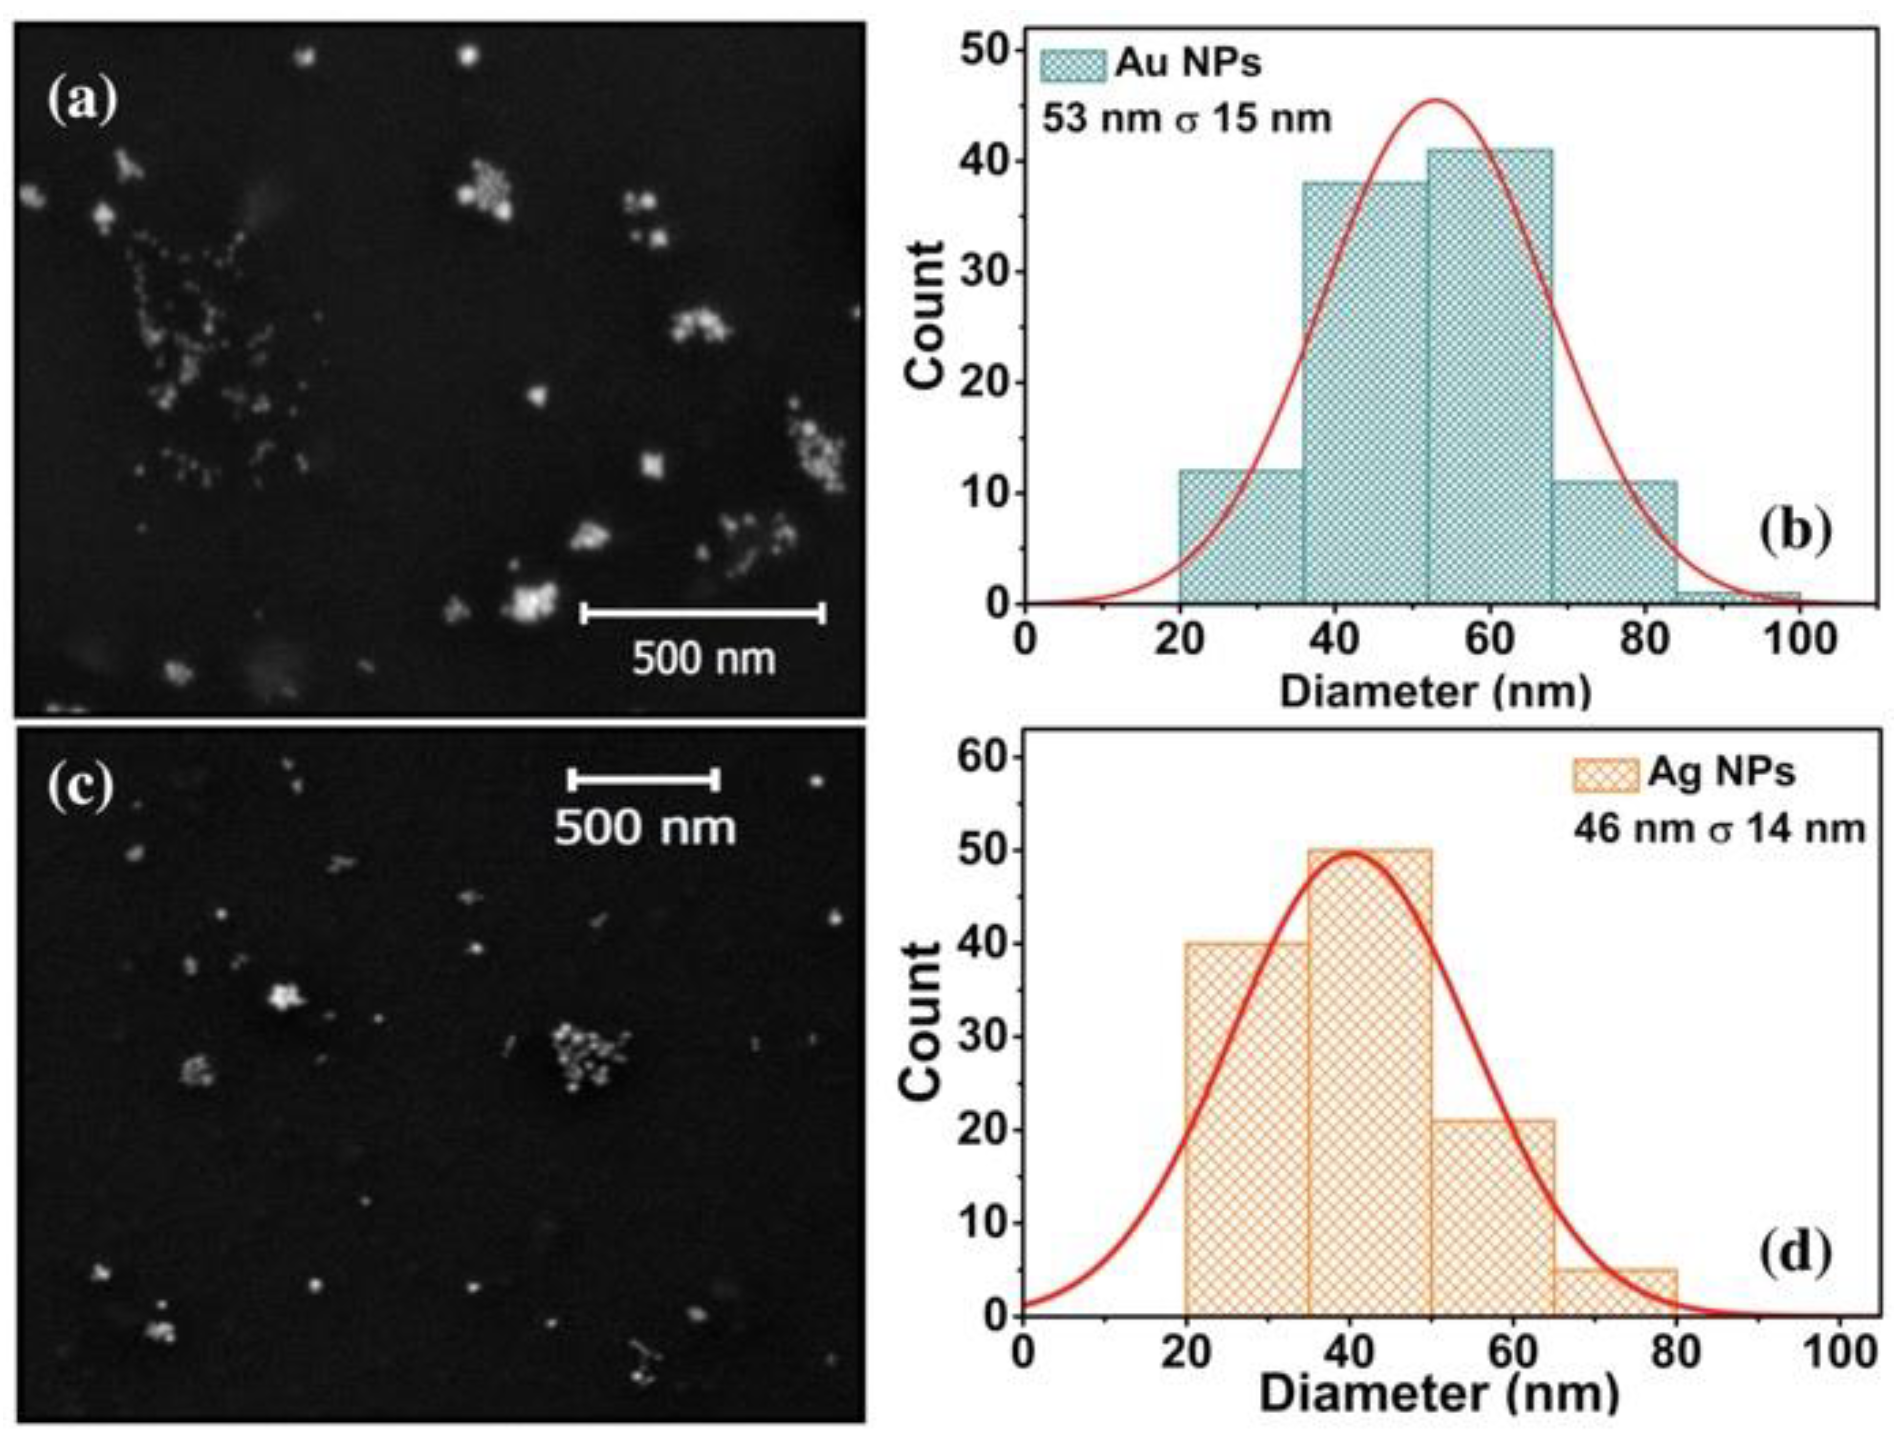
Various SS were fabricated to deposit freely in a volume concentration of metal NPs (VNP = 50, 100, 150, 200, and 250 μL) on a SW. SEM images of Au and Ag SS with a VNP = 50 μL are shown in Figure 2a,c. Quasi-spherical single NPs and small clusters of them are distributed along the SW surface. The size distribution was determined from a sample of 150 NPs. The average size is 53 ± 15 nm and 46 ± 14 nm for Au and Ag NPs, respectively (see Figure 2b,d for the size distributions).
Figure 3 shows the Raman signal of T4 crystals, where several bands are observed; the four most intense are located at 216 cm−1, 822 cm−1, 1044 cm−1, and 1050 cm−1. The first is associated with the planar bending vibrational mode of the C–C–I bonds, the second is designated to a ring deformation vibrational mode; the third and fourth bands are originated by a combination of stretching vibrations by the C–O and C–N bonds [54,55,56].
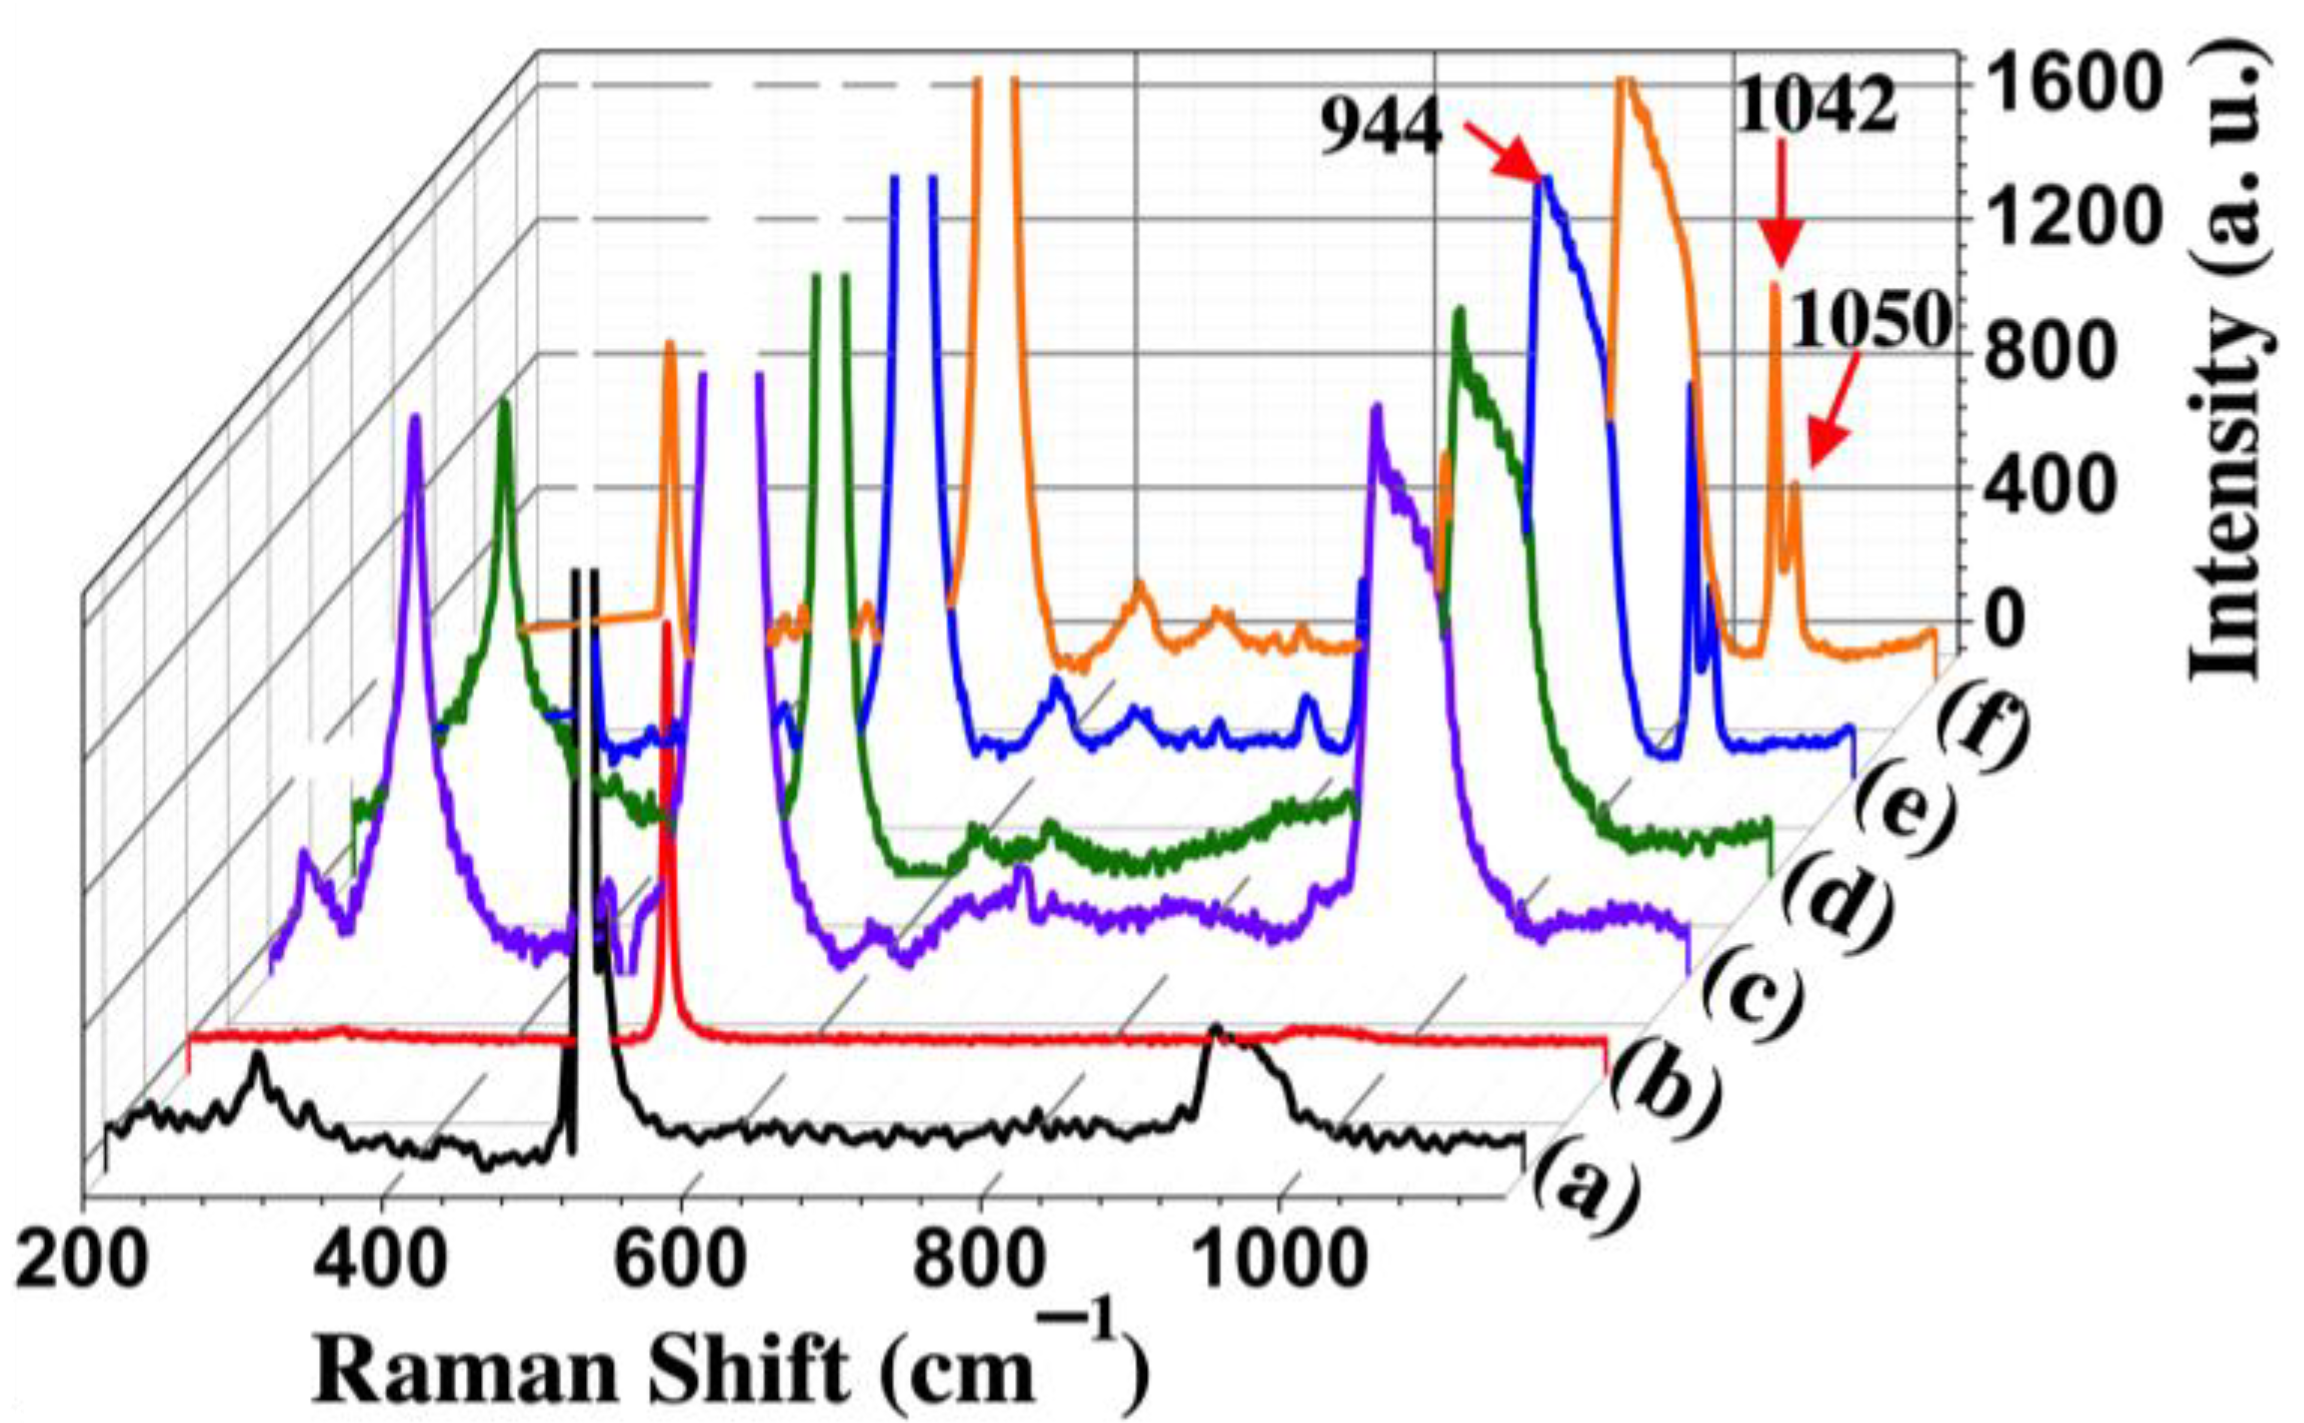
In Figure 4, we present the Raman spectra of (a) a nude SW (black line), (b) T4 deposited on a SW (red line), (c) Au NPs on a SW (purple line), (d) Ag NPs on a SW (green line), (e) T4 deposited on Au NPs (blue line), and (f) on Ag NPs (orange line). Both, in (e) and (f), the NPs were freely dropped off on the SW. Moreover, in all cases, the concentration of T4 was 1 mM. Here, the SS were prepared with a VNP = 50 μL (3 mM). In the silicon wafer spectrum, the three main bands located at 300 cm−1, 520 cm−1, and 944 cm−1 are observed. The first one corresponds to the acoustic transverse vibrational mode, and the other two to the optical transverse vibrational modes [57]. The silicon band at 520 cm−1 is very intense and observable in all six spectra; therefore, we cut the intensity scale with the sole purpose of clearly showing the bands above 800 cm−1. In the red-line spectrum, no T4 band is distinguished because of the small molecule concentration being used (1 mM), the same happens for lower T4 concentrations (not shown here). Noticeably, the Raman intensity of the T4 bands is greatly increased because of the optical response by the metal NPs, specifically, by the bands located at 216 cm−1, 822 cm−1, 1042 cm−1, and 1050 cm−1, see blue and orange lines. As we can see, the sole presence of the functionalized metal NPs increases the intensity of the silicon bands (compare spectral lines (a) with (c) and (d)). The last result motivated us to trace the intensity of one Si band as the number of NPs deposited on the SW surface increases.
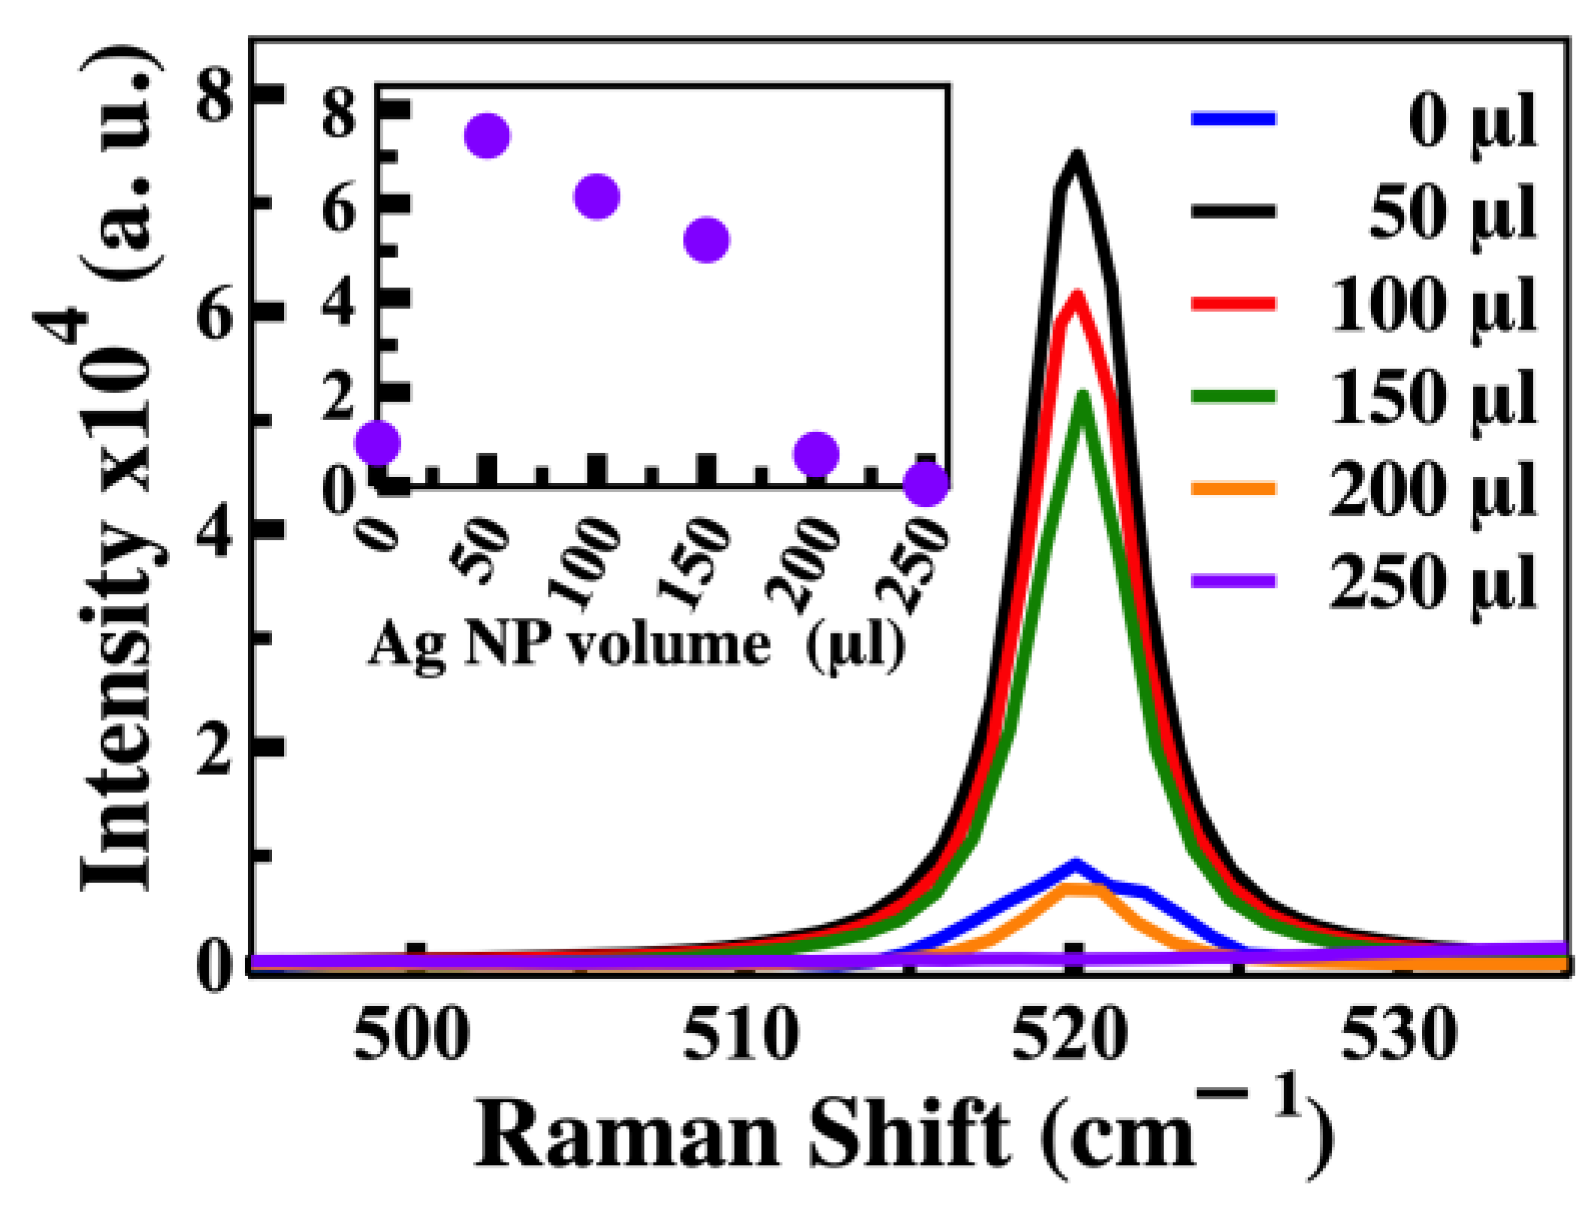
The Raman signal of SW with different Ag NP volumes, VNP, was measured. We varied VNP from 0 (nude SW) to 250 μL. Even using 250 μL of NPs did not cover the SW area 100% (see SEM images in Figure S3 in ESM). Figure 5 shows the Raman spectra around 520 cm−1. In essence, the band position remains unchanged. However, the intensity is notably modified. The band intensity when using 50 μL of Ag NPs is eight times that of the nude wafer. The inset demonstrates a non-linear decreasing relationship between the band intensity and the VNP. As VNP increases, more SW surface is covered by metal NPs; therefore, a decrement in the silicon band intensity is expected.
To assess the T4 band that would be the best at determining the SERS enhancement factor (SERS-EF), we followed the following criteria: The T4 band at 216 cm−1 was discarded because of a slight overlap with the Si band around 300 cm−1, see Figure 4 lines (a), (c), and (d). The band at 822 cm−1 was also dismissed because of its low intensity, making it untraceable at very low T4 concentrations. Therefore, the band located at 1042 cm−1 was the one chosen to determine the SERS-EF value at an excitation wavelength of 632 nm. Then, we varied the T4 concentration from mM down to pM.
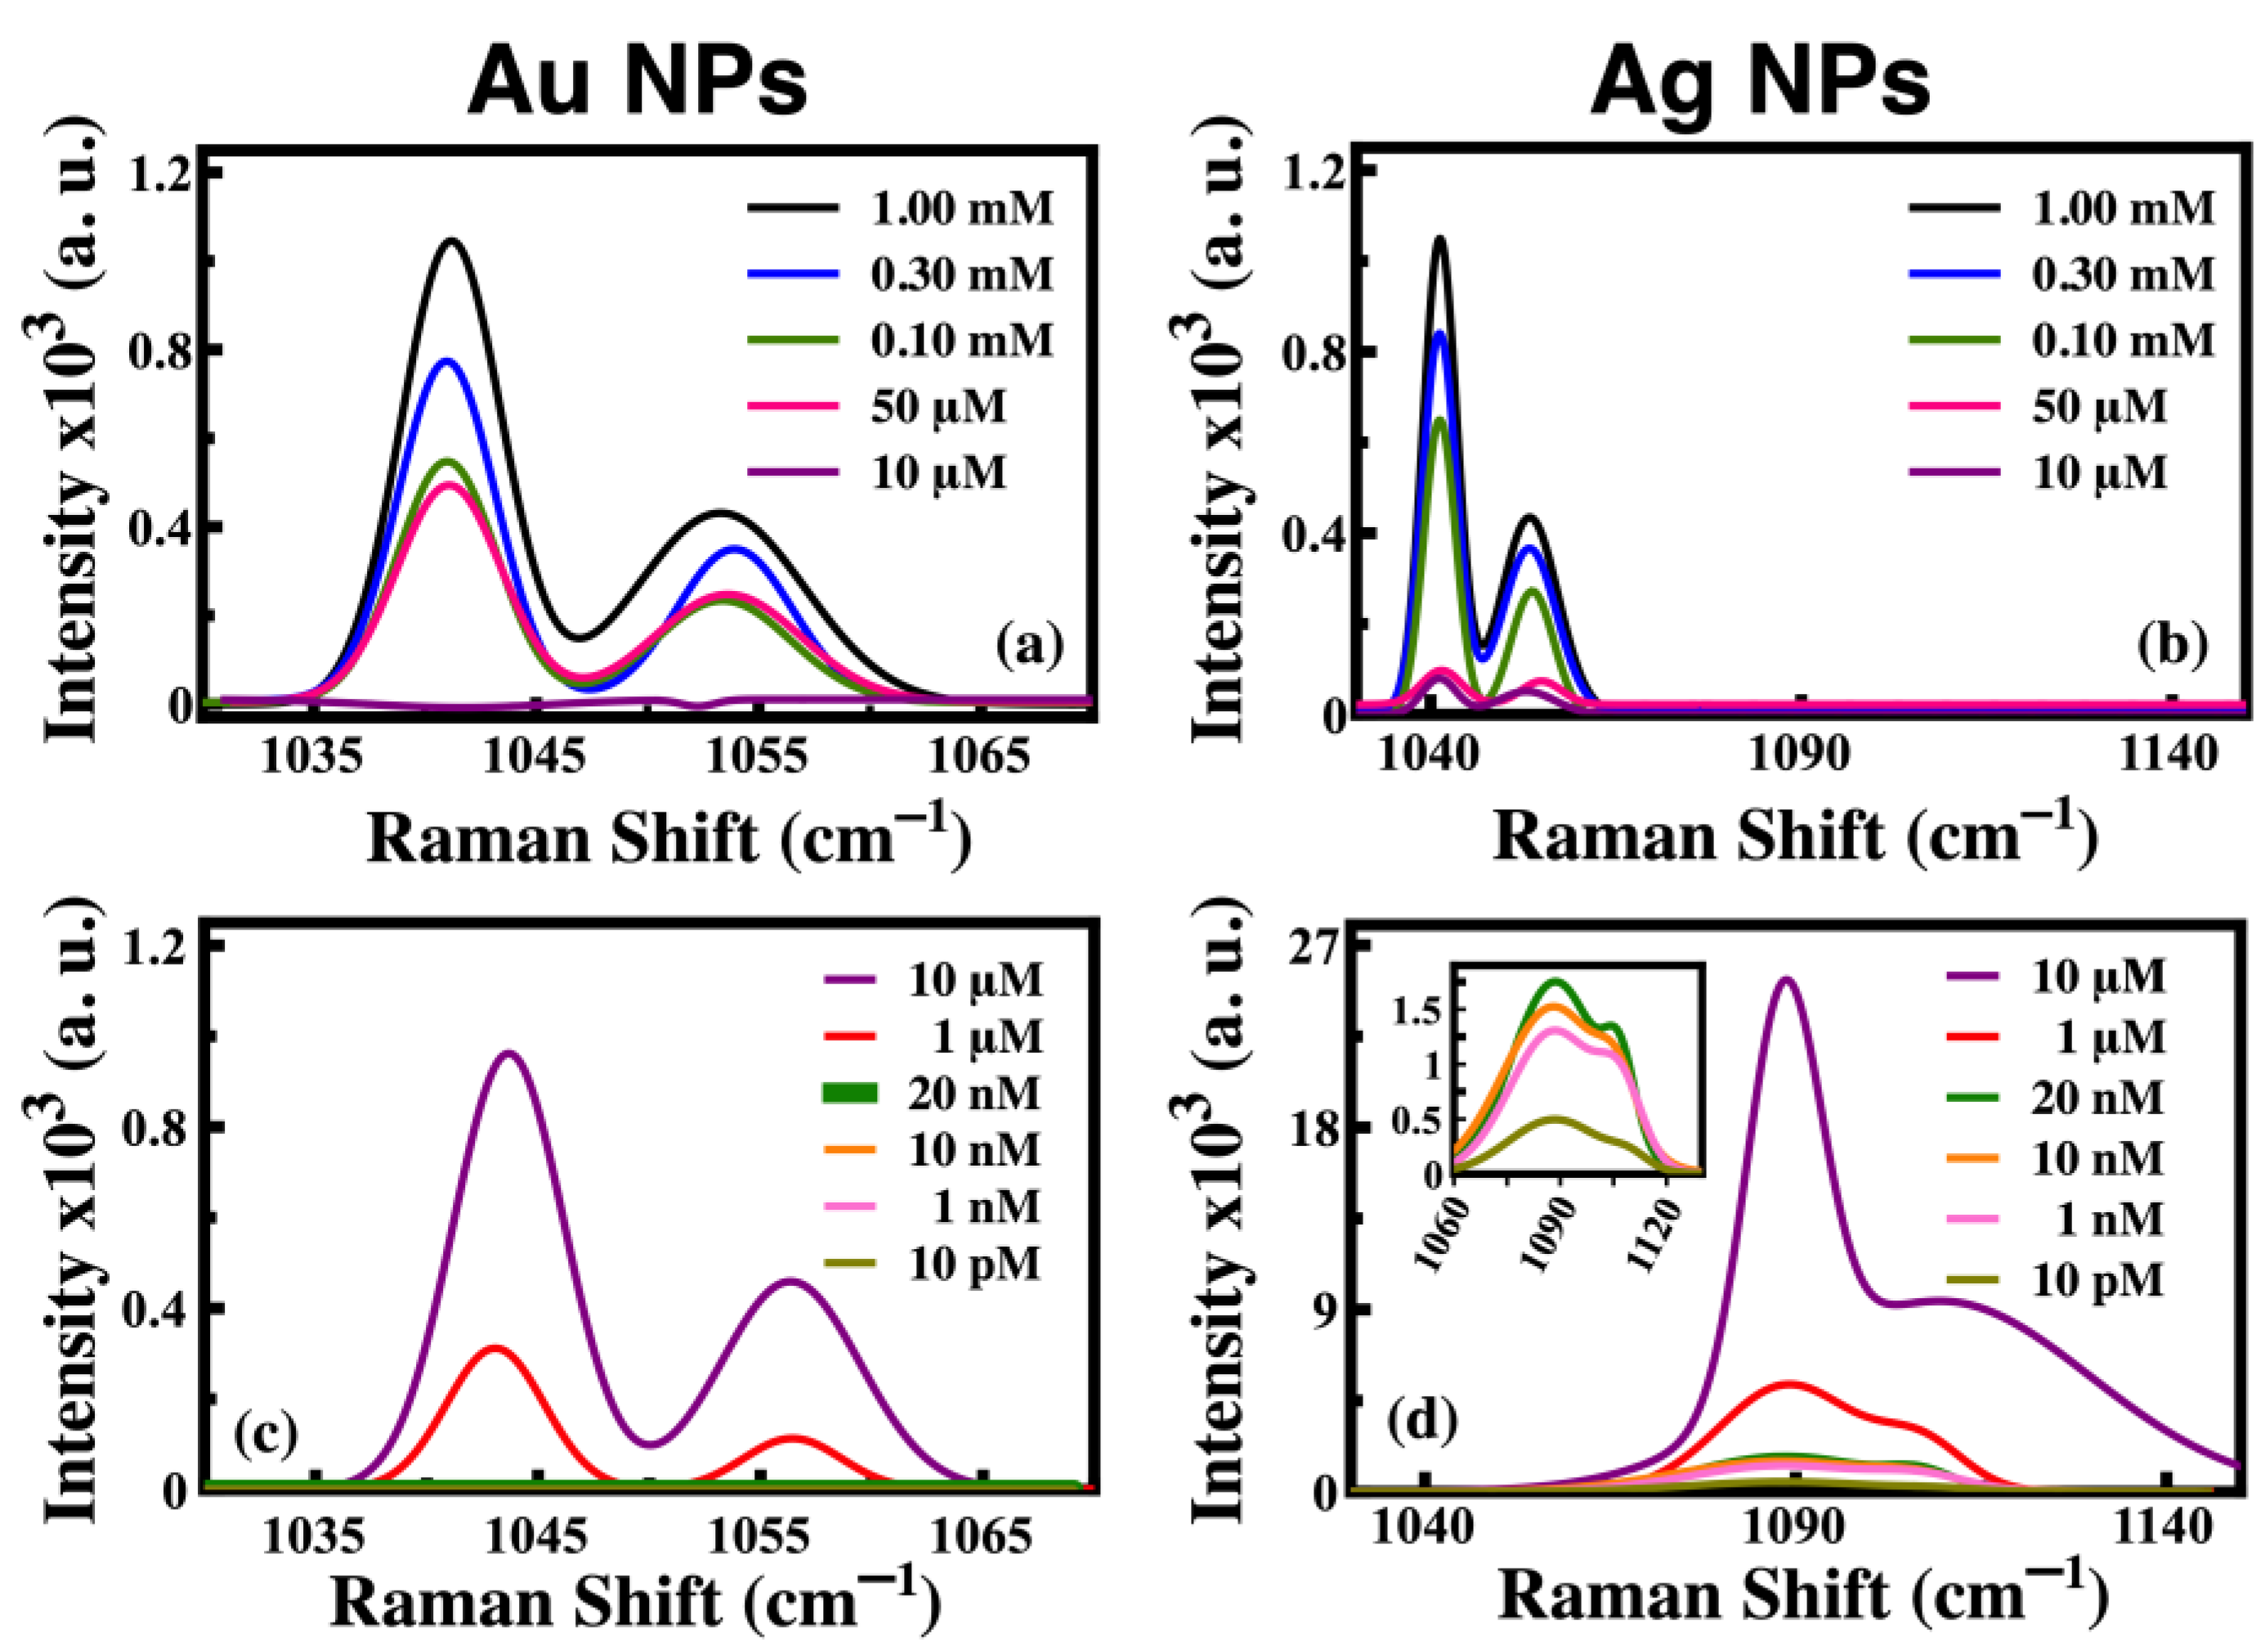
SS fabricated with VNP = 50 μL of Au or Ag NPs are suitable for sensing a T4 concentration of 50 μM (Figure 6 panels (a) and (b)). On the other hand, when a SS fabricated with a VNP = 250 μL is employed, the Raman signal is even more intense; consequently, lower T4 concentrations can be measured (panels (c) and (d) of Figure 6). The Ag SS offered a good performance since it detected a concentration of 10 pM. However, with Au, the lowest T4 concentration detected was 1 μM. A larger VNP means more metal NPs on the SW substrate; therefore, a larger signal intensity is expected because more T4 molecules would be in close vicinity to the plasmonic surfaces.
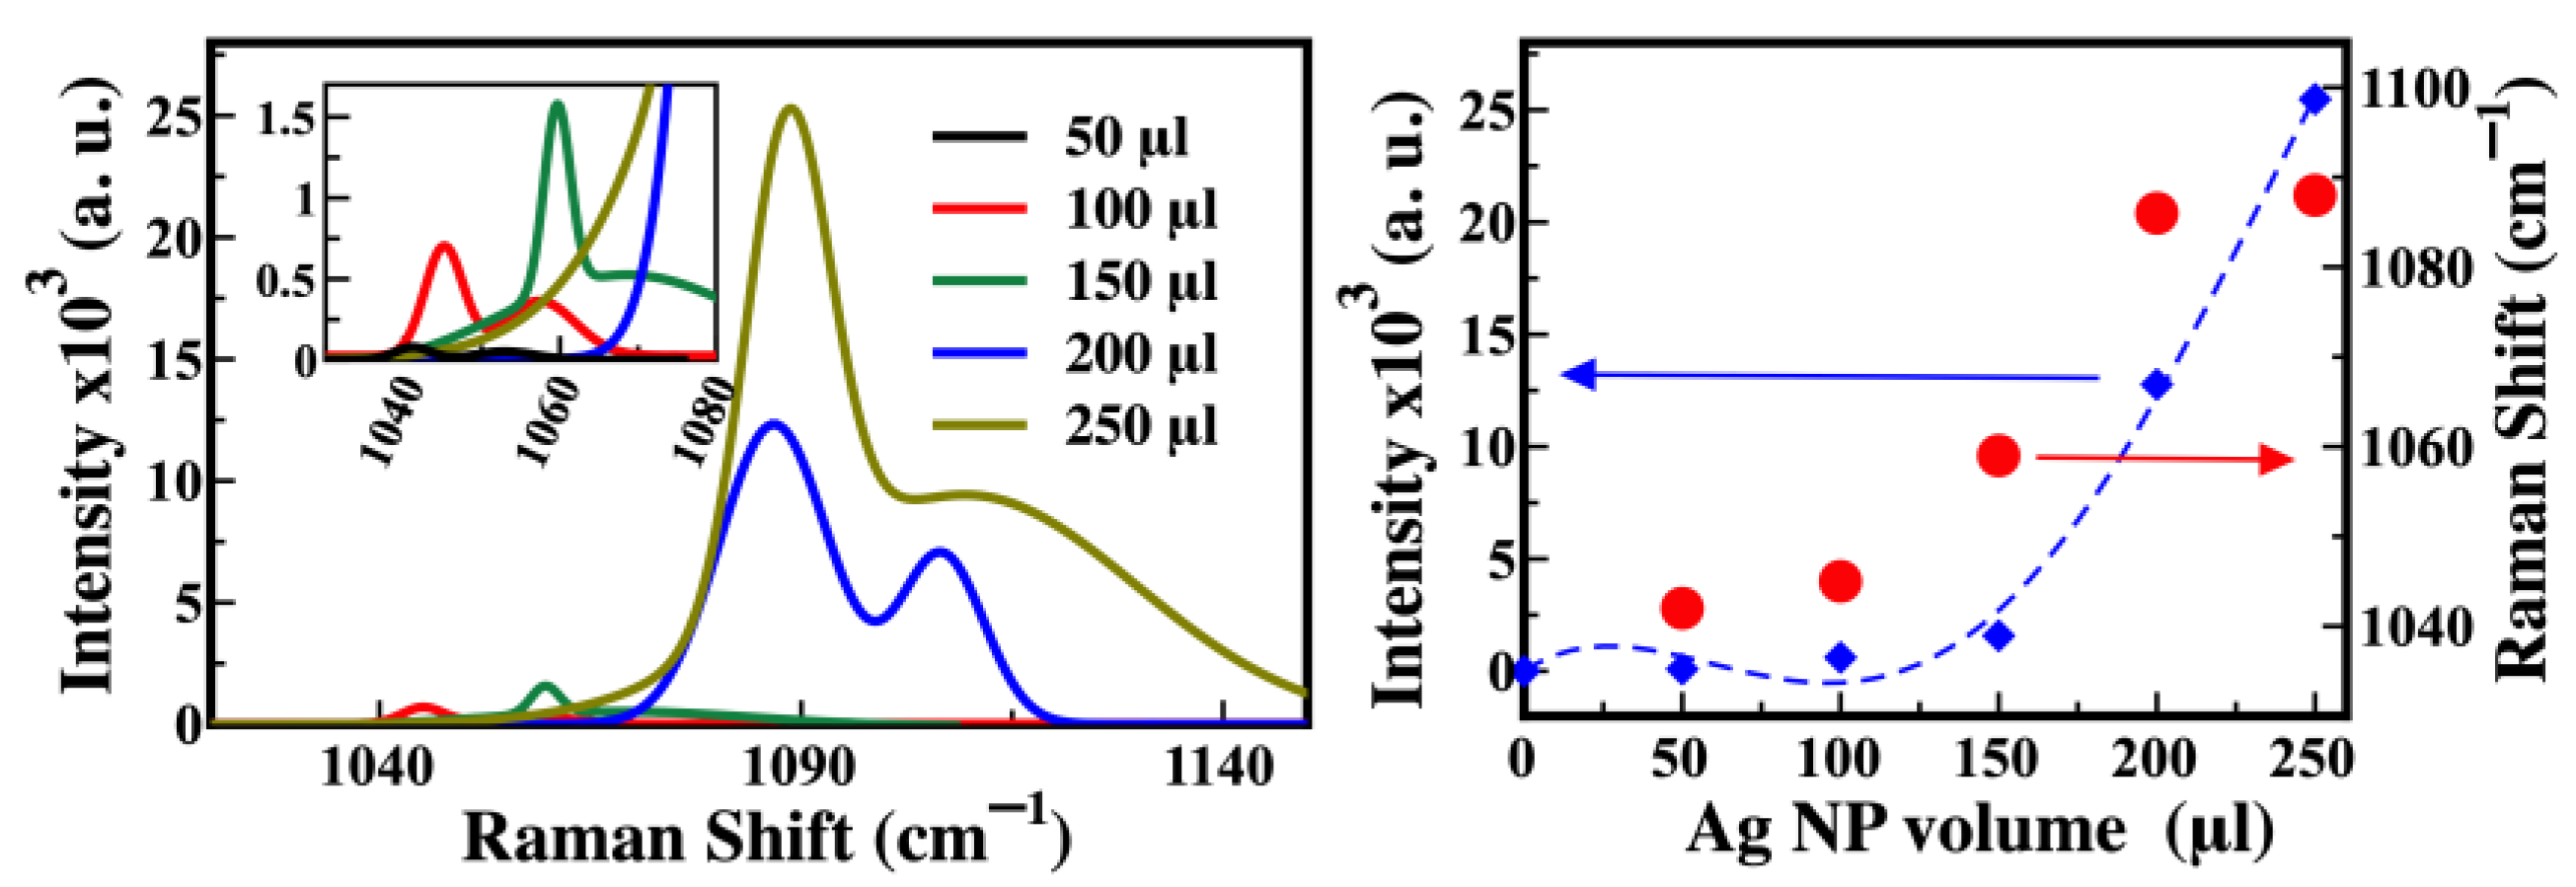
In general, for a VNP of fixed Au and Ag (see panels (a) and (b) or (c) and (d) of Figure 6), the intensity of the chosen band decreases and its position is unaltered as the T4 concentration decreases (note that the band at 1050 cm−1 changes in intensity and position for a fixed VNP). However, the position of the band is affected when the number of NPs on the silicon substrate changes; in other words, when VNP changes, a frequency or wavenumber shift in SERS is promoted: Compare panel (a) with (c) or (b) with (d). Noticeably, while the shift for the Au SS is imperceptible (about 2–3 cm−1), the shift for Ag SS reaches tens of cm−1. Particularly, the Ag SS with a low NP volume (VNP = 50 μL) has a band around 1042 cm−1, for all high T4 concentrations. However, that band is displaced towards larger wave numbers (1088 cm−1) for the Ag SS with a high NP volume (VNP = 250 μL), for all low T4 concentrations.
To elucidate the origin of the wavenumber shift in the SERS; we fixed the T4 concentration at 10 μM and varied VNP from 50 μL to 250 μL. In Figure 7, we present the Raman spectra of T4 measured on SW using different NP volumes. As the VNP increases, the band at 1042 cm−1 moves toward the larger wave numbers (red dots in the right panel of Figure 7). Probably, the SERS frequency shift originates from the structural deformation of the analyte, as a consequence of the binding events because the loading of plasmonic nanoparticles increases, in addition to the possible charge transfer between the tannic acid functionalized Ag NP and the T4, or vice versa. Our assumptions are based on a similar frequency shift in SERS as observed in the other systems [58,59,60,61,62]. On the other hand, the best fit to the intensity-VNP relation (blue diamonds in the right panel of Figure 7) is a fourth-degree polynomial expressed by I   ( V N P ) = 2.87 × 10 5   V N P 4 + 0.02   V N P 3     2.40   V N P 2 + 94.25 .
Next, to determine SERS-EF, the following equation was used:
SERS-EF = ( I SERS · N Raman ) ( I Raman · N SERS ) ,
ISERS and IRaman are the Raman band intensities of the T4 supported on a SS and a nude SW (without the metal NPs), respectively. NRaman and NSERS are the excited T4 molecules on the SW without and with metal NPs, respectively. NRaman and NSERS were determined by considering the area occupied by each molecule (see Figure S4 in ESM), the number of molecules within the laser spot area (12.5 × 10⁷ nm2), and in the case of SS, the number of molecules on the metal NPs (see Tables S1 and S2 in ESM). It is relevant to mention that a 3 nm thick layer of T4 was considered on the surface of the NPs because the intensity of the electric field begins to decrease remarkably for distances beyond 3 nm from the metal surface (see Figure S5 in ESM).
We focused on the band intensity at 1044 cm−1 to estimate the SERS-EF using Equation (1) for the different T4 concentrations. Table 1 contains the IRaman, ISERS, NRaman, NSERS, and SERS-EF for each concentration and each metal SS. The T4 concentration was varied between 1 mM and 1 pM. The first six lowest T4 concentrations were tested on the VNP = 250 μL SS. The last five highest T4 concentrations were tested on the VNP = 50 μL SS. For all SS, the SERS-EF behaved according to the T4 concentration. However, the Ag NP SS demonstrated a larger sensitivity than the Au NP SS. The minimum concentration detected using Au was 1 μM, whereas with Ag, it was 10 pM. The detected value with the Ag SERS platform was well below the indicative values of a healthy human body ( 64 nM [63]); therefore, the visualization of this platform is a candidate for detecting hypothyroidism issues.
As a general behavior, SERS-EF follows an increasing trend as the T4 concentration increases, see Figure 8. In the case of the Au and Ag 50 μL SS, a linear fitting with a correlation coefficient of 0.96 for Au and 0.99 for Ag was obtained (Figure 8a). Furthermore, using the Ag SS, a higher SERS-EF is reached compared to Au SS, which was verified by comparing the slope values. A logarithmic scale is shown in Figure 8b to appreciate the behavior of SERS-EF since it diminishes by orders of magnitude as the concentration decreases.
In the case of the Au 250 μL SS, the SERS-EF for analyte concentrations from 10 μM to 1 μM did not result in great variations when the estimated values went from 5.08 × 10¹⁰ to 1.65 × 10¹⁰ (see Table 1, shaded files). For lower concentrations, the signal was so weak that a trace was impossible.
On the other hand, with the Ag 250 μL SS, it was feasible to track the intensity for T4 concentrations from 10 μM to 10 pM, as it was accompanied by a decrease in the SERS-EF changes from 1011 to 109 (see Table 1 and Figure 8c). The best fitting for the relationship Log10(SERS-EF) vs. T4 concentration is a second-order polynomial with a correlation coefficient of 0.99.
The results indicate that our Ag SERS platform is more sensitive to detecting T4 than other techniques based on chromatography and mass spectroscopy [13]. For example, Luna et al. reported a LOD of 260 pM. Recently, Karami and colleagues used magnetic nanoparticles, electrochemical methods, and immunoassay analysis to reach a LOD of 3 pM for T4 [20]. Although their sensitivity is similar to that of our platform, their methodology is more complex. On the other hand, Orlov et al. reported FT4 detection by using magnetic NPs and immunoassays with a LOD of 20 fM [16]. Their work motivates us and the next step in our research is to optimize the Ag SS with a suitable VNP to get the maximum SERS-EF, expecting to reach a LOD of fM orders.
In the case of SS with VNP = 50 μL, single NPs far away one each other, quasi-spherical clusters made with few NPs, and semi-linear arrays of NPs in random orientations are observed on the SW surface (see SEM images of Figure 2). Then, the SERS-EF, determined indirectly by experimental measurement, is an average of the SERS-EF promoted by each configuration. We numerically estimated the SERS-EF of some configurations under an excitation wavelength equal to that of the SERS experiments.
For the determination of the SERS-EF, we used the approximation of |E|4 provided by the following equation:
SERS-EF | E loc ( ω exc ) | 2 | E inc | 2 | E loc ( ω Raman ) | 2 | E inc | 2 | E loc ( ω exc ) | 4 | E inc | 4 ,
where E loc and E inc are the local and incident electric fields, respectively, evaluated at the position where the molecule stands. ω exc is the excitation frequency and ω Raman is the Stokes shift Raman frequency of the molecule [26].
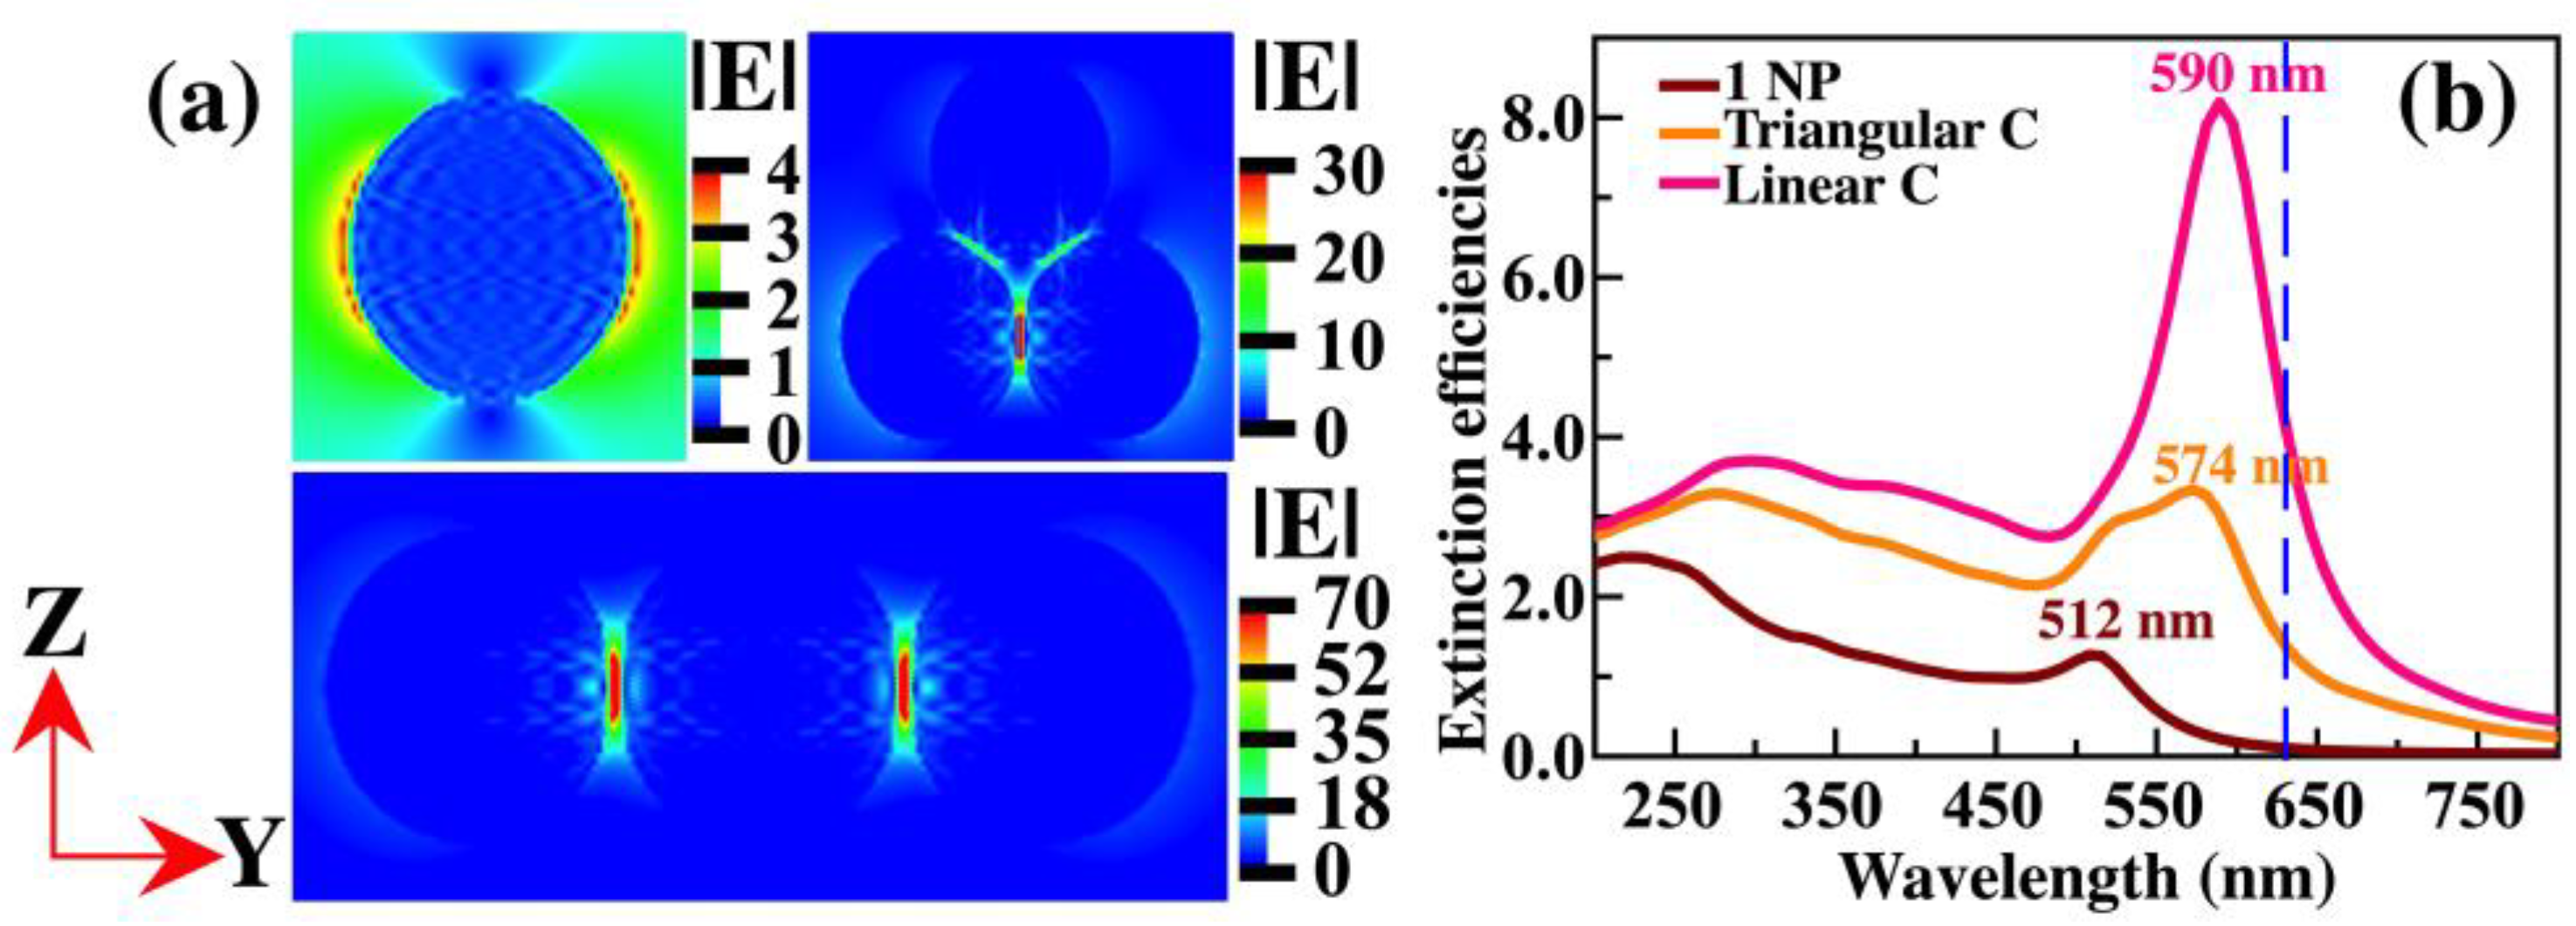
Figure 9a shows near-electric field images of a single NP, a triangular cluster, and three NPs aligned. For an isolated Au NP, the hot spots near its surface contributed to an enhancement factor of 5.2 × 10². In the case of the triangular agglomerate, the hot spot is located between the two NPs whose equator is parallel to the Y-axis; its SERS-EF is around 8.1 × 10⁵. However, when the three Au NPs are aligned, the hot spots are in the interparticle gaps with a SERS-EF of 2.4 × 10⁷. The optical band of a single Au NP is at 512 nm, while the triangular cluster and linear agglomerate optical band are located at 574 and 590 nm, respectively (Figure 9b). The excitation wavelength has been indicated with a dashed line. The silicon substrate effect has not been considered, if so, the spectra would be red-shifted compared to those observed in Figure 9b. Then, an in-resonance condition is almost fulfilled. D.D. Li et al. [64] studied the optical efficiency of linear and non-linear agglomerates of 20 nm Au NPs. They found that the linear agglomerates present two surface plasmon resonances, one longitudinal and one transverse, while the quasi-spherical agglomerates present a very broad principal resonance. Our results are well matched with those. In our case, the incident wave has a polarization state in the Y-axis (parallel to the equator of the NPs), which prefers the longitudinal plasmon band, meaning that the transverse plasmon band is not appreciated.
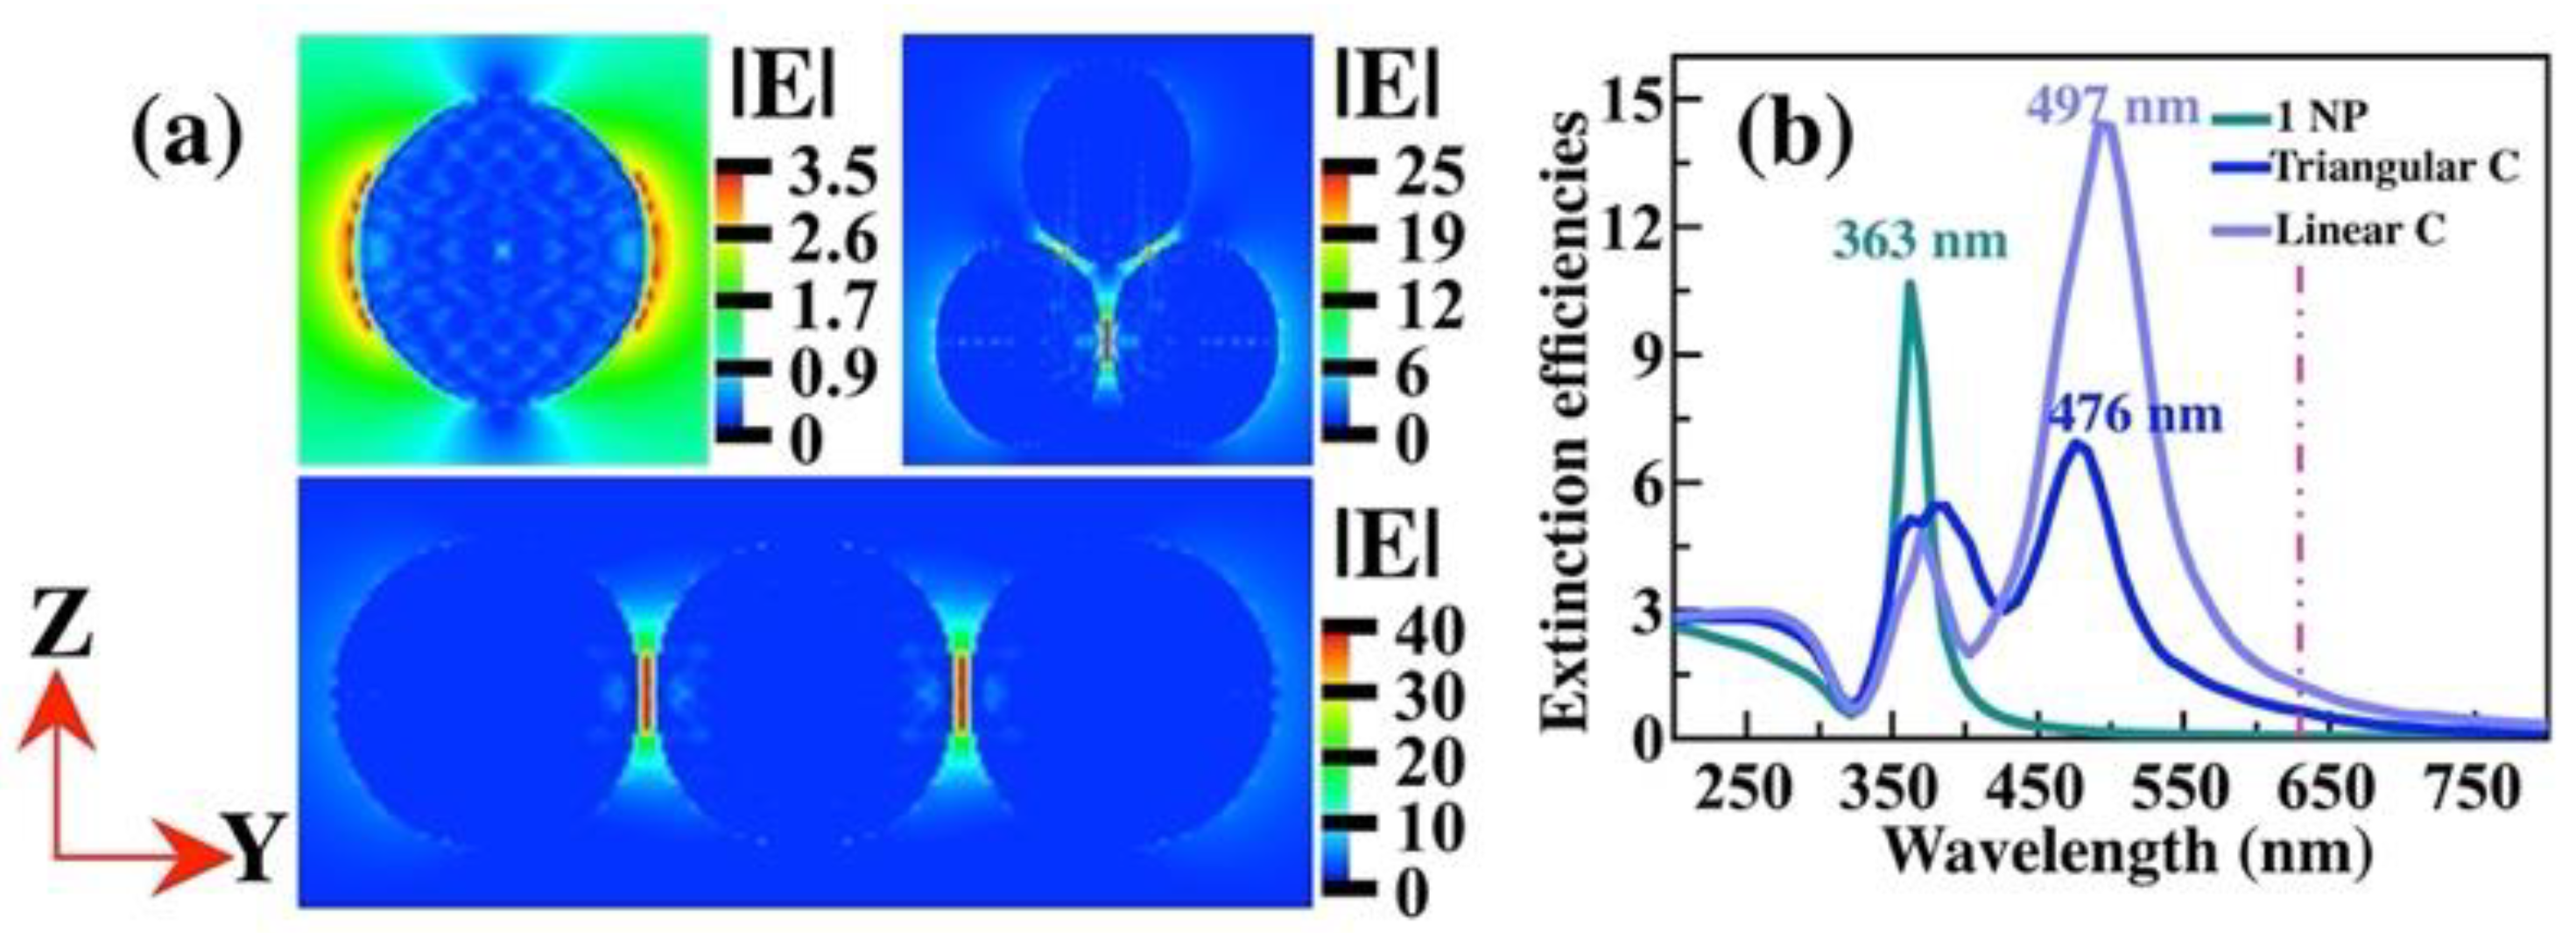
In the case of Ag NPs, the image of the electric field magnitude (Figure 10a) is very similar to that of the Au NPs, except that the scale is different. The SERS-EF in the hot spots is about 1.5 × 10², 3.9 × 10⁵, and 2.5 × 10⁶ for the single NP, triangular cluster, and linear array, respectively. The orders of magnitude are similar to those obtained by Au. The plasmonic bands of all three configurations are shown in Figure 10b. We observed that all three systems when in air, are out-of-resonance at an excitation wavelength of 632 nm. However, a red-shift in the spectrum is expected when the silicon substrate is included in the simulations, thereby making it closer to the in-resonance condition.

4. Conclusions

In this work, we synthesized functional Au and Ag NPs with ascorbic and tannic acid, respectively. They have a spherical shape and a diameter of about 50 nm. They were deposited on silicon wafers and tested as SERS substrates (SS) for T4 detection. SS were fabricated with different loads of metal NPs, i.e., with volume concentrations (VNPs) from 50 μL (3 mM) to 250 μL.
We focused on the T4 band at 1044 cm−1 and tracked its intensity and position at concentrations from 10 pM to 1 mM. For all SS, the band intensity decreases as the T4 concentration decreases. In the case of the Au SS with the highest load of NPs ((VNP = 250 μL), the minimum concentration detected was 1 μM. The Ag NP SS with the same load demonstrated a better performance by detecting a concentration of 10 pM. Therefore, our label-free Ag NP SS visualization can be used as a candidate to detect hypothyroidism or other health issues, where detection at low concentrations is a requirement. In the next stage of our research, an optimization study to determine the suitable VNP to get the highest SERS signal is on the list of things to do.
On the other hand, for a fixed T4 concentration (1 μM), a wave number shift in SERS is observed as the load of NPs increases. Particularly, when the Ag SS with the minimum (VNP = 50 μL) and maximum (VNP = 250 μL) load of NPs were implemented, the band at 1044 cm−1 shifted till 1088 cm−1, a shift of about 44 cm−1. In the case of the Au SS, the same band only shifted two to three cm−1. The shift could be originated, in part, by a possible charge transfer from the T4 molecule to the functionalized NP, or vice versa, in addition to T4 structural deformations as a consequence of binding events when the loading of plasmonic nanoparticles increases. However, further studies must be realized to confirm our assumptions.
The SERS enhancement factor was estimated from a detailed analysis that included the spatial distribution of NPs on the silicon wafer surface, the size of the T4 molecule, the number of excited molecules in Raman and SERS conditions, and other experimental factors. In the case of the Ag SS with 250 μL of NPs, a SERS-EF of 109 is suitable for detecting a T4 concentration of 10 pM.
For the SS with the lowest load of NPs, the spatial distribution of the NPs on the silicon wafer includes mainly single NPs, which are far away one each other, quasi-spherical clusters made with few NPs, and semi-linear arrays of NPs in random orientations. Then, we performed numerical simulations to determine the position and intensity of the hot spots at an excitation wavelength equal to the SERS experiment, 632 nm. We concluded that the hot spots at the interparticle gaps in a linear array of three NPs are more intense than for an isolated NP or a triangular cluster. Furthermore, from the calculation of the extinction efficiency, we can deduce that the Au NPs in the SS are in resonance at a wavelength of 632 nm. However, a resonance condition is not completely satisfied in Ag NP SS.
Finally, we believe the combination of our SERS platform and immunoassay analysis could be an interesting alternative to provide a method that offers good sensitivity and selectivity for point-of-care implementations.

Supplementary Materials

The following supporting information can be downloaded at: https://www.mdpi.com/article/10.3390/chemosensors11100516/s1, Figure S1: The left panel shows a SEM image of Ag NPs with a volume concentration (VNP) of 250 μL at ×160,000 magnification. The presence of the functionalizing agent (tannic acid) surrounding the Ag NPs is seen as a transparent layer. The right panel shows the Raman spectrum of Ag NPs; Figure S2: Absorbance spectra of the colloidal solution of Au NPs; Figure S3: The left panel shows the amount of Ag NPs deposited on a section of Si wafer with a volume of 50 μL. In the right panel, a volume of 250 μL of Ag NPs was used. For comparative purposes, an area of the wafer of the same size (2.7 μm × 3.6 μm) is shown in both panels. The area shown is smaller than the laser spot area (12.56 μm2); Figure S4: Image of the thyroxine molecule inside a rectangular prism; Figure S5: Near electric field intensity image of an Au NP of 50 nm of diameter and plot of the mean |E|4 with increasing distance from the Au NP surface; Figure S6: SEM micrograph at a magnification of ×15,000 of the SERS substrate of (a) Au NPs and (b) Ag NPs; Table S1: Molecule concentration of T4, the total number of molecules in each T4 solution concentration, number of molecule-layers on the Si wafer, and the total thickness of the multi-layer array, and NRaman value; Table S2: Values used to estimate the total metal area occupied by the NP that is under the laser spot.

Author Contributions

Conceptualization, E.S.-M. and A.L.G.; methodology, E.S.-M. and A.L.G.; numerical simulation, P.D.L.P. and A.L.G.; validation, P.D.L.P., E.S.-M. and A.L.G.; formal analysis, P.D.L.P., E.S.-M. and A.L.G.; investigation, P.D.L.P., E.S.-M. and A.L.G.; resources, E.S.-M. and A.L.G.; writing—original draft preparation, P.D.L.P. and A.L.G.; writing—review and editing, P.D.L.P., E.S.-M. and A.L.G.; funding acquisition, E.S.-M. and A.L.G. All authors have read and agreed to the published version of the manuscript.

Funding

This research was funded by Vicerrectoría de Investigación y Estudios de Posgrado, Benemérita Universidad Autónoma de Puebla, grant number 100504244-VIEP2023 and 100409188-VIEP2023.

Institutional Review Board Statement

Not applicable.

Informed Consent Statement

Not applicable.

Data Availability Statement

The original data presented in this study are available by further request to any of the authors.

Acknowledgments

P. de León thanks CONACYT for the doctorate student grant No. 330633 and the postdoctoral fellowship. A. L. González and E. Sanchez-Mora thank the VIEP-BUAP for the financial support.

Conflicts of Interest

The authors declare no conflict of interest.

References

  1. Hiller-Sturmhöfel, S.; Bartke, A. The endocrine system: An overview. Alcohol Health Res. World 1998, 22, 153–164. [Google Scholar]
  2. Silva, J.F.; Ocarino, N.M.; Serakides, R. Thyroid hormones and female reproduction. Biol. Reprod. 2018, 99, 907–921. [Google Scholar] [CrossRef]
  3. Shokripour, M.; Imanieh, M.H.; Garayemi, S.; Omidifar, N.; Shirazi Yeganeh, B.; Althabhawee, F. Thyroid stimulating hormone, T3 and T4 population-based reference range and children prevalence of thyroid dysfunction: First report from South of Iran. Iran J. Pathol. 2022, 17, 427–434. [Google Scholar] [CrossRef] [PubMed]
  4. Thumvijit, T.; Supawat, B.; Wattanapongpitak, S.; Kothan, S.; Tungjai, M. Effect of iodinated radiographic contrast media on radioimmunoassay for measuring thyroid hormones. Appl. Radiat. Isot. 2022, 185, 110261. [Google Scholar] [CrossRef]
  5. UCLA. Health Endocrine Surgery Normal Thyroid Hormone LEVELS. Available online: https://www.uclahealth.org/medical-services/surgery/endocrine-surgery/conditions-treated/thyroid/normal-thyroid-hormone-levels (accessed on 10 July 2023).
  6. Martino, E.; Bambini, G.; Bartalena, L.; Mammoli, C.; Aghni-Lombardi, F.; Baschierli, L.; Pinchera, A. Human serum thyrotrophin measurement by ultrasensitive immunoradiometric assay as a first-line test in the evaluation of thyroid function. Clin. Endocrinol. 1986, 24, 141–148. [Google Scholar] [CrossRef]
  7. Fritz, K.S.; Wilcox, R.B.; Nelson, J.C. A Direct free thyroxine (T4) immunoassay with the characteristics of a total T4 immunoassay. Clin. Chem. 2007, 53, 911–915. [Google Scholar] [CrossRef] [PubMed]
  8. Ross, D.S. Serum thyroid-stimulating hormone measurement for assessment of thyroid function and disease. Endocrinol. Metab. Clin. N. Am. 2001, 30, 245–264. [Google Scholar] [CrossRef] [PubMed]
  9. Maes, M.; Meltzer, H.Y.; Cisyns, P.; Suy, E.; Schotte, C. An evaluation of basal hypothalamic-pituitary-thyroid axis function in depression: Results of a large-scaled and controlled study. Psychoneuroendocrinology 1993, 18, 607–620. [Google Scholar] [CrossRef] [PubMed]
  10. Neu, V.; Bielow, C.; Gostomski, I.; Wintringer, R.; Braun, R.; Reinert, K.; Schneider, P.; Stuppner, H.; Huber, C.G. Rapid and comprehensive impurity profiling of synthetic thyroxine by ultrahigh-performance liquid chromatography−high-resolution mass spectrometry. Anal. Chem. 2013, 85, 3309–3317. [Google Scholar] [CrossRef]
  11. Ackermans, M.T.; Klieverik, L.P.; Ringeling, P.; Endert, E.; Kalsbeek, A.; Fliers, E. An online solid-phase extraction–liquid chromatography–tandem mass spectrometry method to study the presence of thyronamines in plasma and tissue and their putative conversion from 13C6-thyroxine. J. Endocrinol. 2010, 206, 327–334. [Google Scholar] [CrossRef]
  12. Ackermans, M.T.; Kettelarij-Haas, Y.; Boelen, A.; Endert, E. Determination of thyroid hormones and their metabolites in tissue using SPE UPLC-tandem MS. Biomed. Chromatogr. 2012, 26, 485–490. [Google Scholar] [CrossRef] [PubMed]
  13. Luna, L.G.; Coady, K.; McFadden, J.R.; Markham, D.A.; Bartels, M.J. Quantification of total thyroxine in plasma from xenopus laevis. J. Anal. Toxicol. 2013, 37, 326–336. [Google Scholar] [CrossRef] [PubMed]
  14. Kunisue, T.; Fisher, J.W.; Fatuyi, B.; Kannan, K. A method for the analysis of six thyroid hormones in thyroid gland by liquid chromatography–tandem mass spectrometry. J. Chromatogr. B 2010, 878, 1725–1730. [Google Scholar] [CrossRef] [PubMed]
  15. Kunisue, T.; Fisher, J.W.; Fatuyi, B.; Kannan, K. Determination of six thyroid hormones in the brain and thyroid gland using isotope-dilution liquid Chromatography/Tandem Mass Spectrometry. Anal. Chem. 2011, 83, 417–424. [Google Scholar] [CrossRef] [PubMed]
  16. Orlov, A.V.; Znoyko, S.L.; Pushkarev, A.V.; Mochalova, E.N.; Guteneva, N.V.; Lunin, A.V.; Nikitin, M.P.; Nikitin, P.I. Data on characterization and validation of assays for ultrasensitive quantitative detection of small molecules: Determination of free thyroxine with magnetic and interferometric methods. Data Br. 2018, 21, 1603–1611. [Google Scholar] [CrossRef]
  17. Bikkarolla, S.K.; McNamee, S.E.; Vance, P.; McLaughlin, J. High-sensitive detection and quantitative analysis of thyroid-stimulating hormone using gold-nanoshell-based lateral flow immunoassay device. Biosensors 2022, 12, 182. [Google Scholar] [CrossRef]
  18. Kim, K.; Han, D.K.; Choi, N.; Kim, S.H.; Joung, Y.; Kim, K.; Ho, N.T.; Joo, S.W.; Choo, J. Surface-enhanced Raman scattering-based dual-flow lateral flow assay sensor for the ultrasensitive detection of the thyroid-stimulating hormone. Anal. Chem. 2021, 93, 6673–6681. [Google Scholar] [CrossRef]
  19. David, M.; Serban, A.; Enache, T.E.; Florescu, M. Electrochemical quantification of levothyroxine at disposable screen-printed electrodes. J. Electroanal. Chem. 2022, 911, 116240. [Google Scholar] [CrossRef]
  20. Karim, P.; Gholamin, D.; Johari-Ahar, M. Electrochemical immunoassay for one-pot detection of thyroxin (T4) and thyroid-stimulating hormone (TSH) using magnetic and Janus nanoparticles. Anal. Bioanal. Chem. 2023, 415, 4741–4751. [Google Scholar] [CrossRef]
  21. Saxena, R.; Srivastava, S. A sensitive and one-step quantification of thyroid stimulating hormone using nanobiosensor. Mater. Today Proc. 2019, 18, 1351–1357. [Google Scholar] [CrossRef]
  22. Zheng, P.; Wu, L.; Raj, P.; Mizutani, T.; Szabo, M.; Hanson, W.A.; Barman, I. A dual-modal single-antibody plasmonic spectro-immunoassay for detection of small molecules. Small 2022, 18, 2200090. [Google Scholar] [CrossRef] [PubMed]
  23. Huang, Y.; Zhao, S.; Shi, M.; Liu, Y.M. Chemiluminescent immunoassay of thyroxine enhanced by microchip electrophoresis. Anal Biochem. 2010, 399, 72–77. [Google Scholar] [CrossRef]
  24. Mu, X.; Li, S.; Lu, X.; Zhao, S. CE with chemiluminescence detection for the determination of thyroxine in human serum. Electrophoresis 2014, 35, 962–966. [Google Scholar] [CrossRef]
  25. Mradula; Raj, R.; Devi, S.; Mishra, S. Antibody-labeled gold nanoparticles bases immunosensor for the detection of thyroxine hormone. Anal. Sci. 2019, 63, 799–806. [Google Scholar]
  26. Ru, E.L.; Etchegoin, P. Principles of Surface-Enhanced Raman Spectroscopy; Elsevier: Oxford, UK, 2009. [Google Scholar]
  27. Wang, Z.; Zong, S.; Wu, L.; Zhu, D.; Cui, Y. SERS-activated platforms for inmmunoassay: Probes, encoding methods, and applications. Chem. Rev. 2017, 117, 7910–7963. [Google Scholar] [CrossRef]
  28. Doering, W.E.; Piotti, M.E.; Natan, M.J.; Freeman, G. SERS as a foundation for nanoscale optically detected biological labels. Adv. Mater. 2007, 19, 3100–3108. [Google Scholar] [CrossRef]
  29. Liang, J.; Liu, H.; Lan, C.; Fu, Q.; Huang, C.; Luo, Z.; Jiang, T.; Tang, Y. Silver nanoparticles enhanced Raman scattering-based lateral flow immunoassays for ultra-sensitive detection of the heavy metal chromium. Nanotechnology 2014, 25, 495501. [Google Scholar] [CrossRef] [PubMed]
  30. Liang, X.; Miao, X.; Xiao, W.; Ye, Q.; Wang, S.; Lin, J.; Li, C.; Huang, Z. Filter-membrane-based ultrafiltration coupled with surface-enhanced Raman spectroscopy for potential differentiation of benign and malignant thyroid tumors from blood plasma. Int. J. Nanomed. 2020, 15, 2303–2314. [Google Scholar] [CrossRef]
  31. Wang, R.; Chon, H.; Lee, S.; Cheng, Z.; Hong, S.H.; Yoon, Y.H.; Choo, J. Highly sensitive detection of hormone estradiol E2 using SERS-based immunoassays for the clinical diagnosis of precocious puberty. ACS Appl. Mater. Interfaces 2016, 8, 10665–10672. [Google Scholar] [CrossRef] [PubMed]
  32. Choi, S.; Hwang, J.; Lee, S.; Lim, D.W.; Joo, H.; Choo, J. Quantitative analysis of thyroid.stimulating hotmone (TSH) using SERS-based lateral flow immunoassay. Sens. Actuators B Chem. 2017, 240, 358–364. [Google Scholar] [CrossRef]
  33. Kim, S.M.; Lee, T.; Gil, Y.G.; Kim, G.H.; Park, C.; Jang, H.; Min, J. Fabrication of bioprobe self-assembled on Au-Te nanoworm structure for SERS biosensor. Materials 2020, 13, 3234. [Google Scholar] [CrossRef]
  34. Majumdar, D.; Singha, A.; Mondal, P.; Kundu, S. DNA-mediated wirelike clusters of silver nanoparticles: An ultrasensitive SERS substrate. ACS Appl. Mater. Interfaces 2013, 5, 7798–7807. [Google Scholar] [CrossRef]
  35. Hong, S.; Li, X. Optimal size of gold nanoparticle for surface-enchanted Raman spectroscopy under different condition. J. Nanomater. 2013, 2013, 790323. [Google Scholar] [CrossRef]
  36. Duval Malinsky, M.; Kelly, K.L.; Schatz, G.C.; Van Duyne, R.P. Nanosphere lithography:  effect of substrate on the localized surface plasmon resonance spectrum of silver nanoparticles. J. Phys. Chem. B 2001, 105, 2343–2350. [Google Scholar] [CrossRef]
  37. De Teresa, J.M. Introduction to nanolithography techniques and their applications. In Nanofabrication. Nanolithography Techniques and Their Applications, 1st ed.; De Teresa, J.M., Ed.; Ebook: Bristol, UK, 2020; pp. 1-1–1-28. [Google Scholar]
  38. Dong, J.; Carpinone, P.L.; Pyrgiotakis, G.; Demokritou, P.; Moudgil, B.M. Synthesis of precision gold nanoparticles using turkevich method. Kona 2020, 37, 224–232. [Google Scholar] [CrossRef] [PubMed]
  39. Bastús, N.G.; Merkoçi, F.; Piella, J.; Puntes, V. Synthesis of highly monodisperse citrate-stabilized silver nanoparticles of up to 200 nm: Kinetic control and catalytic properties. Chem. Mater. 2014, 26, 2836–2846. [Google Scholar] [CrossRef]
  40. Bastús, N.G.; Comenge, J.; Puntes, V. Kinetically controlled seeded growth synthesis of citrate-stabilized gold nanoparticles of up to 200 nm: Size focusing versus Otswald Ripening. Langmuir 2011, 27, 11098–11105. [Google Scholar] [CrossRef]
  41. De Leon Portilla, P.; González, A.L.; Sanchez Mora, E. Theoretical and Experimental Study on the Functionalization Effect on the SERS Enhancement Factor of SiO2-Ag Composite Films; IntechOpen: London, UK, 2021; In Press. [Google Scholar] [CrossRef]
  42. Chen, X.H.; Li, A.G.; Cai, J.H.; Yang, J.; Tuo, M. Absorption spectrum of carbon nanotubes in the space. Sci. Sin.-Phys. Mech. Astron. 2022, 52, 119512. [Google Scholar]
  43. Romo-Herrera, J.M.; González, A.L.; Guerrini, L.; Castiello, F.R.; Alonso-Nuñez, G.; Contreras, O.E.; Alvarez-Puebla, R.A. A study of the depth and size of concave cube Au nanoparticles as highly sensitive SERS probes. Nanoscale 2016, 8, 7326–7333. [Google Scholar] [CrossRef]
  44. Konokhova, A.I.; Gelash, A.A.; Yurkin, M.A.; Chernyshev, A.V.; Maltsev, V.P. High-Precision Characterization of Individual E. coli Cell Morphology by Scanning Flow Cytometry. Cytometry A 2013, 83, 568–575. [Google Scholar] [CrossRef]
  45. Gienger, J.; Gross, H.; Ost, V.; Bär, M.; Neukammer, J. Assessment of deformation of human red blood cells in flow cytometry: Measurement and simulation of bimodal forward scatter distributions. Biomed. Opt. Express 2019, 10, 4531–4550. [Google Scholar] [CrossRef] [PubMed]
  46. Draine, B.T. Graphite Revisited. APJ 2016, 831, 109. [Google Scholar] [CrossRef]
  47. Purcell, E.M.; Pennypacker, C.R. Scattering and absorption of light by nonspherical dielectric grains. Astrophys. J. 1973, 186, 705–714. [Google Scholar] [CrossRef]
  48. Goodman, J.J.; Draine, B.T.; Flatau, P.J. Application of fast-fourier-transform techniques to the discrete-dipole approximation. Opt. Lett. 1991, 16, 1198–1200. [Google Scholar] [CrossRef] [PubMed]
  49. Kreibig, U. Electronic properties of small silver particles: The optical constants and their temperature dependence. J. Phys. F Met. Phys. 1974, 4, 999–1014. [Google Scholar] [CrossRef]
  50. Ziegler, C.; Eychmüller, A. Seeded growth synthesis of uniform gold nanoparticles with diameters of 15−300 nm. J. Phys. Chem. C 2011, 115, 4502–4506. [Google Scholar] [CrossRef]
  51. Njoki, P.N.; Lim, I.-I.S.; Mott, D.; Park, H.Y.; Khan, B.; Mishra, S.; Sujakumar, R.; Luo, J.; Zhong, C.J. Size correlation of optical and spectroscopic properties for gold nanoparticles. J. Phys. Chem. C 2007, 111, 14664–14669. [Google Scholar] [CrossRef]
  52. Espina, A.; Cañamares, M.V.; Juraseková, Z.; Sanchez-Cortes, S. Analysis of Iron Complexes of Tannic Acid and Other Related Polyphenols as Revealed by Spectroscopic Techniques: Implications in the Identification and Characterization of Iron Gall Inks in Historical Manuscripts. ACS Omega 2022, 7, 27937–27949. [Google Scholar] [CrossRef]
  53. Noguez, C.; Villagómez, C.J.; González, A.L. Plasmonics of multifaceted metallic nanoparticles, field enhancement, and TERS. Phys. Status Solidi B 2015, 252, 56–71. [Google Scholar] [CrossRef]
  54. Borah, M.M.; Devi, T.G. Vibrational studies of thyroxine hormone: Comparative study with quantum chemical calculations. J. Mol. Struct. 2017, 1148, 293–313. [Google Scholar] [CrossRef]
  55. Rizzon, R.V.K.; Ludwing, Z.M.C.; Modesto-Costa, L.; Ludwing, V. Thyroxine: A theoretical study of the vibrational and electronic properties. QUARKS Braz. Electron. J. Phys. Chem. Mat. Sci. 2020, 3, 31–40. [Google Scholar]
  56. Álvarez, R.M.; Della Védova, C.O.; Mack, H.G.; Farías, R.N.; Hilderbrandt, P. Raman spectroscopic study of the conformational changes of thyroxine induced by interactions with phospholipid. Eur. Biophys. J. 2002, 31, 448–453. [Google Scholar] [CrossRef] [PubMed]
  57. Mandak, V.; Gupta, S.K.; Jha, P.K.; Ovsyuk, N.N.; Kachurin, G.A. Low-frequency Raman scattering from Si/Ge nanocrystals in different matrixes caused by acoustic phonon quantization. J. Appl. Phys. 2012, 112, 054318. [Google Scholar]
  58. Lombardi, J.R.; Birke, R.L. A unified view of surface-enhanced Raman scattering. Acc. Chem. Res. 2009, 42, 734–742. [Google Scholar] [CrossRef]
  59. Kho, K.W.; Dinish, U.S.; Kumar, A.; Olivo, M. Frequency shifts in SERS for biosensing. ACS Nano 2012, 6, 4892–4902. [Google Scholar] [CrossRef]
  60. Wang, Y.; Yu, Z.; Ji, W.; Tanaka, Y.; Sui, H.; Zhao, B.; Ozaki, Y. Enantioselective discrimination of alcohols by hydrogen bonding: A SERS study. Angew. Chem. Int. Ed. 2014, 53, 13866–13870. [Google Scholar] [CrossRef]
  61. Zhang, X.; Liu, Y.; Soltani, M.; Li, P.; Zhao, B.; Cui, B. Probing the interfacial charge-transfer process of uniform ALD semiconductor-molecule-metal models: A SERS study. J. Phys. Chem. C 2017, 121, 26939–26948. [Google Scholar] [CrossRef]
  62. Ma, H.; Liu, S.; Zheng, N.; Liu, Y.; Han, X.X.; He, C.; Lu, H.; Zhao, B. Frequency shifts in surface-enhanced Raman spectroscopy-based immunoassays: Mechanistic insights and application in protein carbonylation detection. Anal. Chem. 2019, 91, 9376–9381. [Google Scholar] [CrossRef]
  63. Thermo Ficher Scientific. Thyroxine (T$) Competitive ELISA Kit. Available online: https://www.thermofisher.com/document-connect/document-connect.html?url=https://assets.thermofisher.com/TFS-Assets%2FLSG%2Fmanuals%2FEIAT4C_Thyroxine_Competitive_Rev1_31Jan2017_web.pdf (accessed on 10 July 2023).
  64. Li, D.D.; Timchenko, V.; Chan, Q.N.; Yuen, A.C.Y.; Yeoh, G.H. Study of morphology and optical properties of gold nanoparticle aggregates under different pH conditions. Langmui 2018, 34, 10340–10352. [Google Scholar] [CrossRef]
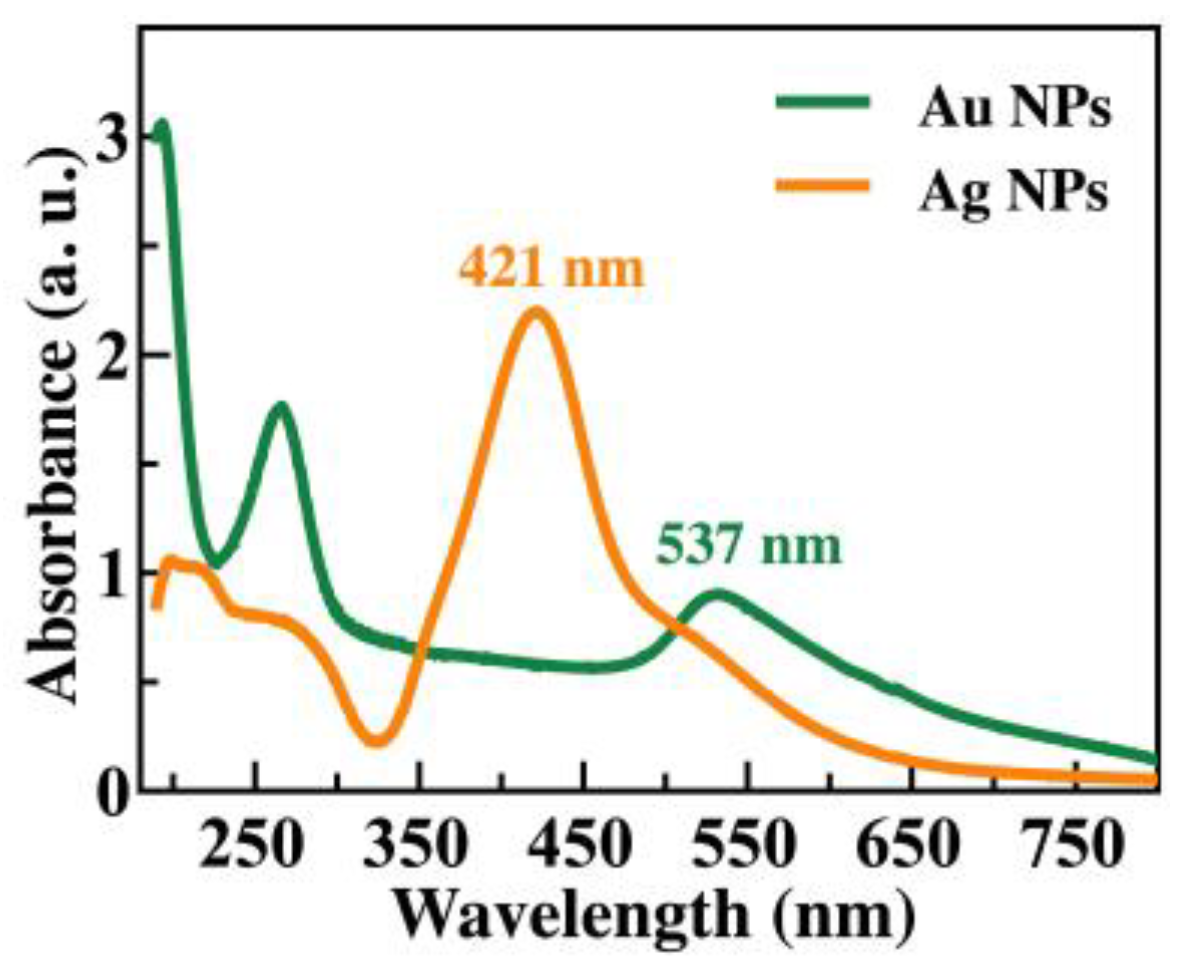
Figure 1. Position of the surface plasmon resonance of Au (green line) and Ag (orange line) NPs in colloidal solution. Bands below 300 nm are the outcome of electronic interband transitions and optical excitations of functionalizing molecules.
Chemosensors 11 00516 g001
Figure 2. (a) SEM micrograph and (b) size distribution of Au NPs supported on a silicon wafer. Whereas (c,d) correspond to Ag NPs. Here, a VNP = 50 μL was deposited on the SW.
Chemosensors 11 00516 g002
Figure 3. Raman spectrum of T4 crystals.
Chemosensors 11 00516 g003
Figure 4. Raman spectrum of (a) SW (black line), (b) T4 at a concentration of 1 mM dropped on a SW (red line), (c) Au NPs on a SW (purple line), (d) Ag NPs on a SW (green line), (e) T4 on Au NPs (blue line), and (f) T4 on Ag NPs (orange line). (e,f) Measured on a SW with the same T4 concentration as in (b). Here, the SS were prepared with a VNP = 50 μL (3 mM).
Chemosensors 11 00516 g004
Figure 5. Raman signal intensity of the silicon band at 520 cm−1 for a SW covered by different amounts of Ag NPs (VNP = 50, 100, 150, 200, and 250 μL). VNP = 0 μL represents a nude SW. The purple dots in the inset shows the relationship between the Si band intensity at 520 cm−1 and the VNP of Ag NPs.
Chemosensors 11 00516 g005
Figure 6. Raman spectra of the T4 bands, selected in this work, using Au and Ag as SS. T4 concentrations from pM to mM were monitored under an excitation wavelength of 632 nm. The Raman intensity shown in the upper panels was reached by using SS fabricated with VNP = 50 μL and in the lower panels with VNP = 250 μL.
Chemosensors 11 00516 g006
Figure 7. Measured Raman intensity of T4 molecules, at a fixed concentration of 10 μM, on various SS. Each SS is a SW with a specific Ag NP volume (VNP from 50 to 250 μL). As VNP increases, the band originated by stretching vibrations of C–O and C–N bonds is displaced from 1042 cm−1 to 1088 cm−1 (red dots in the right panel). Furthermore, its intensity increases, thereby obeying a fourth-degree polynomial relationship with VNP (blue diamonds and dashed blue line in the right panel).
Chemosensors 11 00516 g007
Figure 8. Plot of SERS-EF vs. T4 concentration (a) and Log10 (SERS-EF) vs. T4 concentration using NP SS with VNP = 50 μL (b), and with VNP = 250 μL (c).
Chemosensors 11 00516 g008
Figure 9. (a) Electric field magnitude and (b) extinction efficiency of a single NP, a triangular cluster of NPs, and three NPs aligned. All Au NPs are 50 nm in diameter; the surface-to-surface separation distance is 1 nm. The polarization state of the incident wave is parallel to the equator of the NPs (Y-axis) with a traveling direction along the X-axis. In all cases, the incident wavelength is 632 nm (position indicated with a dashed line), and air is the surrounding medium.
Chemosensors 11 00516 g009
Figure 10. (a) Electric field magnitude and (b) extinction efficiencies of a single NP, a triangular cluster of NPs, and three NPs aligned. All Ag NPs are 50 nm in diameter; the surface-to-surface separation distance is 1 nm. The polarization state of the incident wave is parallel to the equator of the NPs (Y axis) with a traveling direction along the X axis. In all cases, the incident wavelength is 632 nm (position indicated with a dashed line), and air is the surrounding medium.
Chemosensors 11 00516 g010
Table 1. IRaman, ISERS, NRaman, and NSERS, at different T4 concentrations with Au and Ag SS. SERS-EF was calculated using Equation (1) and intensities of the band 1044 cm−1. The first six lower T4 concentrations were tested on VNP = 250 μL SS. The last five higher T4 concentrations were tested on VNP = 50 μL SS.
Au NPs
T4 ConcentrationIRamanISERSNRamanNSERSSERS-EF
10 pM1116.23.06 × 10−85.29 × 10⁸
1 nM111.62 × 1033.06 × 10−65.29 × 10⁸
10 nM111.62 × 1043.06 × 10−55.29 × 10⁸
20 nM113.24 × 1046.13 × 10−55.29 × 10⁸
1 μM13121.62 × 1063.05 × 10−31.65 × 10¹⁰
10 μM19621.61 × 1073.05 × 10−15.08 × 10¹⁰
10 μM113.77 × 1062.56 × 1061.18 × 102
0.05 mM14781.88 × 1082.56 × 1061.20 × 104
0.10 mM15163.78 × 1082.56 × 1065.49 × 104
0.30 mM17391.13 × 1092.56 × 1062.68 × 105
1.00 mM110223.78 × 1092.56 × 1062.20 × 106
Ag NPs
T4 ConcentrationIRamanISERSNRamanNSERSSERS-EF
10 pM151816.23.38 × 10−72.48 × 10⁹
1 nM113181.62 × 1033.38 × 10−56.30 × 10⁹
10 nM115381.62 × 1043.38 × 10−47.35 × 10⁹
20 nM117873.24 × 1046.77 × 10−48.54 × 10⁹
1 μM154581.62 × 1063.38 × 10−22.61 × 10¹⁰
10 μM125,4811.61 × 1073.371.22 × 1011
10 μM1913.78 × 1078.99 × 1053.82 × 103
0.05 mM1791.88 × 1088.99 × 1051.66 × 104
0.10 mM16813.78 × 1088.99 × 1052.86 × 105
0.30 mM18701.13 × 1098.99 × 1051.10 × 106
1.00 mM110733.78 × 1098.99 × 1054.52 × 106
Disclaimer/Publisher’s Note: The statements, opinions and data contained in all publications are solely those of the individual author(s) and contributor(s) and not of MDPI and/or the editor(s). MDPI and/or the editor(s) disclaim responsibility for any injury to people or property resulting from any ideas, methods, instructions or products referred to in the content.