
Highly Sensitive Ethanol Sensing Using NiO Hollow Spheres Synthesized via Hydrothermal Method


Abstract
:1. Introduction
2. Experimental
2.1. Synthesis of NiO Hollow Spheres
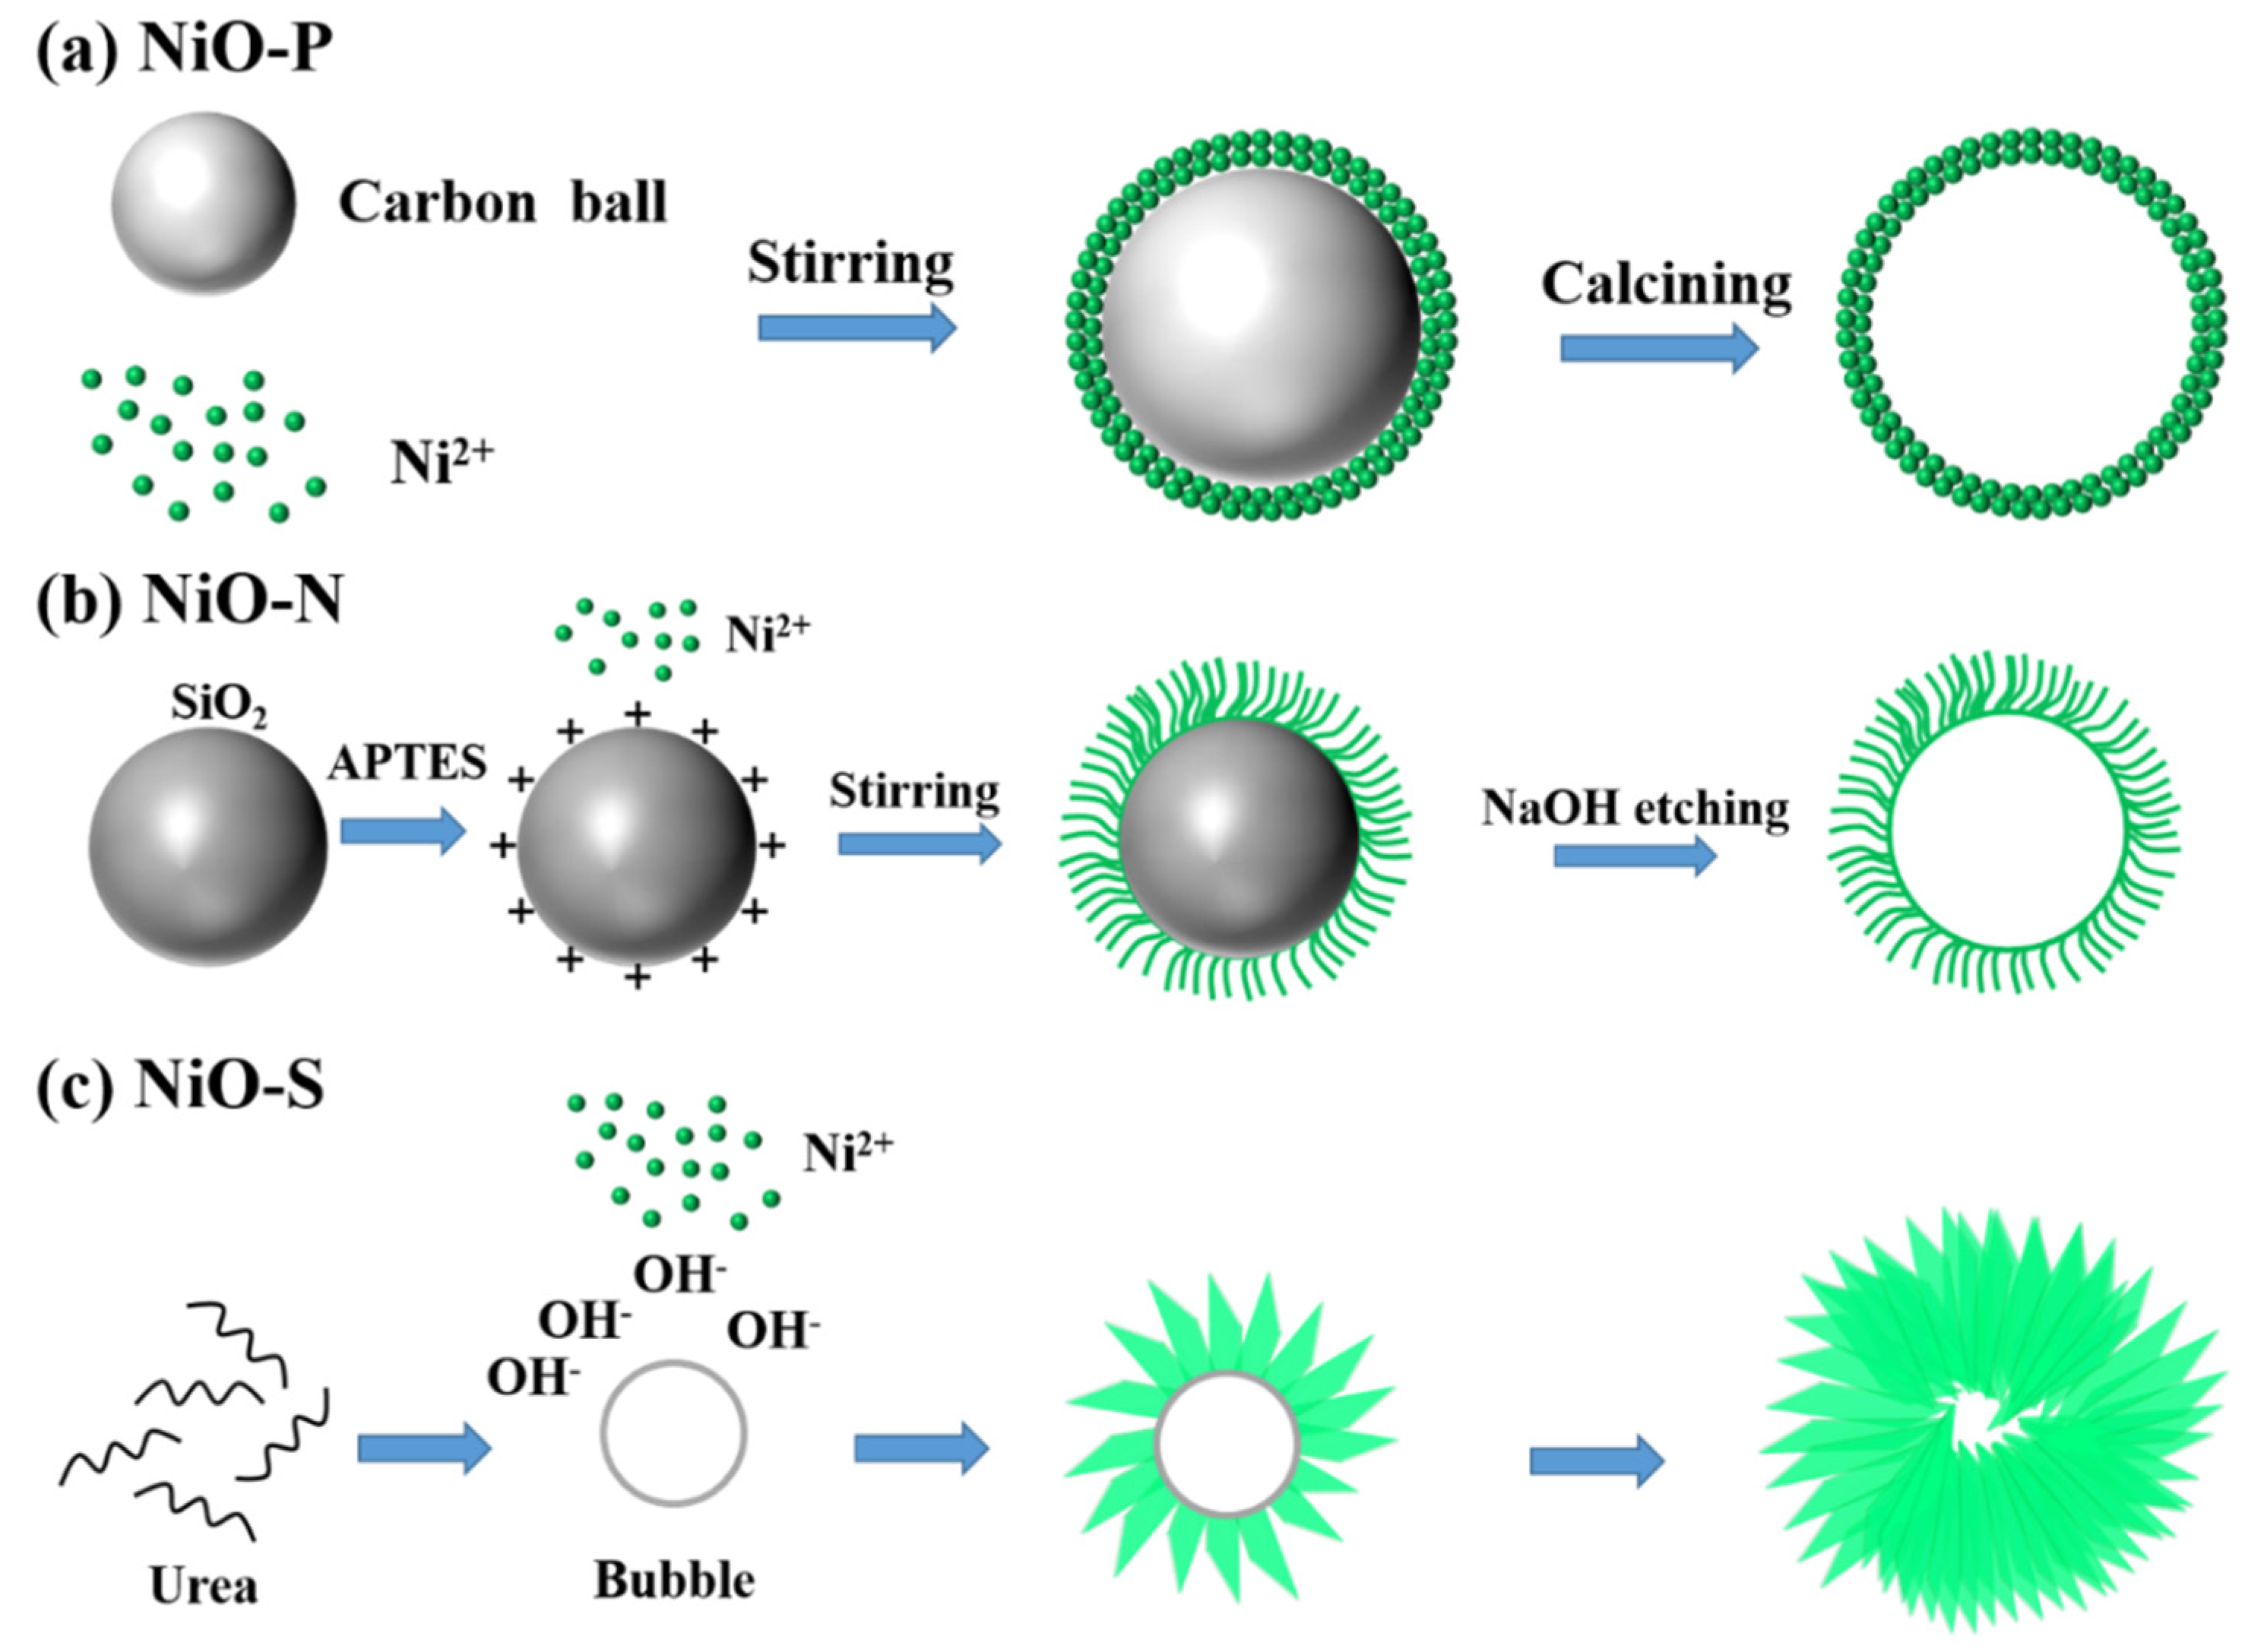
2.1.1. Synthesis of NiO-P
2.1.2. Synthesis of NiO-N
2.1.3. Synthesis of NiO-S
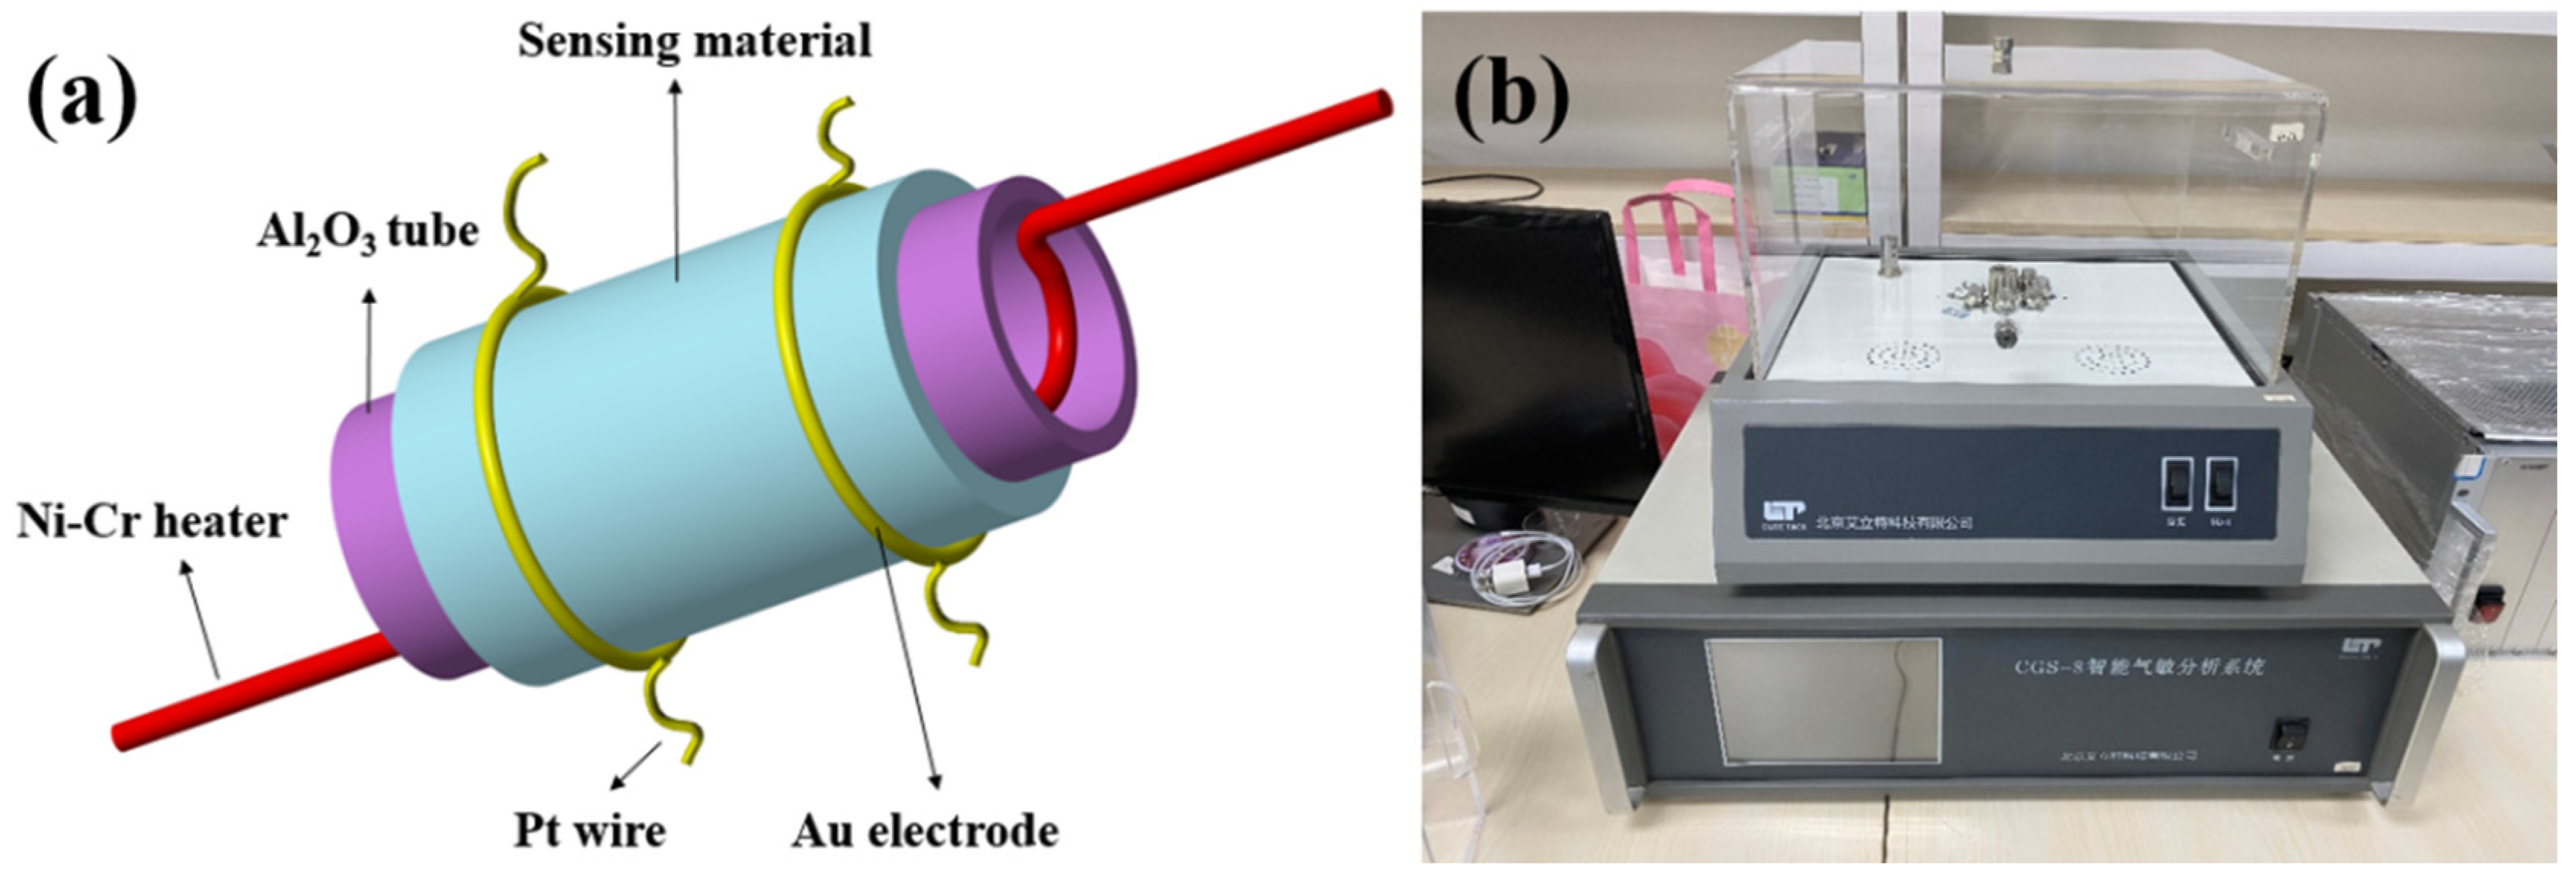
2.2. Characterization and Gas Sensor Measurement
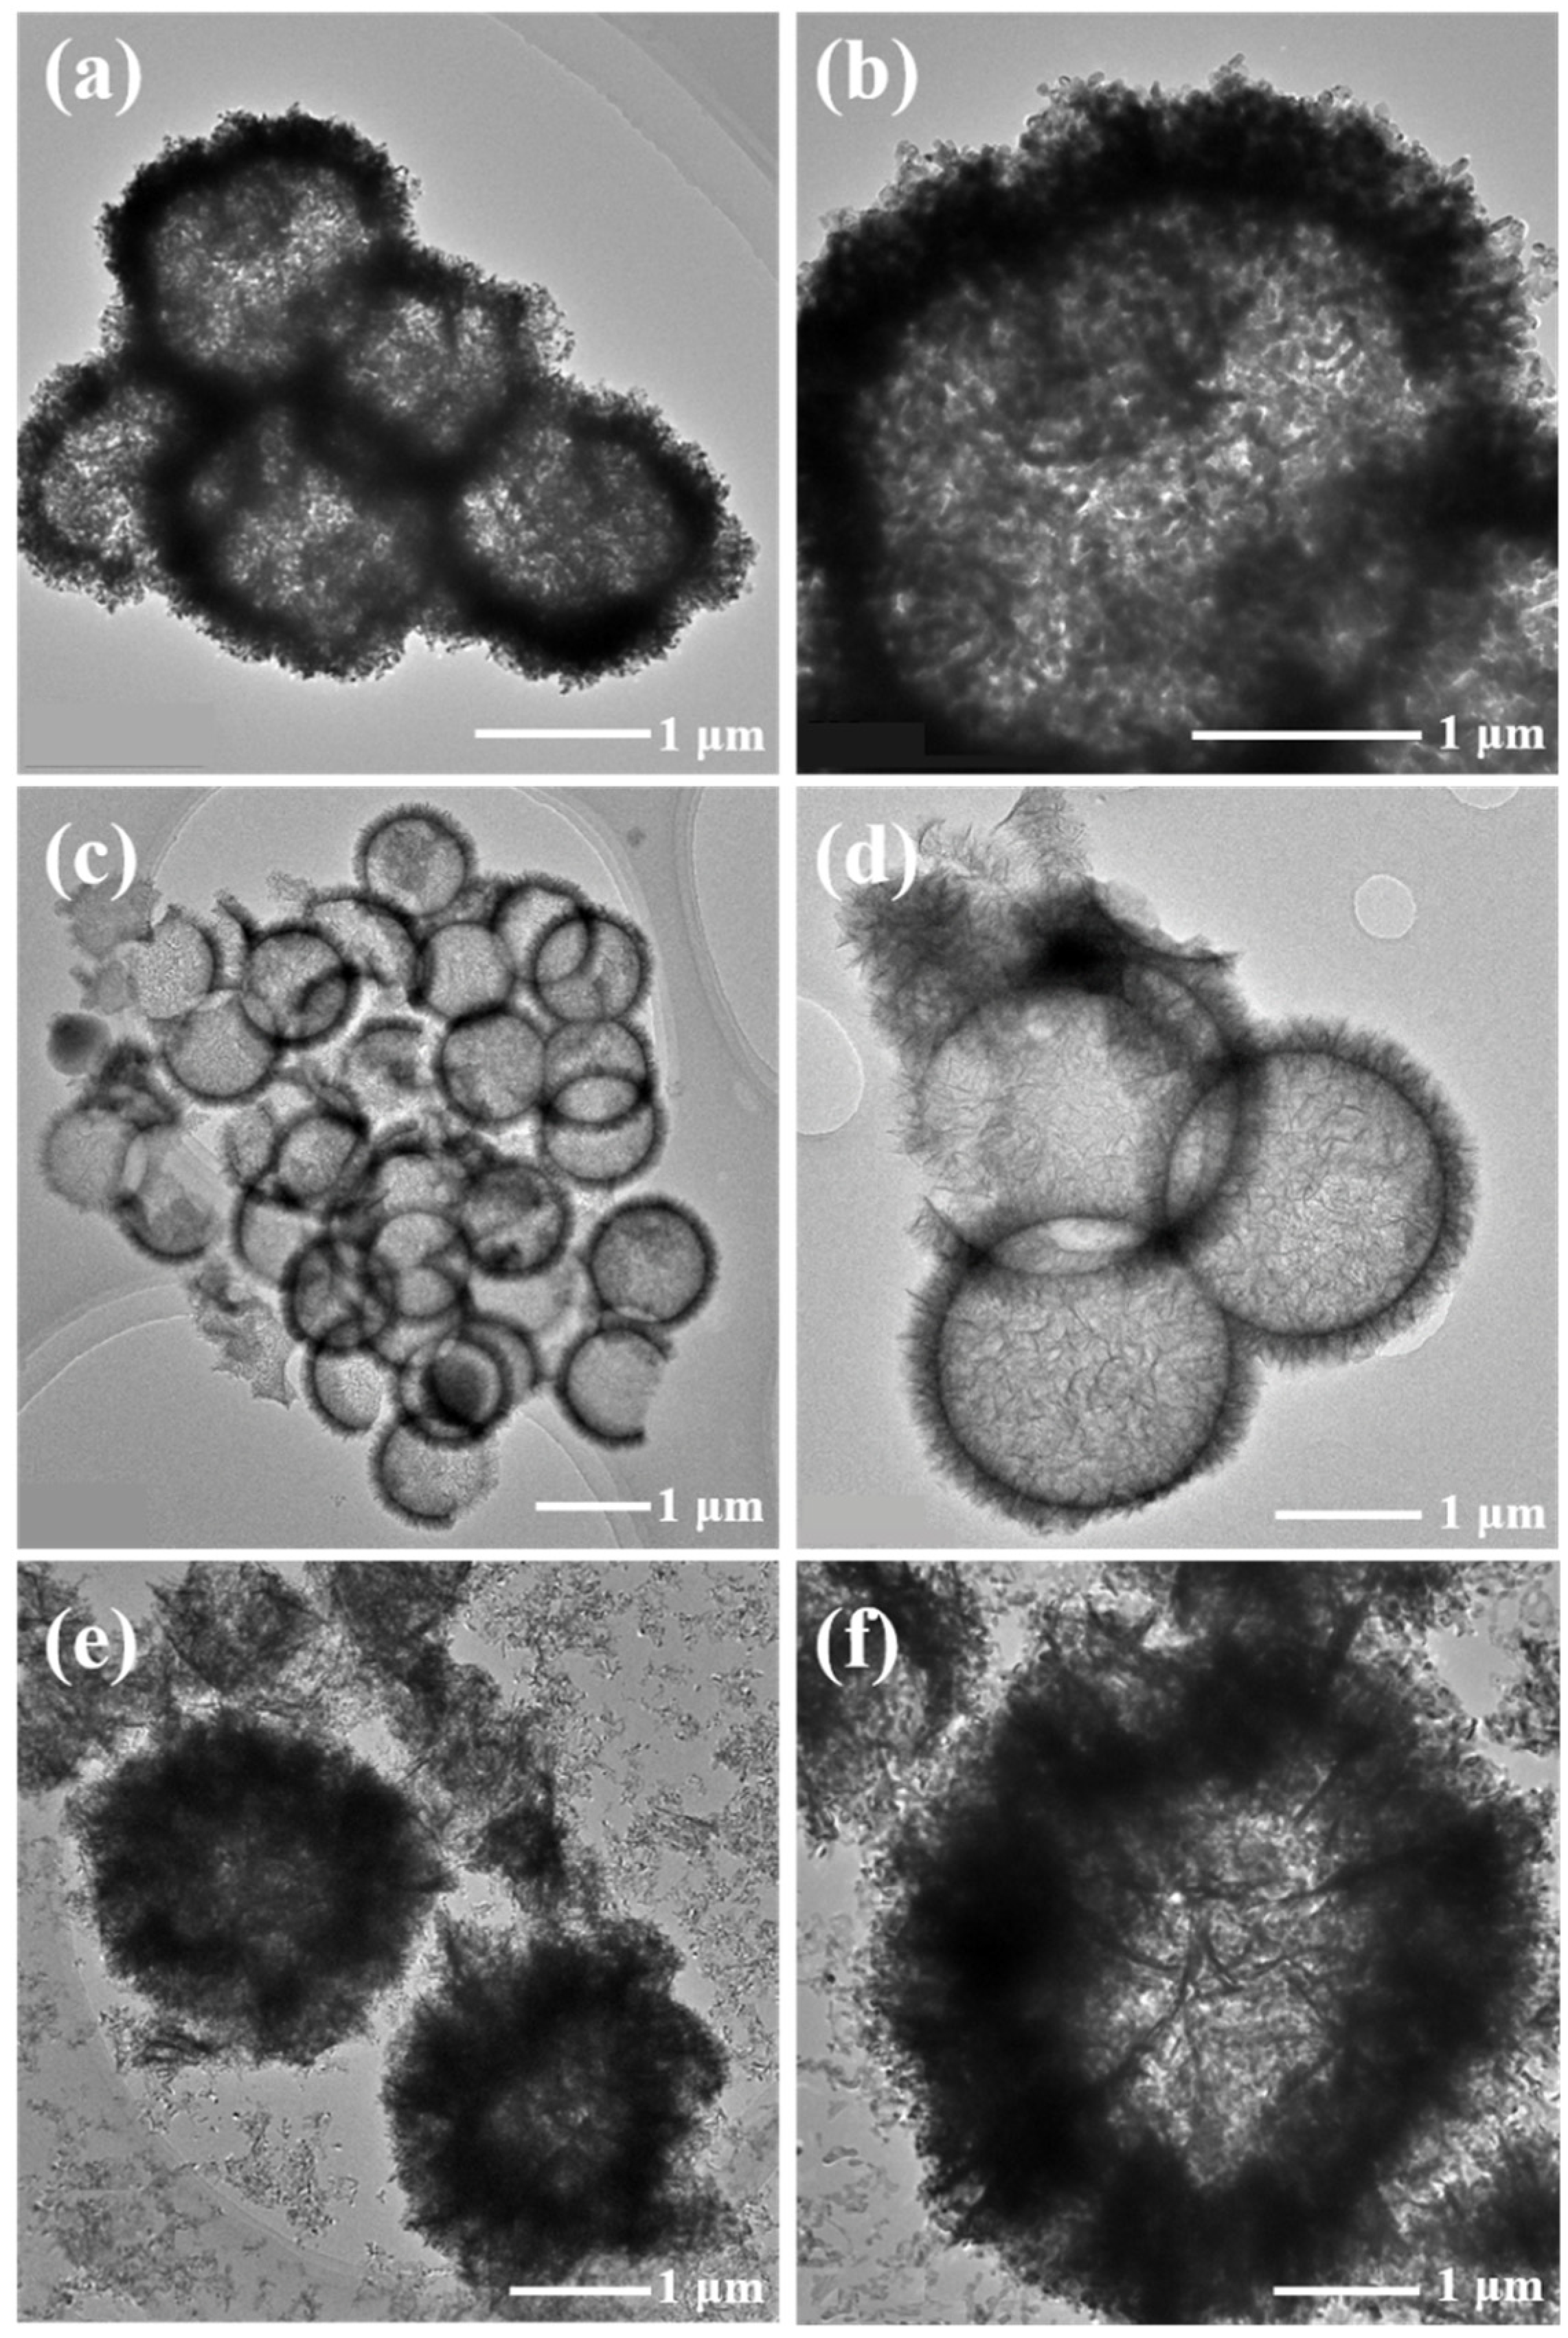
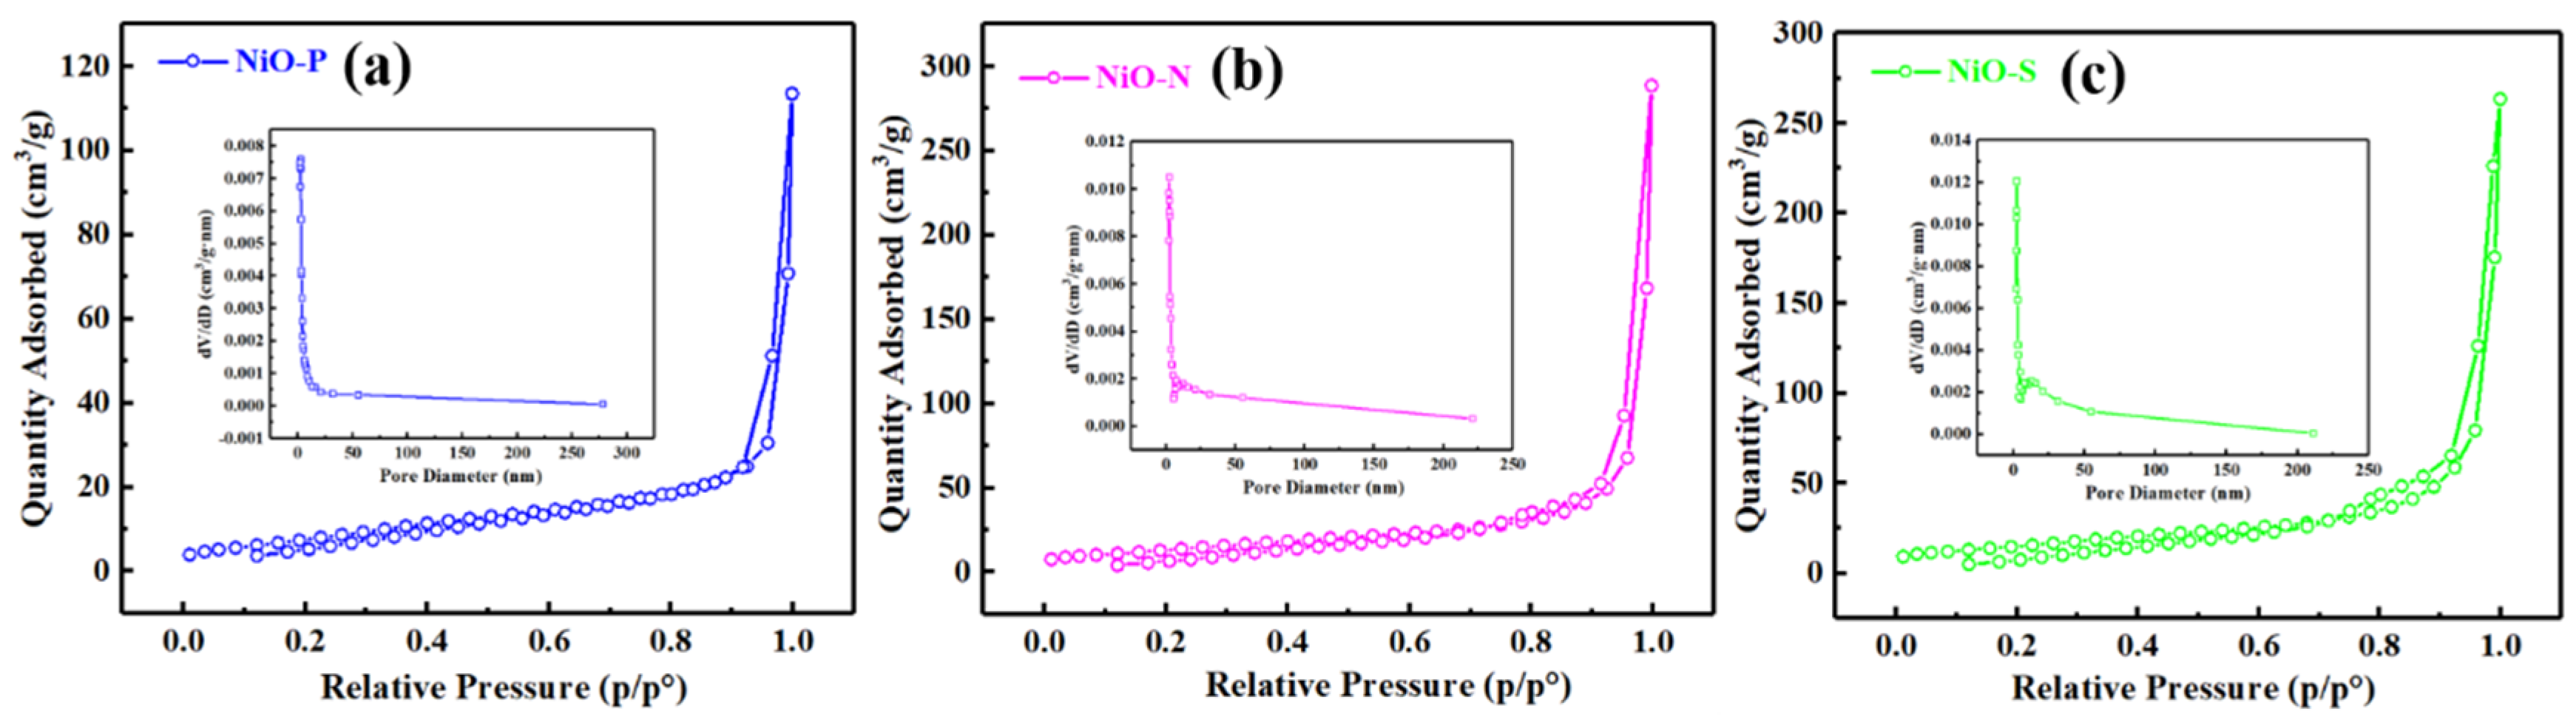
3. Results and Discussion
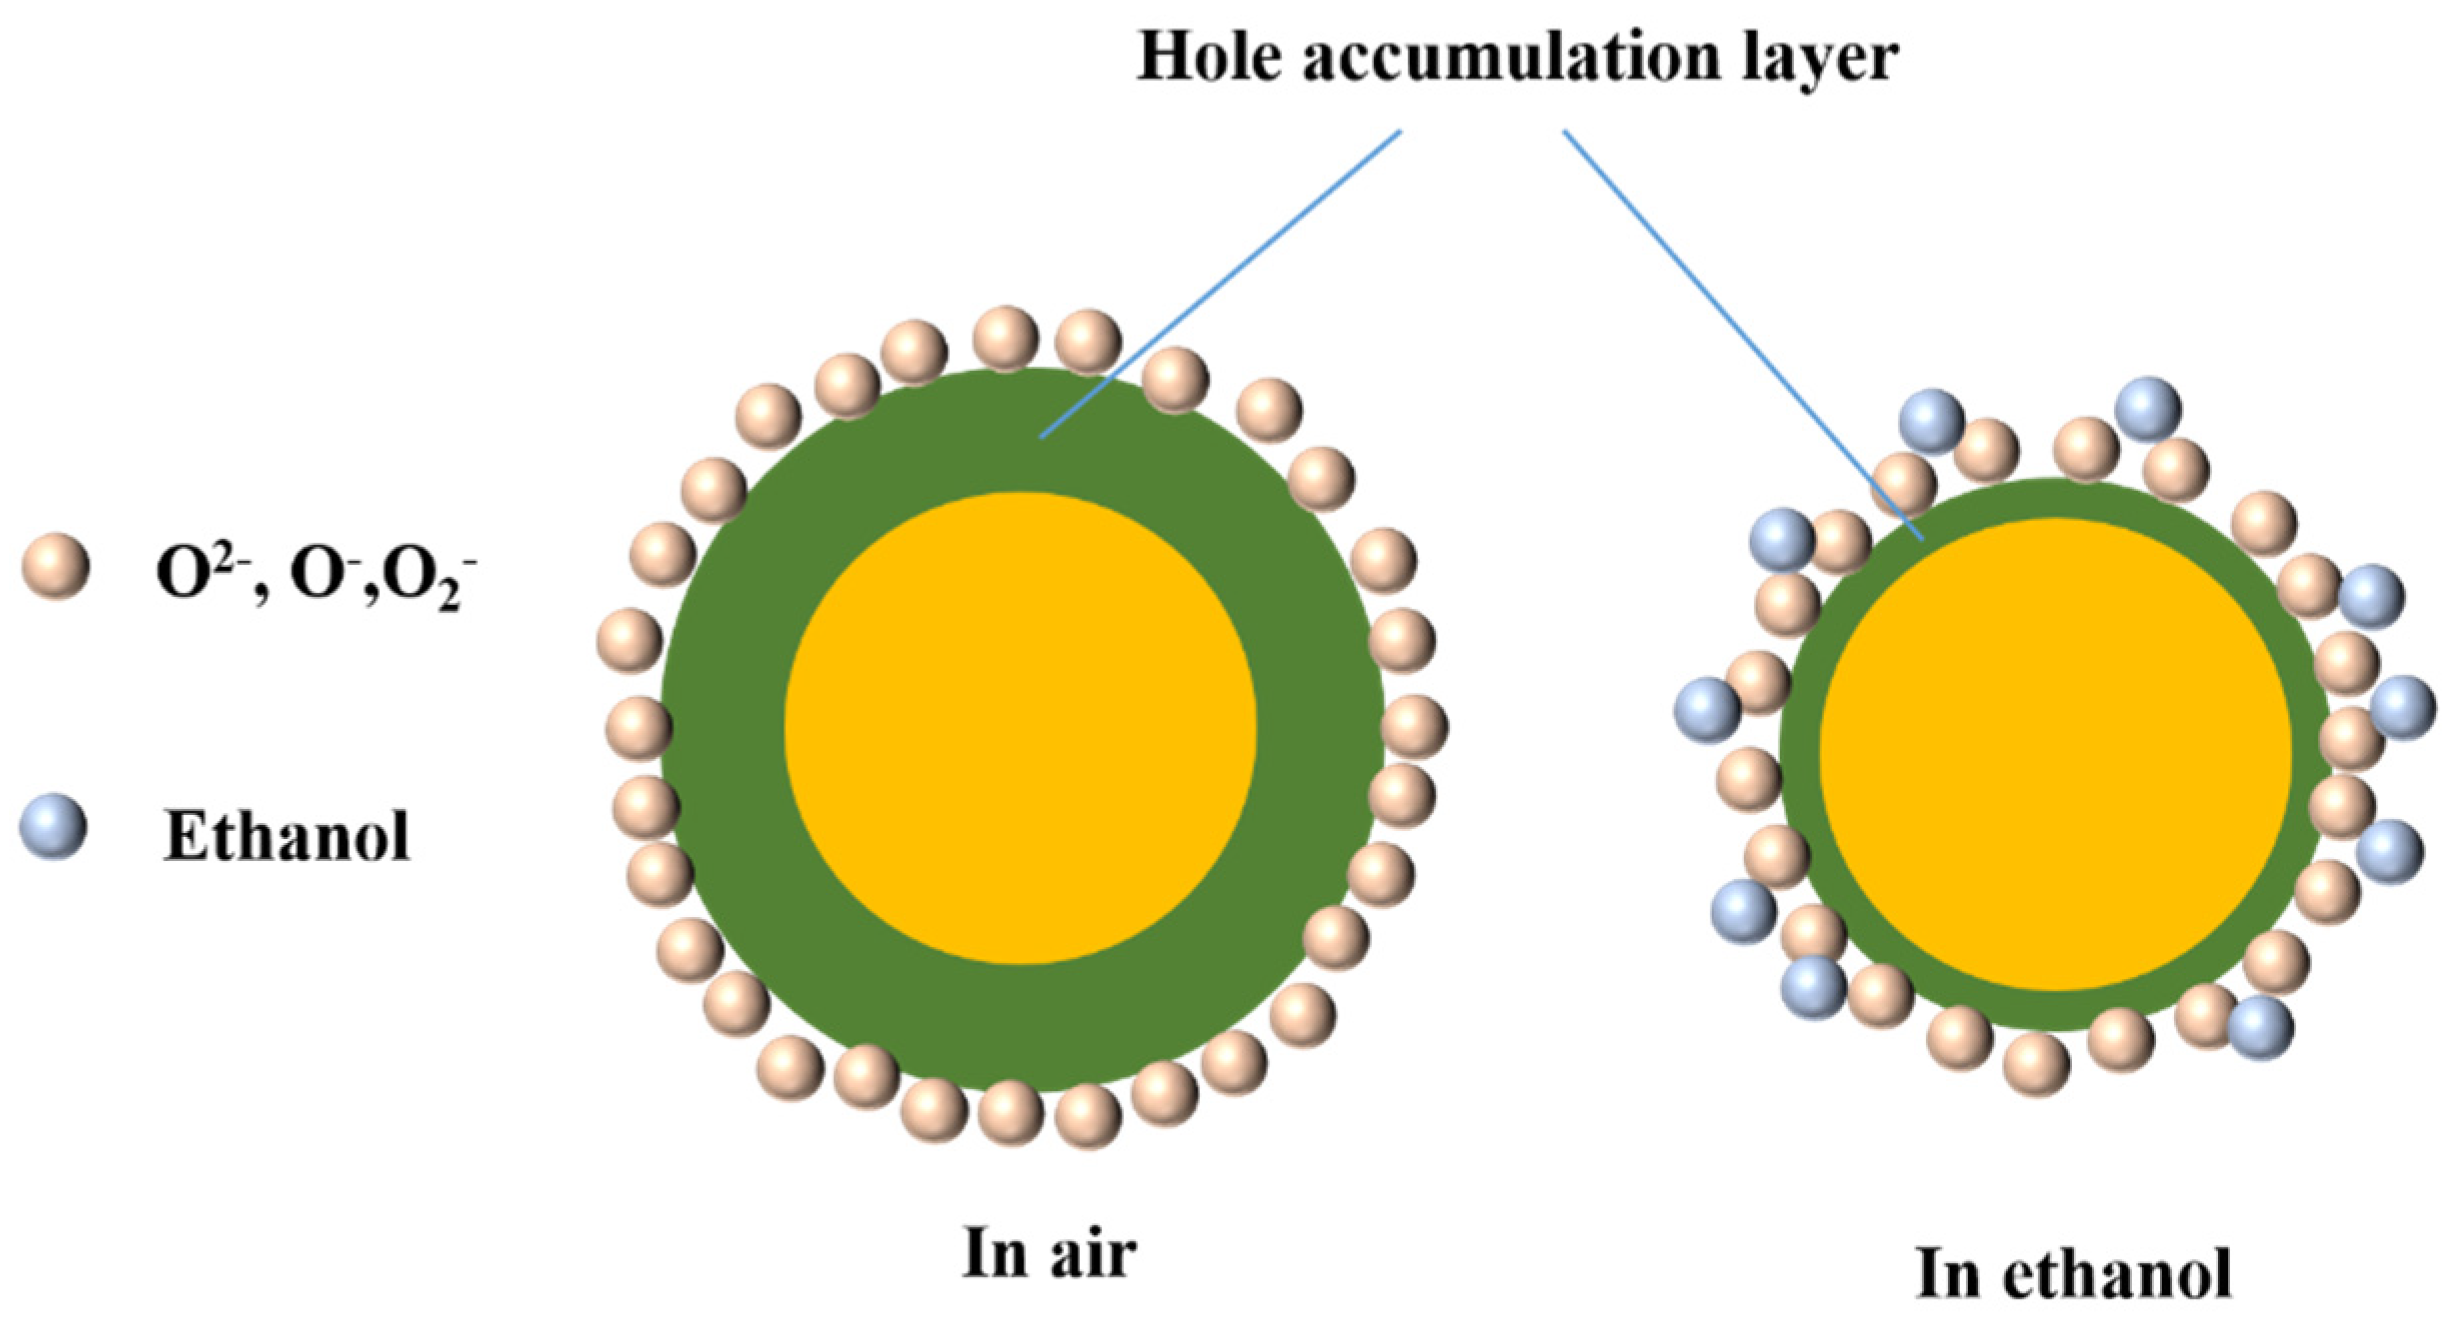
4. Gas-Sensing Mechanism
5. Conclusions
Author Contributions
Funding
Conflicts of Interest
References
- Pathak, A.K.; Viphavakit, C. A review on all-optical fiber-based VOC sensors: Heading towards the development of promising technology. Sens. Actuators A Phys. 2022, 338, 113455. [Google Scholar] [CrossRef]
- Du, L.; Sun, H. Facile synthesis of ZnO/SnO2 hybrids for highly selective and sensitive detection of formaldehyde. N. J. Chem. 2022, 46, 5573–5580. [Google Scholar] [CrossRef]
- Zhu, L.; Wang, J.; Liu, J.; Xu, Z.; Nasir, M.S.; Chen, X.; Wang, Z.; Sun, S.; Ma, Q.; Liu, J.; et al. In situ enrichment amplification strategy enabling highly sensitive formaldehyde gas sensor. Sens. Actuators B Chem. 2022, 354, 131206. [Google Scholar] [CrossRef]
- Majder-Lopatka, M.; Wesierski, T.; Dmochowska, A.; Salamonowicz, Z.; Polanczyk, A. The Influence of Hydrogen on the Indications of the Electrochemical Carbon Monoxide Sensors. Sustainability 2020, 12, 14. [Google Scholar] [CrossRef]
- Ren, P.; Qi, L.; You, K.; Shi, Q. Hydrothermal Synthesis of Hierarchical SnO2 Nanostructures for Improved Formaldehyde Gas Sensing. Nanomaterials 2022, 12, 228. [Google Scholar] [CrossRef]
- Zhang, Y.; Han, S.; Wang, M.; Liu, S.; Liu, G.; Meng, X.; Xu, Z.; Wang, M.; Qiao, G. Electrospun Cu-doped In2O3 hollow nanofibers with enhanced H2S gas sensing performance. J. Adv. Ceram. 2022, 11, 427–442. [Google Scholar] [CrossRef]
- John, R.A.B.; Shruthi, J.; Reddy, M.V.R.; Kumar, A.R. Manganese doped nickel oxide as room temperature gas sensor for formaldehyde detection. Ceram. Int. 2022, 48, 17654–17667. [Google Scholar] [CrossRef]
- Sima, Z.; Song, P.; Ding, Y.; Lu, Z.; Wang, Q. ZnSnO3 nanocubes/Ti(3)C(2)T(x) MXene composites for enhanced formaldehyde gas sensing properties at room temperature. Appl. Surf. Sci. 2022, 598, 153861. [Google Scholar] [CrossRef]
- Zhou, S.; Wang, H.; Hu, J.; Lv, T.; Rong, Q.; Zhang, Y.; Zi, B.; Chen, M.; Zhang, D.; Wei, J.; et al. Formaldehyde gas sensor with extremely high response employing cobalt-doped SnO2 ultrafine nanoparticles. Nanoscale Adv. 2022, 4, 824–836. [Google Scholar] [CrossRef]
- Fang, J.; Ma, Z.-H.; Xue, J.-J.; Chen, X.; Xiao, R.-P.; Song, J.-M. Au doped In2O3 nanoparticles: Preparation, and their ethanol detection with high performance. Mater. Sci. Semicond. Process. 2022, 146, 106701. [Google Scholar] [CrossRef]
- Rao, S.K.; Priya, A.K.; Kamath, S.M.; Abhinav, E.M.; Renganathan, B.; Jeyadheepan, K.; Gopalakrishnan, C. Unraveling the potential of Gd doping on mullite Bi2Fe4O9 for fiber optic ethanol gas detection at room temperature. Mater. Chem. Phys. 2022, 278, 125646. [Google Scholar] [CrossRef]
- Ahemad, M.J.; Le, T.D.; Kim, D.-S.; Yu, Y.-T. Bimetallic AgAualloy@ZnO core-shell nanoparticles for ultra-high detection of ethanol: Potential impact of alloy composition on sensing performance. Sens. Actuators B Chem. 2022, 359, 131595. [Google Scholar] [CrossRef]
- Akhtar, A.; Sadaf, S.; Liu, J.; Wang, Y.; Wei, H.; Zhang, Q.; Fu, C.; Wang, J. Hydrothermally synthesized spherical g-C3N4-NiCo2O4 nanocomposites for ppb level ethanol detection. J. Alloy. Compd. 2022, 911, 165048. [Google Scholar] [CrossRef]
- Yuan, G.; Zhong, Y.; Chen, Y.; Zhuo, Q.; Sun, X. Highly sensitive and fast-response ethanol sensing of porous Co3O4 hollow polyhedra via palladium reined spillover effect. RSC Adv. 2022, 12, 6725–6731. [Google Scholar] [CrossRef] [PubMed]
- Cheng, L.; Li, Y.; Cao, G.; Sun, G.; Cao, J.; Wang, Y. Boosting TEA sensing performance of ZnO porous hollow spheres via in situ construction of ZnS-ZnO heterojunction. Sens. Actuators B Chem. 2022, 364, 131883. [Google Scholar] [CrossRef]
- Yao, C.; Wu, L.; Li, H.; Xu, N.; Sun, J.; Wu, J. WS2 coating and Au nanoparticle decoration of ZnO nanorods for improving light-activated NO2 sensing. Appl. Surf. Sci. 2022, 584, 152508. [Google Scholar] [CrossRef]
- Huang, C.; Lv, S.; Gao, A.; Ling, J.; Yi, F.; Hao, J.; Wang, M.; Luo, Z.; Shu, D. Boosting the energy density of supercapacitors by designing both hollow NiO nanoparticles/nitrogen-doped carbon cathode and nitrogen-doped carbon anode from the same precursor. Chem. Eng. J. 2022, 431, 134083. [Google Scholar] [CrossRef]
- Ding, Y.; Cai, Y.; Li, P.; Gu, S.; Song, S.; Guan, J.; Shen, Y.; Han, Y.; He, W. Recyclable regeneration of NiO/NaF catalyst: Hydrogen evolution via steam reforming of oxygen-containing volatile organic compounds. Energy Convers. Manag. 2022, 258, 115456. [Google Scholar] [CrossRef]
- Kotta, A.; Seo, I.; Shin, H.-S.; Seo, H.-K. Room-temperature processed hole-transport layer in flexible inverted perovskite solar cell module. Chem. Eng. J. 2022, 435, 134805. [Google Scholar] [CrossRef]
- Kim, K.H.; Kim, T.; Choi, Y.S.; Lee, W.; Choi, W.; Yoon, J.; Park, J.S.; Kwon, Y.; Yoon, W.-S.; Kim, J.M. Revealing the unconventional lithium storage mechanism of ordered mesoporous NiO for lithium-ion batteries. J. Power Sources 2022, 526, 231135. [Google Scholar] [CrossRef]
- Li, C.; Choi, P.G.; Kim, K.; Masuda, Y. High performance acetone gas sensor based on ultrathin porous NiO nanosheet. Sens. Actuators B Chem. 2022, 367, 132143. [Google Scholar] [CrossRef]
- Qiu, T.; Luo, N.; Guo, M.; Cai, H.; Cheng, Z.; Xu, J. Synthesis and Enhanced H2S Sensing Properties of V2O3-NiO Nanoflower Assembled by Porous Nanosheets. J. Electrochem. Soc. 2022, 169, 037504. [Google Scholar] [CrossRef]
- Zhang, Z.; Liang, Q.; Li, J.; Liang, X.; Yang, L.; Zhang, Q.; Zou, X.; Chen, H.; Li, G.-D. Electronic and morphological dual modulation of NiO by indium-doping for highly improved xylene sensing. New J. Chem. 2022, 46, 3831–3837. [Google Scholar] [CrossRef]
- Juang, F.-R.; Hsieh, C.-H.; Huang, I.Y.; Wang, W.-Y.; Lin, W.-B.; Yen, L. Dispersed and spherically assembled porous NiO nanosheets for low concentration ammonia gas sensing applications. Solid-State Electron. 2022, 189, 108224. [Google Scholar] [CrossRef]
- Feng, S.; Yu, H.; Zhang, X.; Huo, L.; Gao, R.; Wang, P.; Cheng, X.; Major, Z.; Gao, S.; Xu, Y. Ionic liquid-assisted synthesis of 2D porous lotus root slice-shaped NiO nanomaterials for selective and highly sensitive detection of N2H4. Sens. Actuators B Chem. 2022, 359, 131529. [Google Scholar] [CrossRef]
- Sharma, P.; Kumar, S.; Vishwanadh, B.; Girija, K.G. Cost-effective synthesis of NiO nanoparticles and realization of highly selective NO2 sensors. Appl. Phys. A Mater. Sci. Process. 2022, 128, 630. [Google Scholar] [CrossRef]
- Liu, Y.; Bai, J.; Li, Y.; Yang, L.; Wang, Y.; Li, Y.; Liu, F.; Zhang, Y.; Lu, G. Preparation of PdO-decorated NiO porous film on ceramic substrate for highly selective and sensitive H2S detection. Ceram. Int. 2022, 48, 4787–4794. [Google Scholar] [CrossRef]
- Gupta, P.; Kumar, K.; Saeed, S.H.; Pandey, N.K.; Verma, V.; Singh, P.; Yadav, B.C. Influence of tin doping on the liquefied petroleum gas and humidity sensing properties of NiO nanoparticles. J. Mater. Res. 2022, 37, 369–379. [Google Scholar] [CrossRef]
- Sudha, S.; Ramprasath, R.; Cholan, S.; Gokul, B.; Sridhar, S.; Ali, H.E.; Shkir, M. Enhanced triethylamine gas sensing and photocatalytic performance of Sn doped NiO (SNO) nanoparticles. Inorg. Chem. Commun. 2022, 136, 109104. [Google Scholar] [CrossRef]
- Pan, H.; Li, Z.; Lou, C.; Lei, G.; Xie, J.; Zheng, W.; Liu, X.; Zhang, J. Anchoring Fe2O3 nanosheets on NiO nanoprisms to regulate the electronic properties for improved n-butanol detection. Sens. Actuators B Chem. 2022, 354, 131223. [Google Scholar] [CrossRef]
- Wang, D.; Mi, Q.; Zhang, H.; Li, G.; Zhang, D. Sensitive Xylene Gas Sensor Based on NiO-NiCo2O4 Hierarchical Spherical Structure Constructed With Nanorods. IEEE Sens. J. 2022, 22, 10346–10352. [Google Scholar] [CrossRef]
- Selvaraj, B.; Rayappan, J.B.B.; Babu, K.J. Room temperature ZnO/NiO heterostructure sensing response: A breath biomarker sensor. J. Alloy. Compd. 2022, 914, 165224. [Google Scholar] [CrossRef]
- Patil, P.; Nakate, Y.T.; Ambare, R.C.; Ingole, R.S.; Kadam, S.L.; Nakate, U.T. 2-D NiO nanostructured material for high response acetaldehyde sensing application. Mater. Lett. 2021, 293, 129757. [Google Scholar] [CrossRef]
- Zhang, S.; Zhang, B.; Zhang, B.; Wang, Y.; Bala, H.; Zhang, Z. Structural evolution of NiO from porous nanorods to coral-like nanochains with enhanced methane sensing performance. Sens. Actuators B Chem. 2021, 334, 129645. [Google Scholar] [CrossRef]
- Hu, Q.; Wang, Z.; Chang, J.; Wan, P.; Huang, J.; Feng, L. Design and preparation of hollow NiO sphere- polyaniline composite for NH3 gas sensing at room temperature. Sens. Actuators B Chem. 2021, 344, 130179. [Google Scholar] [CrossRef]
- Zhang, C.; Huan, Y.; Li, Y.; Luo, Y.; Debliquy, M. Low concentration isopropanol gas sensing properties of Ag nanoparticles decorated In2O3 hollow spheres. J. Adv. Ceram. 2022, 11, 379–391. [Google Scholar] [CrossRef]
- Li, Q.; Zeng, W.; Li, Y. Core-shell NiO Sphere Prepared by a Facile Method with Enhanced VOC Gas Sensing. J. Electrochem. Soc. 2022, 169, 067508. [Google Scholar] [CrossRef]
- Wang, S.-C.; Wang, X.-H.; Qiao, G.-Q.; Chen, X.-Y.; Wang, X.-Z.; Wu, N.-N.; Tian, J.; Cui, H.-Z. NiO nanoparticles-decorated ZnO hierarchical structures for isopropanol gas sensing. Rare Met. 2022, 41, 960–971. [Google Scholar] [CrossRef]
- Mokoena, T.P.; Swart, H.C.; Hillie, K.T.; Tshabalala, Z.P.; Jozela, M.; Tshilongo, J.; Motaung, D.E. Enhanced propanol gas sensing performance of p-type NiO gas sensor induced by exceptionally large surface area and crystallinity. Appl. Surf. Sci. 2022, 571, 151121. [Google Scholar] [CrossRef]
- Geng, W.-C.; Cao, X.-R.; Xu, S.-L.; Yang, J.-H.; Babar, N.; He, Z.-J.; Zhang, Q.-Y. Synthesis of hollow spherical nickel oxide and its gas-sensing properties. Rare Met. 2021, 40, 1622–1631. [Google Scholar] [CrossRef]
- Hu, Q.; Wu, C.; Dong, Z.; Zhang, G.; Ma, Z.; Wang, X.; Sun, S.; Xu, J. Direct confirmation of confinement effects by NiO confined in helical SnO2 nanocoils and its application in sensors. J. Mater. Chem. A 2022, 10, 2786–2794. [Google Scholar] [CrossRef]
- ul Haq, M.; Zhang, Z.; Wen, Z.; Khan, S.; Din, S.u.; Rahman, N.; Zhu, L. Humidity sensor based on mesoporous Al-doped NiO ultralong nanowires with enhanced ethanol sensing performance. J. Mater. Sci. Mater. Electron. 2019, 30, 7121–7134. [Google Scholar] [CrossRef]
- Yan, S.; Song, W.; Wu, D.; Jin, S.; Dong, S.; Hao, H.; Gao, W. Assembly of In2O3 nanoparticles decorated NiO nanosheets heterostructures and their enhanced gas sensing characteristics. J. Alloy. Compd. 2022, 896, 162887. [Google Scholar] [CrossRef]
- Lu, Y.; Ma, Y.H.; Ma, S.Y.; Jin, W.X.; Yan, S.H.; Xu, X.L.; Chen, Q. Curly porous NiO nanosheets with enhanced gas-sensing properties. Mater. Lett. 2017, 190, 252–255. [Google Scholar] [CrossRef]
- Li, X.Q.; Wei, J.Q.; Xu, J.C.; Jin, H.X.; Jin, D.F.; Peng, X.L.; Hong, B.; Li, J.; Yang, Y.T.; Ge, H.L.; et al. Highly improved sensibility and selectivity ethanol sensor of mesoporous Fe-doped NiO nanowires. J. Nanoparticle Res. 2017, 19, 396. [Google Scholar] [CrossRef]
- Majhi, S.M.; Naik, G.K.; Lee, H.-J.; Song, H.-G.; Lee, C.-R.; Lee, I.-H.; Yu, Y.-T. Au@NiO core-shell nanoparticles as a p-type gas sensor: Novel synthesis, characterization, and their gas sensing properties with sensing mechanism. Sens. Actuators B Chem. 2018, 268, 223–231. [Google Scholar] [CrossRef]
- Shao, Z.; Zhao, Z.; Chen, P.; Chen, J.; Liu, W.; Shen, X.; Liu, X. Enhanced ethanol response of Ti3C2TX MXene derivative coupled with NiO nanodisk. Inorg. Nano Met. Chem. 2022, 52, 1–9. [Google Scholar] [CrossRef]
- Singh, S.; Sharma, S. Temperature dependent selective detection of ethanol and methanol using MoS2/TiO2 composite. Sens. Actuators B Chem. 2022, 350, 130798. [Google Scholar] [CrossRef]


| Sample | Binding Energy (eV) | ||
|---|---|---|---|
| OL | OV | OC | |
| NiO-P | 529.5 | 532.1 | 533.7 |
| NiO-N | 529.3 | 530.6 | 532.2 |
| NiO-S | 529.5 | 531.2 | 532.8 |
| Sample | Ni 2p3/2 (eV) | Ni 2p1/2 (eV) | ||
|---|---|---|---|---|
| NiO-P | 853.9 | 856.0 | 872.4 | 874.8 |
| NiO-N | 854.9 | 857.2 | 872.8 | 875.4 |
| NiO-S | 853.9 | 856.0 | 872.1 | 874.5 |
| Sample | Ni2+ | Ni3+ | Ni3+/Ni2+ |
|---|---|---|---|
| NiO-P | 36.75 | 34.76 | 0.94 |
| NiO-N | 35.87 | 33.68 | 0.94 |
| NiO-S | 34.29 | 35.39 | 1.03 |
| Sample | Surface Area (m2/g) | Pore Volume (cm3/g) | Average Pore Size (nm) |
|---|---|---|---|
| NiO-P | 29.75 | 0.174 | 23.61 |
| NiO-N | 49.35 | 0.446 | 36.21 |
| NiO-S | 55.20 | 0.407 | 29.54 |
| Materials | Concentration (ppm) | Temperature (°C) | Response | Reference |
|---|---|---|---|---|
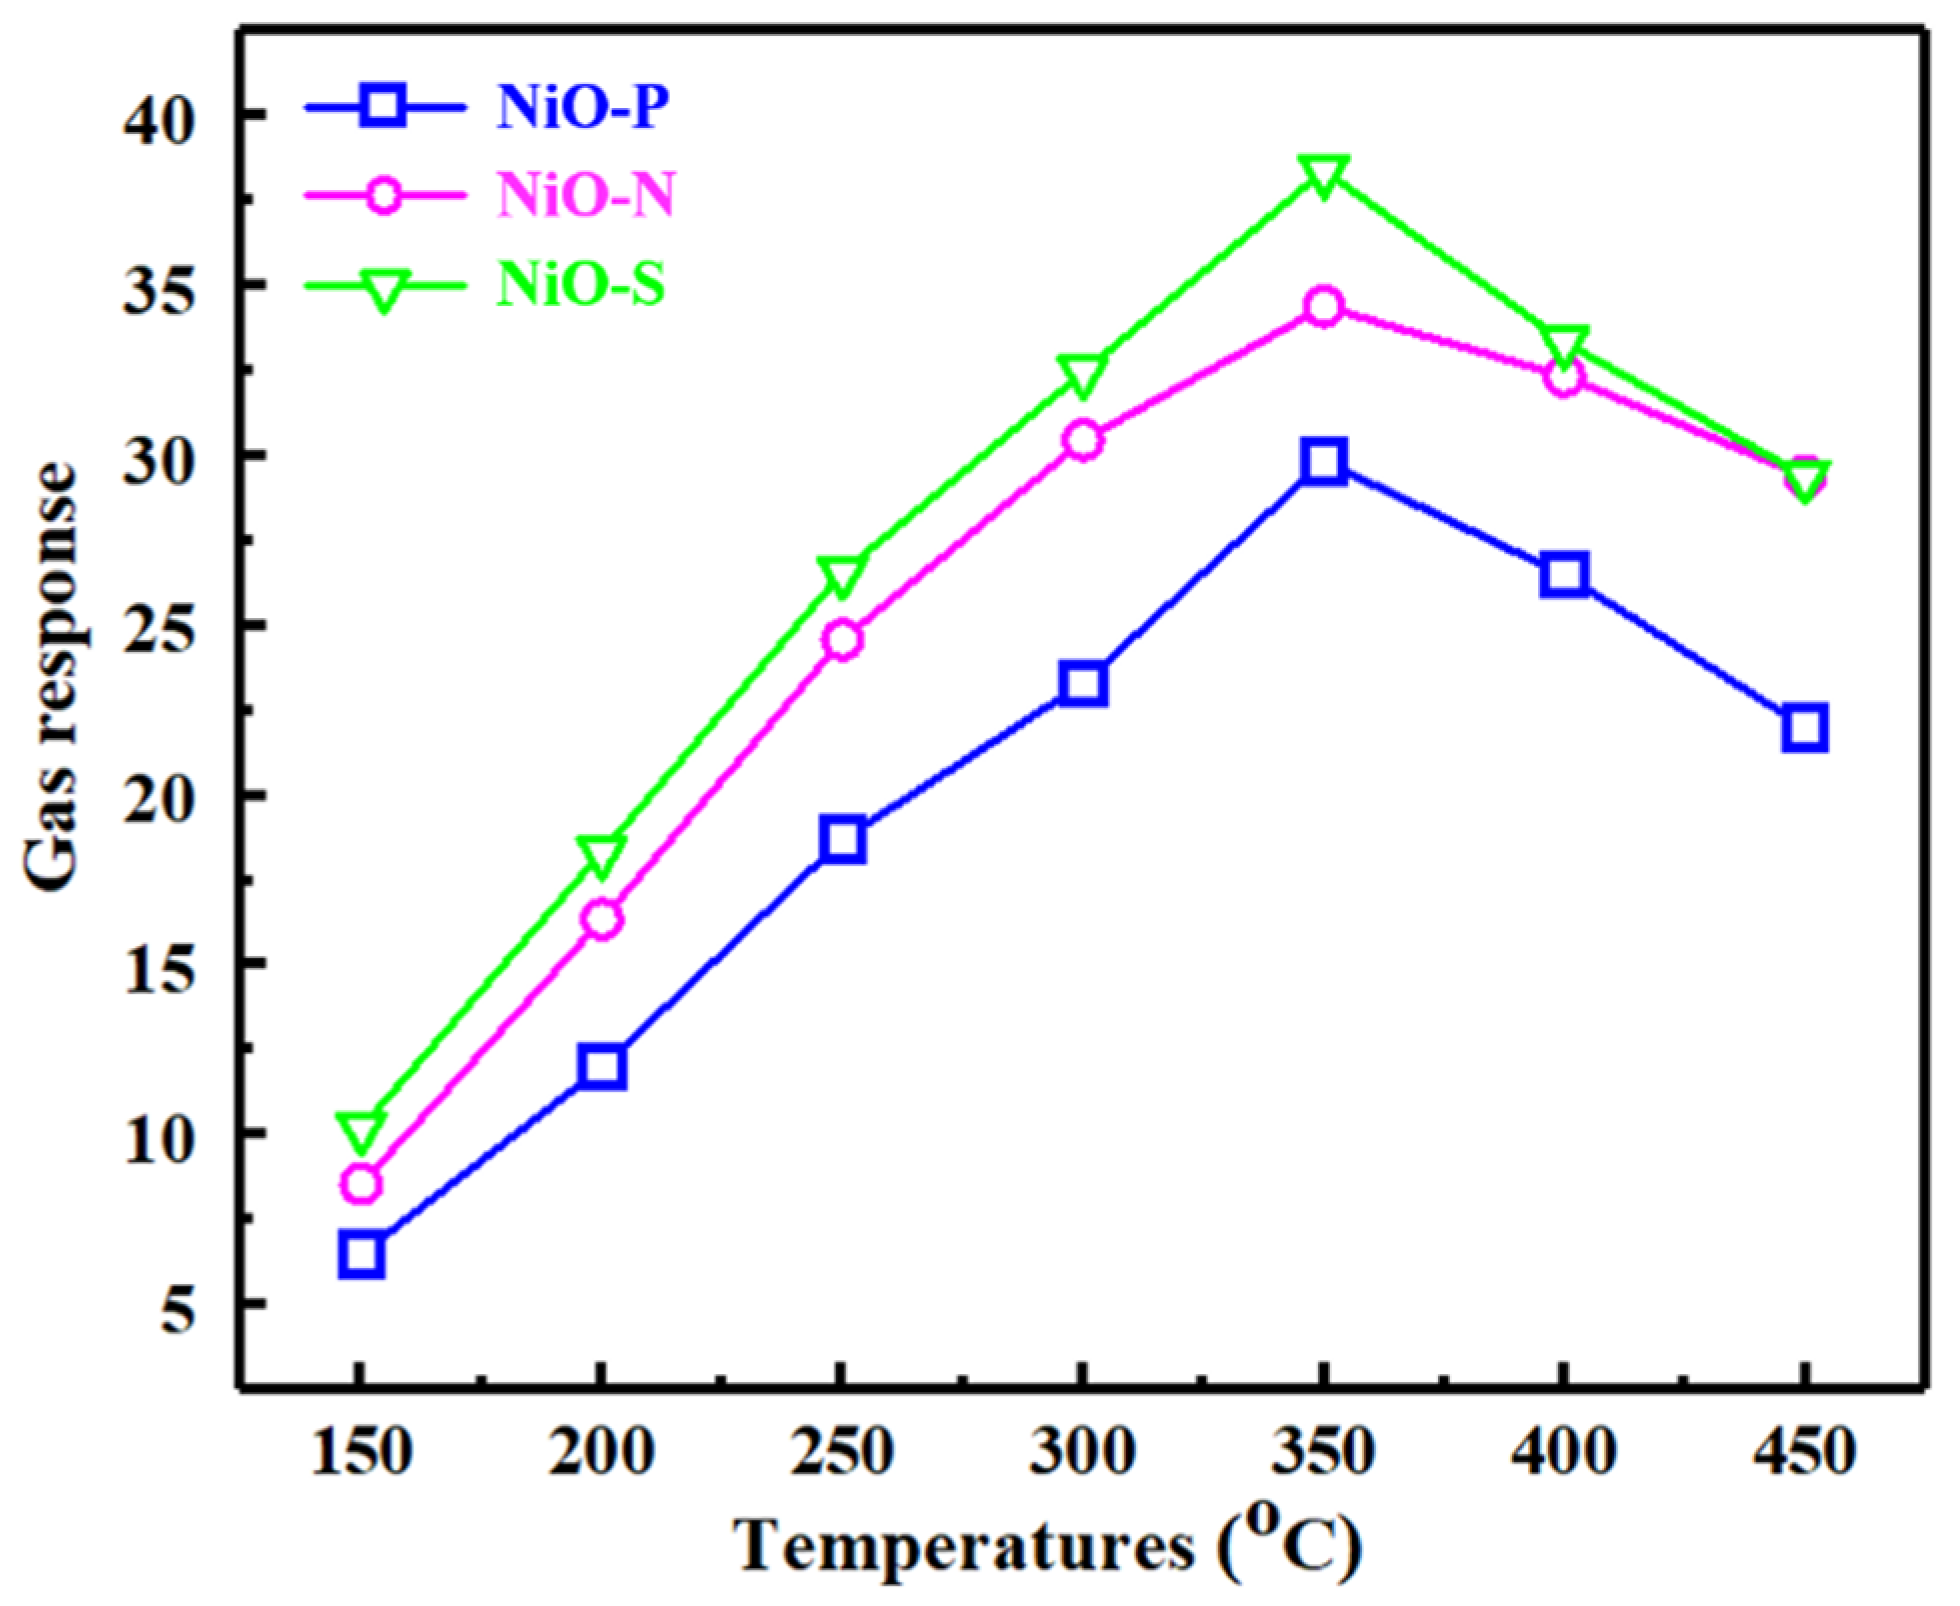
| Hollow sphere NiO | 100 | 350 | 38.4 | This work |
| NiO | 100 | 280 | 1.44 | [43] |
| NiO | 50 | 240 | 11.15 | [44] |
| Fe-NiO | 100 | 320 | 14.3 | [45] |
| Au-NiO | 100 | 200 | 2.54 | [46] |
| NiO/In2O3 | 100 | 280 | 4.61 | [43] |
| NiO/MXene | 100 | 200 | 14.68 | [47] |
| MoS2/TiO2 | 500 | 300 | 100 | [48] |
Publisher’s Note: MDPI stays neutral with regard to jurisdictional claims in published maps and institutional affiliations. |
© 2022 by the authors. Licensee MDPI, Basel, Switzerland. This article is an open access article distributed under the terms and conditions of the Creative Commons Attribution (CC BY) license (https://creativecommons.org/licenses/by/4.0/).
Share and Cite
Li, Q.; Zeng, W.; Zhou, Q.; Wang, Z. Highly Sensitive Ethanol Sensing Using NiO Hollow Spheres Synthesized via Hydrothermal Method. Chemosensors 2022, 10, 341. https://doi.org/10.3390/chemosensors10080341
Li Q, Zeng W, Zhou Q, Wang Z. Highly Sensitive Ethanol Sensing Using NiO Hollow Spheres Synthesized via Hydrothermal Method. Chemosensors. 2022; 10(8):341. https://doi.org/10.3390/chemosensors10080341
Chicago/Turabian StyleLi, Qingting, Wen Zeng, Qu Zhou, and Zhongchang Wang. 2022. "Highly Sensitive Ethanol Sensing Using NiO Hollow Spheres Synthesized via Hydrothermal Method" Chemosensors 10, no. 8: 341. https://doi.org/10.3390/chemosensors10080341
APA StyleLi, Q., Zeng, W., Zhou, Q., & Wang, Z. (2022). Highly Sensitive Ethanol Sensing Using NiO Hollow Spheres Synthesized via Hydrothermal Method. Chemosensors, 10(8), 341. https://doi.org/10.3390/chemosensors10080341