Abstract
Excessive ethanol gas is a huge safety hazard, and people will experience extreme discomfort after inhalation, so efficient ethanol sensors are of great importance. This article reports on ethanol gas sensors that use NiO hollow spheres assembled from nanoparticles, nanoneedles, and nanosheets prepared by the hydrothermal method. All of the samples were characterized for performance evaluation. The sensors based on the NiO hollow spheres showed a good response to ethanol, and the hollow spheres assembled from nanosheets (NiO-S) obtained the best ethanol gas-sensing performance. NiO-S provided a larger response value (38.4) at 350 °C to 200 ppm ethanol, and it had good stability and reproducibility. The nanosheet structure and the fluffy surface of NiO-S obtained the largest specific surface area (55.20 m2/g), and this structure was beneficial for the sensor to adsorb more gas molecules in an ethanol atmosphere. In addition, the excellent sensing performance could ascribe to the larger Ni3+/Ni2+ of NiO-S, which achieved better electronic properties. Furthermore, in terms of commercial production, the template-free preparation of NiO-S eliminated one step, saving time and cost. Therefore, the sensors based on NiO-S will serve as candidates for ethanol sensing.
1. Introduction
In the environment we live in, in addition to nitrogen and oxygen, there are also some carbides and sulfides. Volatile organic compounds (VOCs) are common in daily life and are used in glues for footwear, upholstery materials, detergents, and paints. According to the survey, there are up to 300 kinds of VOCs in the indoor environment [1]. Hydrocarbons, benzene, and ethers contained in VOCs will inflict irretrievable damage to the human circulatory system, respiratory system, and heart. In addition, VOCs have been identified as carcinogenic [2,3]. It is very important to develop gas sensors to protect human health. In recent years, many scholars have devoted themselves to the research of gas sensors to prevent people from being harmed by gases [4,5,6]. In particular, formaldehyde, which we often say, is the biggest safety hazard in newly-renovated houses. Formaldehyde in buildings can cause adverse reactions such as coughing, eye discomfort, headache, etc. [5,7,8]. The World Health Organization (WHO) stipulates that the indoor formaldehyde concentration should be below 82 ppb [9]. Ethanol is the most easily overlooked. Ethanol with a concentration of 75% is used for disinfecting water. We can always smell a pungent smell when disinfecting with ethanol. The excessive inhalation of ethanol will irritate the nasal mucosa and eyes and will be accompanied by symptoms such as dizziness, headache, and nausea [10,11,12]. In more severe cases, there may be damage to the liver [13]. Therefore, it is necessary to develop ethanol sensors with excellent selectivity and good performance.
Among a variety of gas detection technologies, metal oxide semiconductors (MOS) our superior due to their convenience of operation, high sensitivity, low cost, and good stability [14,15,16]. Nickel oxide (NiO) is a widely used p-type semiconductor, which is used in supercapacitors [17], catalysts [18], photovoltaic materials [19], and battery materials [20]. NiO has the advantages of environmental friendliness, low cost, good repeatability, etc., so it is considered an important material for gas sensors [21,22,23]. In the applications of gas sensors, NiO has been used to detect ammonia [24], hydrazine [25], NO2 [26], H2S [27], etc. Despite the the above advantages, a fatal disadvantage of NiO is its poor sensitivity. In view of this disadvantage, extensive research has been carried out on it, including doping modification [28,29], forming PN heterojunction [30,31], and morphology regulation. For example, Selvaraj’s team [32] successfully synthesized a ZnO/NiO acetone sensor using electrospinning technology. When the ratio of Ni2+ and Zn2+ was 1:3, the maximum response of the ZnO/NiO sensor at RT was 6.06, and the response/recovery time was 28/34 s to 100 ppm acetone. Particularly, the detection limits were low, down to 1 ppm. Because of the increasing adsorbed oxygen species and the modulation effect of PN heterojunction, the performance of the sensors is enhanced. In these studies, morphology is the most basic condition. Whether it is doping or recombination, they are based on various morphologies. In terms of the morphology regulation of NiO, various morphologies such as nanosheets [33], nanorods [34], and nanospheres [35] have been reported. Among the many morphologies, the hollow structure is considered to be promising [36]. Due to the larger specific surface area, it is likely to have a larger gas response. However, the hollow morphology of pristine NiO has rarely been reported in recent years.
In this paper, we reported the ethanol sensing performance of NiO hollow spheres assembled from nanoparticles, nanoneedles, and nanosheets. These different NiO hollow spheres were controlled by templates. As shown in the results, the NiO-S assembled using nanosheets obtained the best sensitive performance. NiO-S provided a large response value (38.4) at 350 °C to 200 ppm ethanol, and it had good stability and reproducibility. The nanosheet structure and fluffy surface of NiO-S were beneficial for the sensor to adsorb more gas in an ethanol atmosphere. In addition, the excellent sensing performance could be ascribed to the larger Ni3+/Ni2+ of NiO-S, which achieved better electronic properties. The differences between these three samples have been analyzed in terms of gas-sensing mechanisms and Ni3+/Ni2+ ratios.
2. Experimental
2.1. Synthesis of NiO Hollow Spheres
2.1.1. Synthesis of NiO-P
First, 6.4 g glucose was dispersed in deionized (DI) water and then hydrothermally reacted at 180° for 8 h. After the reaction, DI and ethanol were used to clean the obtained precipitation. The slurry was dried at 60 °C for 8 h, and a brown product was collected. Then, 0.2 g carbon balls were dissolved in 50 mL of DI water, and 1.2 g of NiCl2•6H2O was added to the solution. The mixture was ultrasonically dispersed for 0.5 h and then stirred at 85 °C for 0.5 h using a thermostatic magnetic stirrer. Then, 2.4 g of urea were introduced into the mixture and continuously stirred for 3 h. The urea was hydrolyzed to generate NH4+, HCO3−, and OH−. The OH− combined with Ni2+ in the solution to form Ni(OH)2. After cooling to RT, the slurry was washed using DI and ethanol. The NiO hollow sphere was obtained by calcining at 450 °C for 3 h. The NiO hollow spheres obtained here were assembled from nanoparticles, so we named the sample NiO-P by taking the initial letter “P” of the word “particle”. The same nomenclature was used for the other two samples.
2.1.2. Synthesis of NiO-N
First, 6 mL of deionized water, 12 mL of NH3∙H2O, and 12 mL of ethyl orthosilicate were sequentially added to 80 mL of isopropanol during stirring. After stirring for 4 h, the precipitate was collected and washed to obtain clean SiO2. The SiO2 was soaked in 1 M HCl and sonicated for 1 h, and then washed until neutral. The SiO2 was treated with APTES to make it positively charged. Then, 0.6 g SiO2 was added to 30 mL of absolute ethanol and ultrasonically for 30 min. Then, 1.4 g of Ni(NO3)2 was dispersed in the solution, and then 3.6 g of urea was added. The mixed solution was stirred at 85 °C for 7 h. The powder was calcined at 450 °C for 4 h to obtain NiO spheres with an SiO2 template. The SiO2-NiO was stirred in 2 M NaOH for 6 h and then left to stand overnight to remove the SiO2 to obtain the NiO hollow spheres. The NiO hollow spheres obtained here were assembled from nanoneedles, so we named the sample NiO-N by taking the initial letter “N” of the word “needle”.
2.1.3. Synthesis of NiO-S
First, 2 mmol of NiCl2•6H2O, 24 mL of DI, 24 mL of water, and 10 mmol of urea were introduced to a beaker in turn. After stirring for 20 min, the solution was maintained at 180 °C for 12 h to hydrothermally react. After the heat preservation, the obtained precipitate was cleared, and the clean slurry was dried. Finally, the dried slurry was calcined at 400 °C for 2 h. The NiO hollow spheres obtained here were assembled from nanosheets, so we named the sample NiO-S by taking the initial letter “S” of the word “sheet”.
2.2. Characterization and Gas Sensor Measurement
The associated characterization tests were all consistent with our previous work [37]. The N2 adsorption–desorption measurements were performed (MicroActive 5.02), and the specific surface area was calculated using the Brunauer–Emmett–Teller (BET) equation. The fabrication of the sensor was based on an Al2O3 ceramic tube with parallel Au electrodes and Pt wires (Figure 1a). There was a Ni-Cr alloy in the tube as a heater, which was convenient for controlling the operating temperature. The obtained NiO powder was dispersed in ethanol and ultrasonically treated to obtain a slurry. The slurry was then coated on Al2O3 tubes, dried at 100 °C, and annealed at 350 °C for 1 h. The fabricated sensor was welded to the test cavity and aged at 200 °C. The sensitive performance of the sensor was tested using an intelligent gas-sensing test system (CGS-8 Beijing Ailite) (As shown in Figure 1b). The gas distribution system evaporated the target gas with a specific concentration in the reaction chamber. After the gas concentration was stable, the gas sensing performance was tested. The humidity of the chamber was controlled by simultaneously adjusting the flow rates of dry air and air moistened with pure water at room temperature. The gas response in this paper was defined as the ratio of the sensor’s air resistance to the target gas resistance, ie Rg/Ra. All of the tests were performed in an environment with a humidity of 30%.
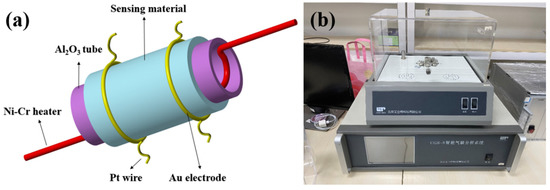
Figure 1.
(a) Schematic diagram of fabricated gas sensor; (b) DGL-III Gas and Liquid Distribution System.
3. Results and Discussion
X-ray diffraction (XRD) (PANalytical B.V., Almelo, The Netherlands) was used to determine the crystal structure of the samples. Figure 2 shows the XRD pattern of NiO-P, NiO-N, and NiO-S. The diffraction patterns of the three kinds of NiO showed no peaks related to other compounds except NiO. It meant that the obtained samples were pure NiO. All of their diffraction peaks matched the standard card (PDF#47-1049), and these peaks correspond to the (111), (200), (220), (311), and (222) planes of NiO. It could be seen that the noise of the NiO-N diffraction pattern was relatively large, and the peaks corresponding to the (311) and (222) crystal planes were inconspicuous because the crystallinity of this sample was poor. On the other hand, the peaks of NiO-P and NiO-S were sharp, indicating good crystallinity.
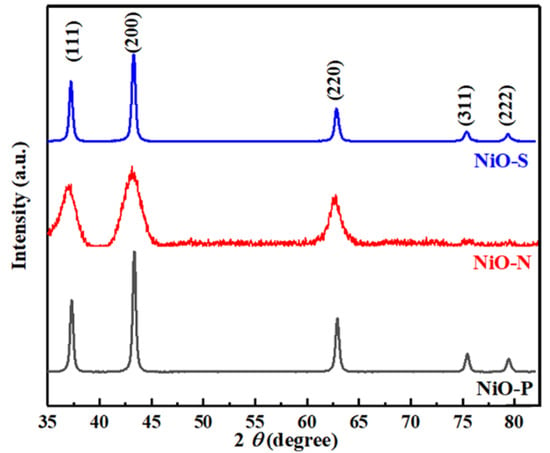
Figure 2.
The XRD pattern of NiO-P, NiO-N, and NiO-S.
A scanning electron microscope (SEM)(JEOL Ltd., Tokyo, Japan) was utilized to study the surface micromorphology of the NiO hollow spheres. Figure 3 shows the SEM of NiO-P, NiO-N, and NiO-S. It could be seen that all of the obtained NiO spheres were hollow. Among them, the size of NiO-P was relatively non-uniform, and the diameter of the spheres was 1–4 μm. At the same time, NiO-P was composed of many small particles, leading to a porous structure on its surface. This porous structure facilitated the diffusion of gases. The size of NiO-N was uniform, and the diameter of the spheres was ~1 μm. The surface was smoother than NiO-P and NiO-S. The diameter of the NiO-S spheres was about 2 μm, and the overall shape of the spheres was inapparent. Its outer shell was made up of densely packed nanosheets, which enlarged the adsorption sites of gas molecules. Moreover, it is beneficial to gas-sensing reactions. The different surface morphologies of NiO-P, NiO-N, and NiO-S might greatly affect the sensitive performance of the gas sensors.
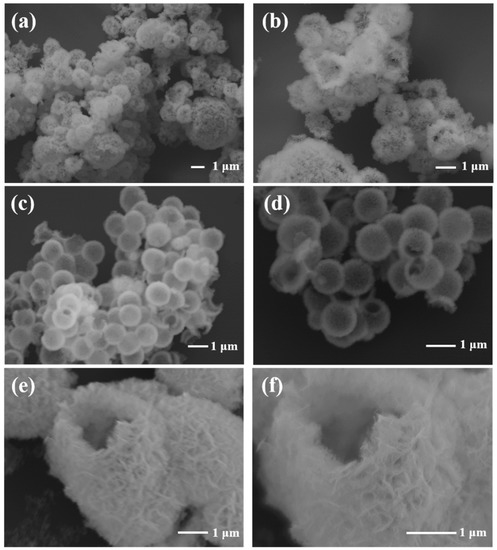
Figure 3.
The SEM of (a,b) NiO-P; (c,d) NiO-N; (e,f) NiO-S.
A transmission electron microscope (TEM)) (ThermoFisher Scientific, Waltham, MA, U.S.) was used to further analyze the microscopic morphology of the NiO hollow spheres. As shown in Figure 4a,b, the NiO-P was indeed composed of a large number of particles, and the walls of the hollow spheres were thicker. From Figure 4c,d, it could be seen that the surface of NiO-N was not smooth but consisted of upright nanoneedles with thin hollow sphere walls. The NiO-S hollow spheres composed of nanosheets had the thickest walls and the smallest hollow cavities, as shown in Figure 4e,f. To study the elemental distribution of the samples, we tested their EDS pattern. Figure 5 depicts the energy dispersive spectrometer (EDS) pattern of (a,b) NiO-P, (c,d) NiO-N, and (e,f) NiO-S. The pattern showed that Ni and O elements were highly uniformly distributed.
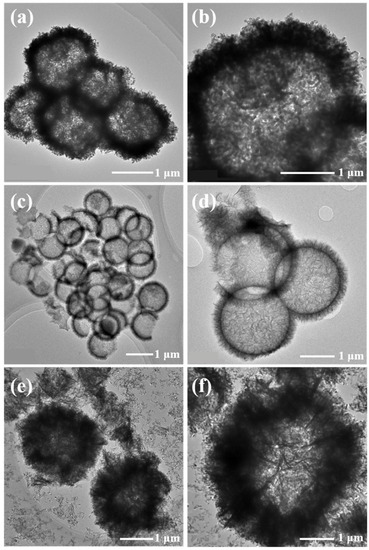
Figure 4.
The TEM of (a,b) NiO-P, (c,d) NiO-N, (e,f) NiO-S.
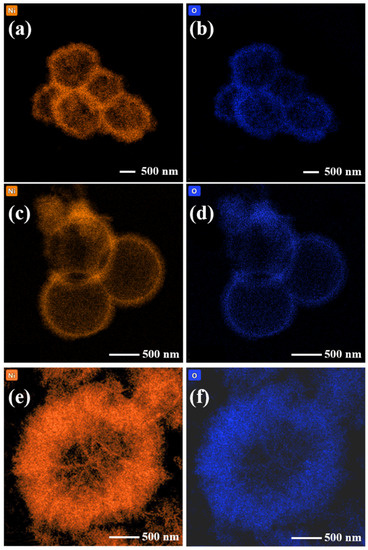
Figure 5.
The EDS of (a,b) NiO-P, (c,d) NiO-N, (e,f) NiO-S.
The X-ray photoelectron spectroscopy (XPS) (ThermoFisher Scientific, MA, U.S.) survey scans of the photoelectron peaks for NiO-P, NiO-N, and NiO-S are depicted in Figure 6. Figure 6a–c show the diffraction peaks of O 1s, which were deconvoluted into three peaks, respectively. The peaks of NiO-P were located at 529.5 eV, 532.1 eV, and 533.7 eV; the peaks of NiO-N were located at 529.3 eV, 530.6 eV, and 532.2 eV; the peaks of NiO-S were located at 529.5 eV, 531.2 eV, and 532.8 eV. The three peaks obtained by convolution corresponded to lattice oxygen (OL), oxygen vacancy (OV), and chemisorbed oxygen (OC), respectively. These oxygen species have been reported to be instrumental in gas-sensing properties [38]. OV affected the carrier concentration, resulting in changes in resistance [34]. In addition, oxygen vacancies could also trap gas molecules, which meant more electron exchange, resulting in a larger gas response. Table 1 shows the binding energies of O 1s of the three convolution peaks. Figure 6d–f show the diffraction peaks of Ni 2P. The spectrum of Ni 2p could be convoluted into six peaks, and the two peaks around the binding energies at ~863 eV and ~880 eV were satellite peaks of Ni. The convolution peaks at ~854 eV and ~856 eV are the spin-orbit-coupling split peaks of Ni 2p3/2, corresponding to Ni2+ and Ni3+. The convolution peaks with binding energies at ~872 eV and ~875 eV are the spin-orbit-coupling split peaks of Ni 2p1/2, which also correspond to Ni2+ and Ni3+. The obtained results were consistent with the reference [39,40,41]. Table 2 depicts the binding energies of Ni 2p. It has been reported that larger Ni3+/Ni2+ meant higher electronic performance, leading to better gas sensing performance [42]. Table 3 depicts the ratio of Ni2+ and Ni3+ of NiO-P, NiO-N, and NiO-S. The Ni3+/Ni2+ of NiO-P, NiO-N, and NiO-S were 0.94, 0.94, and 1.03, respectively. NiO-S obtained the largest ratio, which meant that the best sensitivity performance could have been obtained.
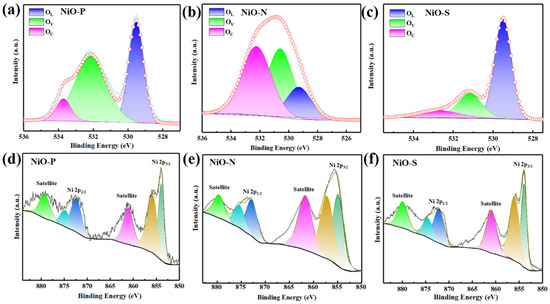
Figure 6.
The O 1s XPS spectra of (a) NiO-P, (b) NiO-N, (c) NiO-S; the Ni 2p XPS spectra of (d) NiO-P, (e) NiO-N, (f) NiO-S.

Table 1.
The O 1s binding energy of NiO-P, NiO-N, and NiO-S.

Table 2.
The Ni 2p binding energy of NiO-P, NiO-N, and NiO-S.

Table 3.
The ratio of Ni2+ and Ni3+ of NiO-P, NiO-N, and NiO-S.
To further investigate the specific surface area and porosity of the samples, N2 adsorption-desorption tests were performed. Figure 7 shows the N2 adsorption and desorption isotherms and pore-size distribution curves (insert) of NiO-P, (b) NiO-N, and NiO-S. From the figure, we could see that all three samples showed type IV in IUPAC type with H3 hysteresis loop. By calculation, the specific surface areas of NiO-P, NiO-N, and NiO-S were 29.75 m2/g, 49.35 m2/g, and 55.2 m2/g, respectively. The relevant data on the specific surface area, mesopore volume, and the average pore size are presented in Table 4. However, we could notice that NiO-N with the largest pore volume and average pore size did not obtain the largest specific surface area. This might be because the two-dimensional structure of NiO-S enabled it to obtain a larger surface area than the other two materials. The high specific area increased the adsorption sites for oxygen and ethanol molecules, making the material more responsive. Therefore, the NiO-S with the largest specific surface area might possess the largest ethanol response.

Figure 7.
N2 adsorption and desorption isotherms and pore-size distribution curves (insert) of (a) NiO-P, (b) NiO-N, (c) NiO-S.

Table 4.
The Surface area, pore volume and average pore size of NiO-P, NiO-N, and NiO-S.
Figure 8 shows a schematic diagram of the formation process of NiO-P, NiO-N, and NiO-S. During the preparation of NiO-P, carbon balls were used as templates. The urea was hydrolyzed to generate NH4+, HCO3−, and OH− during the preparation. The generated OH− combined with the Ni2+ in the solution to form Ni(OH)2, which was attached to the carbon balls by coulomb force and grew. During calcination, Ni(OH)2 is oxidized to obtain NiO. At the same time, the carbon balls were removed, and the NiO became hollow spheres. During the preparation of NiO-N, SiO2 spheres were used as templates. The SiO2 treated with APTES was positively charged, attracting Ni(OH)2 to adsorb on the SiO2 spheres. Due to the influence of the positive charge, Ni(OH)2 grew into a nanowire shape in a certain direction. Finally, the SiO2 sphere templates were etched by NaOH to obtain NiO hollow spheres. During the preparation of NiO-S, no hard template was added. Under the action of high temperature and high pressure, urea formed microbubbles, and Ni(OH)2 generated by the reaction with Ni2+ and OH− was driven by the decreasing interface energy and adhered to the surface of microbubbles. At the same time, adjacent Ni(OH)2 aggregated to form sheets on the plane. Finally, the bubbles burst under high temperature and high pressure to form NiO hollow spheres assembled by nanosheets.
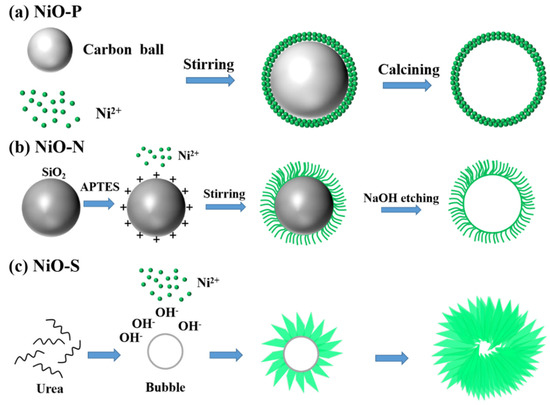
Figure 8.
Schematic diagram of the formation process of (a) NiO-P, (b) NiO-N, (c) NiO-S.
Temperature is extremely important for gas detection. The occurrence of the gas-sensing reaction requires additional energy to promote, and thermal energy is used as the energy. Figure 9 shows the gas response of different NiO sensors to 200 ppm of ethanol at 150~450 °C. All three sensors exhibited a classic “volcano-like” curve. From 150 to 350 °C, the gas response increased gradually with the increase in temperature. At 350 °C, the gas response hit the top, indicating that 350 °C was the optimal working temperature of the NiO hollow sphere sensors. At this time, the gas responses of NiO-P, NiO-N, and NiO-S to 100 ppm ethanol were 29.8, 34.4, and 38.4, respectively. When the temperature exceeded 350 °C, the gas response decreased gradually. This trend of rising first and then falling was because, in the low-temperature region, the increased temperature provided more energy to promote the reaction, while in the high-temperature region, the temperature simultaneously promoted the desorption of gas molecules, which reduced the gas response. From the figure, we could draw the conclusion that the NiO hollow spheres assembled from nanosheets had the largest gas response.
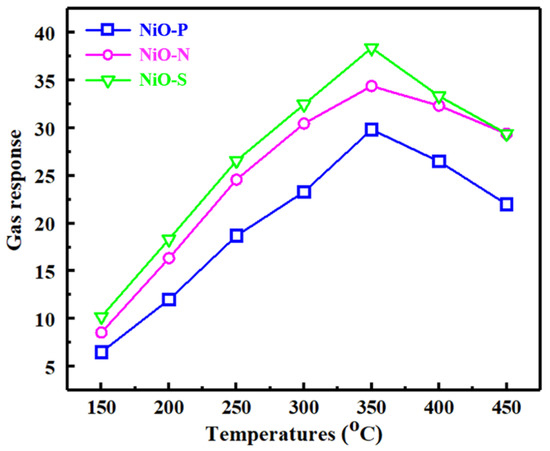
Figure 9.
Gas response of NiO at 200 ppm as a function of temperature.
Figure 10 shows the dynamic response curves of NiO-P, NiO-N, and NiO-S in (a–c) the range of ethanol concentration from 10 to 90 ppm and (d–f) 100 to 700 ppm. All of the samples showed good response/recovery characteristics, with short response/recovery times. It was the fast detection of ethanol and resistance back to baseline. Figure 11 shows the gas response of NiO at 350 °C as a function of the concentration range of 10~90 ppm and the concentration range of 100~700 ppm. It could be observed that the gas sensors based on three NiO hollow spheres exhibited the gas-sensing behavior of classical p-type semiconductors. As the ethanol concentration increased, the responses of all of the samples increased. In the region of high ethanol concentration, the relationship between concentration and gas response was almost linear. Compared with NiO-P and NiO-N, the NiO-S assembled nanosheets exhibited a significantly higher gas response, consistent with Figure 9. The gas response also did not flatten out when the ethanol concentration was 700 ppm. Furthermore, there was still a clear response at 10 ppm ethanol concentration. This showed that the gas sensor of the NiO hollow spheres had a wide working range, which was beneficial to the application of the sensors in various scenarios.
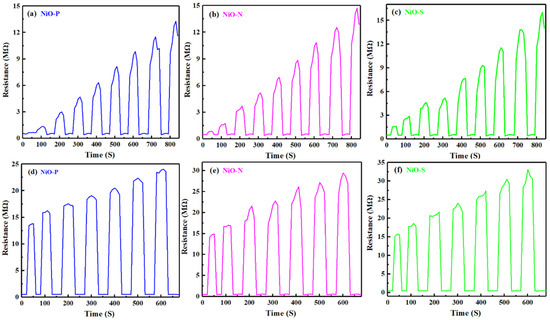
Figure 10.
Dynamic response curves of NiO-P, NiO-N, and NiO-S in the range of ethanol concentration from (a–c) 10 to 90 ppm; (d–f) 100 to 700 ppm.
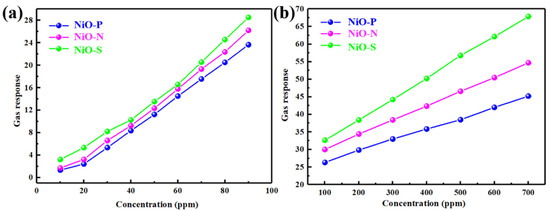
Figure 11.
At 350 °C, gas response of NiO as a function of (a) the concentration range of 10~90 ppm, (b) the concentration range of 100~700 ppm.
Stability is crucial for the preparation of sensitive materials into devices, which is related to the lifetime and performance stability of the devices. Figure 12 shows the reversibility of (a) NiO-P, (b) NiO-N, and (c) NiO-S. We tested eight response–recovery cycles for each sample. It could be seen that the NiO hollow spheres had good stability and reproducibility, and the gas response values for eight cycles were almost unchanged. At the same time, after the removal of ethanol gas, the gas response could still return to the baseline position. Compared to other one-dimensional and two-dimensional structures, this stability might be attributed to the spherical structure, which was relatively stable and not easily collapsed. This structural stability ultimately led to the stabilization of the sensitive properties. The different surfaces of the spherical structures caused their gas responses to be different.

Figure 12.
Of (a) NiO-P, (b) NiO-N, (c) NiO-S at 350 °C to 200 ppm ethanol.
Table 5 lists the comparison of the gas response of the ethanol sensor obtained in this study with the responses reported in other literature. This table shows that the sensors obtained in this work outperformed previously reported NiO-based gas sensors. However, our performance still fell short compared to other material-based sensors. In addition, our operating temperature was not dominant, and the operating temperature was still high, which is not conducive to low-cost gas detection. In future work, NiO hollow spheres can be combined with other materials to maximize their advantages.

Table 5.
Gas sensing performance of ethanol sensors based on different sensitive materials.
4. Gas-Sensing Mechanism
When the p-type NiO was placed in the air, the surrounding O2 adsorbed on the semiconductor surface and reacted with it. After electron transfer, O2 became negatively charged oxygen species (O2−, O−, O2−), and a hole accumulation layer (HAL) was formed. When NiO was placed in ethanol gas, the ethanol molecules exchanged electrons with oxygen species, releasing electrons captured from the inside of the material. At this time, the HAL of NiO became thinner, and the migration of electrons caused the resistance to change. Figure 13 shows the schematic diagram of the gas sensing mechanism.
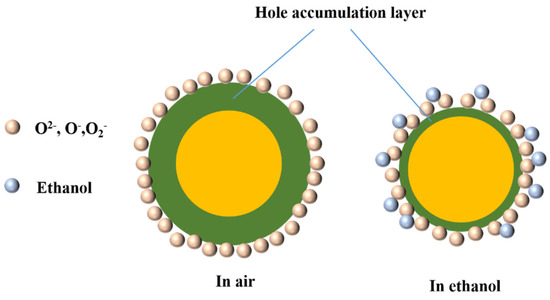
Figure 13.
Schematic diagram of the gas sensing mechanism.
The hollow sphere with two reaction layers brought about a greater response to NiO, while the inner cavity acted as a reaction chamber to promote the gas-sensing reaction. The NiO hollow spheres studied in this paper had different surface morphologies, including that the surfaces were nanoparticles, nanoneedles, and nanosheets. From the above discussion, it could be known that the NiO hollow spheres assembled from nanosheets had the highest gas response value, which was ascribed to the hierarchical structure of the nanosheets and the largest specific surface area of NiO-S. The unique two-dimensional structure of the nanosheets could attract more gas molecules to adsorb and react, and electrons could be transported along the sheet surface. At the same time, the fluffy structure created conditions for ethanol molecules to enter the interior. From the XPS results, NiO-S had the highest Ni3+/Ni2+ ratio, and a higher ratio meant that more adsorbed oxygen reacted with NiO. The electrons captured by oxygen oxidized Ni2+ to Ni3+, generating more electron holes and leading to more excellent sensitivity performance [21]. For NiO-P, the boundaries of the nanoparticles hindered the transport of electrons, resulting in a smaller gas response. The nanoneedles of NiO-N provided transport channels for electrons, but their ability to adsorb ethanol molecules was not as good as that of nanosheets. In conclusion, the NiO hollow spheres assembled from nanosheets had the largest gas response value.
5. Conclusions
This article reported the ethanol sensing performance of NiO hollow spheres assembled of nanoparticles, nanoneedles, and nanosheets. Compared with other hollow spheres synthesized in this study, the hollow spheres (NiO-S) assembled from nanosheets obtained the best ethanol gas sensing performance. NiO-S provided a large response value (38.4) at 350 °C to 200 ppm ethanol, and it had good stability and reproducibility. The nanosheet structure and fluffy surface of NiO-S were beneficial for the sensor to adsorb more gas in an ethanol atmosphere. This structure brought the largest specific surface area (55.20 m2/g), leading to more active sites for the adsorption of ethanol and NiO. In addition, the excellent sensing performance could be ascribed to the larger Ni3+/Ni2+ of NiO-S, which achieved better electronic properties. NiO-P and NiO-N also had high stability and could return to baseline after cycling with little difference in gas response. Furthermore, in terms of commercial production, the template-free preparation of NiO-S eliminated one step, saving time and cost. Therefore, NiO-S-based sensors could serve as candidates for ethanol sensing.
Author Contributions
Investigation, Experiments, Data processing, Writing-Original draft preparation, Q.L.; Reviewing, W.Z. and Z.W.; Editing, W.Z. and Q.Z.; Supervision, W.Z.; Conceptualization and Methodology, Q.Z.; Resources, Z.W. All authors have read and agreed to the published version of the manuscript.
Funding
This work was funded by Graduate Research and Innovation Foundation of Chongqing, China (Grant No. CYS22003).
Conflicts of Interest
The authors declare no conflict of interest.
References
- Pathak, A.K.; Viphavakit, C. A review on all-optical fiber-based VOC sensors: Heading towards the development of promising technology. Sens. Actuators A Phys. 2022, 338, 113455. [Google Scholar] [CrossRef]
- Du, L.; Sun, H. Facile synthesis of ZnO/SnO2 hybrids for highly selective and sensitive detection of formaldehyde. N. J. Chem. 2022, 46, 5573–5580. [Google Scholar] [CrossRef]
- Zhu, L.; Wang, J.; Liu, J.; Xu, Z.; Nasir, M.S.; Chen, X.; Wang, Z.; Sun, S.; Ma, Q.; Liu, J.; et al. In situ enrichment amplification strategy enabling highly sensitive formaldehyde gas sensor. Sens. Actuators B Chem. 2022, 354, 131206. [Google Scholar] [CrossRef]
- Majder-Lopatka, M.; Wesierski, T.; Dmochowska, A.; Salamonowicz, Z.; Polanczyk, A. The Influence of Hydrogen on the Indications of the Electrochemical Carbon Monoxide Sensors. Sustainability 2020, 12, 14. [Google Scholar] [CrossRef]
- Ren, P.; Qi, L.; You, K.; Shi, Q. Hydrothermal Synthesis of Hierarchical SnO2 Nanostructures for Improved Formaldehyde Gas Sensing. Nanomaterials 2022, 12, 228. [Google Scholar] [CrossRef]
- Zhang, Y.; Han, S.; Wang, M.; Liu, S.; Liu, G.; Meng, X.; Xu, Z.; Wang, M.; Qiao, G. Electrospun Cu-doped In2O3 hollow nanofibers with enhanced H2S gas sensing performance. J. Adv. Ceram. 2022, 11, 427–442. [Google Scholar] [CrossRef]
- John, R.A.B.; Shruthi, J.; Reddy, M.V.R.; Kumar, A.R. Manganese doped nickel oxide as room temperature gas sensor for formaldehyde detection. Ceram. Int. 2022, 48, 17654–17667. [Google Scholar] [CrossRef]
- Sima, Z.; Song, P.; Ding, Y.; Lu, Z.; Wang, Q. ZnSnO3 nanocubes/Ti(3)C(2)T(x) MXene composites for enhanced formaldehyde gas sensing properties at room temperature. Appl. Surf. Sci. 2022, 598, 153861. [Google Scholar] [CrossRef]
- Zhou, S.; Wang, H.; Hu, J.; Lv, T.; Rong, Q.; Zhang, Y.; Zi, B.; Chen, M.; Zhang, D.; Wei, J.; et al. Formaldehyde gas sensor with extremely high response employing cobalt-doped SnO2 ultrafine nanoparticles. Nanoscale Adv. 2022, 4, 824–836. [Google Scholar] [CrossRef]
- Fang, J.; Ma, Z.-H.; Xue, J.-J.; Chen, X.; Xiao, R.-P.; Song, J.-M. Au doped In2O3 nanoparticles: Preparation, and their ethanol detection with high performance. Mater. Sci. Semicond. Process. 2022, 146, 106701. [Google Scholar] [CrossRef]
- Rao, S.K.; Priya, A.K.; Kamath, S.M.; Abhinav, E.M.; Renganathan, B.; Jeyadheepan, K.; Gopalakrishnan, C. Unraveling the potential of Gd doping on mullite Bi2Fe4O9 for fiber optic ethanol gas detection at room temperature. Mater. Chem. Phys. 2022, 278, 125646. [Google Scholar] [CrossRef]
- Ahemad, M.J.; Le, T.D.; Kim, D.-S.; Yu, Y.-T. Bimetallic AgAualloy@ZnO core-shell nanoparticles for ultra-high detection of ethanol: Potential impact of alloy composition on sensing performance. Sens. Actuators B Chem. 2022, 359, 131595. [Google Scholar] [CrossRef]
- Akhtar, A.; Sadaf, S.; Liu, J.; Wang, Y.; Wei, H.; Zhang, Q.; Fu, C.; Wang, J. Hydrothermally synthesized spherical g-C3N4-NiCo2O4 nanocomposites for ppb level ethanol detection. J. Alloy. Compd. 2022, 911, 165048. [Google Scholar] [CrossRef]
- Yuan, G.; Zhong, Y.; Chen, Y.; Zhuo, Q.; Sun, X. Highly sensitive and fast-response ethanol sensing of porous Co3O4 hollow polyhedra via palladium reined spillover effect. RSC Adv. 2022, 12, 6725–6731. [Google Scholar] [CrossRef] [PubMed]
- Cheng, L.; Li, Y.; Cao, G.; Sun, G.; Cao, J.; Wang, Y. Boosting TEA sensing performance of ZnO porous hollow spheres via in situ construction of ZnS-ZnO heterojunction. Sens. Actuators B Chem. 2022, 364, 131883. [Google Scholar] [CrossRef]
- Yao, C.; Wu, L.; Li, H.; Xu, N.; Sun, J.; Wu, J. WS2 coating and Au nanoparticle decoration of ZnO nanorods for improving light-activated NO2 sensing. Appl. Surf. Sci. 2022, 584, 152508. [Google Scholar] [CrossRef]
- Huang, C.; Lv, S.; Gao, A.; Ling, J.; Yi, F.; Hao, J.; Wang, M.; Luo, Z.; Shu, D. Boosting the energy density of supercapacitors by designing both hollow NiO nanoparticles/nitrogen-doped carbon cathode and nitrogen-doped carbon anode from the same precursor. Chem. Eng. J. 2022, 431, 134083. [Google Scholar] [CrossRef]
- Ding, Y.; Cai, Y.; Li, P.; Gu, S.; Song, S.; Guan, J.; Shen, Y.; Han, Y.; He, W. Recyclable regeneration of NiO/NaF catalyst: Hydrogen evolution via steam reforming of oxygen-containing volatile organic compounds. Energy Convers. Manag. 2022, 258, 115456. [Google Scholar] [CrossRef]
- Kotta, A.; Seo, I.; Shin, H.-S.; Seo, H.-K. Room-temperature processed hole-transport layer in flexible inverted perovskite solar cell module. Chem. Eng. J. 2022, 435, 134805. [Google Scholar] [CrossRef]
- Kim, K.H.; Kim, T.; Choi, Y.S.; Lee, W.; Choi, W.; Yoon, J.; Park, J.S.; Kwon, Y.; Yoon, W.-S.; Kim, J.M. Revealing the unconventional lithium storage mechanism of ordered mesoporous NiO for lithium-ion batteries. J. Power Sources 2022, 526, 231135. [Google Scholar] [CrossRef]
- Li, C.; Choi, P.G.; Kim, K.; Masuda, Y. High performance acetone gas sensor based on ultrathin porous NiO nanosheet. Sens. Actuators B Chem. 2022, 367, 132143. [Google Scholar] [CrossRef]
- Qiu, T.; Luo, N.; Guo, M.; Cai, H.; Cheng, Z.; Xu, J. Synthesis and Enhanced H2S Sensing Properties of V2O3-NiO Nanoflower Assembled by Porous Nanosheets. J. Electrochem. Soc. 2022, 169, 037504. [Google Scholar] [CrossRef]
- Zhang, Z.; Liang, Q.; Li, J.; Liang, X.; Yang, L.; Zhang, Q.; Zou, X.; Chen, H.; Li, G.-D. Electronic and morphological dual modulation of NiO by indium-doping for highly improved xylene sensing. New J. Chem. 2022, 46, 3831–3837. [Google Scholar] [CrossRef]
- Juang, F.-R.; Hsieh, C.-H.; Huang, I.Y.; Wang, W.-Y.; Lin, W.-B.; Yen, L. Dispersed and spherically assembled porous NiO nanosheets for low concentration ammonia gas sensing applications. Solid-State Electron. 2022, 189, 108224. [Google Scholar] [CrossRef]
- Feng, S.; Yu, H.; Zhang, X.; Huo, L.; Gao, R.; Wang, P.; Cheng, X.; Major, Z.; Gao, S.; Xu, Y. Ionic liquid-assisted synthesis of 2D porous lotus root slice-shaped NiO nanomaterials for selective and highly sensitive detection of N2H4. Sens. Actuators B Chem. 2022, 359, 131529. [Google Scholar] [CrossRef]
- Sharma, P.; Kumar, S.; Vishwanadh, B.; Girija, K.G. Cost-effective synthesis of NiO nanoparticles and realization of highly selective NO2 sensors. Appl. Phys. A Mater. Sci. Process. 2022, 128, 630. [Google Scholar] [CrossRef]
- Liu, Y.; Bai, J.; Li, Y.; Yang, L.; Wang, Y.; Li, Y.; Liu, F.; Zhang, Y.; Lu, G. Preparation of PdO-decorated NiO porous film on ceramic substrate for highly selective and sensitive H2S detection. Ceram. Int. 2022, 48, 4787–4794. [Google Scholar] [CrossRef]
- Gupta, P.; Kumar, K.; Saeed, S.H.; Pandey, N.K.; Verma, V.; Singh, P.; Yadav, B.C. Influence of tin doping on the liquefied petroleum gas and humidity sensing properties of NiO nanoparticles. J. Mater. Res. 2022, 37, 369–379. [Google Scholar] [CrossRef]
- Sudha, S.; Ramprasath, R.; Cholan, S.; Gokul, B.; Sridhar, S.; Ali, H.E.; Shkir, M. Enhanced triethylamine gas sensing and photocatalytic performance of Sn doped NiO (SNO) nanoparticles. Inorg. Chem. Commun. 2022, 136, 109104. [Google Scholar] [CrossRef]
- Pan, H.; Li, Z.; Lou, C.; Lei, G.; Xie, J.; Zheng, W.; Liu, X.; Zhang, J. Anchoring Fe2O3 nanosheets on NiO nanoprisms to regulate the electronic properties for improved n-butanol detection. Sens. Actuators B Chem. 2022, 354, 131223. [Google Scholar] [CrossRef]
- Wang, D.; Mi, Q.; Zhang, H.; Li, G.; Zhang, D. Sensitive Xylene Gas Sensor Based on NiO-NiCo2O4 Hierarchical Spherical Structure Constructed With Nanorods. IEEE Sens. J. 2022, 22, 10346–10352. [Google Scholar] [CrossRef]
- Selvaraj, B.; Rayappan, J.B.B.; Babu, K.J. Room temperature ZnO/NiO heterostructure sensing response: A breath biomarker sensor. J. Alloy. Compd. 2022, 914, 165224. [Google Scholar] [CrossRef]
- Patil, P.; Nakate, Y.T.; Ambare, R.C.; Ingole, R.S.; Kadam, S.L.; Nakate, U.T. 2-D NiO nanostructured material for high response acetaldehyde sensing application. Mater. Lett. 2021, 293, 129757. [Google Scholar] [CrossRef]
- Zhang, S.; Zhang, B.; Zhang, B.; Wang, Y.; Bala, H.; Zhang, Z. Structural evolution of NiO from porous nanorods to coral-like nanochains with enhanced methane sensing performance. Sens. Actuators B Chem. 2021, 334, 129645. [Google Scholar] [CrossRef]
- Hu, Q.; Wang, Z.; Chang, J.; Wan, P.; Huang, J.; Feng, L. Design and preparation of hollow NiO sphere- polyaniline composite for NH3 gas sensing at room temperature. Sens. Actuators B Chem. 2021, 344, 130179. [Google Scholar] [CrossRef]
- Zhang, C.; Huan, Y.; Li, Y.; Luo, Y.; Debliquy, M. Low concentration isopropanol gas sensing properties of Ag nanoparticles decorated In2O3 hollow spheres. J. Adv. Ceram. 2022, 11, 379–391. [Google Scholar] [CrossRef]
- Li, Q.; Zeng, W.; Li, Y. Core-shell NiO Sphere Prepared by a Facile Method with Enhanced VOC Gas Sensing. J. Electrochem. Soc. 2022, 169, 067508. [Google Scholar] [CrossRef]
- Wang, S.-C.; Wang, X.-H.; Qiao, G.-Q.; Chen, X.-Y.; Wang, X.-Z.; Wu, N.-N.; Tian, J.; Cui, H.-Z. NiO nanoparticles-decorated ZnO hierarchical structures for isopropanol gas sensing. Rare Met. 2022, 41, 960–971. [Google Scholar] [CrossRef]
- Mokoena, T.P.; Swart, H.C.; Hillie, K.T.; Tshabalala, Z.P.; Jozela, M.; Tshilongo, J.; Motaung, D.E. Enhanced propanol gas sensing performance of p-type NiO gas sensor induced by exceptionally large surface area and crystallinity. Appl. Surf. Sci. 2022, 571, 151121. [Google Scholar] [CrossRef]
- Geng, W.-C.; Cao, X.-R.; Xu, S.-L.; Yang, J.-H.; Babar, N.; He, Z.-J.; Zhang, Q.-Y. Synthesis of hollow spherical nickel oxide and its gas-sensing properties. Rare Met. 2021, 40, 1622–1631. [Google Scholar] [CrossRef]
- Hu, Q.; Wu, C.; Dong, Z.; Zhang, G.; Ma, Z.; Wang, X.; Sun, S.; Xu, J. Direct confirmation of confinement effects by NiO confined in helical SnO2 nanocoils and its application in sensors. J. Mater. Chem. A 2022, 10, 2786–2794. [Google Scholar] [CrossRef]
- ul Haq, M.; Zhang, Z.; Wen, Z.; Khan, S.; Din, S.u.; Rahman, N.; Zhu, L. Humidity sensor based on mesoporous Al-doped NiO ultralong nanowires with enhanced ethanol sensing performance. J. Mater. Sci. Mater. Electron. 2019, 30, 7121–7134. [Google Scholar] [CrossRef]
- Yan, S.; Song, W.; Wu, D.; Jin, S.; Dong, S.; Hao, H.; Gao, W. Assembly of In2O3 nanoparticles decorated NiO nanosheets heterostructures and their enhanced gas sensing characteristics. J. Alloy. Compd. 2022, 896, 162887. [Google Scholar] [CrossRef]
- Lu, Y.; Ma, Y.H.; Ma, S.Y.; Jin, W.X.; Yan, S.H.; Xu, X.L.; Chen, Q. Curly porous NiO nanosheets with enhanced gas-sensing properties. Mater. Lett. 2017, 190, 252–255. [Google Scholar] [CrossRef]
- Li, X.Q.; Wei, J.Q.; Xu, J.C.; Jin, H.X.; Jin, D.F.; Peng, X.L.; Hong, B.; Li, J.; Yang, Y.T.; Ge, H.L.; et al. Highly improved sensibility and selectivity ethanol sensor of mesoporous Fe-doped NiO nanowires. J. Nanoparticle Res. 2017, 19, 396. [Google Scholar] [CrossRef]
- Majhi, S.M.; Naik, G.K.; Lee, H.-J.; Song, H.-G.; Lee, C.-R.; Lee, I.-H.; Yu, Y.-T. Au@NiO core-shell nanoparticles as a p-type gas sensor: Novel synthesis, characterization, and their gas sensing properties with sensing mechanism. Sens. Actuators B Chem. 2018, 268, 223–231. [Google Scholar] [CrossRef]
- Shao, Z.; Zhao, Z.; Chen, P.; Chen, J.; Liu, W.; Shen, X.; Liu, X. Enhanced ethanol response of Ti3C2TX MXene derivative coupled with NiO nanodisk. Inorg. Nano Met. Chem. 2022, 52, 1–9. [Google Scholar] [CrossRef]
- Singh, S.; Sharma, S. Temperature dependent selective detection of ethanol and methanol using MoS2/TiO2 composite. Sens. Actuators B Chem. 2022, 350, 130798. [Google Scholar] [CrossRef]
Publisher’s Note: MDPI stays neutral with regard to jurisdictional claims in published maps and institutional affiliations. |
© 2022 by the authors. Licensee MDPI, Basel, Switzerland. This article is an open access article distributed under the terms and conditions of the Creative Commons Attribution (CC BY) license (https://creativecommons.org/licenses/by/4.0/).