Article

SERS-TLC Device for Simultaneous Determination of Sulfamethoxazole and Trimethoprim in Milk

by
Frederico Luis Felipe Soares
1,2,
Benedito Roberto de Alvarenga Junior
1 and
Renato Lajarim Carneiro
1,*
1
Department of Chemistry, Federal University of São Carlos, Rod. Washington Luís km 235, São Carlos 13560-905, Brazil
2
Department of Chemistry, Federal University of Paraná, Avenida Coronel Francisco Heráclito dos Santos, 100, Curitiba 81531-980, Brazil
*
Author to whom correspondence should be addressed.
Chemosensors 2022, 10(12), 528; https://doi.org/10.3390/chemosensors10120528
Submission received: 19 October 2022 / Revised: 14 November 2022 / Accepted: 22 November 2022 / Published: 12 December 2022
(This article belongs to the Section Imaging for (Bio)chemical Sensing)

Abstract

:
The aim of this work is to develop a device based on thin-layer chromatography coupled with surface-enhanced Raman spectroscopy (TLC-SERS) to analyze sulfamethoxazole (SMX) and trimethoprim (TMP) in commercial milk samples using chemometric tools. Samples were eluted in TLC plates, and a central composite design (CCD) of two factors was performed to optimize the gold nanoparticle dispersion on TLC plates for SERS, aiming at the detection of both drugs at concentrations close to their maximum residual limits (MRLs). Following the optimization, hyperspectral images from the SERS were captured of the TLC plates. Multivariate curve resolution (MCR-ALS) and independent component analysis (ICA) chemometric techniques were used to extract the signals of the analytes. All the samples presented recovery values of 81–128% for TMP. The quantification of SMX was not possible due to SERS suppression by an interferent. However, it was possible to detect SMX at a concentration of two times the MRL (8.0 × 10⁻⁷ mol·L−1). The results demonstrate that the TLC-SERS device is a potential tool for the quantification of TMP and the detection of SMX in milk.

Graphical Abstract

1. Introduction

Sulfamethoxazole (SMX) and trimethoprim (TMP), shown in Figure 1, are two antibiotics largely used in human and veterinary drugs. The combination of both drugs, usually in a proportion of 5 SMX: 1 TMP, generates a synergic effect that enhances efficacy in the treatment of bacterial infections [1]. In veterinary settings, in addition to use for infection treatment, these drugs are commonly applied as a prophylactic treatment [2]. The improper use of these drugs can lead to their accumulation in products of animal origin, such as meat, eggs, and milk [3,4,5]. In Brazil, the maximum residual limits (MRLs) are the same as those established by the European Medicines Agency (EMA) and the United States Food and Drug Administration (FDA) [6]. For commercial milk, these agencies define MRLs of 100 μg·kg−1 and 50 μg·kg−1 for SMX and TMP, respectively [7]. Therefore, it is necessary to develop analytical methods that allow the determination and quantification of these drugs in complex samples at various concentrations of MRL.
Surface-enhanced Raman spectroscopy (SERS) is an analytical technique that enables analyte detection at very low concentrations in different sample matrices [8,9,10,11]. The signal enhancement effect occurs due to the interaction of the target molecule with metallic nanostructures, generating a plasmonic band that results in the enhancement of scattered photons in the order of 107 [12,13]. However, the analysis of complex matrices by SERS is limited because interferents also can interact with the nanostructures, making the obtention of SERS spectra from a target compound difficult [14].
As an alternative for minimizing the matrix effect, the use of SERS coupled with other analytical techniques for sample pretreatment or separation has been studied. These techniques allow the contouring of the main disadvantages of the SERS technique and permit the analysis of multiple analytes in complex samples [15,16]. Among the more frequently employed techniques, thin-layer chromatography (TLC) can be highlighted as a simple, fast, low-cost technique that allows the analysis of different samples with little or no sample pretreatment [17]. Only a few works have employed TLC-SERS as an analytical tool for quantification [18,19,20,21].
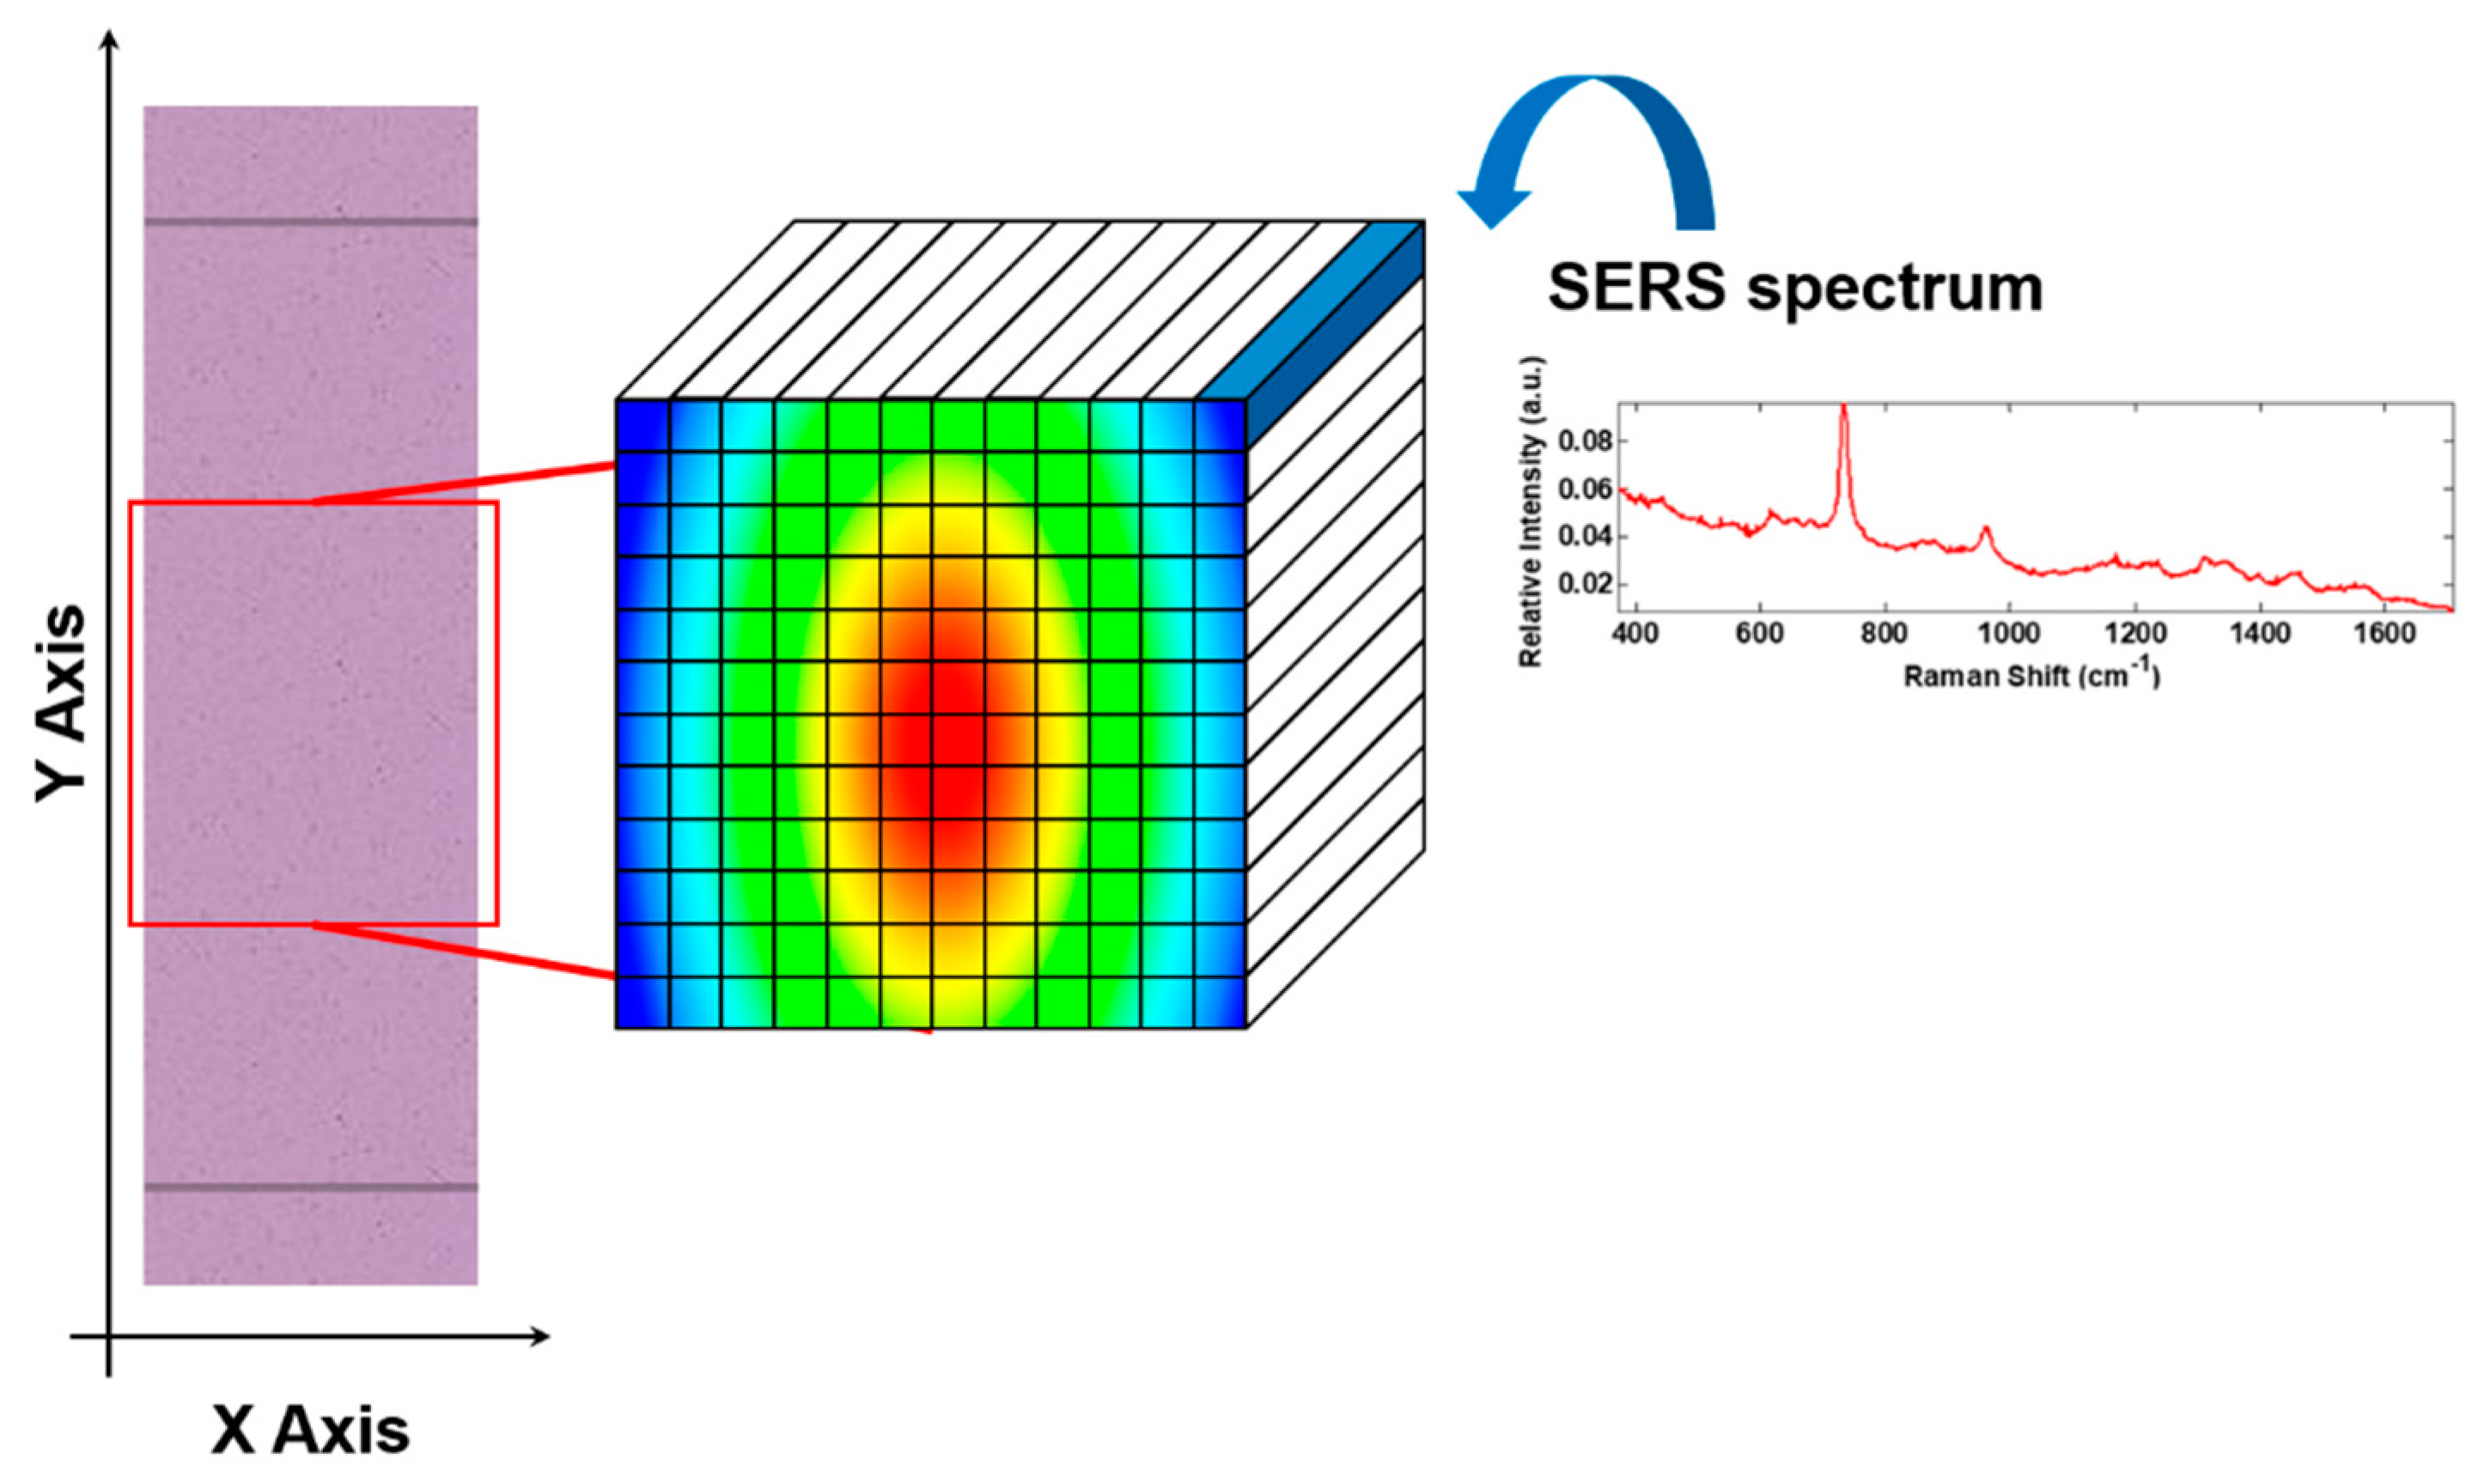
Instead of performing sample derivatization or using a UV chamber to detect analyte locations on a TLC, spatial measurements can be used to scan the TLC surface and detect the analyte separation band. Due to very low concentration of an analyte over a TLC, as well as weak Raman scattering, SERS needs to be used in order to increase Raman scattering. Therefore, Raman spectroscopy coupled to an imaging system is a powerful tool to perform such scanning after the dispersion of colloidal gold nanoparticles (AuNPs) on a TLC to obtain SERS spectra, allowing the obtention of a SERS-TLC hyperspectral image. Figure 2 presents a schematic representation of a hyperspectral image obtained from a TLC-SERS analysis, producing a cubic matrix of data (tensor) for each sample, with spectral dimensions of spatial x × spatial y × SERS [22]. The size of the tensor depends on the spatial resolution between the vicinal points where the SERS was obtained, as well as on the spectral resolution of the SERS spectrum.
In a hyperspectral image, each pixel refers to a spatial position on a spectrum and contains the spectral information of that position [23,24,25,26]. Therefore, each pixel in an image is represented by a SERS spectrum. This kind of approach enables the detection of chromatographic bands that are not possible to detect with usual revelation methods, such as the use of a UV chamber.
Each hyperspectral image generates huge amounts of data that need pretreatment and processing to highlight the most important information of the dataset. Although TLC plates are used for compound separation, in complex samples such as milk, there are regions of the chromatogram where it is not easy to obtain good resolution of the chromatographic bands, leading to coelution of the analyte of interest and interferents. Two chemometric methods have gained attention for performing the deconvolution of overlapped spectra: multivariate curve resolution with alternative least squares (MCR-ALS) and independent component analysis (ICA).
MCR-ALS is a chemometric tool for bilinear decomposition based on the extended Beer–Lambert law, where the data matrix (D) is decomposed into a relative concentration profile matrix (C) and a spectral profile matrix (S), as presented in Equation (1), where the E matrix corresponds to the data not modeled by the algorithm. Data decomposition occurs based on deconvolution of the superimposed signals present in the original data, and no prior knowledge about the individual spectral profiles of a system is need. Instead, some constraints are applied during the deconvolution process, such as non-negativity for spectral and concentration profiles. Through iterative methods of regression by alternating least squares, it is possible to obtain a matrix relative to the analytical signals containing the SERS spectrum of each component present in the mixture (also called the spectral profile) and a matrix corresponding to the relative concentrations of the components present in the sample (called the concentration profile). In hyperspectral data, a concentration profile matrix can be rebuilt in a concentration map to obtain the spatial distribution of an analyte. MCR-ALS is widely used for chemical-imaging analysis, and more information can be found in the literature [27,28,29,30,31].
D = C·ST + E
The MCR-ALS algorithm is based on three main steps. (1) Determination of the number of components presented in the mixture is usually performed using a principal component analysis, where the number of principal components required to explain the data is related to the number of different spectra (components) present in the original data. (2) For the initial estimation of either C or S, it is necessary to indicate an initial estimate to start the iteration of deconvolution, which can be either the concentration or the spectral profile. The initial estimate can be obtained from prior knowledge, such as the pure spectra of the components present in the sample, or from specific algorithms that estimate the purest spectra from the original data. (3) As the last step of the algorithm, the C and S matrices are optimized using alternate least squares.
ICA is a blind source separation algorithm that uses a central limit theorem to acquire the most independent signals (S) and their proportions (A) in a mixed data matrix (X) without previous knowledge of the data, as represented in Equation (2) [32,33]. Similar to MCR-ALS, proportions (A) are calculated based on the independent signals representing the intensity (concentration) of a spectrum recovered by the algorithm. There are several ways to calculate non-Gaussianity between the components and to achieve the statistical independence of the signals, such as kurtosis and negentropy. From the methods that use kurtosis to calculate the signals, one of the most used algorithms is the Joint Approximation Diagonalization of Eigen-matrices (JADE), which uses a matrix diagonalization calculation in a higher-order (fourth order) matrix computation. This results in an advantage over other methods by solving convergence problems caused by the incorrect choice of initial conditions in a more practical way, thus becoming a more robust algorithm. On the other hand, the calculation of this algorithm requires complex mathematical computation and higher statistics.
X = A·S
Differently from the MCR-ALS algorithm, the JADE method for ICA does not require an initial estimation of the spectral profile (S), but the proportions (A) are calculated at the end of the algorithm by multiplying the pseudo-inverse of the optimal S matrix by the original data (X). Therefore, for complex samples, the recovered spectra are usually more similar to the analyte when compared to the spectral profiles obtained by MCR-ALS. The relative concentration profiles (or proportions) recovered by both tools can be correlated with the real analyte concentration, generating a pseudo-univariate analytical tool.
It is important to observe that the concentrations and intensities recovered by MCR and ICA are called “relative” because the recovered intensities are related to the signal intensities of each compound, which are normalized. Two signals of different compounds at the same concentration can present very different intensities, and what is recovered by both algorithms are the normalized intensity and concentration values. Therefore, after deconvolution, it is necessary to correlate these relative concentrations with the real concentrations of the compounds using a calibration dataset to perform the quantification, generating a pseudo-univariate analytical curve.
This work aims to develop a low-cost and effective device to analyze SMX and TMP in commercial milk samples based on TLC-SERS hyperspectral imaging coupled with MCR-ALS and ICA chemometric tools for signal deconvolution.

2. Materials and Methods

2.1. Chemicals

SMX (>99.0%) and TMP (>98.5%) powder standards were purchased from Jayusion (Wuhan, China). Trisodium citrate dihydrate (C6H5Na3O7·2H2O) was obtained from J.T.Baker Chemical Co. (Phillipsburg, NJ, USA), magnesium sulfate (MgSO4) from Synth (Diadema, Brazil), sodium acetate (NaC2H3O2) from Synth, ethylenediaminetetraacetic acid disodium salt dihydrate (Na2EDTA·2H2O) from Synth, and glacial acetic acid (C2H4O2) from J.T.Baker Chemical Co. All reactants were of P.A. grade. Ultrapure-grade (99.999 %) chloroauric acid (HAuCl4) was obtained from Sigma Aldrich (Saint Louis, MO, USA). TLC separation was performed on Allugram Xtra SIL G thin-layer chromatographic plates from Macherey-Nagel (Dueren, Germany) with silica gel 60 of 200 µm in thickness and a fluorescent marker at 254 nm. Solvents, ethyl acetate, acetonitrile, and methanol were obtained from J.T.Baker Chemical Co and were of HPLC grade. Aqueous solutions were prepared using ultrapure water (18.2 MΩ·cm−1) provided by a Mili-Q system (Millipore, Bedford, MA, USA).

2.2. Nanoparticle Synthesis

Gold nanoparticles (AuNPs) were synthetized following a modified Lee–Meisel method [34]. Briefly, around 48 mg HAuCl4 was dissolved in 100 mL ultrapure water. This solution was heated to 85 °C. Next, 10 mL 1% C6H5Na3O7·2H2O solution was added to the HAuCl4 solution. The synthesis was removed from heat after 4 min and allowed to stand at room temperature.

2.3. Preparation of Solutions and Samples

Stock solutions of SMX and TMP were prepared at 1 × 10⁻³ mol·L−1 in methanol. From the stock solutions, standard solutions for the calibration curves were prepared at the following concentrations: for SMX, 2.50 × 10⁻⁶, 5.00 × 10⁻⁶, 1.00 × 10⁻⁵, 2.50 × 10⁻⁵, 1.00 × 10⁻⁴, and 5.00 × 10⁻⁴ mol·L−1; for TMP, 1.00 × 10⁻⁷, 2.50 × 10⁻⁷, 5.00 × 10⁻⁷, 1.00 × 10⁻⁶, 2.25 × 10⁻⁶, and 3.75 × 10⁻⁶ mol·L−1.
Milk samples A, B, and C from three different companies were purchased from local markets. Samples were spiked with stock solutions according to the intended concentration. Three spiking levels were evaluated: without spiking (S0), spiking to the MRL (approximately 1.7 × 10⁻⁷ mol·L−1 for TMP and 4.0 × 10⁻⁷ mol·L−1 for SMX) (S1), and spiking to 2 times the MRL (approximately 3.4 × 10⁻⁷ mol·L−1 for TMP and 8.0 × 10⁻⁷ mol·L−1 for SMX) (S2). The concentrations of analytes in spiked milk samples were lower than the concentrations in the calibration samples because the milk samples underwent an extraction–preconcentration process. The QuEChERS (quick, easy, cheap, effective, rugged, and safe) method was used for the extraction of the analytes [35,36]. For this, 20 g of each sample was added to a polypropylene tube. After, 20 mL acetonitrile, 20 mL aqueous Na2EDTA solution (0.1 mol·L−1), and 0.2 mL 5% acetic acid solution were added. Tubes were manually shaken for 15 min. Later, 8 g anhydrous MgSO4 and 2 g anhydrous NaC2H3O2 were added. Mixtures were manually shaken for 15 min and centrifuged for 15 min at 12,000 rpm. After centrifugation, 4 mL of the supernatant (acetonitrile phase) was dried in N2 and resuspended in 0.5 mL methanol.

2.4. TLC-SERS Device Procedure

TLC plates were manually cut at dimensions of 50 mm in length and 25 mm in width. For each plate, 4 µL of each standard solution (or extracted sample) was added 5 mm from the bottom of the TLC plate. Each run was performed in triplicate on the same TLC plate, where samples were distanced from each other by 5 mm. Elution was performed on 40 mm of the TLC plates using the mobile phase recommended by the Global Pharmaceutical Health Fund (GPHF) [37]: ethyl acetate (HPLC-grade, J.T.Baker): methanol (HPLC-grade, J.T.Baker) (75:15 v/v). Initially, a UV lamp (254 nm) was used to evaluate the TLC plates; later, gold nanoparticle colloidal solution was dispersed on the TLC plates using a previously described device [38].
SERS spectra were acquired using an i-Raman BWS 415-785H instrument (B&WTek, Newark, DE, USA) with a laser at 785 nm and a spectral resolution of 3.5 cm−1. An equipment probe (BAC102) with a laser spot of 85 µm was placed over an XY-imaging stage. The spectra were acquired using 60 s of integration time and a laser power of 63 mW. Hyperspectral imaging was obtained covering the elution area of the TLC plates (40 mm length and 25 mm width) with pixel intervals of 1 mm. The spectral range was from 280 to 1900 cm−1. At the end of each measurement, the TLC plates resulted in hyperspectral images of 25 pixels on the X-axis and 40 pixels on the Y-axis with a total of 1000 spectra for each TLC plates, and each spectrum represented 950 wavenumbers.

2.5. Analysis Optimization

A central composite design (CCD) of two factors was performed to optimize SERS acquisition and to allow the detection of both drugs close to the MRL levels. The effect of NaCl was evaluated by adding 2 μL of different concentrations of NaCl solution to 100 μL of the AuNP colloidal solution before dispersing the nanoparticles on the TLC plates. The AuNP preconcentration was assessed by centrifuging 1 mL of the synthesized nanoparticles at 5000 rpm for 30 min and removing different volumes of supernatant. Table 1 shows the CCD table and the SERS intensity obtained for each experiment.
For each experiment, a solution containing SMX (5.00 × 10⁻⁴ mol·L−1) and TMP (1.00 × 10⁻⁴ mol·L−1) was eluted on the TLC plates. The AuNP colloidal solution was prepared according to the experimental conditions of the CCD and dispersed on the eluted TLC plates. Hyperspectral images were captured, and the results were calculated using the sum of the Raman scattering intensities from all the locations. For optimization, the wavenumbers of 687 cm−1 for SMX and 1325 cm−1 for TMP were monitored.
In addition, the pH of the mobile phase was evaluated because, by altering solution pH, it is possible to alter the molecule adsorption mode on a nanoparticle surface and to intensify or suppress SERS [39]. Thus, three pH conditions were evaluated based on the addition of 150 μL of 0.1 mol·L−1 HCl, 150 μL of 0.1 mol·L−1 NaOH, or 150 μL of ultrapure water.

2.6. Chemometric Methods

Each TLC plate generated a hyperspectral image in tensor form X ¯ of the dimensions n, m, and k, where n is the number of pixels on the X-axis, m is the number of pixels on the Y-axis, and k is the number of variables (wavenumbers) acquired in one SERS spectrum. Each hyperspectral image of each sample was unfolded using the pixel method, generating an augmented matrix (Xaug) of n × m by k. The augmented matrices of all the samples were combined in a single matrix of i × n × m by k, where i is the number of analyzed samples. The numbers of pixels in the X and Y directions (map size) were determined based on preliminary tests of the chromatographic band size on the TLC plates. Data were pretreated, aiming to emphasize the relevant chemical information in the spectra. For this, spectral ranges were selected for each analyte (373–1052 cm−1 for SMX and 1052–1640 cm−1 for TMP) and moving average smoothing (window n = 5) was performed. MCR-ALS was performed using the MCR 2.0 GUI toolbox [40]. The number of components for MCR-ALS was selected based on the normalized eigenvalues calculated by singular value decomposition (SVD). The purest spectra from the dataset were determined with the PURE function and used to initialize the ALS algorithm. A non-negativity constraint was used for both the spectra and profile matrices. ICA was performed based on the JADE algorithm, and the optimal number of ICs was selected based on a random ICA using a blocks approach [41].
Analytical curves to quantify both drugs were obtained through the correlation of concentrations of standard solutions and the sum of the concentration profiles (for MCR-ALS) and proportions (for ICA) for each recovered component, which presented the recovered spectra most similar to the spectra of the pure analytes. Such an approach is comparable to univariate quantification methods used in chromatography, where the standard concentration is related to the chromatographic band area of a compound. The difference for the proposed method is that the chromatographic bands were mathematically deconvoluted from interferents with chemometric tools, using the SERS spectrum of each analyte as the base for deconvolution.

3. Results and Discussion

3.1. Preliminary Tests

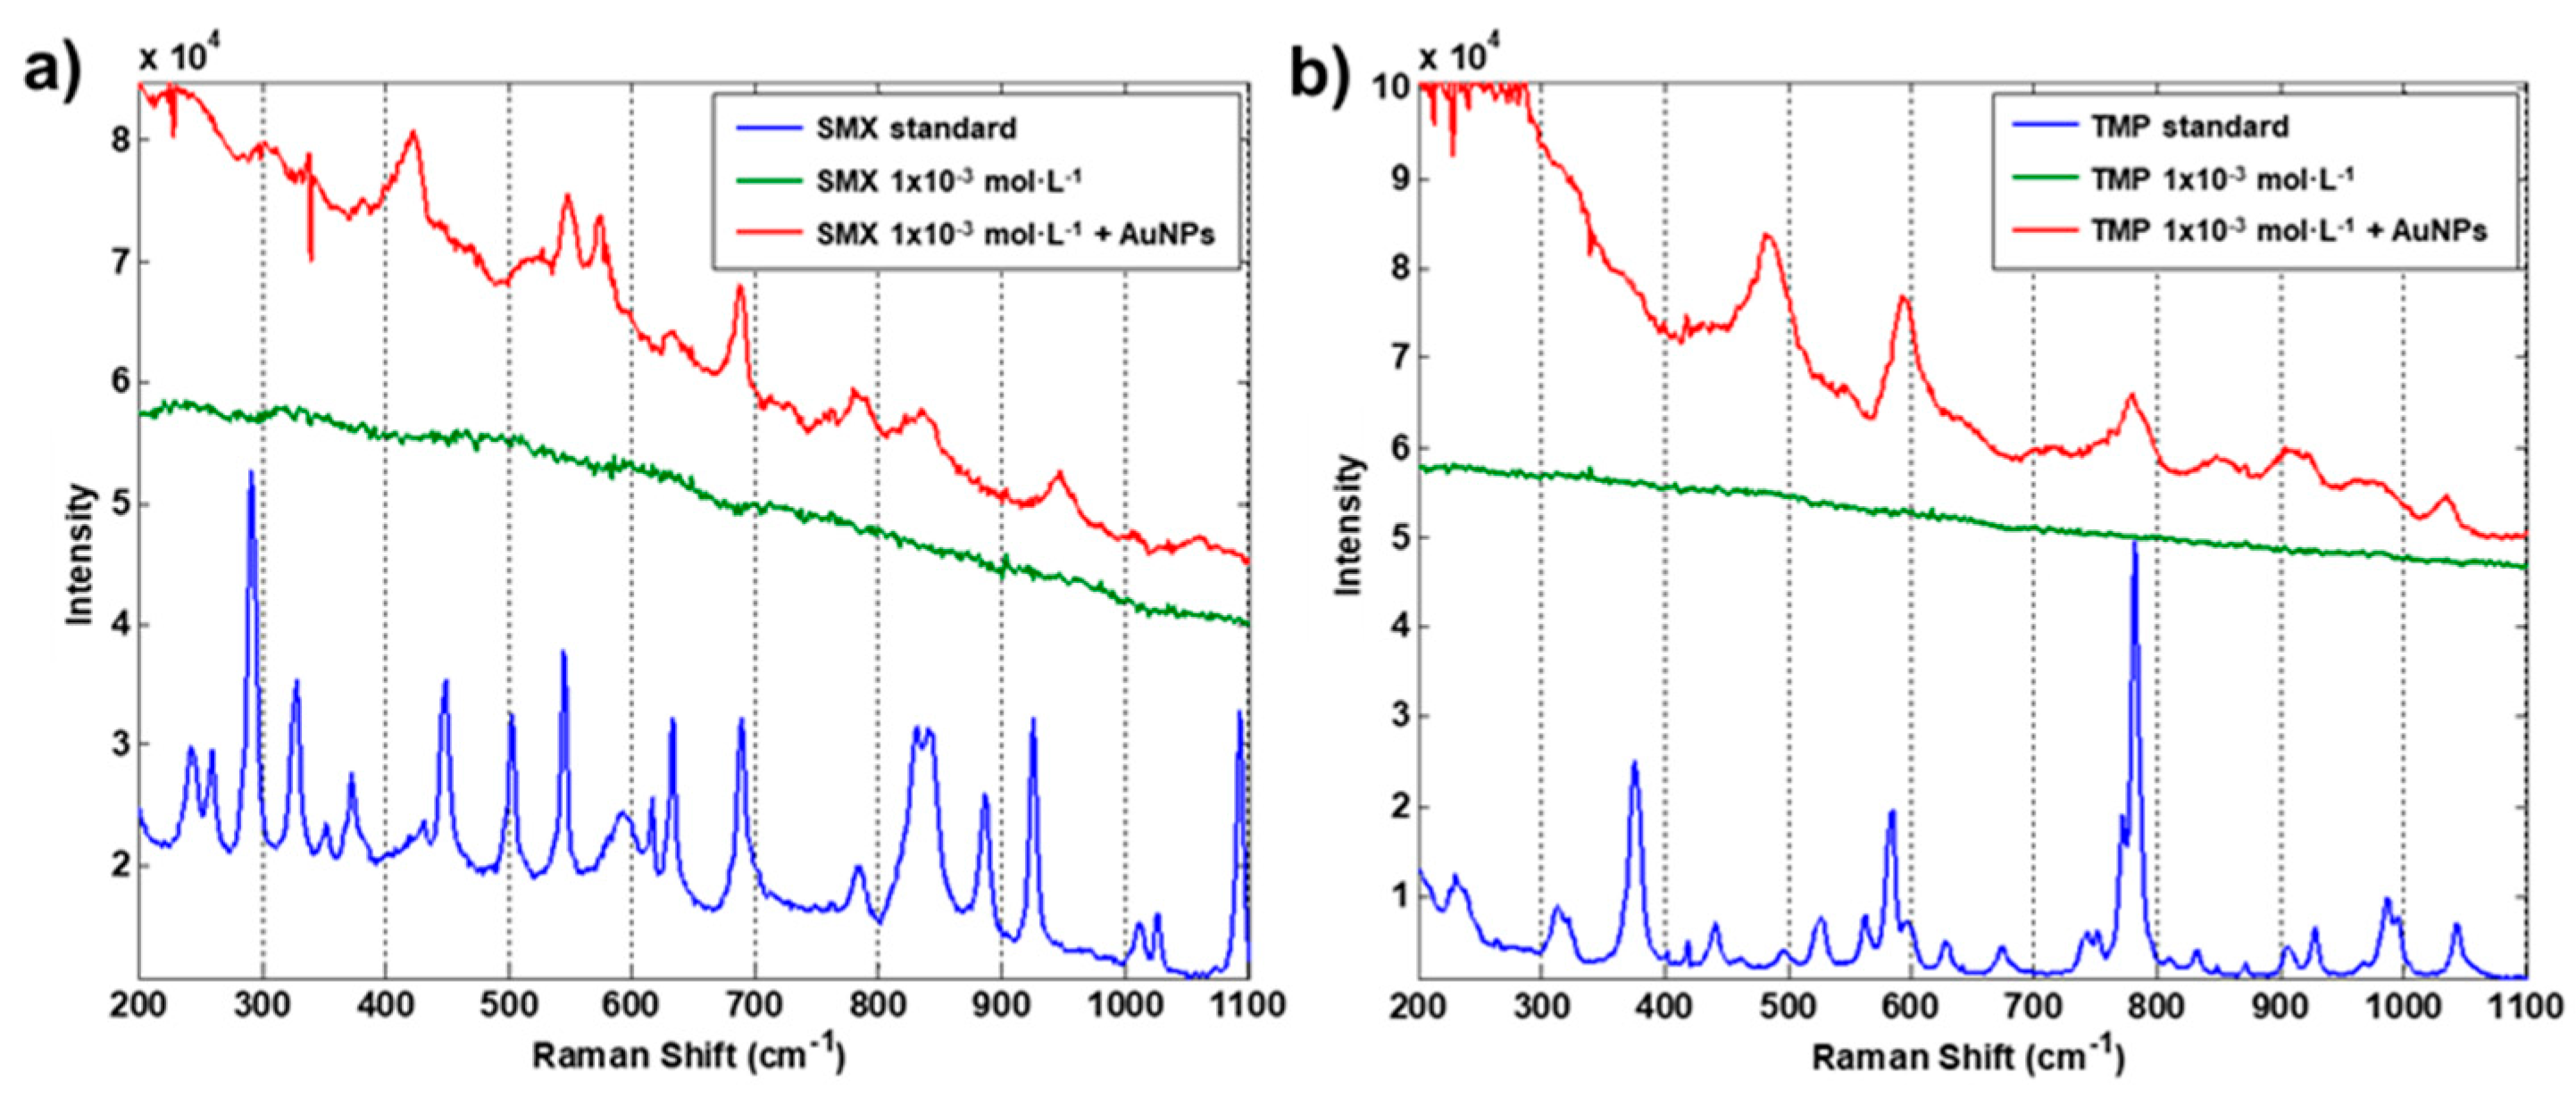
The purpose of the preliminary tests was to observe the SERS effect of the analytes using the TLC-SERS device. Figure 3 shows the Raman spectra of the powder standards, the spectra of the 1 × 10⁻³ mol·L−1 solution in methanol, and the SERS spectra of the 1 × 10⁻³ mol·L−1 solution in methanol. While the solutions without nanoparticles showed no significant Raman scattering, the solutions containing AuNPs presented characteristic Raman bands due to the SERS effect. It is worth emphasizing that, due to differences in the chemical environment (powder standard compared to SERS solution), the spectra obtained in both measurements showed distinct profiles.
For SMX, most of the characteristic Raman bands presented lower intensities, and four main bands were observed in the SERS spectra. At 687 cm−1, it was possible to observe a band related to the out-of-plane bending of the C=C-C bond of the aromatic rings. The Raman band at 570 cm−1 could be associated with out-of-plane bending of the C-O-N bond from the isoxazol ring, and at 546 cm−1, in-plane bending of a secondary amine (-NH) was observed. The band at 423 cm−1 was indicative of in-plane bending of the C=C-N bond [42]. These Raman bands were indicative of the interaction between the nanoparticles and the isoxazol ring of SMX, leading to an enhancement of the Raman signals related to this region of the molecule.
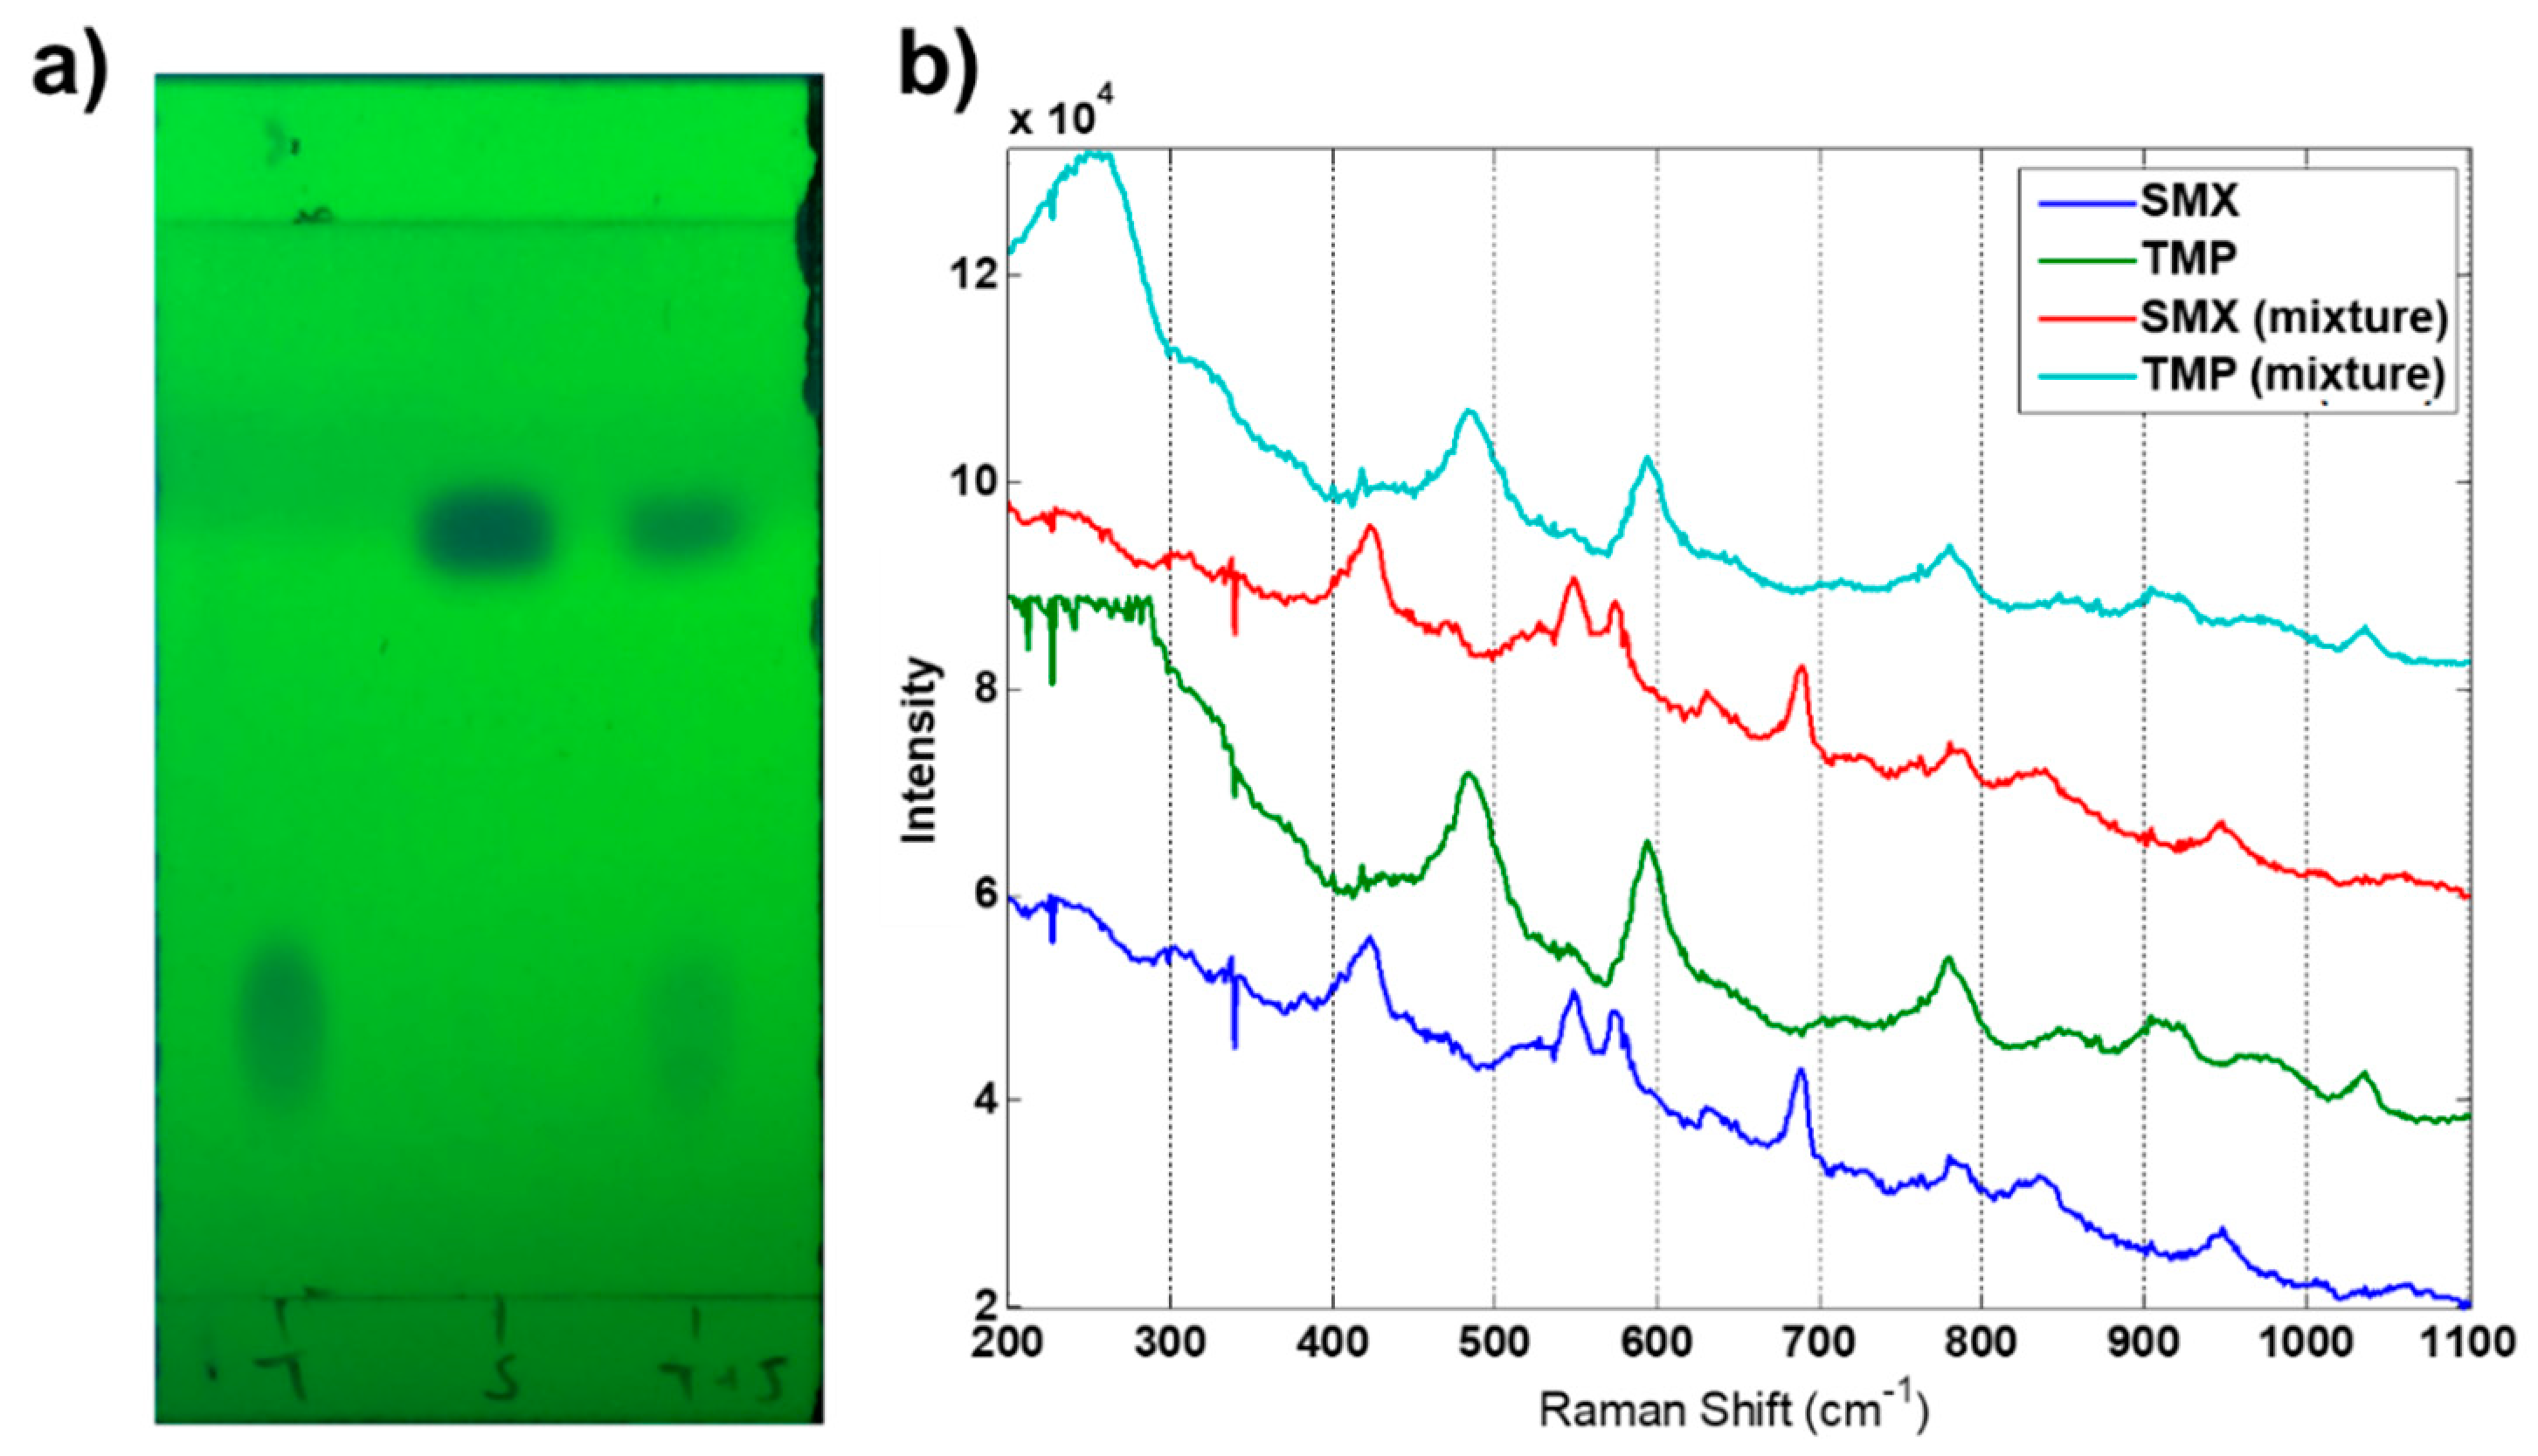
In the TMP SERS, four main bands were observed at 482 cm−1, 593 cm−1, 780 cm−1, and 1325 cm−1. The first band at 482 cm−1 was related to primary amine (-NH2) bending. At 593 cm−1, in-plane pyrimidine ring stretching was observed, as well as TMP benzenic ring torsion. The band at 780 cm−1 could be associated with pyrimidine ring breathing, and the band at 1325 cm−1 was related to C-O benzenic ring stretching [43]. Considering that the region in which signal enhancement is observed is the part of the molecule that most interacts with a nanoparticle surface, it can be inferred that the molecule interacted with AuNPs through its pyrimidine ring. Figure 4 shows the separation and identification of the analytes using the TLC-SERS device. This was performed by TLC elution of a stock solution (1 × 10⁻³ mol·L−1) containing only SMX, a stock solution containing only TMP (1 × 10⁻³ mol·L−1), and a stock solution of 5 × 10⁻⁴ mol·L−1 containing both analytes.
The TLC plates were first evaluated in a UV chamber (Figure 4a), where efficient and reproducible separation of both compounds was observed. Next, the AuNP solution was dispersed on the TLC plates for further SERS analysis. As expected, the process of dispersion of the AuNP colloid over the TLC plates did not promote changes, either in the SERS effect or in the TLC substrate. Furthermore, it was possible to detect both chemical compounds with minimal interference of the silica plate.

3.2. Device Optimization

A central composite design was performed that was aimed at optimizing the SERS intensities for both analytes using the TCL-SERS device, as presented in Table 1. The evaluated parameters were related to the AuNP solution, which was dispersed on the TLC plates.
An analysis of variance (ANOVA) was performed using the data of Table 1 to discover the influence of the CCD parameters on the SERS intensity and to obtain mathematical models to improve the SERS optimization. For TMP, the proposed model explained 48% of the information obtained during the experiments, and no significant regression was achieved based on an F-test of regression by the residuals, where the calculated value (FReg/Res = 0.91) was lower than the critical F-value (Fcritical 5;5;95% = 5.05).
These results reflected the calculated coefficients. At a 95% confidence level, all the parameters presented confidence intervals higher than the coefficient values. Thus, it was not possible to consider the calculated parameters as significant for the model, indicating that the proposed quadratic model did not fit the experimental results, although the empirical results could be used to generate a response surface.
For SMX, the ANOVA showed more significant coefficients for the model. Only the coefficient related to the linear contribution of NaCl was not significant, and the significant coefficients are presented in Equation (3). However, the proposed equation presented a determination coefficient (R²) of 0.69 and low prediction power, with an FReg/Res value (3.40) below the Fcritical value (4;6;95%) (4.53).
y = 1463.33 ( ± 310.47 ) + 313.66 ( ± 179.56 ) x A u 238.33 ( ± 178.64 ) x N a C l 2 187.57 ( ± 178.64 ) x A u 2 332.92   ( ± 278.82 ) x N a C l x A u
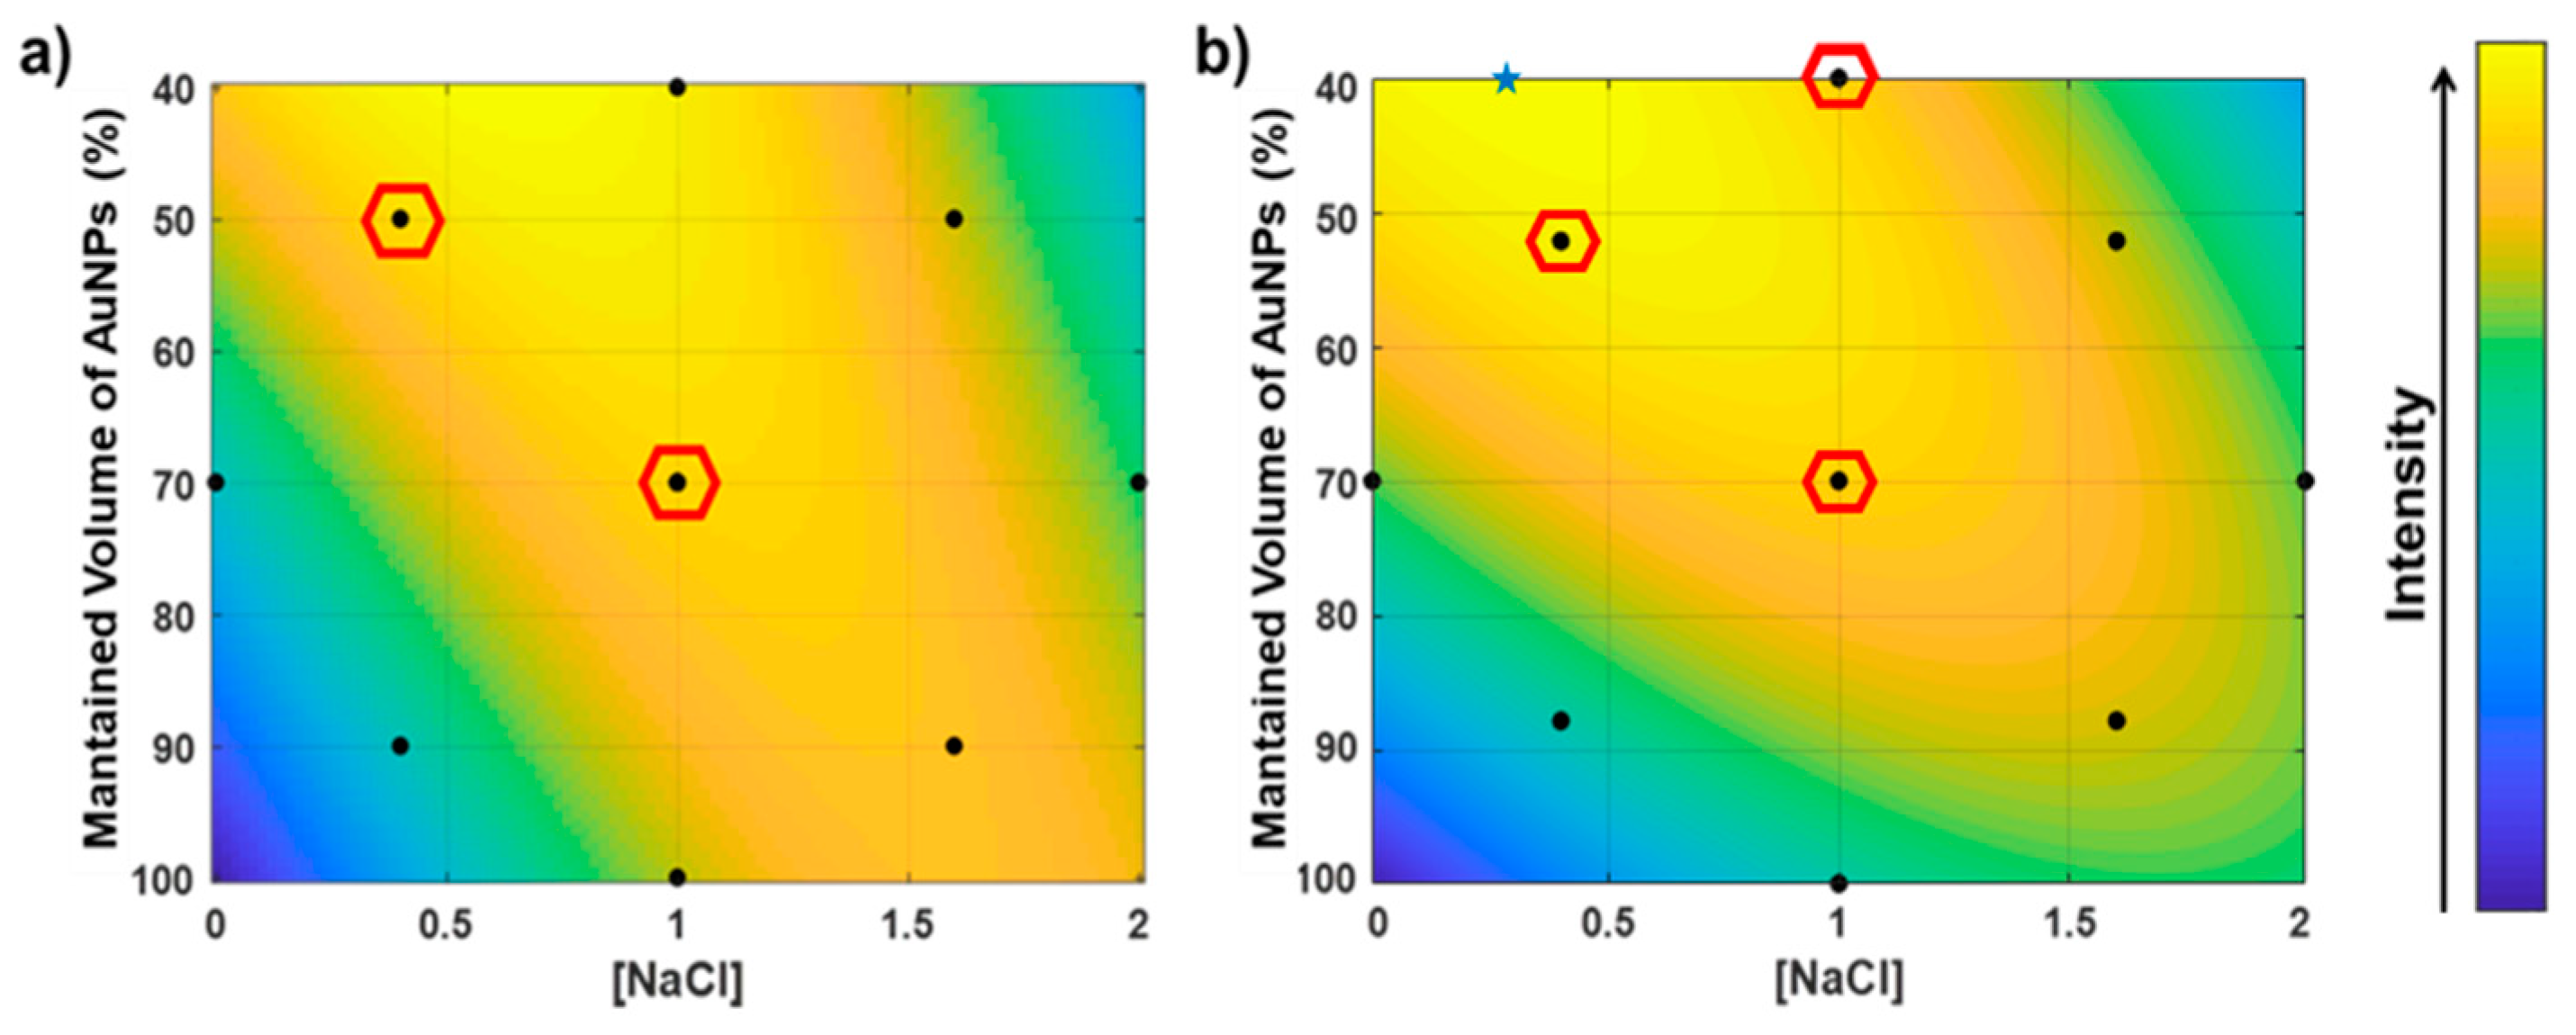
Figure 5 presents the response surfaces for both analytes using interpolation of the empirical results for TMP (Figure 5a) and the results of Equation (3) for SMX ( Figure 5b). As both drugs presented the highest intensity of response near the location of experiment 3, this condition was adopted for the method (0.4 mol·L−1 NaCl and maintained volume of AuNP colloidal solution of 50%).
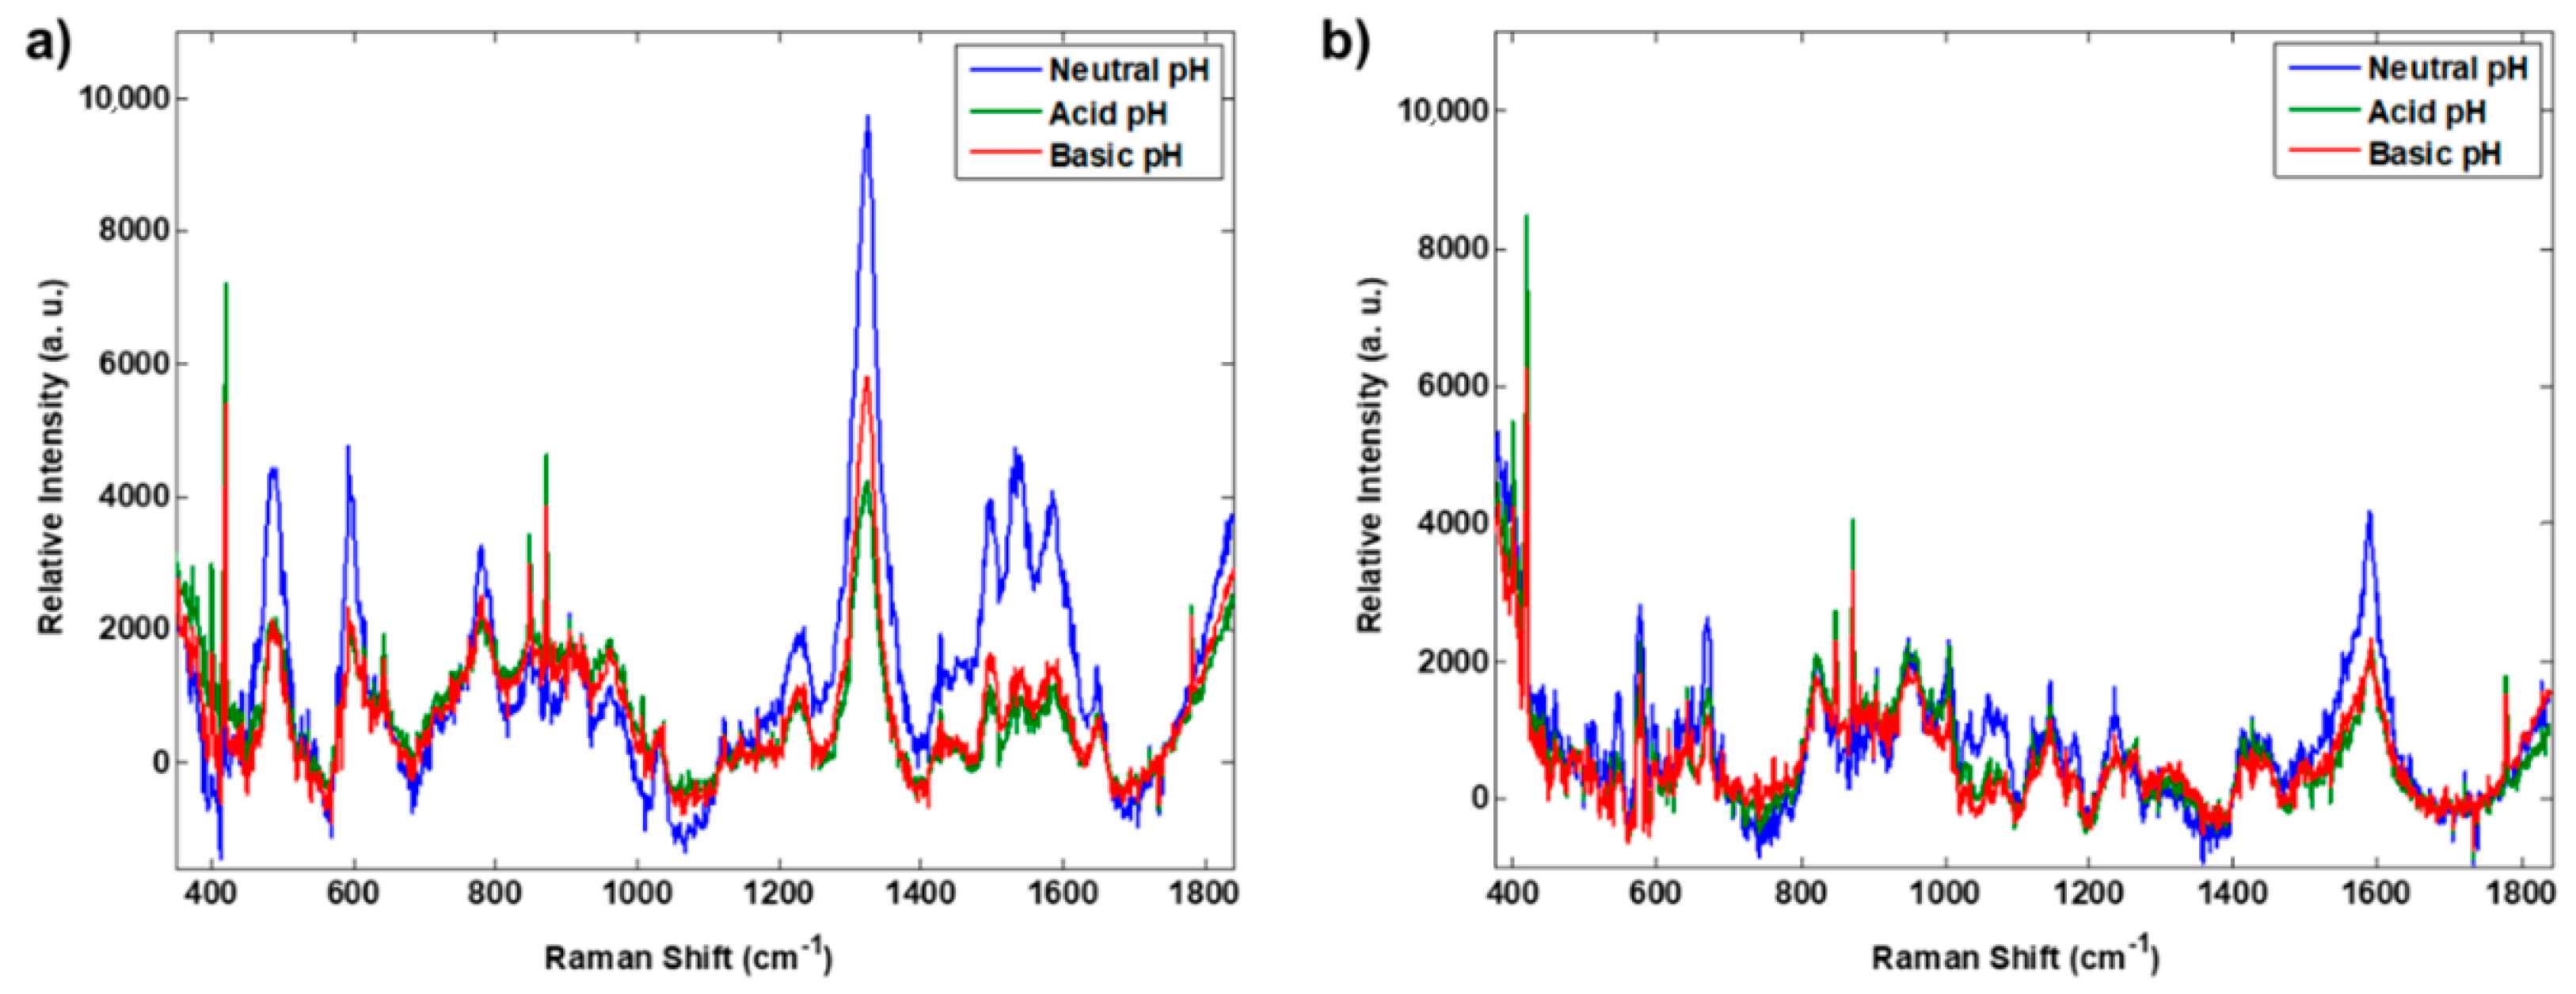
As pH can change the intensity and profile of SERS, the pH of the mobile phase was evaluated. Figure 6 shows the average SERS spectra of the TLC chromatographic bands using acidic pH (HCl addition), basic pH (NaOH addition), and neutral pH for the mobile phase. For both SMX and TMP, SERS showed the highest intensity values using the mobile phase without modification; thus, this condition was selected to perform the quantification experiments. One possible explanation for these values is related to the molecular interaction with the nanoparticle surface. Considering that TMP performed its adsorption through the pyrimidine ring, the protonation of the primary amine (in acid media) or the neutral form of the molecule (in basic media) negatively affected its interaction with the Au nanoparticles. For SMX, the protonation of the tertiary amine and the deprotonation of the secondary amine did not interfere with the adsorption of the isoxazol group on the nanoparticle surface. Because of the highest sign intensity in the neutral media, the TLC-SERS analysis was performed without pH alteration.

3.3. SMX Quantification

Calibration curves were prepared using the optimized experimental conditions. Standard solutions containing both drugs were eluted on the TLC plates using AcEt:MeOH (75:15 v/v) mobile phase. The AuNP colloidal solution was preconcentrated, discarding half the volume of the supernatant after centrifugation, and 2 µL of 0.4 mol L−1 NaCl was added to 100 µL of concentrated AuNPs. Each standard solution was prepared and analyzed in three replicates. The performances of the MCR and ICA chemometric methods for signal resolution were compared through the quantification of analytes.
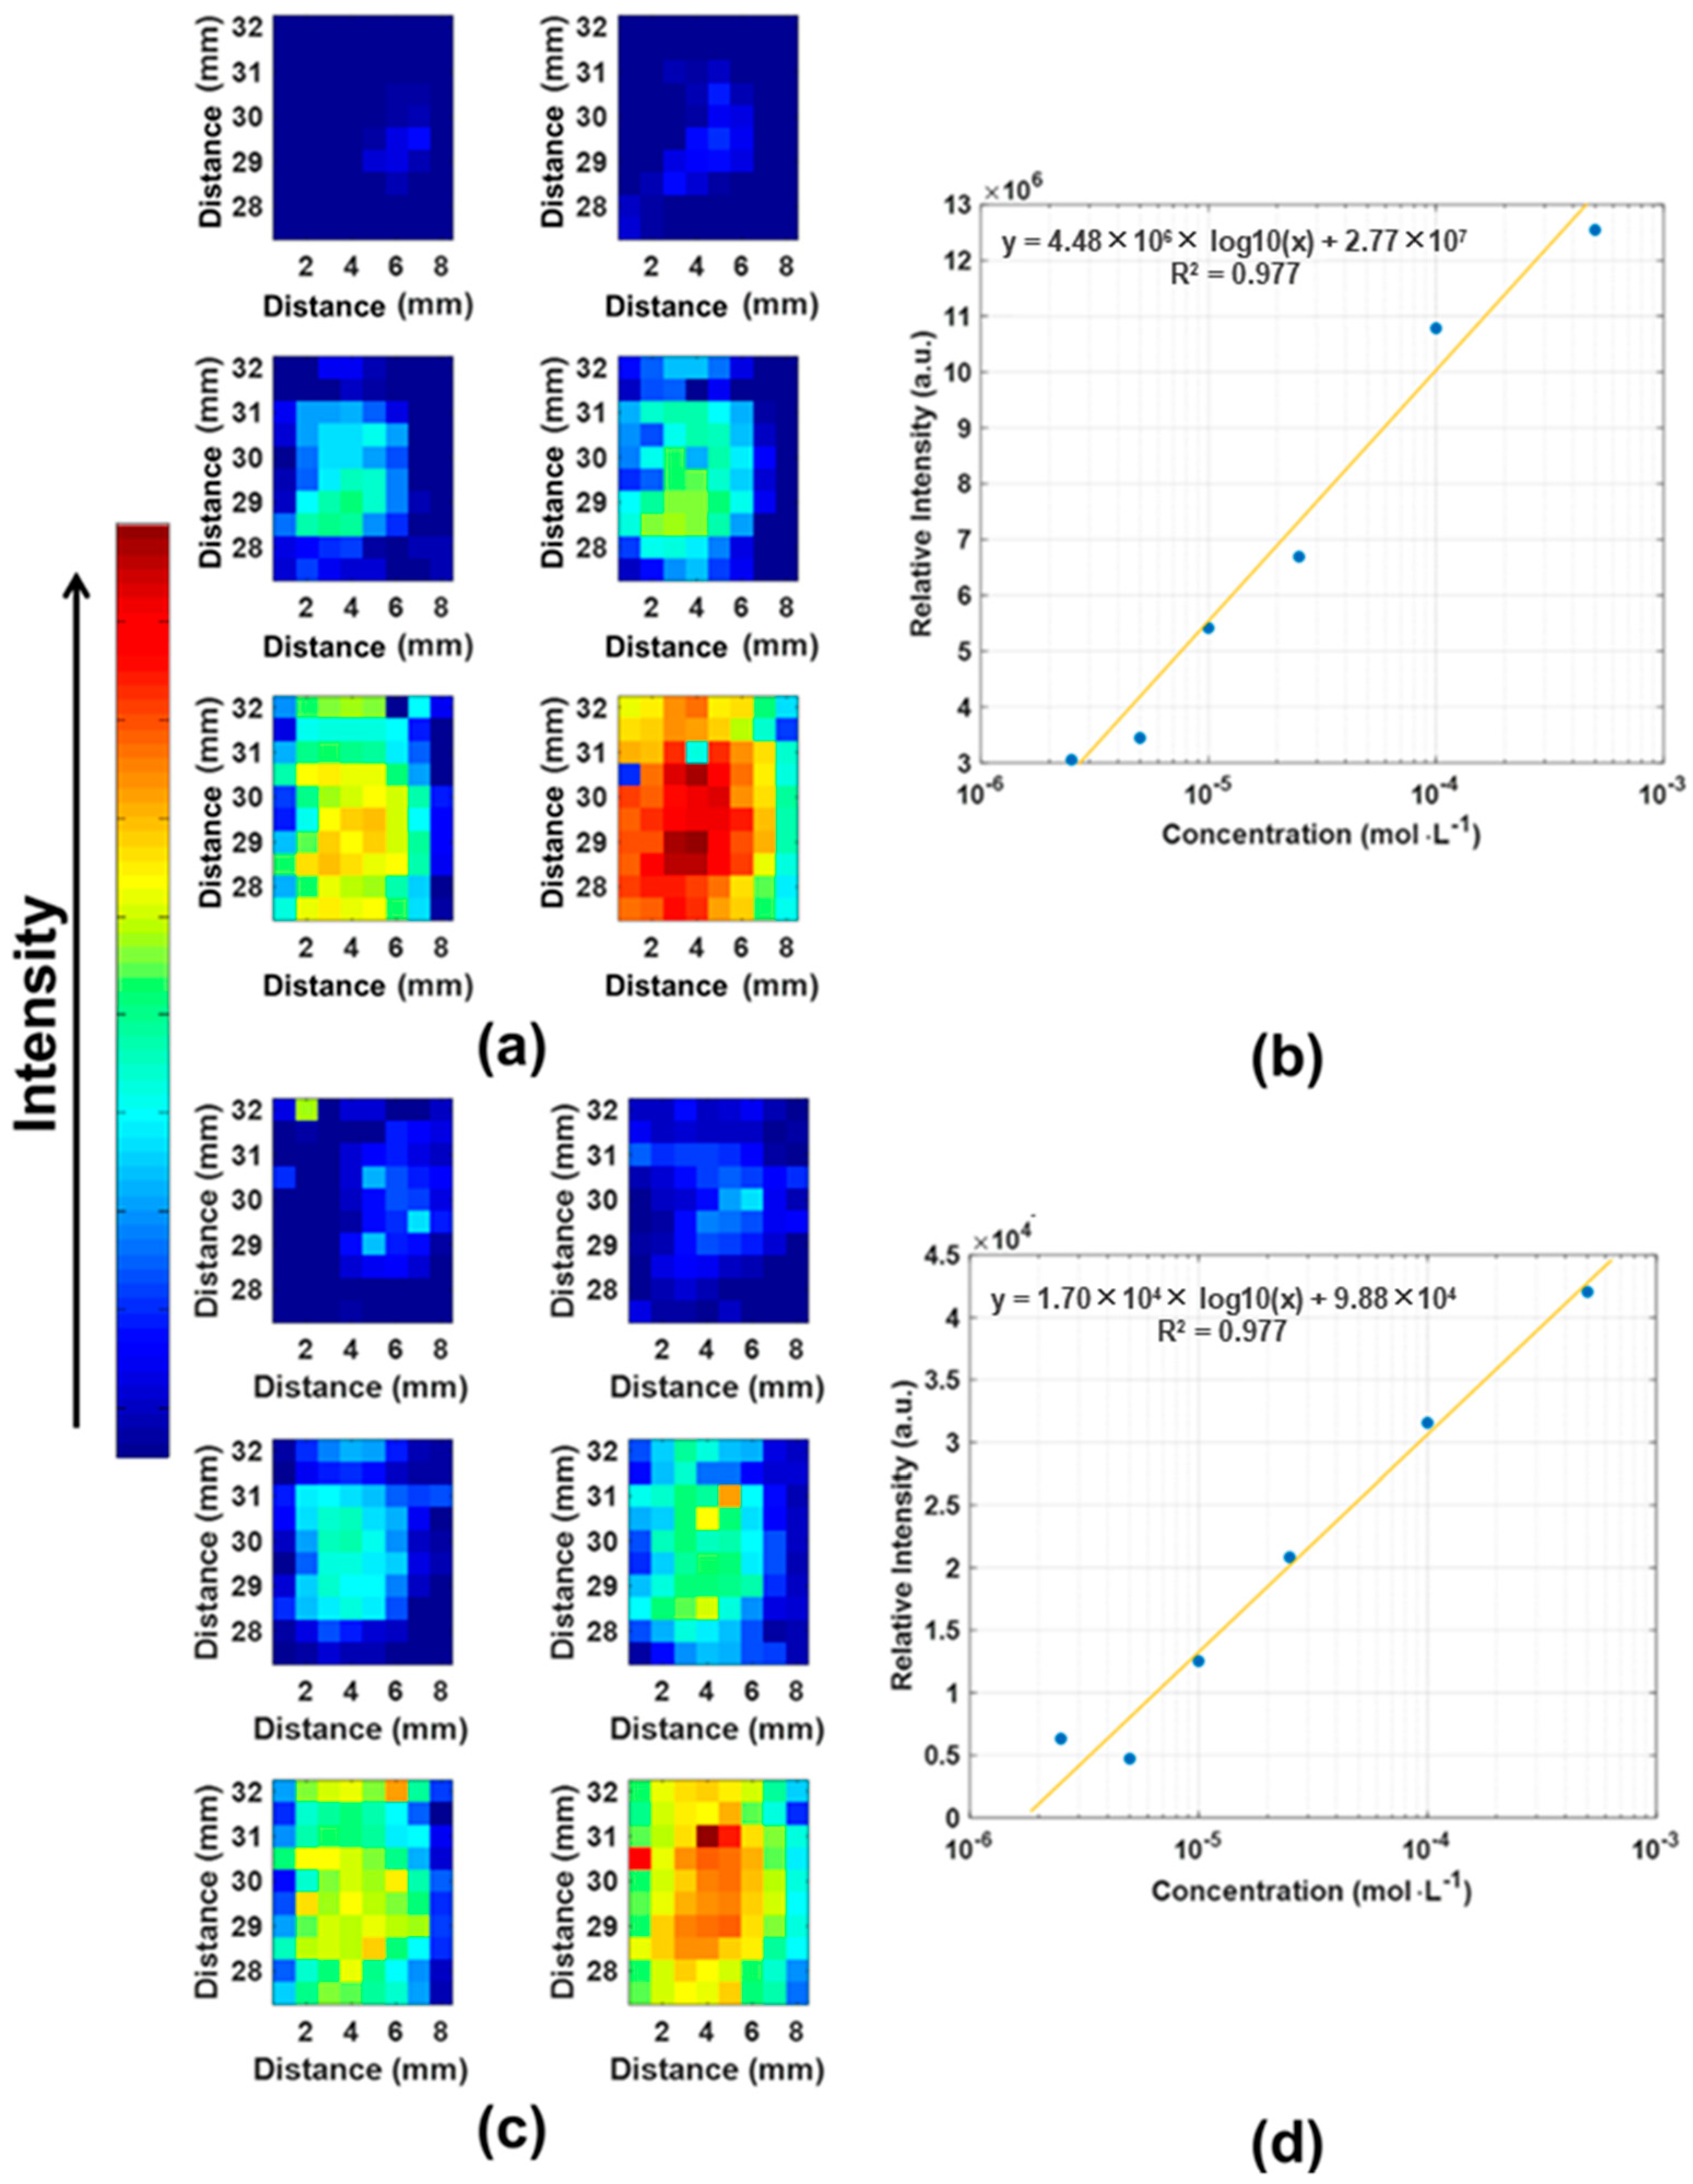
Figure 7 presents the score maps of the chromatographic band recovered by MCR-ALS (Figure 7a) and ICA (Figure 7c) for the SMX standard calibration samples, as well as the respective calibration curves (Figure 7b,d, respectively).
The calibration curves in Figure 7 were obtained from semi-log graphs, where log10 was applied to the X-axis (concentration axis) against the relative intensity obtained from the sum of the recovered concentration profile for the component identified as SMX. Both analytical curves presented satisfactory performances with a good linear range (from 5.00 × 10⁻⁶ to 5.00 × 10⁻⁴ mol·L−1) and a high correlation coefficient (R² = 0.977), regardless of the chemometric tool. The lowest detected concentration for SMX in the proposed method was below the usual concentration obtained by the spectroscopic methods and close to the limits of detection reported by liquid chromatographic methods [6,44], demonstrating its applicability for low-concentration matrices, such as milk.
The proposed analytical curves were applied to quantify SMX in milk samples. However, because of the samples’ chemical complexity, some interferents presented elution close to that of SMX in the TLC plates and occupied the bond sites of AuNPs, decreasing the interaction between SMX and the AuNPs and suppressing the SERS intensity for this analyte. Figure 8 exhibits the recovered score maps for two interferents and SMX in the same chromatographic region for the analysis of the milk sample spiked with two times the MRL.
Even with the interferents present, it was possible to observe pixels related to the analyte signal (red, orange, and yellow dots in Figure 8b). Therefore, the proposed device could be used to detect the presence or absence of the drug in milk, and it could be applied as a qualitative method to detect SMX in milk samples. The results depicted in Figure 8 refer to the recovered MCR-ALS data, but no significant differences were observed in the ICA (results not presented).

3.4. TMP Quantification

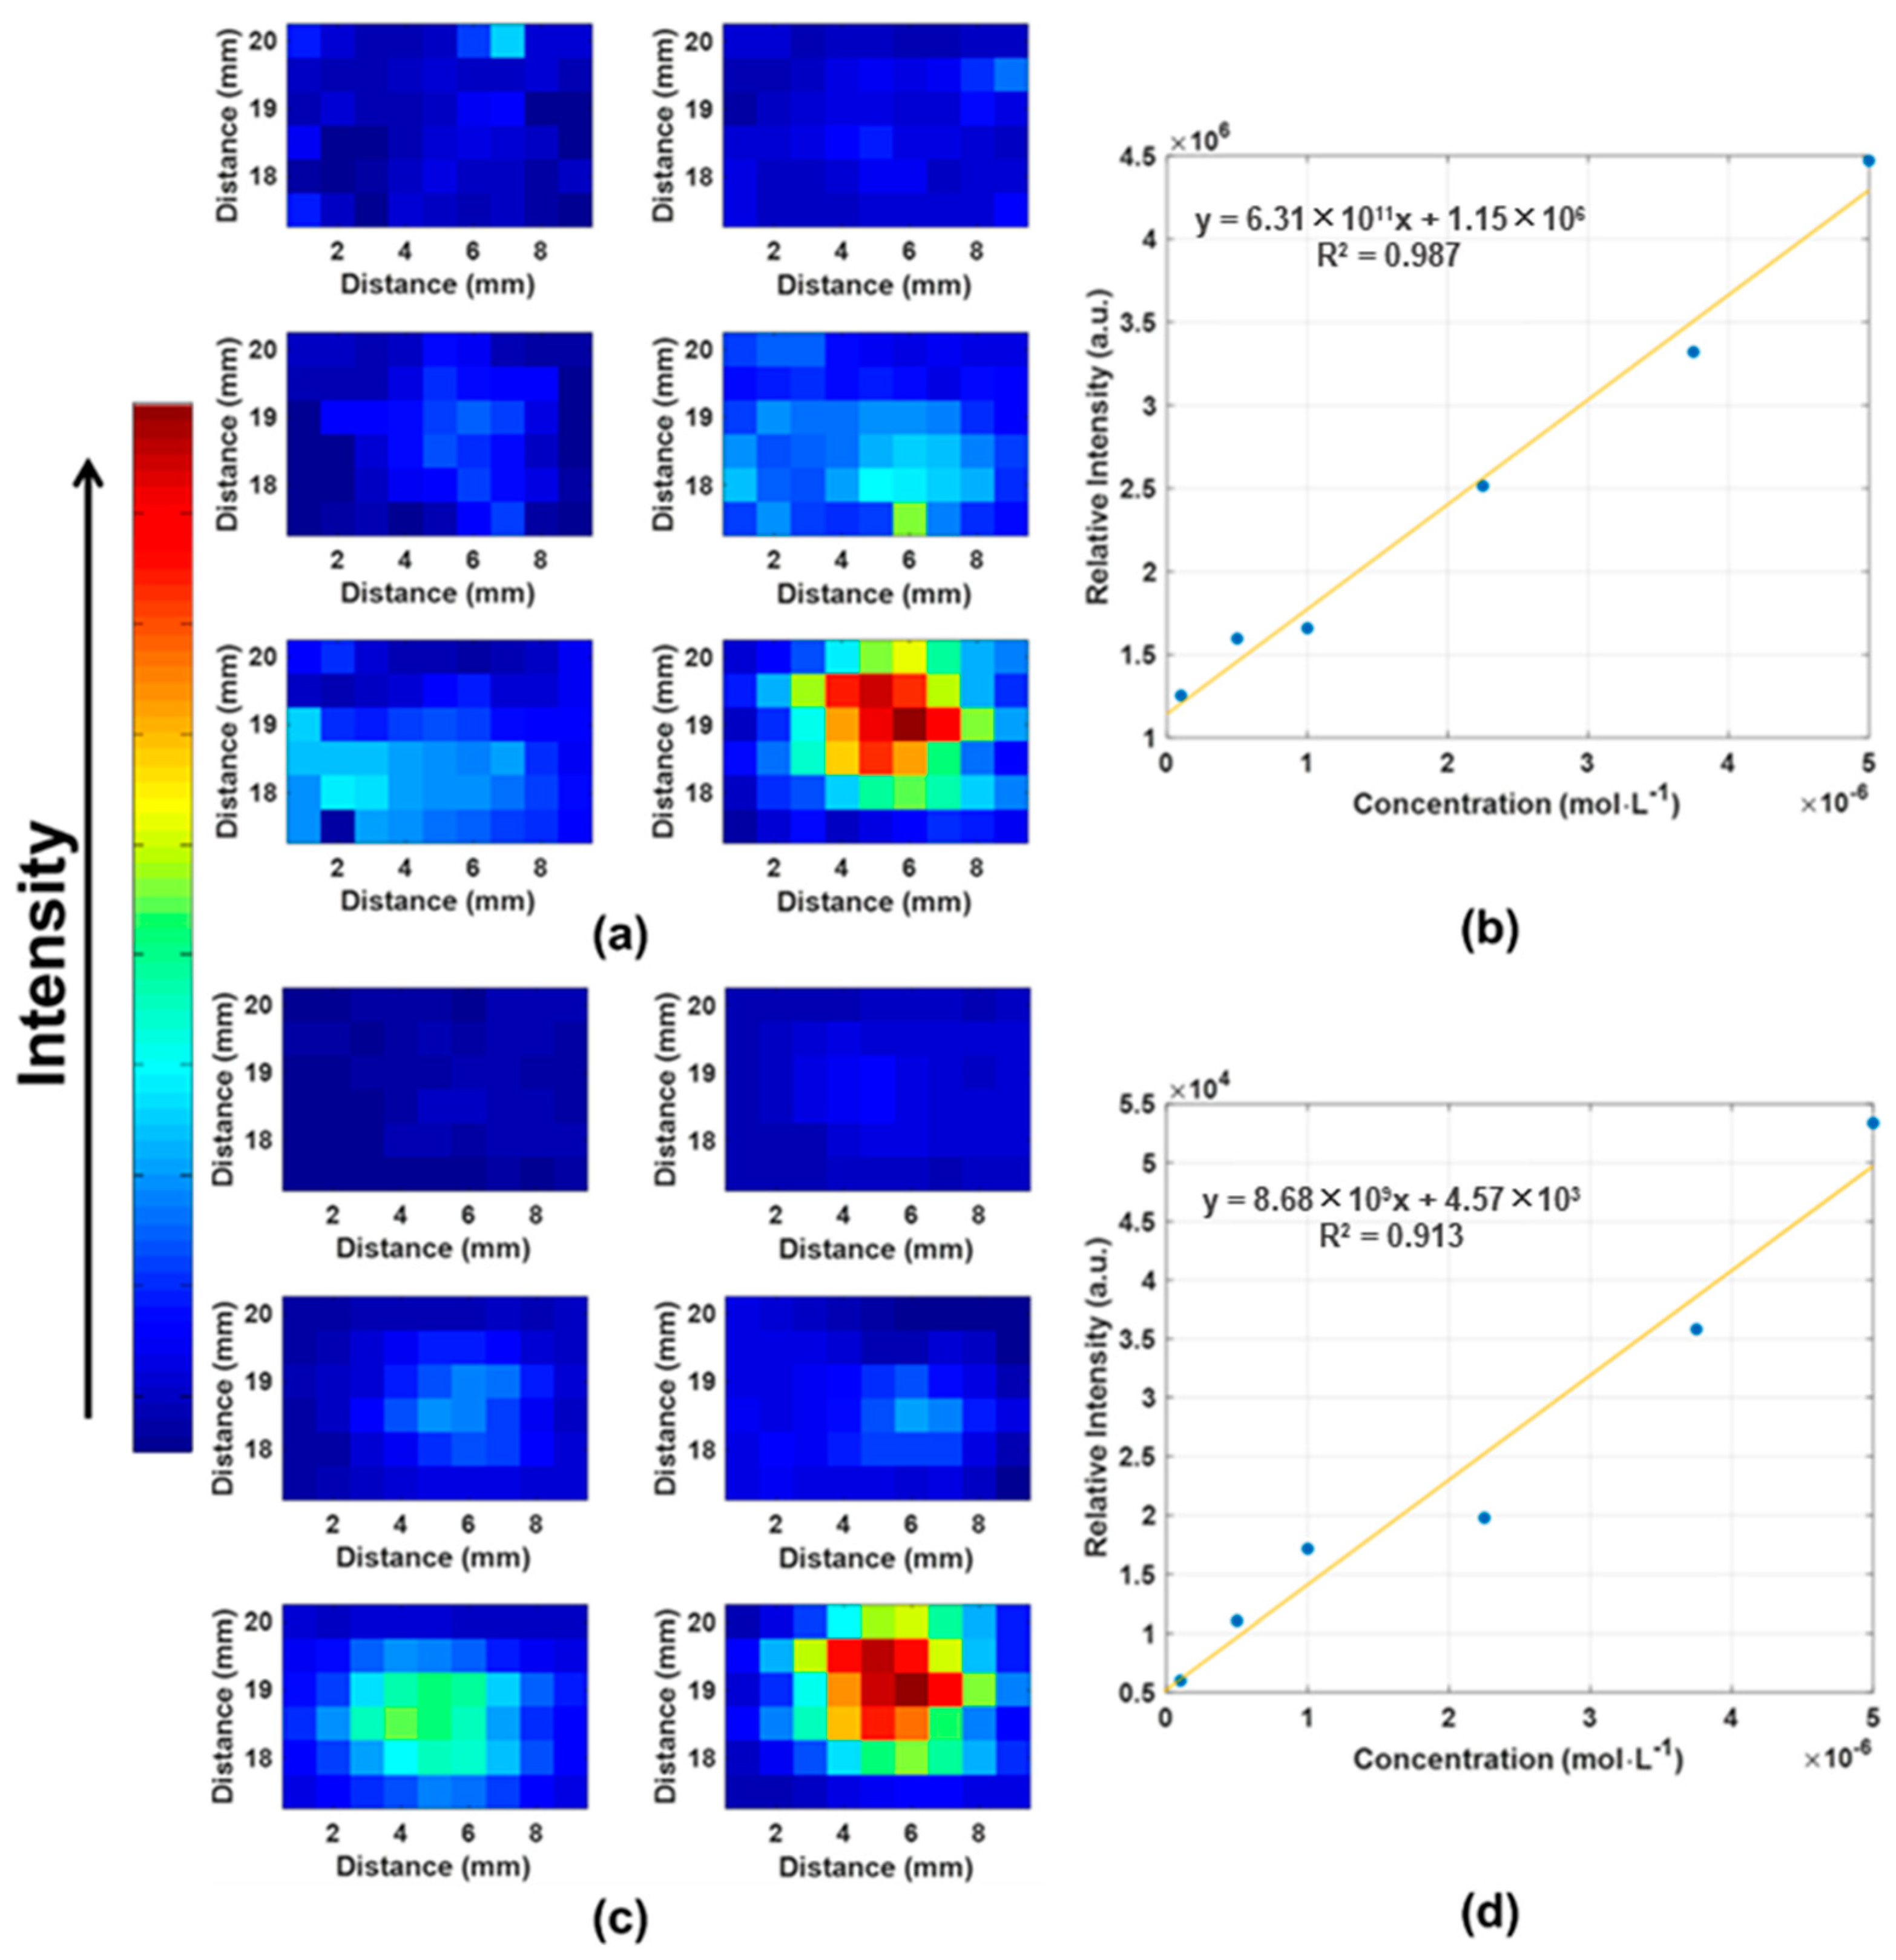
Figure 9 presents concentration maps of the TMP chromatographic band recovered by MCR-ALS (Figure 9a) and ICA (Figure 9c), as well as their analytical curves (Figure 9b,d, respectively). Both methods showed high linearity (R2 > 0.9) in the linear range of 1.00 × 10⁻⁷ to 5.00 × 10⁻⁶ mol·L−1. Comparing the results obtained for TMP with those of SMX, a shorter linear range could be noticed for TMP, as well as a lower detection limit. While SMX showed a linear range with two orders of magnitude, TMP showed a linear range with only one order of magnitude. However, as TMP exhibited a better SERS response, it was possible to detect TMP at lower concentration levels compared to SMX, reaching concentration levels below the established MRL. While in the SMX quantification both deconvolution methods presented similar results, the TMP quantification obtained a slightly better performance of MCR-ALS over ICA, which presented determination coefficients of 0.987 and 0.913, respectively.
Figure 10 presents the recovered spectra of both chemometric tools for TMP and the recovered chromatographic bands for the 5.00 × 10⁻⁶ mol·L−1 TMP standard solution. It was noticeable that the spectrum recovered by MCR-ALS presented higher noise and baseline levels (Figure 10a) compared to the spectrum recovered by ICA. The MCR-ALS chromatographic profile (Figure 10b) also presented a higher noise level close to the band baseline compared to the profile recovered by ICA (Figure 10c). Although the ICA showed a lower determination coefficient for the analytical curve, it was possible to recover a more similar spectral profile related to TMP, with lower noise and baseline influence. In addition, the chromatographic profile showed a band format more similar to a Gaussian format, which is expected for a chromatographic band.
Both analytical curves (Figure 9b,d) were used to quantify TMP in commercial milk samples. Even with the chemical complexity of the samples, it was possible to quantify TMP in the presence of matrix interferents. Figure 11 depicts the concentration maps recovered by MCR-ALS for two interferents and TMP in the usual analyte separation region. No significant changes were observed for the profile recovered by ICA, except a less noisy spectral profile (results not shown here).
For the areas of the chromatographic bands, the recovered values were obtained based on the three spiking levels applied to commercial milk samples, as presented in Table 2. It was not possible to detect any pixels containing TMP spectra in the commercial samples without spiking (S0), as expected. Therefore, S0 samples were considered not detected (N.D.). The spiked samples of S1 (1.7 × 10⁻⁷ mol·L−1) and S2 (3.4 × 10⁻⁷ mol·L−1) showed satisfactory recovered values considering that part of the standard deviation could be due to the QuEChERS extraction procedure, the high variability in the SERS technique, the high variability in the TLC technique, or the very low concentration of the analyte. The chemometric tools presented similar performances, with slightly lower standard deviations for the ICA. The results showed that the TLC-SERS device could be applied to quantify TMP, even for complex samples with low limits of detection.

4. Conclusions

By using a specific experimental design, a TLC-SERS device was optimized to obtain better conditions for the determination of SMX and TMP, allowing their simultaneous detection at concentration values close to their MRLs. Due to the high complexity of the sample matrices, it was not possible to quantify SMX in the presence of interferents, even with the use of chemometric tools for signal resolution due to the suppression of the SERS signal. However, it was possible to detect the presence of the drug when it was present in the samples at a concentration of two times the MRL, demonstrating its applicability as a qualitative approach.
The results demonstrated satisfactory recovery values for TMP in commercial milk samples. Both an ICA and MCR-ALS were able to deconvolute the analyte signals in the presence of matrix interferents, making the quantification of TMP in the range of its MRL possible for bovine milk. The results demonstrated that the SERS-TLC device coupled with chemometric techniques is a potential sensor device for the quantification of analytes in complex samples.

Author Contributions

Conceptualization, R.L.C.; Formal analysis, F.L.F.S. and B.R.d.A.J.; Investigation, F.L.F.S. and B.R.d.A.J.; Data curation, F.L.F.S. and B.R.d.A.J.; Writing—original draft, F.L.F.S. and B.R.d.A.J.; Writing—review & editing, R.L.C.; Supervision, R.L.C.; Project administration, R.L.C.; Funding acquisition, R.L.C. All authors have read and agreed to the published version of the manuscript.

Funding

This research was funded by São Paulo Research Foundation (FAPESP), grant numbers 2010/16520-5 and 2017/13095-0.

Institutional Review Board Statement

Not applicable.

Informed Consent Statement

Not Applicable.

Data Availability Statement

The data presented in this study are available on request from the corresponding author.

Conflicts of Interest

The authors declare no conflict of interest.

References

  1. Andrade, L.S.; de Moraes, M.C.; Rocha-Filho, R.C.; Fatibello-Filho, O.; Cass, Q.B. A Multidimensional High Performance Liquid Chromatography Method Coupled with Amperometric Detection Using a Boron-Doped Diamond Electrode for the Simultaneous Determination of Sulfamethoxazole and Trimethoprim in Bovine Milk. Anal. Chim. Acta 2009, 654, 127–132. [Google Scholar] [CrossRef] [PubMed]
  2. Campbell, W.C. History of the Discovery of Sulfaquinoxaline as a Coccidiostat. J. Parasitol. 2008, 94, 934–945. [Google Scholar] [CrossRef] [PubMed]
  3. Bousova, K.; Senyuva, H.; Mittendorf, K. Quantitative Multi-Residue Method for Determination Antibiotics in Chicken Meat Using Turbulent Flow Chromatography Coupled to Liquid Chromatography–Tandem Mass Spectrometry. J. Chromatogr. A 2013, 1274, 19–27. [Google Scholar] [CrossRef] [PubMed]
  4. de Paula, F.C.C.R.; de Pietro, A.C.; Cass, Q.B. Simultaneous Quantification of Sulfamethoxazole and Trimethoprim in Whole Egg Samples by Column-Switching High-Performance Liquid Chromatography Using Restricted Access Media Column for on-Line Sample Clean-Up. J. Chromatogr. A 2008, 1189, 221–226. [Google Scholar] [CrossRef] [PubMed]
  5. Hajian, R.; Mousavi, E.; Shams, N. Net Analyte Signal Standard Addition Method for Simultaneous Determination of Sulphadiazine and Trimethoprim in Bovine Milk and Veterinary Medicines. Food Chem. 2013, 138, 745–749. [Google Scholar] [CrossRef] [PubMed]
  6. Pereira, A.V.; Cass, Q.B. High-Performance Liquid Chromatography Method for the Simultaneous Determination of Sulfamethoxazole and Trimethoprim in Bovine Milk Using an on-Line Clean-up Column. J. Chromatogr. B 2005, 826, 139–146. [Google Scholar] [CrossRef]
  7. Ministério da Agricultura, Pecuária e Abastecimento. Instrução Normativa No 09. Available online: http://alimentusconsultoria.com.br/instrucao-normativa-9-fevereiro-2017/ (accessed on 25 September 2022).
  8. Almeida, M.R.; Correa, D.N.; Zacca, J.J.; Logrado, L.P.L.; Poppi, R.J. Detection of Explosives on the Surface of Banknotes by Raman Hyperspectral Imaging and Independent Component Analysis. Anal. Chim. Acta 2015, 860, 15–22. [Google Scholar] [CrossRef] [PubMed]
  9. Cheung, W.; Shadi, I.T.; Xu, Y.; Goodacre, R. Quantitative Analysis of the Banned Food Dye Sudan-1 Using Surface Enhanced Raman Scattering with Multivariate Chemometrics. J. Phys. Chem. C 2010, 114, 7285–7290. [Google Scholar] [CrossRef] [Green Version]
  10. Jarvis, R.M.; Goodacre, R. Discrimination of Bacteria Using Surface-Enhanced Raman Spectroscopy. Anal. Chem. 2004, 76, 40–47. [Google Scholar] [CrossRef]
  11. Mamián-López, M.B.; Poppi, R.J. Standard Addition Method Applied to the Urinary Quantification of Nicotine in the Presence of Cotinine and Anabasine Using Surface Enhanced Raman Spectroscopy and Multivariate Curve Resolution. Anal. Chim. Acta 2013, 760, 53–59. [Google Scholar] [CrossRef]
  12. Schlücker, S. Surface-Enhanced Raman Spectroscopy: Concepts and Chemical Applications. Angew. Chem. Int. Ed. 2014, 53, 4756–4795. [Google Scholar] [CrossRef] [PubMed]
  13. Hou, X.; Sivashanmugan, K.; Zhao, Y.; Zhang, B.; Wang, A.X. Multiplex Sensing of Complex Mixtures by Machine Vision Analysis of TLC-SERS Images. Sens. Actuators B Chem. 2022, 357, 131355. [Google Scholar] [CrossRef] [PubMed]
  14. Shen, Z.; Fan, Q.; Yu, Q.; Wang, R.; Wang, H.; Kong, X. Facile Detection of Carbendazim in Food Using TLC-SERS on Diatomite Thin Layer Chromatography. Spectrochim. Acta A Mol. Biomol. Spectrosc. 2021, 247, 119037. [Google Scholar] [CrossRef] [PubMed]
  15. Zhang, Y.; Zhao, S.; Zheng, J.; He, L. Surface-Enhanced Raman Spectroscopy (SERS) Combined Techniques for High-Performance Detection and Characterization. TrAC Trends Anal. Chem. 2017, 90, 1–13. [Google Scholar] [CrossRef]
  16. Shen, Z.; Wang, H.; Yu, Q.; Li, Q.; Lu, X.; Kong, X. On-Site Separation and Identification of Polycyclic Aromatic Hydrocarbons from Edible Oil by TLC-SERS on Diatomite Photonic Biosilica Plate. Microchem. J. 2021, 160, 105672. [Google Scholar] [CrossRef]
  17. Li, H.; Zhu, Q.X.; Chwee, T.S.; Wu, L.; Chai, Y.F.; Lu, F.; Yuan, Y.F. Detection of Structurally Similar Adulterants in Botanical Dietary Supplements by Thin-Layer Chromatography and Surface Enhanced Raman Spectroscopy Combined with Two-Dimensional Correlation Spectroscopy. Anal. Chim. Acta 2015, 883, 22–31. [Google Scholar] [CrossRef]
  18. Zhang, Z.-M.; Liu, J.-F.; Liu, R.; Sun, J.-F.; Wei, G.-H. Thin Layer Chromatography Coupled with Surface-Enhanced Raman Scattering as a Facile Method for On-Site Quantitative Monitoring of Chemical Reactions. Anal. Chem. 2014, 86, 7286–7292. [Google Scholar] [CrossRef]
  19. Xie, Z.; Wang, Y.; Chen, Y.; Xu, X.; Jin, Z.; Ding, Y.; Yang, N.; Wu, F. Tuneable Surface Enhanced Raman Spectroscopy Hyphenated to Chemically Derivatized Thin-Layer Chromatography Plates for Screening Histamine in Fish. Food Chem. 2017, 230, 547–552. [Google Scholar] [CrossRef]
  20. Tan, A.; Zhao, Y.; Sivashanmugan, K.; Squire, K.; Wang, A.X. Quantitative TLC-SERS Detection of Histamine in Seafood with Support Vector Machine Analysis. Food Control 2019, 103, 111–118. [Google Scholar] [CrossRef] [Green Version]
  21. Sha, X.; Han, S.; Fang, G.; Li, N.; Lin, D.; Hasi, W. A Novel Suitable TLC-SERS Assembly Strategy for Detection of Rhodamine B and Sudan I in Chili Oil. Food Control 2022, 138, 109040. [Google Scholar] [CrossRef]
  22. Carneiro, R.L.; Poppi, R.J. Infrared Imaging Spectroscopy and Chemometric Tools for in Situ Analysis of an Imiquimod Pharmaceutical Preparation Presented as Cream. Spectrochim. Acta A Mol. Biomol. Spectrosc. 2014, 118, 215–220. [Google Scholar] [CrossRef] [PubMed]
  23. Carneiro, R.L.; Poppi, R.J. A Quantitative Method Using near Infrared Imaging Spectroscopy for Determination of Surface Composition of Tablet Dosage Forms: An Example of Spirolactone Tablets. J. Braz. Chem. Soc. 2012, 23, 1570–1576. [Google Scholar] [CrossRef] [Green Version]
  24. Carneiro, R.L.; Poppi, R.J. Homogeneity Study of Ointment Dosage Forms by Infrared Imaging Spectroscopy. J. Pharm. Biomed. Anal. 2012, 58, 42–48. [Google Scholar] [CrossRef] [PubMed]
  25. Araya, J.A.; Carneiro, R.L.; Arévalo, C.; Freer, J.; Castillo, R. del P. Single Pixel Quantification Strategies Using Middle Infrared Hyperspectral Imaging of Lignocellulosic Fibers and MCR-ALS Analysis. Microchem. J. 2017, 134, 164–172. [Google Scholar] [CrossRef]
  26. Saha, D.; Manickavasagan, A. Machine Learning Techniques for Analysis of Hyperspectral Images to Determine Quality of Food Products: A Review. Curr. Res. Food Sci. 2021, 4, 28–44. [Google Scholar] [CrossRef]
  27. Mamián-López, M.B.; Poppi, R.J. SERS Hyperspectral Imaging Assisted by MCR-ALS for Studying Polymeric Microfilms Loaded with Paracetamol. Microchem. J. 2015, 123, 243–251. [Google Scholar] [CrossRef]
  28. Alexandrino, G.L.; Khorasani, M.R.; Amigo, J.M.; Rantanen, J.; Poppi, R.J. Monitoring of Multiple Solid-State Transformations at Tablet Surfaces Using Multi-Series near-Infrared Hyperspectral Imaging and Multivariate Curve Resolution. Eur. J. Pharm. Biopharm. 2015, 93, 224–230. [Google Scholar] [CrossRef]
  29. Piqueras, S.; Duponchel, L.; Tauler, R.; de Juan, A. Monitoring Polymorphic Transformations by Using in Situ Raman Hyperspectral Imaging and Image Multiset Analysis. Anal. Chim. Acta 2014, 819, 15–25. [Google Scholar] [CrossRef]
  30. Laborde, A.; Puig-Castellví, F.; Jouan-Rimbaud Bouveresse, D.; Eveleigh, L.; Cordella, C.; Jaillais, B. Detection of Chocolate Powder Adulteration with Peanut Using Near-Infrared Hyperspectral Imaging and Multivariate Curve Resolution. Food Control 2021, 119, 107454. [Google Scholar] [CrossRef]
  31. Fornasaro, S.; Vicario, A.; de Leo, L.; Bonifacio, A.; Not, T.; Sergo, V. Potential Use of MCR-ALS for the Identification of Coeliac-Related Biochemical Changes in Hyperspectral Raman Maps from Pediatric Intestinal Biopsies. Integr. Biol. 2018, 10, 356–363. [Google Scholar] [CrossRef]
  32. Rutledge, D.N.; Jouan-Rimbaud Bouveresse, D. Independent Components Analysis with the JADE Algorithm. TrAC Trends Anal. Chem. 2013, 50, 22–32. [Google Scholar] [CrossRef]
  33. Hashemi-Nasab, F.S.; Parastar, H. Vis-NIR Hyperspectral Imaging Coupled with Independent Component Analysis for Saffron Authentication. Food Chem. 2022, 393, 133450. [Google Scholar] [CrossRef] [PubMed]
  34. Lee, P.C.; Meisel, D. Adsorption and Surface-Enhanced Raman of Dyes on Silver and Gold Sols. J. Phys. Chem. 1982, 86, 3391–3395. [Google Scholar] [CrossRef]
  35. Aguilera-Luiz, M.M.; Vidal, J.L.M.; Romero-González, R.; Frenich, A.G. Multi-Residue Determination of Veterinary Drugs in Milk by Ultra-High-Pressure Liquid Chromatography–Tandem Mass Spectrometry. J. Chromatogr. A 2008, 1205, 10–16. [Google Scholar] [CrossRef]
  36. Chen, Y.; Schwack, W. Planar Chromatography Mediated Screening of Tetracycline and Fluoroquinolone Antibiotics in Milk by Fluorescence and Mass Selective Detection. J. Chromatogr. A 2013, 1312, 143–151. [Google Scholar] [CrossRef]
  37. Jähnke, R.W.O. A Concise Quality Control Guide on Essential Drugs and Other Medicines—Volume II Thin Layer Chromatographic Tests; Global Pharma Health Fund: Frankfurt, Germany, 2008. [Google Scholar]
  38. Soares, F.L.F.; Ardila, J.A.; Carneiro, R.L. Thin-Layer Chromatography–Surface-Enhanced Raman Spectroscopy and Chemometric Tools Applied to Pilsner Beer Fingerprint Analysis. J. Raman Spectrosc. 2017, 48, 943–950. [Google Scholar] [CrossRef]
  39. Junior, B.R.A.; Soares, F.L.F.; Ardila, J.A.; Durango, L.G.C.; Forim, M.R.; Carneiro, R.L. Determination of B-Complex Vitamins in Pharmaceutical Formulations by Surface-Enhanced Raman Spectroscopy. Spectrochim. Acta A Mol. Biomol. Spectrosc. 2018, 188, 589–595. [Google Scholar] [CrossRef]
  40. Jaumot, J.; de Juan, A.; Tauler, R. MCR-ALS GUI 2.0: New Features and Applications. Chemom. Intell. Lab. Syst. 2015, 140, 1–12. [Google Scholar] [CrossRef]
  41. Kassouf, A.; Jouan-Rimbaud Bouveresse, D.; Rutledge, D.N. Determination of the Optimal Number of Components in Independent Components Analysis. Talanta 2018, 179, 538–545. [Google Scholar] [CrossRef]
  42. Vijaya Chamundeeswari, S.P.; James Jebaseelan Samuel, E.; Sundaraganesan, N. Molecular Structure, Vibrational Spectra, NMR and UV Spectral Analysis of Sulfamethoxazole. Spectrochim. Acta A Mol. Biomol. Spectrosc. 2014, 118, 1–10. [Google Scholar] [CrossRef]
  43. Ungurean, A.; Leopold, N.; David, L.; Chiş, V. Vibrational Spectroscopic and DFT Study of Trimethoprim. Spectrochim. Acta A Mol. Biomol. Spectrosc. 2013, 102, 52–58. [Google Scholar] [CrossRef] [PubMed]
  44. van Rhijn, J.A.; Lasaroms, J.J.P.; Berendsen, B.J.A.; Brinkman, U.A.T. Liquid Chromatographic–Tandem Mass Spectrometric Determination of Selected Sulphonamides in Milk. J. Chromatogr. A 2002, 960, 121–133. [Google Scholar] [CrossRef] [PubMed]
Figure 1. Molecular structures of Sulfamethoxazole (SMX) and Trimethoprim (TMP).
Chemosensors 10 00528 g001
Figure 2. Schematic representation of a hyperspectral image of a TLC plate.
Chemosensors 10 00528 g002
Figure 3. Conventional Raman spectra and SERS of both drugs: (a) SMX and (b) TMP.
Chemosensors 10 00528 g003
Figure 4. (a) TLC plate after analysis in UV chamber and (b) SERS spectra of the chromatographic bands observed in the plate.
Chemosensors 10 00528 g004
Figure 5. (a) Empirical response surface for TMP and (b) response surface from Equation (1) for SMX. Experiments with better empirical results are highlighted in red. The blue star is the maximum intensity from Equation (3).
Chemosensors 10 00528 g005
Figure 6. SERS spectra with pH variation for (a) SMX and (b) TMP.
Chemosensors 10 00528 g006
Figure 7. (a) SMX score maps recovered by MCR-ALS and (b) analytical curve. (c) Score maps recovered by ICA and (d) analytical curve.
Chemosensors 10 00528 g007
Figure 8. (a) Recovered SERS spectrum and (b) score map for SMX, (c) recovered SERS spectrum and (d) score map for interferent 1, and (e) recovered SERS spectrum and (f) score map for interferent 2 for milk sample spiked to 2 times the MRL concentration for SMX.
Chemosensors 10 00528 g008
Figure 9. (a) TMP score maps recovered by MCR-ALS and (b) analytical curve. (c) Score maps recovered by ICA and (d) analytical curve.
Chemosensors 10 00528 g009
Figure 10. (a) Recovered SERS spectra for TMP standard, (b) concentration (chromatographic) profile for 5.00 × 10⁻⁶ mol·L−1 TMP standard solution recovered by (b) MCR-ALS and (c) ICA.
Chemosensors 10 00528 g010
Figure 11. (a) Recovered SERS spectrum and (b) score map for TMP, (c) recovered SERS spectrum and (d) score map for interferent 1, and (e) recovered SERS spectrum and (f) score map for interferent 2 in milk analysis.
Chemosensors 10 00528 g011
Table 1. Central composite experimental design and SERS intensity values.
Codified ValuesReal ValuesResponses
ExperimentNaClAuNPs M.V. ¹ (%)NaCl (mol·L−1)AuNPs M.V. ¹ (%)SMXTMP
1−1−10.487.152571930
21−11.687.1511934975
3−110.452.1413379842
4111.652.149426686
50017018188701
60017014576668
70017012365813
8−1.68007013695841
91.6802703606201
100−1.6811003544899
1101.6814016612263
1 AuNPs maintained volume after centrifugation.
Table 2. TMP recovered from commercial milk samples at different spiking levels: S0 (not spiked), S1 (spiked with 1.7 × 10⁻⁷ mol·L−1), and S2 (spiked with 3.4 × 10⁻⁷ mol·L−1).
Recovering (%)
MCR-ALSICA
Milk A—S0N.D.N.D.
Milk B—S0N.D.N.D.
Milk C—S0N.D.N.D.
Milk A—S198 ± 6%106 ± 15%
Milk B—S1119 ± 24%100 ± 15%
Milk C—S1110 ± 2%82 ± 17%
Milk A—S2102 ± 22%83 ± 1%
Milk B—S2111 ± 19%96 ± 8%
Milk C—S2107 ± 15%96 ± 13%
Publisher’s Note: MDPI stays neutral with regard to jurisdictional claims in published maps and institutional affiliations.