Article

Hydrogen-Sensing Properties of Ultrathin Pt-Co Alloy Films

1
Instituto de Engenharia de Sistemas E Computadores—Microsistemas e Nanotecnologias (INESC MN), 1000-029 Lisbon, Portugal
2
Instituto Superior Tecnico (IST), Universidade de Lisboa, 1040-001 Lisbon, Portugal
3
Department of Physics, Marmara University, Ziverbey, 34722 Istanbul, Türkiye
4
Department of Physics, Inonu University, 44280 Malatya, Türkiye
*
Author to whom correspondence should be addressed.
Chemosensors 2022, 10(12), 512; https://doi.org/10.3390/chemosensors10120512
Submission received: 31 October 2022 / Revised: 29 November 2022 / Accepted: 30 November 2022 / Published: 2 December 2022
(This article belongs to the Special Issue Application and Advance of Gas Sensors)

Abstract

:
The present work aims to investigate the feasibility of utilizing Pt and PtCo alloy ultrathin films as hydrogen gas sensors in order to reduce the cost of the hydrogen gas sensors by using low-cost metallic materials. In this study, ultrathin Pt and PtCo alloy thin films are evaluated for hydrogen sensors. The stoichiometry and structural characterization of the thin films are observed from XPS, SEM, and EDX measurements. The 2-nm-thick Pt and PtCo films deposited by sputtering onto Si/SiO2 covers homogeneously the surface in an fcc crystalline plane (111). The hydrogen gas-sensing properties of the films are assessed from the resistance measurement between 25 °C and 150 °C temperature range, under atmospheres with hydrogen concentration ranging from 10 ppm to 5%. The hydrogen-sensing mechanism of ultrathin PtxCo1-x alloy films can be elucidated with the surface scattering phenomenon. PtCo thin alloy films show better response time than pure Pt thin films, but the alloy films show lower sensor response than pure Pt film’s sensor response. Aside from these experimental investigations, first-principles calculations have also been carried out for bare Pt and Co, and also PtCo alloys. Compared to the theoretical calculations, the sensor response to change decreases with increasing Co content, a result that is compatible with the experimental results. In an attempt to explain the decrease in the sensor response of PtCo alloy films compared to bare Pt film, a variety of different phenomena are discussed, including the shrinking lattice of the structure or dendritic surface structure of PtCo alloy films by the increasing cobalt ratio.

1. Introduction

The use of hydrogen (H2) as a suitable, clean, economical, sustainable, and efficient energy source has been increasing in diverse application areas since it reduces CO2 gas generated by the combustion of fossil fuels. These fossil fuels are the main cause of the greenhouse effect [1]. Therefore, alternatives such as H2 are seriously considered as an ideal energy source of the future [2] and will be critical enablers in achieving the European Green Deal’s ambitious goals.
H2 has unconventional properties such as a high diffusion coefficient, low boiling point, and a very low density. It also possesses a wide flammable range compared to other gases, a high combustion heat, and a low minimum ignition energy. H2 also behaves as a robust reducing agent for plenty of elements and has a high permeability through many materials, which demands special precautions in specific applications. For example, H2 is a flammable gas, colorless, odorless, tasteless, and cannot be detected by human senses, unless it is present in high concentrations. Hereof, accurate and rapid detection of H2 gas is mandatory to help prevent the risk of an unexpected explosion and to prevent the formation of potentially explosive mixtures with air. Until now, diverse types of H2 sensors have been broadly researched and published [3,4,5,6,7,8,9,10,11] and are commonly classified into nine categories depending on their distinct physical/chemical principles of detection mechanism: (i) electrochemical, (ii) catalytic, (iii) resistor based (semiconductor and metallic) (iv) mechanical, (v) work function based, (vi) acoustic, (vii) optical, (viii) thermal conductivity, and more recently (ix) magnetic. One type of H2 sensor, the resistive metallic H2 sensor, uses palladium (Pd), platinum (Pt), and their alloys as a sensitive layer. Pd-based resistive metallic H2 sensors have been intensively studied, but there are limited studies about Pt-based resistive H2 sensors, especially when combined with magnetic materials that can be integrated into sophisticated spintronic structures.
Although the first research article about Pt-based resistive hydrogen sensors was published in 1999 [12], subsequent publications started to be published after 2012. The numbers of publications on Pt-based resistive hydrogen sensors are less than 20 by searching in Web of Science and/or Google Scholar. Various types of nanostructured Pt such as nonporous film [13], nanowire [14,15,16,17,18], thin film [12,19,20,21,22], Pt-Pd and Pt-Ti layered thin film [23,24], Pt-Au and Pt-Pd core-shell nanoparticle layer [25,26], Pt nanoparticle-coated Pd nanowire [27,28], and PtNi alloy film [29] are used as a sensitive material for Pt-based resistive type hydrogen gas sensor applications. When all the resistive Pt-based hydrogen sensor studies were examined, the resistance of the Pt nanostructure increased or decreased in the hydrogen environment. This different behavior of resistive Pt-based hydrogen sensors is explained by different detection mechanisms. The decrease in the resistance of the Pt nanostructure in the hydrogen environment is explained by the scattering of electrons from the Pt surface [12,17,18,19,20]. Tanaka et al. obtained Pt thin film by electron beam deposition method and measured the hydrogen gas detection properties in different humidity environments and determined that humidity had no effect on the sensor [20]. Yoo et al. fabricated Pt nanowire array by using PDMS molds and they tested the H2 gas-sensing properties of Pt nanowire array depending on the nanowire thickness and carrier gas [17]. In our previous study, Pt thin films with different thicknesses were sputtered on glass slides, and sensor measurements were made against 0.1% to 1% hydrogen concentration depending on the temperature, and the best sensor response was obtained for 2 nm thick Pt film at room temperature [19]. On the other hand, the increase in the resistance of the Pt nanostructure in the hydrogen environment is explained in three ways. First, the increase in the resistance of Pt in hydrogen was explained by the formation of PtHx hydride [13]. In addition, it was stated that the presence of oxygen in the environment has no effect on the detection of hydrogen by the resistive Pt sensor [13]. Second, the increase in the resistance of Pt in the hydrogen environment is explained by the scattering of electrons from defects in Pt [14]. Cao et al. produced Pt nanowire array by focused ion beam method between gold (Au) electrodes prepared by photolithography and investigated the hydrogen gas detection properties of this sensor structure in a wide concentration range [14]. They also found that this sensor was unaffected by interference gases and remained stable for a long time. Third, the increase in the resistance of Pt in the hydrogen environment is explained by the scattering of electrons from the grain boundary of the Pt nanoparticles [25]. Rajoua et al. produced Pt-Au core-shell nanoparticle layer on microelectrodes by Langmuir–Blodgett method and investigated the H2 gas detection properties of this sensor structure [25]. Depending on the increase in Pt shell thickness, both an increase and a decrease in the resistance of the Pt-based sensor were obtained in the hydrogen environment. Here, both scattering of electrons from the surface and scattering from the boundaries of nanoparticles are effective in the resistance of the sensor. The decrease in the resistance of the sensor with low (3–8 nm) Pt shell thickness in the hydrogen environment is explained by the dominant scattering of electrons from the surface. When the Pt shell thickness was increased to 12 nm, an increase in the resistance of the sensor was obtained in the hydrogen environment, and this was explained by the dominant scattering of electrons from the boundaries of the nanoparticles. Therefore, there are still more research required on the sensing mechanism of Pt-based resistive hydrogen sensors.
Essentially, the purpose of this study is to reduce the amount of Pt that needs to be combined with a variety of other materials in alloy forms to achieve hydrogen-sensing properties similar to or even better than pure Pt-based hydrogen gas sensors. These alloy type Pt-based resistive hydrogen gas sensors have become more affordable as a consequence of their low price. After the success of our previous study (PtNi) [29], we decided to try out our approach with Co, since the different chemical compositions of the PtNi alloy films provided similar results as the pure Pt-resistive hydrogen sensors. In this study, the changes in electrical resistance and H2 gas-sensing properties of PtxCo1-x thin films fabricated by the sputtering method are investigated depending on the temperature, Co content in the alloy, and H2 concentration. In addition, the mechanisms of PtxCo1-x thin films as gas sensors are explained.

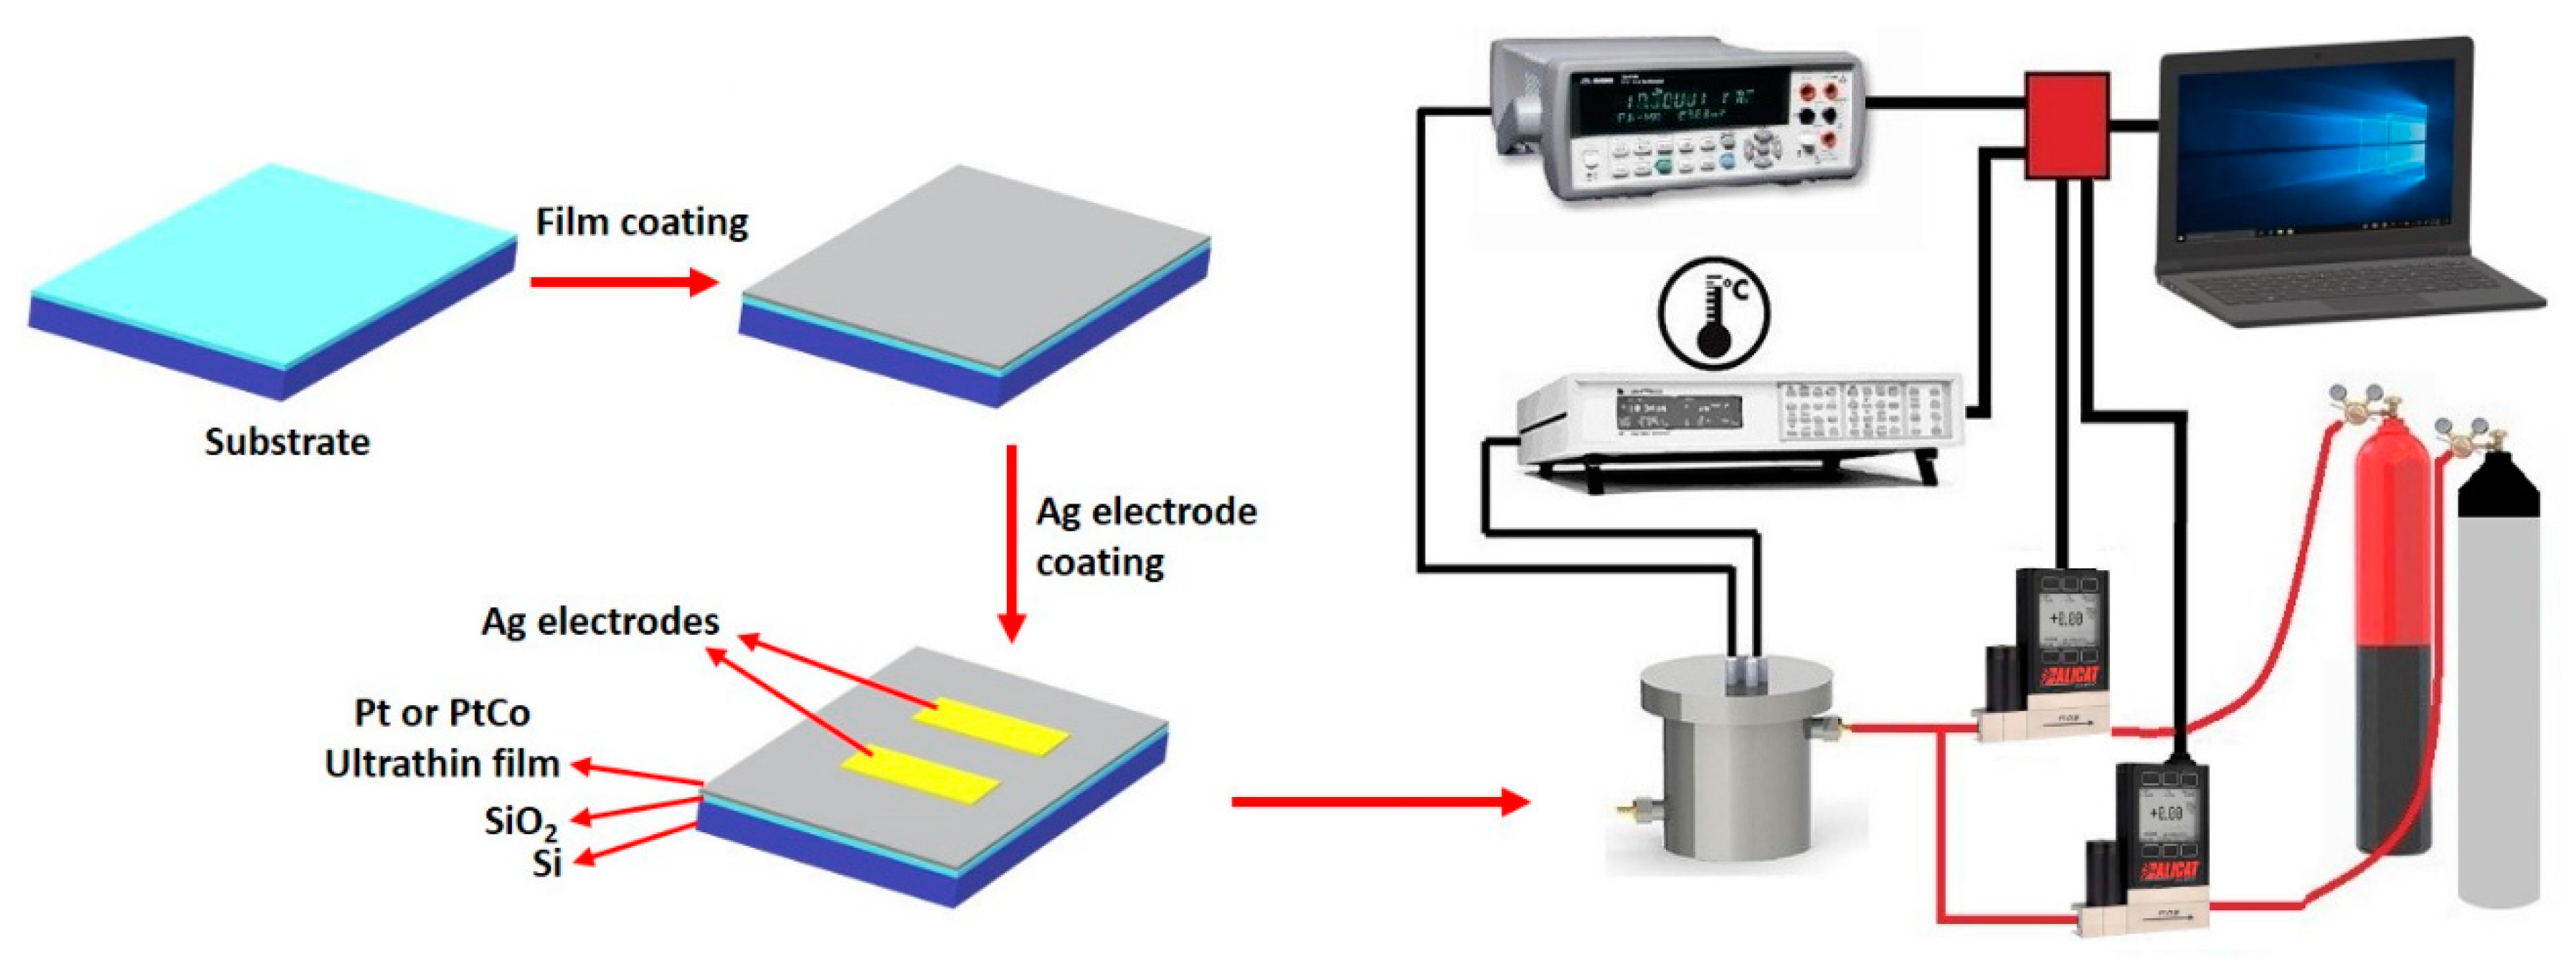
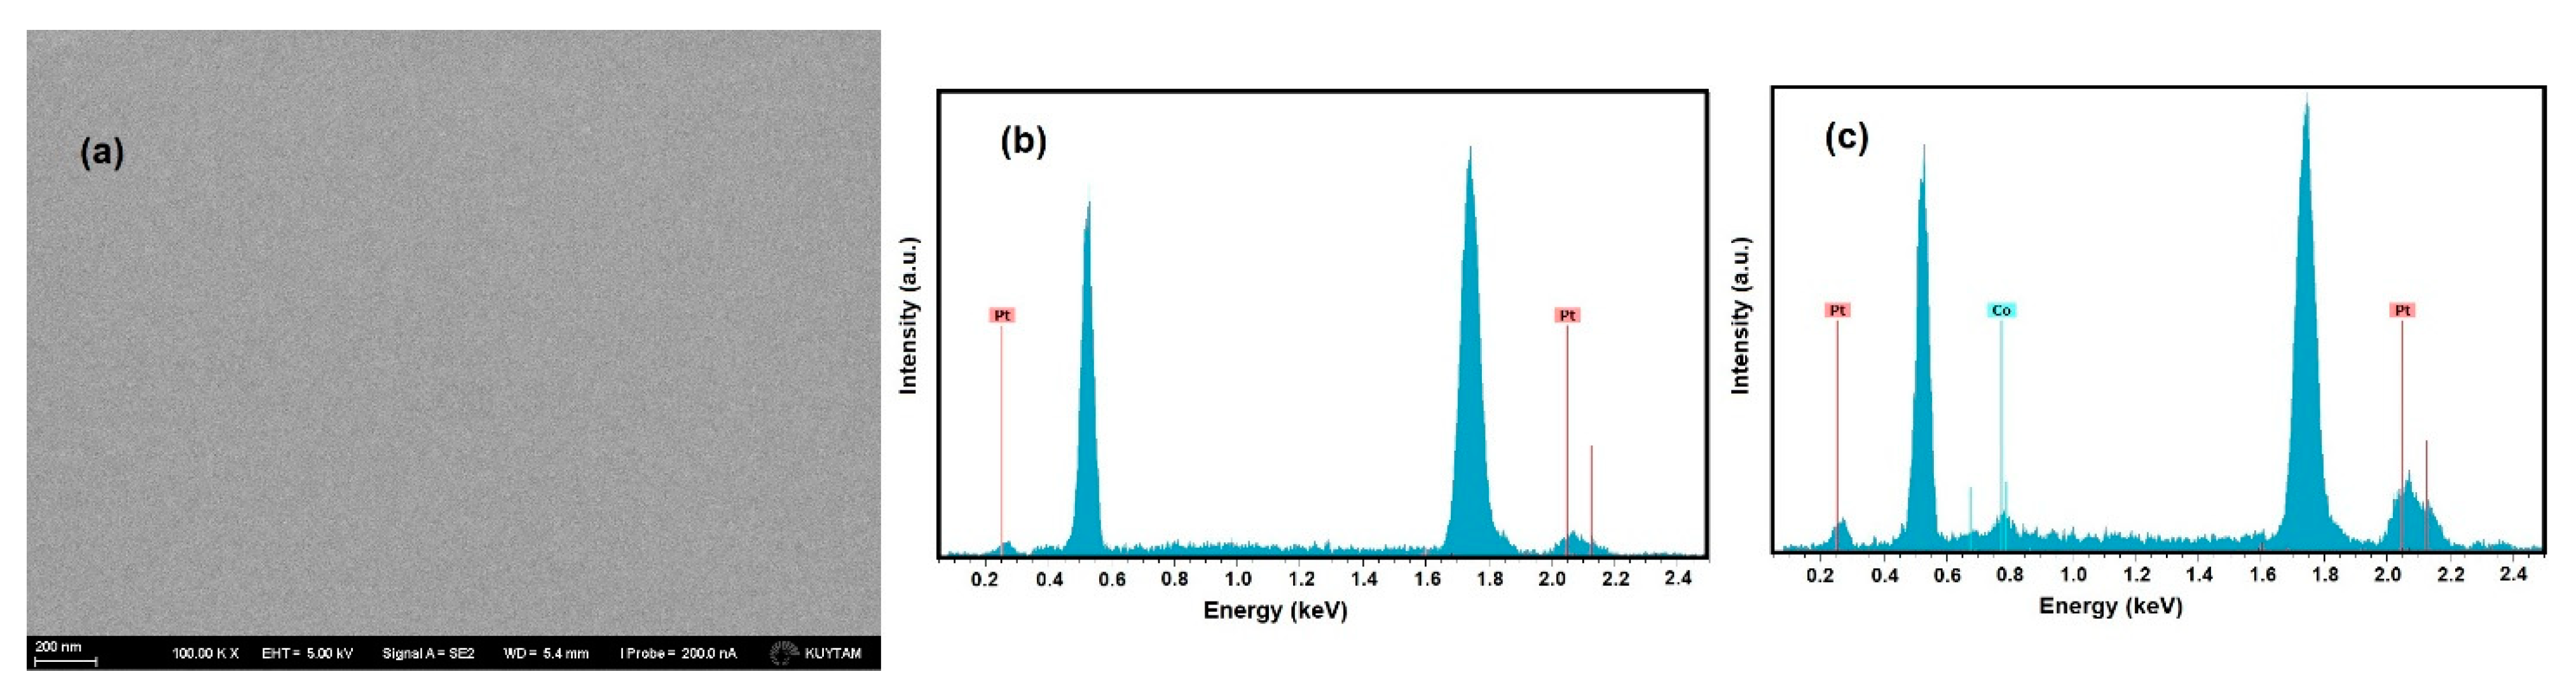
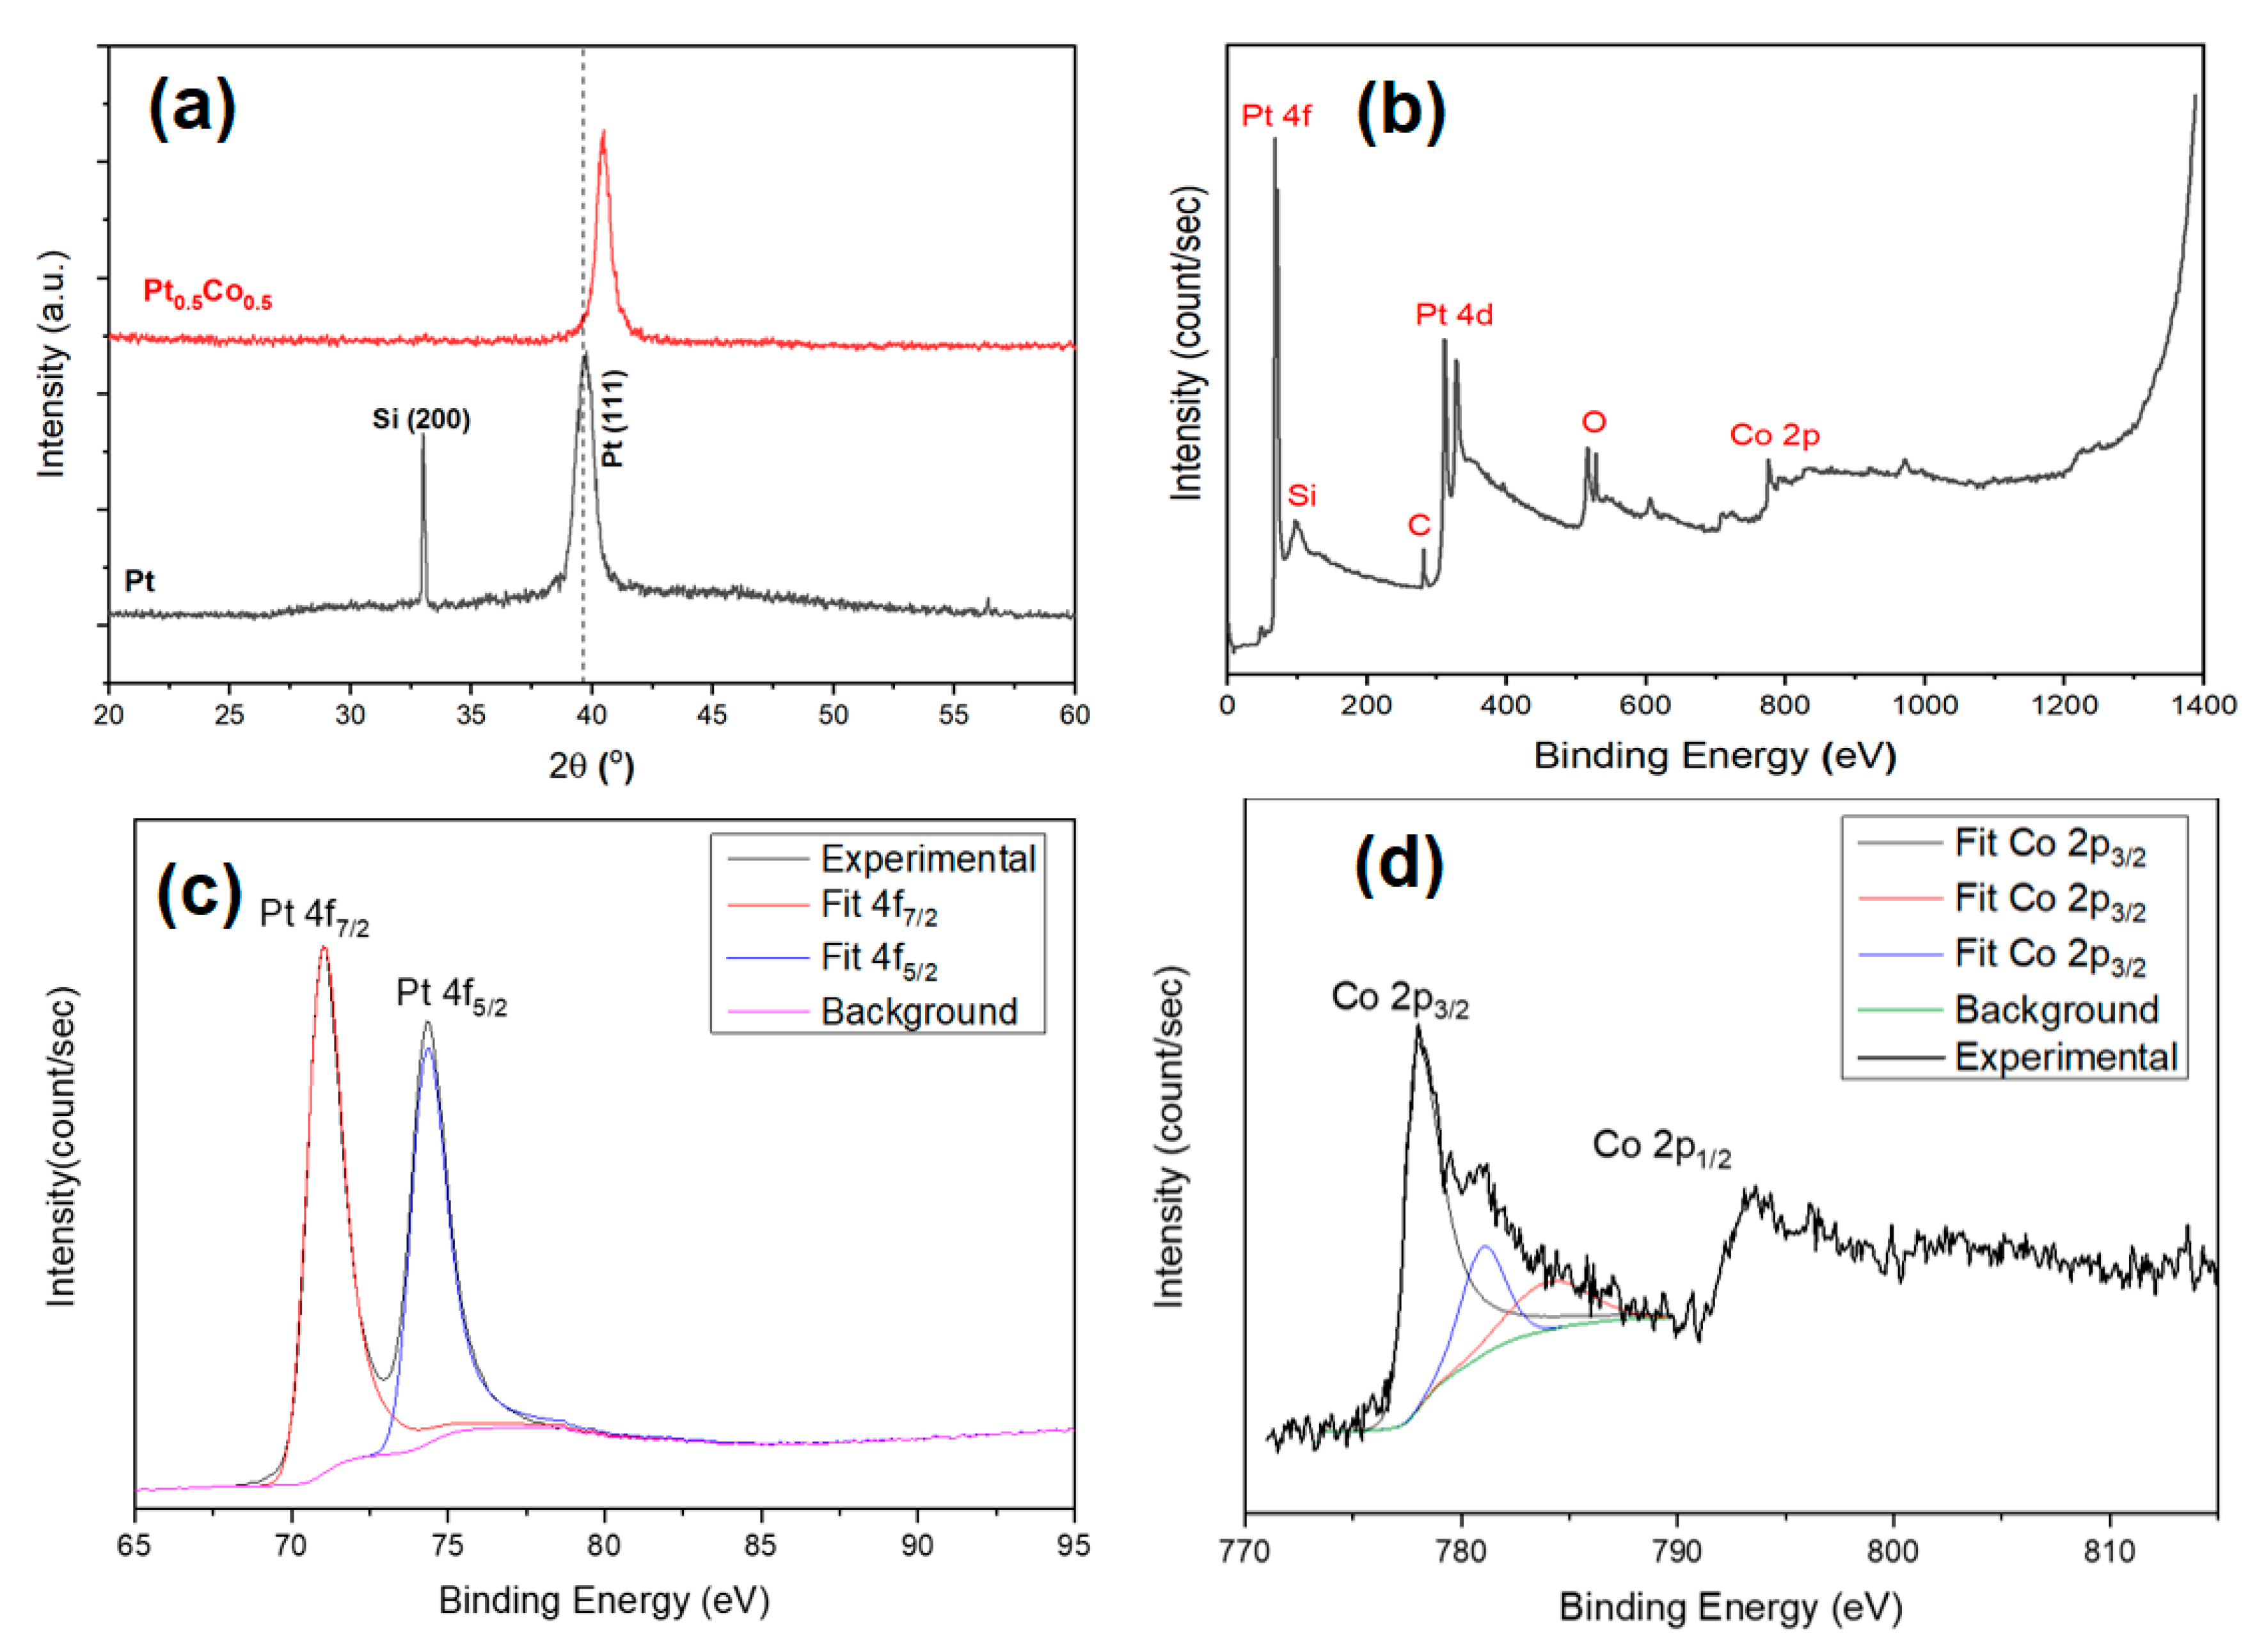
2. Materials and Methods

Ultrathin PtxCo1-x (x = 1, 0.75, 0.5, and 0.25) films with approximately 2 nm were deposited on 100 nm Si/SiO2 substrates (dimensions: 1 × 1 cm2) using a Nordiko 2000 [30] magnetron sputtering system. The system was equipped with a load lock for fast sample transfer with a high vacuum chamber (base pressure 4 × 10⁻⁸ Torr) and 3-inch diameter targets. The PtxCo1-x (x = 0.25, 0.5. 0.75, and 1) ultrathin films were grown by using the co-sputtering technique from pure Co and Pt targets in a wave-mode deposition option, where each material was deposited with 0.439 Å/s and 1.15 Å/s, in Co and Pt layers respectively. Homogeneity of films is achieved by these low deposition rates and the large number of sequences. For the platinum deposition, a DC source is used, and cobalt is grown by the RF source. The deposition rate of the materials was calibrated by Dektak 3030ST profilometer. Pt and PtCo alloy films were annealed at 300 °C for 2 h under 2 × 10⁻² mbar vacuum conditions. Structural characterization of the film was done by field emission scanning electron microscopy (ZEISS ULTRA PLUS), energy dispersive X-ray spectroscopy (EDX), X-ray diffraction (XRD, Rigaku D/MAX 2200), X-ray photoelectron spectroscopy (XPS, Specs-Flex) techniques.
In order to obtain a resistive sensor device, two silver contacts separated by 1 mm are coated onto the pure Pt and alloy PtCo ultrathin films by a thermal evaporator system (PVD system-NONOVAK 400). The electrical resistances of the thin film sensor devices are continuously measured under different ambient conditions in a home-made measurement cell by using Keithley 2700 Multimeter. Figure 1 shows a schematic illustration for fabrication of sensor device and gas-sensing measurement setup. The dry air is used as a carrier gas, the H2 concentration is changed from 10 ppm to 5%, and the temperature is varied with Lakeshore 335 temperature controller between 25 °C and 150 °C by using a heater in the measurement cell. The gas concentration is varied with two Alicat mass flow controller.
To demonstrate the possibility of the hydrogen diffusion to the first Pt, Pt0.5Co0.5, and Co sublayers in four monolayer-thick Pt, Pt0.5Co0.5, and Co layers, we performed density functional theory (DFT) computations, implemented in VASP program [31,32]. The Pt/Co crystal structures are created in the [111] crystallographic direction along with a 10−15 Å of vacuum layer. The exchange-correlation energy is defined by Perdew–Burke–Ernzerhof function [33,34]. Projector-augmented-wave pseudopotentials are used to describe valence-core interactions [35]. We choose plane-wave basis-sets with 320 eV of kinetic energy cut-off. We allow to relax the represented supercells in the figure until the forces are smaller than 0.1 meV/Å by using a 16 × 16 × 1 Γ-centered k-point-mesh. In the figure, the structural relaxations of the initial (upper-left) and final (lower-right) states are followed by the nudged elastic band (NEB) [36] calculations to study the hydrogen diffusion energy barrier into the first Pt, PtCo, and Co sublayers. In the diffusion energy barrier calculations, the initial (above surface) and final (below the first sublayer) positions of hydrogen atoms are first determined by the geometry optimizations. Then, the path of the diffusion is divided into ten frames and the total energy of the system are calculated for each frame. By combining the energies of all the frames, the diffusion barrier graph is formed.

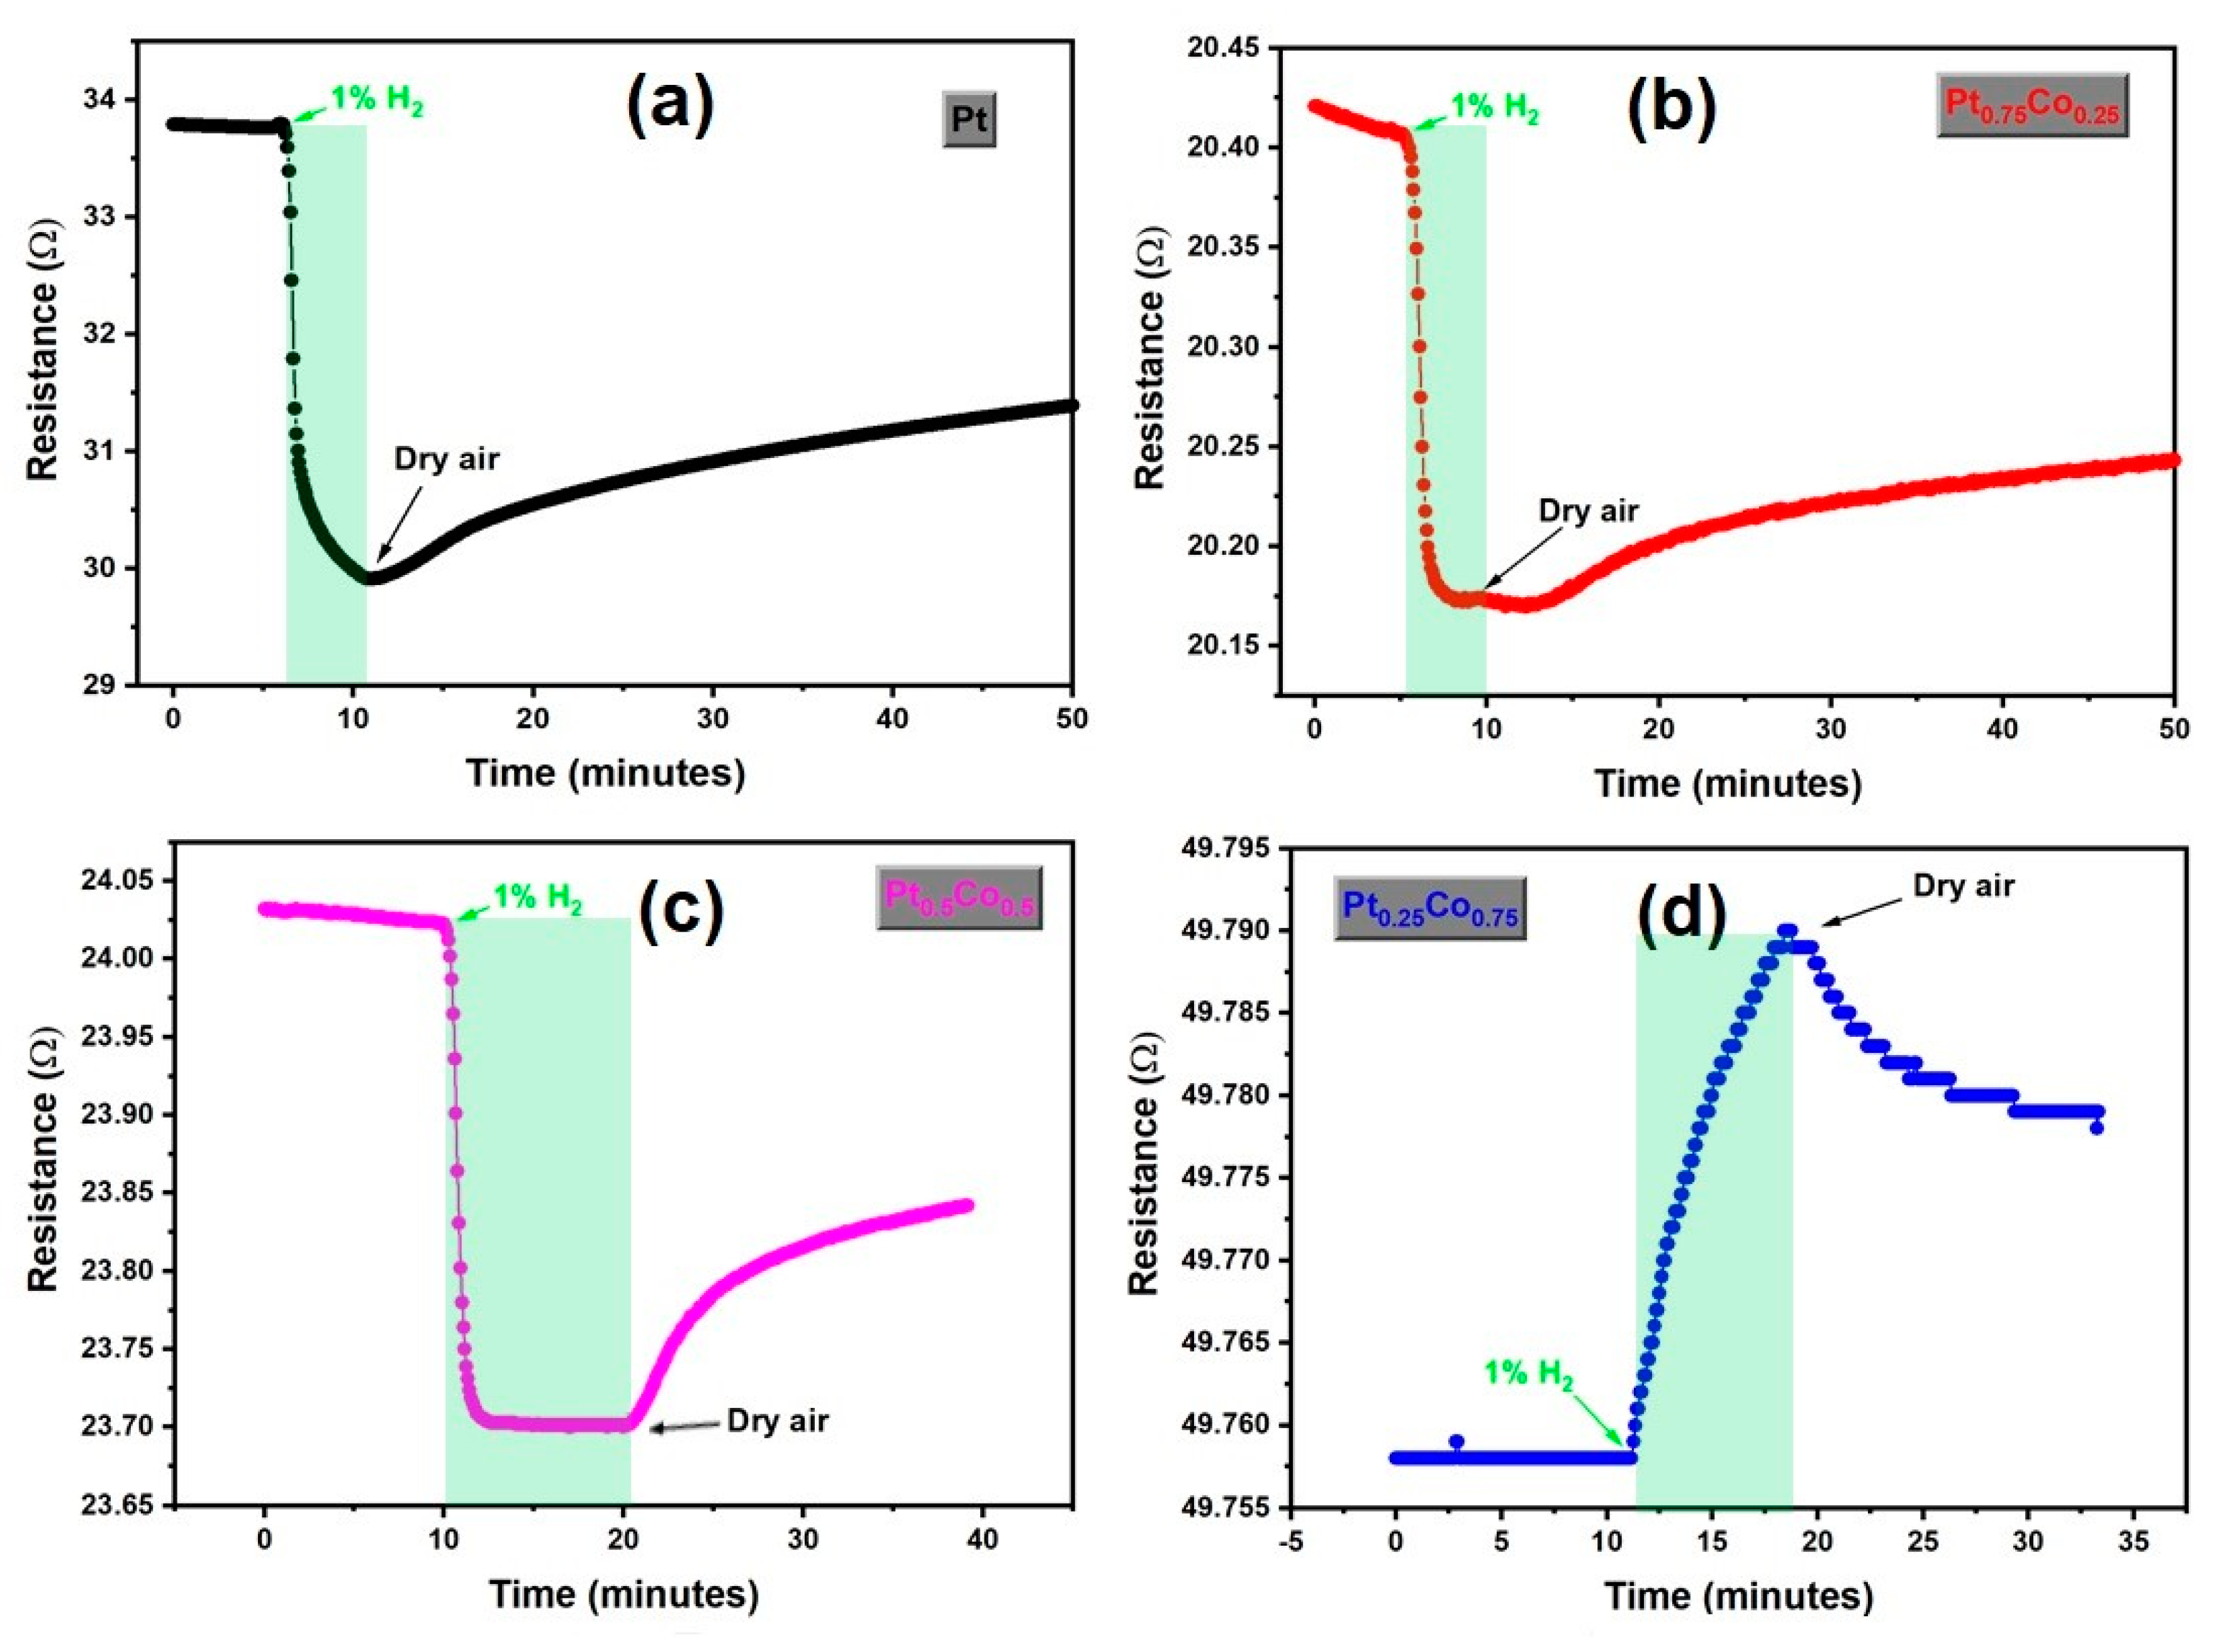
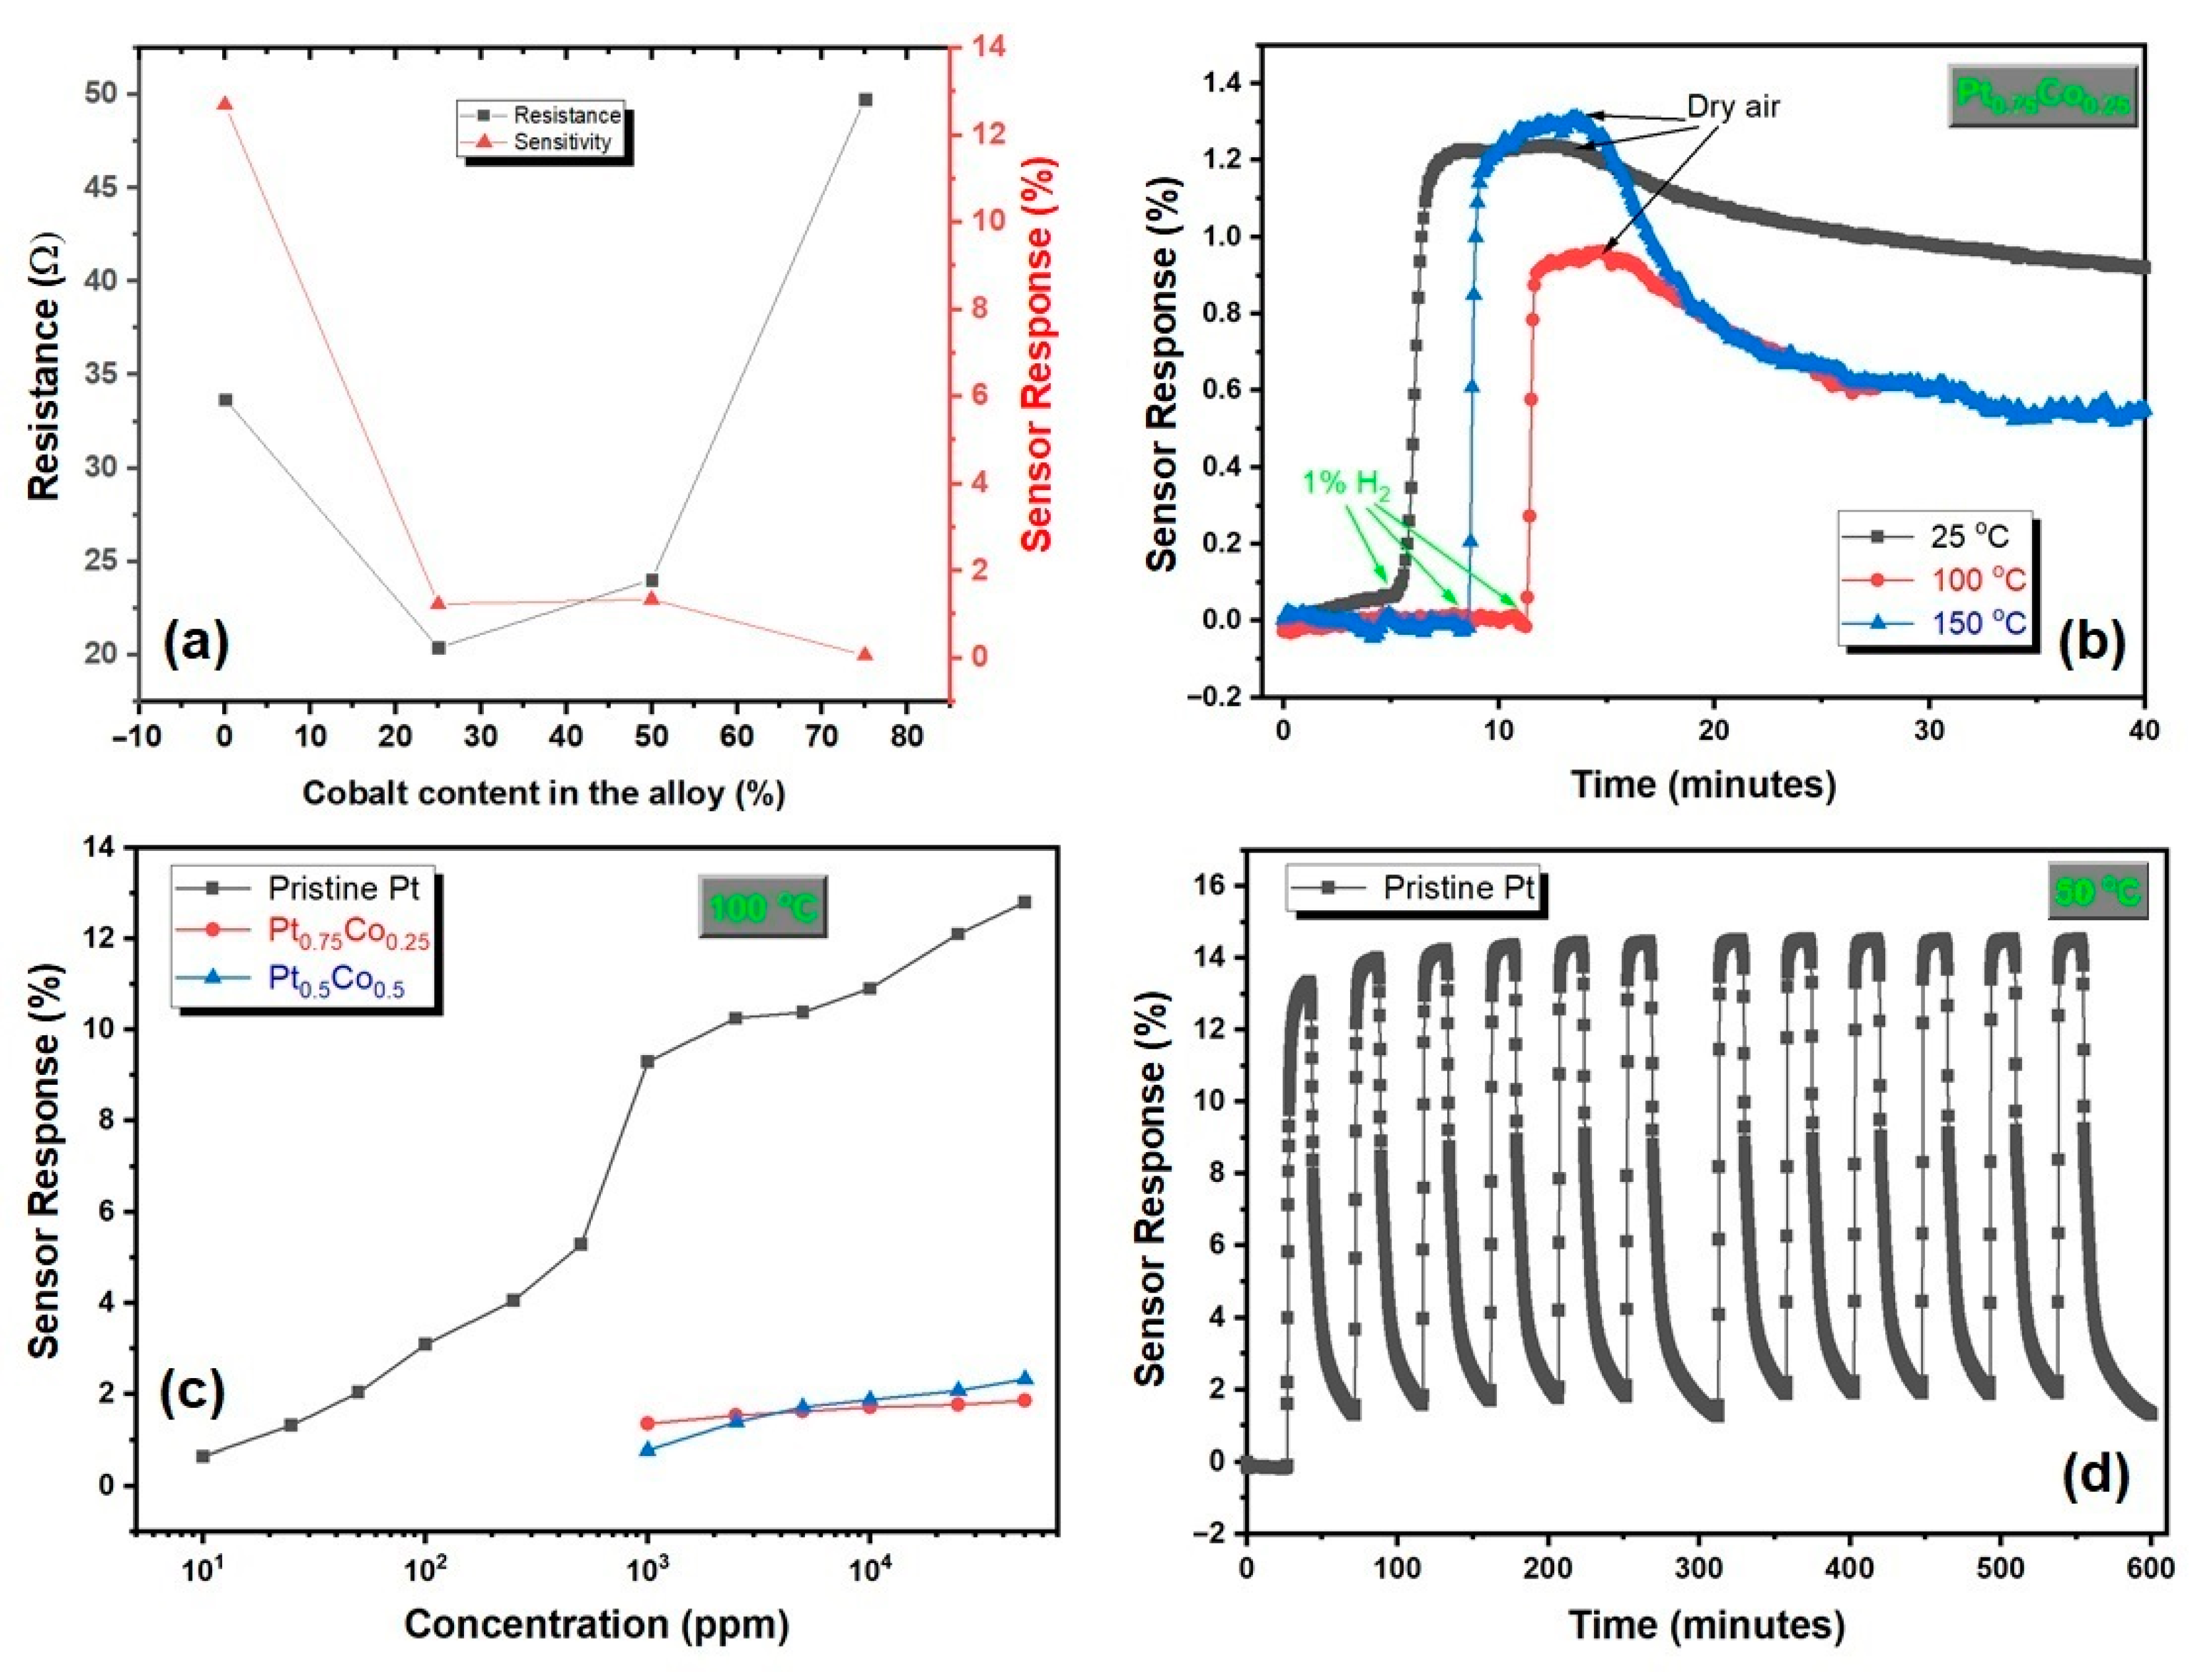
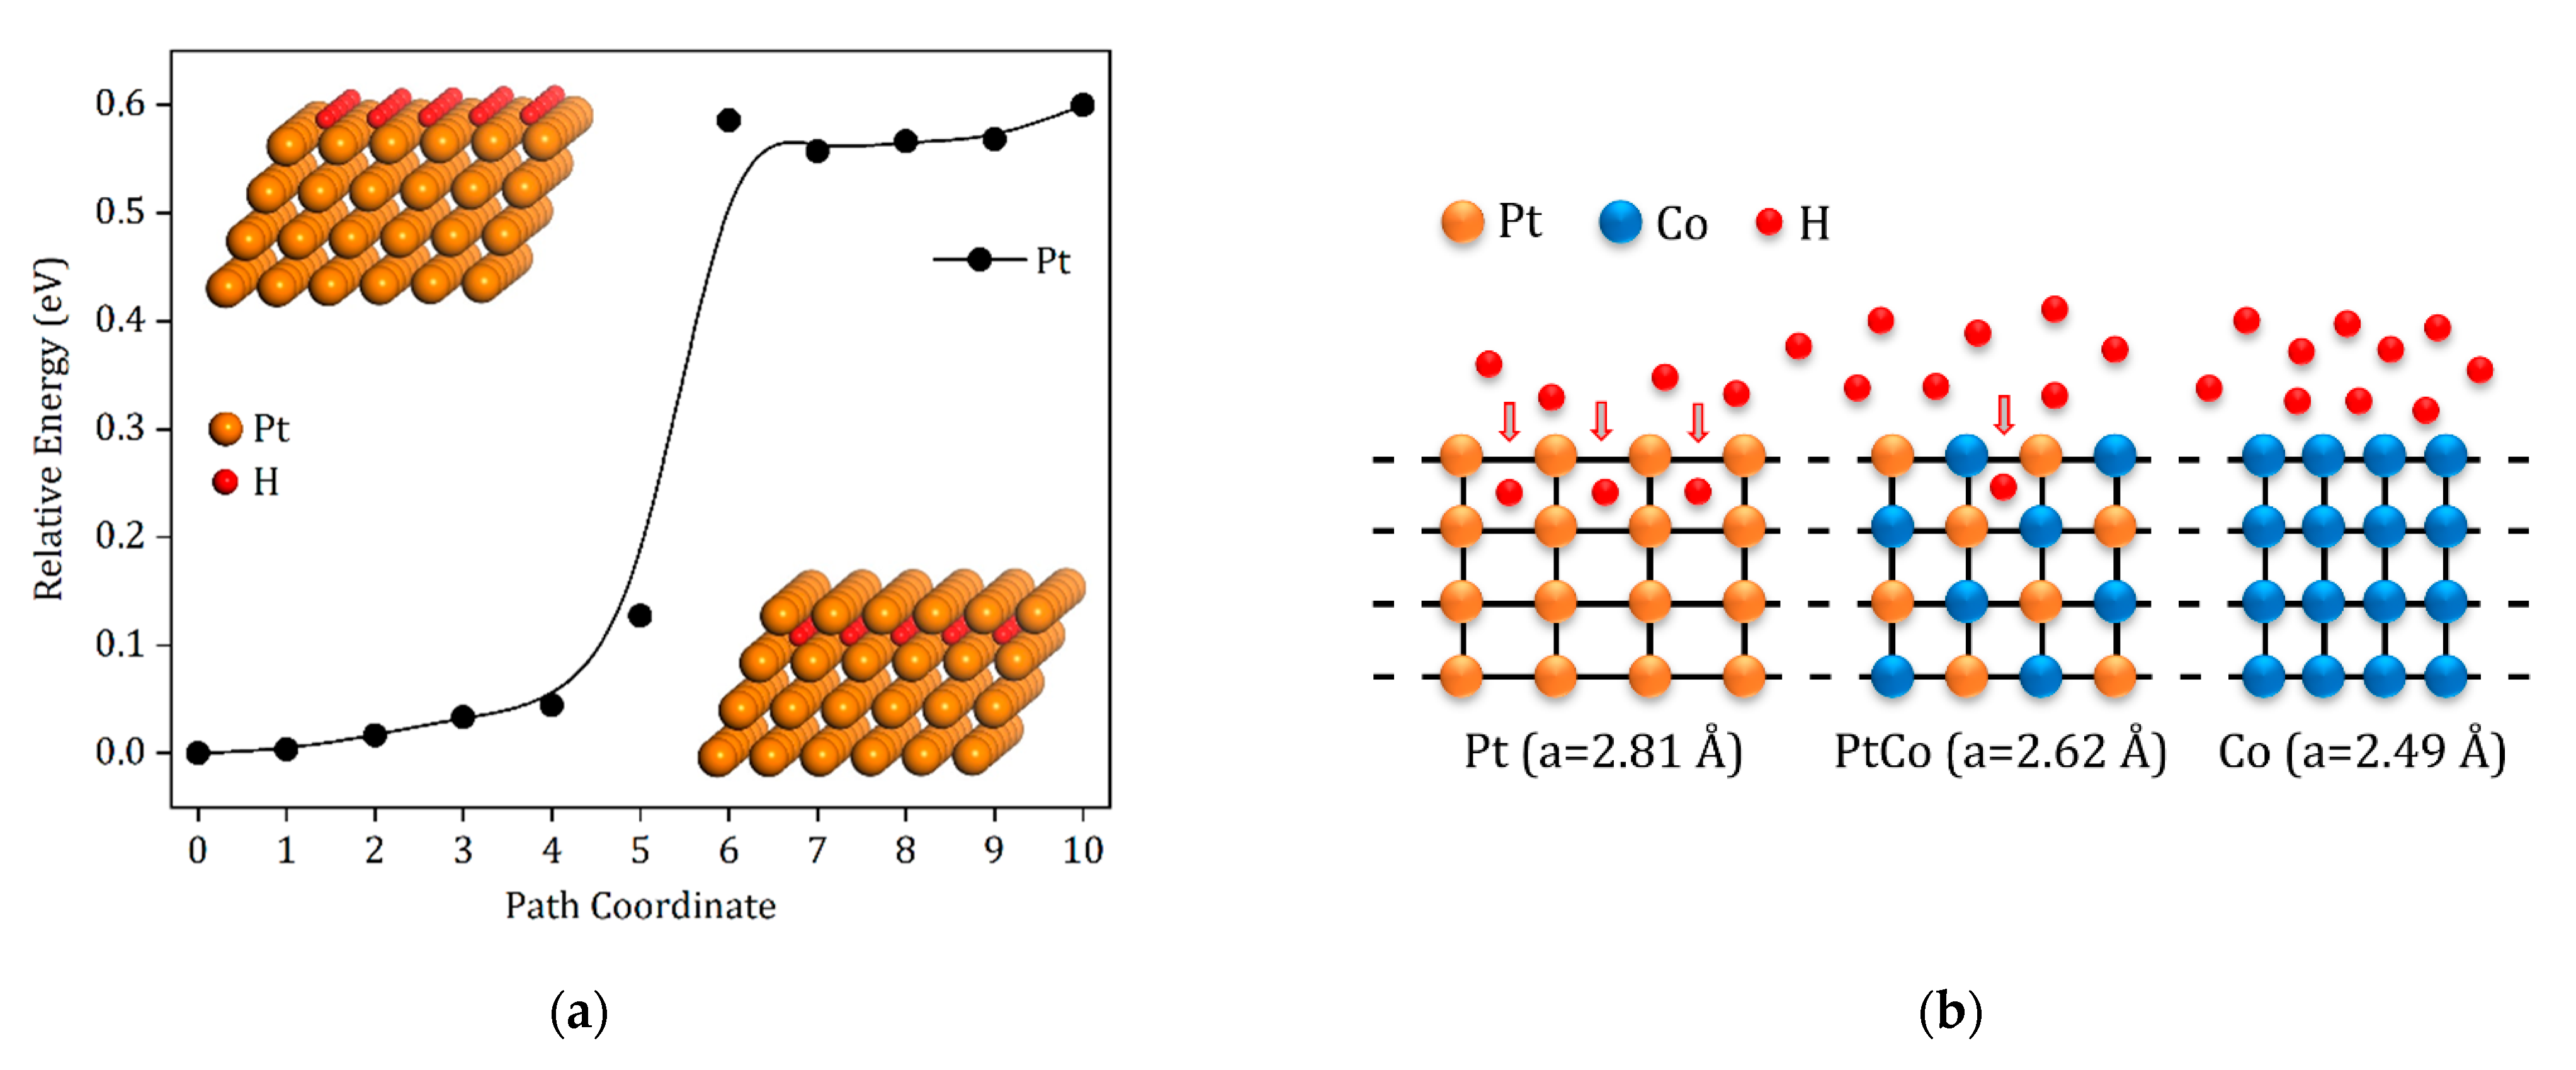
3. Results and Discussion

Figure 2a shows the SEM image of one Pt0.5Co0.5 film sample from where one can infer the surface of the film is smooth, with no segregation of Pt0.5Co0.5. Similar SEM results are obtained for the other Pt and PtCo alloy ultrathin films. The EDX spectrums of pristine Pt and Pt0.75Co0.25 ultrathin films are given in Figure 2b,c, respectively. Pt and Co peaks are marked on Figure 2b,c and the remaining peaks come from Si/SiO2 substrate. The atomic percentage rate of Pt and Co for Pt0.75Co0.25 alloy ultrathin films are obtained so close to our expectation from the EDX spectrum as 75.74% and 24.26%, respectively. Similarly, values very close to what we expected during production are obtained from the EDX spectra of other PtCo alloy ultrathin films. The XRD spectra of pristine Pt and Pt0.5Co0.5 thin films are seen in Figure 3a. The peak near 40° comes from Pt (111) plane reflection, and that corresponds to a face-centered cubic crystalline structure [37]. Peak positioned at around 33° corresponds to Si (200) plane reflection that comes from SiO2/Si substrate. The (111) plane peak position for pristine Pt is approximately 39.9°, and this peak position is shifted to 40.5° for the Pt0.5Co0.5 alloy film. This behavior could be explained with the lattice contraction because of the partial substitution of Pt atoms by Co atoms and is the evidence of PtCo alloy formation. Similar diffraction peak shift is observed for Pt-Co alloy nanoparticles synthesized with different methods [38,39], for Pt-Co alloy nanocrystals synthesized via colloidal synthesis [40], and for Pt-Co alloy network nanostructures synthesized by wet-chemical synthetic method [41].
X-ray photoelectron spectroscopy (XPS) is a powerful technique to study the film surface stoichiometry and the electronic properties. Moreover, the behavior of peaks (such as energy shifts and shape changes), the interaction between the substrate and film are interpreted. In this study, the chemical compositions of ultrathin PtCo alloy films were probed by the XPS technique. The investigation of the survey XPS shows that the surface content includes Pt and Co and C, O, and Si peaks come from the substrate Si/SiO2. The thickness of films are not high enough to suppress the signal coming from the substrate. For more detailed chemical composition of the film analysis, high-resolution XPS window scans are explored. The full XPS survey of Pt0.75Co0.25 thin film sample is shown in Figure 3b. Pt4f, Pt4d, andCo2p peaks are clearly observed in the XPS analysis. Furthermore, the survey XPS and high-resolution window of XPS spectrum from the main photo electron peaks of Pt4f and Co p were obtained by evaluating Pt:Co atomic ratios in thePt0.75Co0.25 alloy film, as shown in Figure 3c,d, respectively. The peak positions of Pt4f, Pt4d, and Co2p from Pt0.75Co0.25 ultrathin alloy films shifted according to their pure elemental XPS peak positions; this binding energy shift was measured around 3 eV. This energy shift is considered as changing the chemical environments of the atoms [42]. For the more detailed analysis of XPS data, two different functions were used. In order to analyze the photoemission peaks, the Shirley background function was chosen. The Voigt function, which complements the photoemission nature, was used for the calculation of peak area [43]. After these analyses, the calculated peak areas of Pt4f and Co2p were divided by their atomic sensitivity factor (ASF); ASF changes from element to element and depends on the experimental setup of the XPS system (such as X ray source, grazing angle). In our XPS setup, Al Kα was used as the X-ray source and the grazing angle was 55 degrees. The Pt to Co ratios, which were figured out from Pt0.75Co0.25 alloy layers of the sample, are 73:27, respectively and the results match with the elemental ratio in the growth of ultrathin Pt0.75Co0.25 films.
Figure 4a–d show the resistance change of pristine Pt, Pt0.75Co0.25, Pt0.5Co0.5, and Pt0.25Co0.75 thin film samples during exposure to dry air and 1% H2 at room temperature, respectively. Except for Pt0.25Co0.75 thin film sample, the resistances of pristine Pt and PtCo alloy ultrathin films were decreased when the measurement chamber was purged with 1% H2, and then during cleaning the measurement chamber by using high purity dry air the resistances increase slowly. Similar behavior was reported for Pt nanowire [17,18] and Pt thin films [12,19,24]. The resistances of all films do not reach the baseline resistances under dry air cleaning. During the resistance of the thin films measurement under dry air flow, the surface of the samples is covered by adsorbed oxygen atoms. While H2 is injected onto the film surface, hydrogen atoms dislocate with oxygen atoms, and the number of electron surface scattering decreases. So, the decrease in the resistances of the ultrathin films may be elucitaded with the surface scattering phenomenon. The interaction between Pt surface and gases is very important in our case. The following reactions could have occurred during hydrogen and oxygen in dry air ad/absorbtion and desorbtion on/from Pt surface [44,45,46];
Pt   + 1   2 O 2   Pt O
Pt O   + 3   2 H 2   Pt H + H 2 O
2 Pt H   + 3   2 O 2   2 Pt O + H 2 O
Chemisorbed oxygen atoms form when Pt surface reacts with the molecular oxygen under dry air condition (reaction 1). Hydrogen atoms dislocated oxygen atoms onto the surface of Pt with catalytic water formation and its desorption from the surface of Pt as given in reaction 2, while the atmospheric condition alters dry air with molecular hydrogen. Oxygen atoms replace hydrogen atoms on the surface of Pt with water formation, when the chemisorbed hydrogen atoms on the surface of Pt react in dry air conditions, as given in reaction 3. The hydrogen or oxygen atoms replacement on the surface is a reversible process.
On the contrary, the resistance of Pt0.25Co0.75 alloy thin film is enhanced when the measurement cell is exposed to 1% H2, and then during cleaning the measurement cell with high purity dry air, the resistances decrease slowly as shown in Figure 4d. The change in the resistance during alteration of the ambient condition from dry air to 1% hydrogen is very low i.e., about 0.03Ω (0.06%) and could be neglected. The hydrogen-sensing mechanism of Co rich Pt0.25Co0.75 alloy thin film is different from that of Pt and other PtCo alloy thin films. Sensor response time (t90), another important sensor parameter, is the time that requires 90% of total resistance variation when the measurement chamber is exposed to analyte gas. The t90 parameters of Pt, Pt0.75Co0.25, and Pt0.5Co0.5 for 1% hydrogen exposure at room temperature were observed as 127, 90, and 72 s, respectively. We also have to consider that our experimental setup is not optimized to characterize properly the response times related to measurement cell volume, death volume, flow rate, etc. The response time decreases with increasing Co content in the alloy. Although the response time parameter improved with the increase of Co ratio in the alloy, the sensor response parameter decreased. The response time is dependent on hydrogen concentration and temperature.
A crucial parameter of a resistive gas sensor is sensor response, which is calculated by using Equations (4) and (5) relying on the decrease or the increase in the sensor device’s resistance, respectively.
S e n s o r   R e s p o n s e   ( % ) = R R H × 100 = R 0 R H R H × 100
S e n s o r   R e s p o n s e   ( % ) = R R 0 × 100 = R H R 0 R 0 × 100
where ∆R is the change in the resistance of the resistive sensor device and R0 is the baseline resistance value for the sensor under dry air flow and RH is the resistance of the sensor when the sensor is exposed to the indicated hydrogen concentration. The sensor responses of pristine Pt and PtCo alloy ultrathin film sensors are evaluated depending on hydrogen concentrations and temperature. Figure 5a shows the baseline resistance and the sensor response for exposure to 1% hydrogen as a function of Co content in the alloy at room temperature. The resistance of Pt thin film decreases while Pt0.75Co0.25 alloy thin film forms and the resistance of PtCo alloy thin film increases with increasing Co content in the alloy films. The sensor response is decreased with increasing Co content in the alloy as seen in Figure 5a. The sensor response of Pt0.25Co0.75 alloy thin film is very low as 0.06 and it is unresponsive to hydrogen. Figure 5b depicts the sensor response versus time graph of Pt0.75Co0.25 alloy ultrathin film exposed to 1% hydrogen at the various temperatures. The sensor response of Pt0.75Co0.25 alloy thin film is observed as approximately 1.2, 0.9, and 1.25 at 25 °C, 100 °C, and 150 °C, respectively. Figure 5c shows the sensor response as a function of logarithmic concentration for pristine Pt, Pt0.75Co0.25, and Pt0.75Co0.25 alloy thin films at the temperature of 100 °C. There is an approximately linear relationship between sensor response and logarithmic concentration for pristine Pt and PtCo alloy thin films. The sensor responses of PtCo alloy films are lower than pure Pt films for all measured gas concentration and temperatures. Moreover, the sensor responses of PtCo alloy films are lower than the sensor responses of PtNi alloy films that is our previous study about low concentration hydrogen detection [29]. Figure 5d represents the stability of pristine Pt thin film sensor exposed to 1% hydrogen at 50 °C. The average sensor response is around 14.29 ± 5% for twelve cycles.
To complement the discussion on the relation between Co concentration and the resistivity, we performed first-principles calculations in Figure 6a. Here, we calculated the change in the total energy of the system during the diffusion of hydrogen along a path that starts from above the surface of Pt (path coordinate 0) and ends below the first sublayer of Pt (path coordinate10). The hydrogen diffusion energy barrier is approximately 0.6 eV for the pristine Pt layer. We then employed the same method to reveal the diffusion barrier for PtCo and Co layers; however, the hydrogen diffusion toward the first sublayers was energetically unfavorable, which precludes the formation of the hydrogen diffusion barrier for PtCo and Co layers. Since the hydrogen does not penetrate into the sublayer of PtCo and Co, we cannot produce any relative energy graph for these systems. We can consider a possible scenario for why the hydrogen sensor response decreases with increasing cobalt ratio. The surface of PtCo alloys may have more dendritically shaped structures with increasing cobalt ratio [47], and therefore, hydrogen cannot diffuse in PtCo alloys. Another reason for this behavior could be the shrinking lattice of the structure by the increasing Co concentration. In the simulations, the lattice constants of Pt, Pt0.5Co0.5, and Co are 2.81 Å, 2.62 Å, and 2.49 Å, respectively. While the lattice constant is decreasing by the Co ratio, the penetration of hydrogen ions into the sublayer of the structure is hindered by the electrostatic interaction of shrunk crystal. Figure 6b shows a schematic diagram for hydrogen penetration into Pt, Pt0.5Co0.5, and Co. As a consequence, the hydrogen sensor response of PtCo alloy structure decreases with increasing Co ratio.

4. Conclusions

In this study, different chemical compositions of PtCo alloy films were prepared by sputtering deposition. XRD, XPS, and SEM techniques were used to characterize the structural and chemical compositions properties. H2-sensing properties of the different PtCo alloys, the resistance of the films, and sensor response were measured under different hydrogen atmospheric conditions. The results were compared with pristine Pt film. The hydrogen sensor response decreases with the increasing Co ratio in the PtCo alloy films. A number of different phenomena are discussed in order to explain the decreasing sensor response of PtCo alloy films when compared to bare Pt films. For example, the shrinking of the lattice structure and the dendritic surface structure of PtCo alloy films as the cobalt ratio increases are considered as possible explanations for the decrease in sensor response.

Author Contributions

Conceptualization, M.E. and N.K.; investigation, M.E., C.D. and N.K.; resources, M.E., C.D., S.C. and N.K.; writing—original draft preparation, M.E., C.D. and N.K.; writing—review and editing, M.E., C.D., S.C. and N.K.; project administration, S.C. and N.K.; funding acquisition, S.C. and N.K. All authors have read and agreed to the published version of the manuscript.

Funding

This study was supported by the research fund of TUBITAK with project number: 121M681. The authors also wish to acknowledge the Fundação para a Ciência e a Tecnologia for funding of the Research Unit INESC MN (UID/05367/2020) through pluriannual BASE and PROGRAMATICO financing.

Institutional Review Board Statement

Not applicable.

Informed Consent Statement

Not applicable.

Acknowledgments

The authors also thank to Inonu University (project number: FCD-2022-2864) for supporting conference attendance.

Conflicts of Interest

The authors declare no conflict of interest.

References

  1. Momirlan, M.; Veziroglu, T.N. Current status of hydrogen energy. Renew. Sust. Energ. Rev. 2002, 6, 141–179. [Google Scholar] [CrossRef]
  2. Armaroli, N.; Balzani, V. The Hydrogen Issue. Chemsuschem 2011, 4, 21–36. [Google Scholar] [CrossRef] [PubMed]
  3. Hubert, T.; Boon-Brett, L.; Black, G.; Banach, U. Hydrogen sensors—A review. Sens. Actuators B-Chem. 2011, 157, 329–352. [Google Scholar] [CrossRef]
  4. Kilinc, N. Resistive Hydrogen Sensors Based on Nanostructured Metals and Metal Alloys. Nanosci. Nanotechnol. Lett. 2013, 5, 825–841. [Google Scholar] [CrossRef]
  5. Sahoo, T.; Kale, P. Work Function-Based Metal-Oxide-Semiconductor Hydrogen Sensor and Its Functionality: A Review. Adv. Mater. Interfaces. 2021, 8, 2100649. [Google Scholar] [CrossRef]
  6. Chen, K.F.; Yuan, D.P.; Zhao, Y.Y. Review of optical hydrogen sensors based on metal hydrides: Recent developments and challenges. Opt. Laser. Technol. 2021, 137, 106808. [Google Scholar] [CrossRef]
  7. Chauhan, P.S.; Bhattacharya, S. Hydrogen gas sensing methods, materials, and approach to achieve parts per billion level detection: A review. Int. J. Hydrog. Energy 2019, 44, 26076–26099. [Google Scholar] [CrossRef]
  8. Korotcenkov, G.; Do Han, S.; Stetter, J.R. Review of Electrochemical Hydrogen Sensors. Chem. Rev. 2009, 109, 1402–1433. [Google Scholar] [CrossRef]
  9. Maksymov, I.S.; Kostylev, M. Magneto-Electronic Hydrogen Gas Sensors: A Critical Review. Chemosensors 2022, 10, 49. [Google Scholar] [CrossRef]
  10. Shinde, P.V.; Rout, C.S. Magnetic gas sensing: Working principles and recent developments. Nanoscale Adv. 2021, 3, 1551–1568. [Google Scholar] [CrossRef]
  11. Majder-Lopatka, M.; Wesierski, T.; Dmochowska, A.; Salamonowicz, Z.; Polanczyk, A. The Influence of Hydrogen on the Indications of the Electrochemical Carbon Monoxide Sensors. Sustainability 2020, 12, 14. [Google Scholar] [CrossRef] [Green Version]
  12. Patel, S.V.; Gland, J.L.; Schwank, J.W. Film structure and conductometric hydrogen-gas-sensing characteristics of ultrathin platinum films. Langmuir 1999, 15, 3307–3311. [Google Scholar] [CrossRef]
  13. Abburi, A.; Abrams, N.; Yeh, W.J. Synthesis of nanoporous platinum thin films and application as hydrogen sensor. J. Porous. Mat. 2012, 19, 543–549. [Google Scholar] [CrossRef]
  14. Cao, F.; Zhao, P.F.; Wang, Z.; Zhang, X.H.; Zheng, H.; Wang, J.B.; Zhou, D.; Hu, Y.M.; Gu, H.S. An Ultrasensitive and Ultraselective Hydrogen Sensor Based on Defect-Dominated Electron Scattering in Pt Nanowire Arrays. Adv. Mater. Interfaces. 2019, 6, 1801304. [Google Scholar] [CrossRef]
  15. Prajapati, C.S.; Bhat, N. Self-heating oxidized suspended Pt nanowire for high performance hydrogen sensor. Sens. Actuators B-Chem. 2018, 260, 236–242. [Google Scholar] [CrossRef]
  16. Ding, M.N.; Liu, Y.; Wang, G.M.; Zhao, Z.P.; Yin, A.X.; He, Q.Y.; Huang, Y.; Duan, X.F. Highly Sensitive Chemical Detection with Tunable Sensitivity and Selectivity from Ultrathin Platinum Nanowires. Small 2017, 13, 1602969. [Google Scholar] [CrossRef]
  17. Yoo, H.W.; Cho, S.Y.; Jeon, H.J.; Jung, H.T. Well-Defined and High Resolution Pt Nanowire Arrays for a High Performance Hydrogen Sensor by a Surface Scattering Phenomenon. Anal. Chem. 2015, 87, 1480–1484. [Google Scholar] [CrossRef]
  18. Yang, F.; Donavan, K.C.; Kung, S.C.; Penner, R.M. The Surface Scattering-Based Detection of Hydrogen in Air Using a Platinum Nanowire. Nano. Lett. 2012, 12, 2924–2930. [Google Scholar] [CrossRef]
  19. Sennik, E.; Urdem, S.; Erkovan, M.; Kilinc, N. Sputtered platinum thin films for resistive hydrogen sensor application. Mater. Lett. 2016, 177, 104–107. [Google Scholar] [CrossRef]
  20. Tanaka, T.; Hoshino, S.; Takahashi, T.; Uchida, K. Nanoscale Pt thin film sensor for accurate detection of ppm level hydrogen in air at high humidity. Sens. Actuators B-Chem. 2018, 258, 913–919. [Google Scholar] [CrossRef]
  21. Tsukada, K.; Inoue, H.; Katayama, F.; Sakai, K.; Kiwa, T. Changes in Work Function and Electrical Resistance of Pt Thin Films in the Presence of Hydrogen Gas. Jpn. J. Appl. Phys. 2011, 51, 015701. [Google Scholar] [CrossRef]
  22. Kilinc, N. Palladium and platinum thin films for low-concentration resistive hydrogen sensor: A comparative study. J. Mater. Sci.-Mater. El. 2021, 32, 5567–5578. [Google Scholar] [CrossRef]
  23. Hassan, K.; Uddin, A.S.M.I.; Chung, G.S. Fast-response hydrogen sensors based on discrete Pt/Pd bimetallic ultra-thin films. Sens. Actuators B-Chem. 2016, 234, 435–445. [Google Scholar] [CrossRef]
  24. Tsukada, K.; Sakai, K.; Kiwa, T. Electric Characteristics of a Loop in Which Two Junctions between a Catalytic Metal and a Noncatalytic Metal Are under Different Hydrogen Gas Concentrations. Appl. Phys. Express 2012, 5, 034102. [Google Scholar] [CrossRef]
  25. Rajoua, K.; Baklouti, L.; Favier, F. Platinum for hydrogen sensing: Surface and grain boundary scattering antagonistic effects in Pt@Au core-shell nanoparticle assemblies prepared using a Langmuir-Blodgett method. Phys. Chem. Chem. Phys. 2018, 20, 383–394. [Google Scholar] [CrossRef]
  26. Uddin, A.S.M.I.; Yaqoob, U.; Hassan, K.; Chung, G.S. Effects of Pt shell thickness on self-assembly monolayer Pd@Pt core-shell nanocrystals based hydrogen sensing. Int. J. Hydrog. Energy 2016, 41, 15399–15410. [Google Scholar] [CrossRef]
  27. Kim, D.H.; Kim, S.J.; Shin, H.; Koo, W.T.; Jang, J.S.; Kang, J.Y.; Jeong, Y.J.; Kim, I.D. High-Resolution, Fast, and Shape-Conformable Hydrogen Sensor Platform: Polymer Nanofiber Yarn Coupled with Nanograined Pd@Pt. ACS Nano. 2019, 13, 6071–6082. [Google Scholar] [CrossRef]
  28. Li, X.W.; Liu, Y.; Hemminger, J.C.; Penner, R.M. Catalytically Activated Palladium@Platinum Nanowires for Accelerated Hydrogen Gas Detection. ACS Nano. 2015, 9, 3215–3225. [Google Scholar] [CrossRef]
  29. Kilinc, N.; Sanduvac, S.; Erkovan, M. Platinum-Nickel alloy thin films for low concentration hydrogen sensor application. J. Alloy. Compd. 2022, 892, 162237. [Google Scholar] [CrossRef]
  30. Nordiko. Available online: https://nordiko-tech.co.uk/ (accessed on 15 October 2022).
  31. Kresse, G.; Furthmuller, J. Efficient iterative schemes for ab initio total-energy calculations using a plane-wave basis set. Phys. Rev. B. 1996, 54, 11169–11186. [Google Scholar] [CrossRef] [PubMed]
  32. Kresse, G.; Furthmuller, J. Efficiency of ab-initio total energy calculations for metals and semiconductors using a plane-wave basis set. Comp. Mater. Sci. 1996, 6, 15–50. [Google Scholar] [CrossRef]
  33. Perdew, J.P.; Ruzsinszky, A.; Csonka, G.I.; Vydrov, O.A.; Scuseria, G.E.; Constantin, L.A.; Zhou, X.L.; Burke, K. Restoring the density-gradient expansion for exchange in solids and surfaces. Phys. Rev. Lett. 2008, 100, 136406. [Google Scholar] [CrossRef] [Green Version]
  34. Perdew, J.P.; Burke, K.; Ernzerhof, M. Generalized gradient approximation made simple. Phys. Rev. Lett. 1996, 77, 3865–3868. [Google Scholar] [CrossRef] [PubMed] [Green Version]
  35. Blochl, P.E. Projector Augmented-Wave Method. Phys. Rev. B. 1994, 50, 17953–17979. [Google Scholar] [CrossRef] [PubMed] [Green Version]
  36. Jonsson, H.; Mills, G.; Jacobsen, K.W. Nudged elastic band method for finding minimum energy paths of transitions. In Classical and Quantum Dynamics in Condensed Phase Simulations; World Scientific: Singapore, 1998; pp. 385–404. [Google Scholar]
  37. Chang, I.; Woo, S.; Lee, M.H.; Shim, J.H.; Piao, Y.; Cha, S.W. Characterization of porous Pt films deposited via sputtering. Appl. Surf. Sci. 2013, 282, 463–466. [Google Scholar] [CrossRef]
  38. Demirkan, B.; Bozkurt, S.; Savk, A.; Cellat, K.; Gulbagca, F.; Nas, M.S.; Alma, M.H.; Sen, F. Composites of Bimetallic Platinum-Cobalt Alloy Nanoparticles and Reduced Graphene Oxide for Electrochemical Determination of Ascorbic Acid, Dopamine, and Uric Acid. Sci. Rep. 2019, 9, 12258. [Google Scholar] [CrossRef] [Green Version]
  39. Wang, H.; Yuan, X.; Li, D.W.; Gu, X.H. Dendritic PtCo alloy nanoparticles as high performance oxygen reduction catalysts. J. Colloid Interface Sci. 2012, 384, 105–109. [Google Scholar] [CrossRef]
  40. Lee, J.D.; Jishkariani, D.; Zhao, Y.R.; Najmr, S.; Rosen, D.; Kikkawa, J.M.; Stach, E.A.; Murray, C.B. Tuning the Electrocatalytic Oxygen Reduction Reaction Activity of Pt-Co Nanocrystals by Cobalt Concentration with Atomic-Scale Understanding. ACS Appl. Mater. Interfaces 2019, 11, 26789–26797. [Google Scholar] [CrossRef]
  41. Xu, J.F.; Liu, X.Y.; Chen, Y.; Zhou, Y.M.; Lu, T.H.; Tang, Y.W. Platinum-Cobalt alloy networks for methanol oxidation electrocatalysis. J. Mater. Chem. 2012, 22, 23659–23667. [Google Scholar] [CrossRef]
  42. O’Connor, D.J.; Sexton, B.A.; Smart, R.S.C. Surface Analysis Methods in Materials Science; Springer: Berlin/Heidelberg, Germany, 2013. [Google Scholar]
  43. Erkovan, M.; Aköz, M.E.; Parlak, U.; Öztürk, O. The Study of Exchange Bias Effect in PtxCo1−x/CoO Bilayers. J. Supercond. Nov. Magn. 2017, 30, 2909–2913. [Google Scholar] [CrossRef]
  44. Sachs, C.; Hildebrand, M.; Volkening, S.; Wintterlin, J.; Ertl, G. Spatiotemporal self-organization in a surface reaction: From the atomic to the mesoscopic scale. Science 2001, 293, 1635–1638. [Google Scholar] [CrossRef] [PubMed] [Green Version]
  45. Ogle, K.M.; White, J.M. The low temperature water formation reaction on Pt(111): A static SIMS and TDS study. Surf. Sci. 1984, 139, 43–62. [Google Scholar] [CrossRef]
  46. Gland, J.L.; Fisher, G.B.; Kollin, E.B. The hydrogen-oxygen reaction over the Pt(111) surface: Transient titration of adsorbed oxygen with hydrogen. J. Catal. 1982, 77, 263–278. [Google Scholar] [CrossRef]
  47. Nakamura, H.; Takase, S.; Shimizu, Y. A Cobalt-Nickel Metal-Alloy Thin-Film Sensor for Hydrogen-Phosphate Ion. Anal. Sci. 2021, 37, 337–340. [Google Scholar] [CrossRef] [PubMed]
Figure 1. A schematic diagram for fabrication of sensor device and gas-sensing measurement setup.
Chemosensors 10 00512 g001
Figure 2. SEM image of Pt0.5Co0.5 alloy ultrathin film (a), EDX spectrum of Pt (b), and Pt0.75Co0.25 (c) alloy ultrathin films.
Chemosensors 10 00512 g002
Figure 3. XRD spectrum of pristine Pt and Pt0.5Co0.5 alloy thin films (a); the full XPS survey of Pt0.75Co0.25 thin film sample (b), Pt 4f region (c), and of Co 2p region (d) XPS spectra of Pt0.75Co0.25 alloy thin film.
Chemosensors 10 00512 g003
Figure 4. The resistance over time for (a) pure Pt, (b) Pt0.75Co0.25, (c) Pt0.5Co0.5, and (d) Pt0.25Co0.75 thin film samples, upon injection of H2 and air at room temperature.
Chemosensors 10 00512 g004
Figure 5. (a) Resistance and sensor response of the films exposed to 1% hydrogen as a function of Co content at room temperature, (b) sensor response versus time for Pt0.75Co0.25 alloy thin film at 25 °C, 100 °C, and 150 °C exposed to 1% hydrogen, (c) sensor response as a function of logarithmic concentration for pristine Pt, Pt0.75Co0.25, and Pt0.75Co0.25 alloy thin films at 100 °C and (d) stability cycles of pristine Pt at 50 °C.
Chemosensors 10 00512 g005
Figure 6. Hydrogen diffusion energy barrier for pristine Pt thin film (a) and a schematic illustration for hydrogen penetration into Pt, Pt0.5Co0.5, and Co (b).
Chemosensors 10 00512 g006
Publisher’s Note: MDPI stays neutral with regard to jurisdictional claims in published maps and institutional affiliations.

