Single Nucleotide Polymorphism rs17173608 in the Chemerin Encoding Gene: Is It a Predictor of Insulin Resistance and Severity of Coronary Artery Disease in Non-Obese Type 2 Diabetes?
Abstract
1. Introduction
2. Methods and Materials
2.1. Participants
2.2. Sample Size Calculation
2.3. Demographic and Clinical Information
2.4. Anthropometric Measurement
2.5. Biochemical Parameters
2.6. Selection of SNP
2.7. Genetic Analysis
2.8. Statistical Analysis
2.9. Operational Definitions
- Insulin resistance: HOMA-IR value of more than 7.17 from the ROC curve is categorised as insulin resistance (IR) whilst less than 7.17 is categorised as insulin-sensitive (IS).
- The severity of CAD: one, two, or three arteries narrowed by 50% of stenosis. One vessel = single-vessel disease (SVD), two vessels = double-vessel disease (DVD), three vessels = triple-vessel disease (TVD). TVD is the most severe type of vessel disease (3 major vessels involved) [5].
- Obesity: BMI more than or equal to 30 kg/m2 [15].
- Preliminary analysis: one-way ANOVA, Chi-square, Fisher exact test, Kruskal–Wallis test, one-sample T-test, binary logistic regression (univariate tests), multinomial logistic regression (univariate tests).
- Secondary analysis: binary logistic regression (multivariate tests), multinomial logistic regression (multivariate tests).
- Univariate tests: p values were obtained by running binary/multinomial analysis for each variable separately.
- Multivariate tests: involved a set of multiple variables that were significant from the univariate tests. p values were obtained for each of the variables involved by running the binary/multinomial analysis as a group.
3. Results
3.1. Demographic and Clinical Data
3.2. Hardy–Weinberg Equilibrium Test for SNP rs17173608
3.3. Associations of Clinical Factors with rs17173608
3.4. Associations of rs17173608 with Insulin Resistance and Severity of CAD
3.5. Association Models of Insulin Resistance and Severity of CAD in Correlation with rs17173608 and Clinical Factors (Secondary Analysis)
4. Discussion
Strength and Limitations
5. Conclusions
Author Contributions
Funding
Institutional Review Board Statement
Informed Consent Statement
Data Availability Statement
Acknowledgments
Conflicts of Interest
Appendix A
Chemerin and RARRES2
|
Insulin resistance and severity of CAD
|
Demographic and clinical factors
|
rs17173608
|
Conclusion
|
References
- Landgraf, K.; Friebe, D.; Ullrich, T.; Kratzsch, J.; Dittrich, K.; Herberth, G.; Adams, V.; Kiess, W.; Erbs, S.; Körner, A. Chemerin as a Mediator between Obesity and Vascular Inflammation in Children. J. Clin. Endocrinol. Metab. 2012, 97, E556–E564. [Google Scholar] [CrossRef] [PubMed]
- Helfer, G.; Wu, Q.F. Chemerin: A multifaceted adipokine involved in metabolic disorders. J. Endocrinol. 2018, 238, R79–R94. [Google Scholar] [CrossRef] [PubMed]
- Dimitriadis, G.K.; Kaur, J.; Adya, R.; Kaltsas, G.; Tan, B.K.; Randeva, H.S. Chemerin induces endothelial cell inflammation: Activation of nuclear factor-kappa beta and monocyte-endothelial adhesion. Oncotarget 2018, 9, 16678–16690. [Google Scholar] [CrossRef]
- Dahpy, M.; Khairallah, M.; Azoz, N.; Ezzat, G. The associations among RARRES2 rs17173608 gene polymorphism, serum chemerin, and non-traditional lipid profile in patients with metabolic syndrome. Egypt. J. Med. Hum. Genet. 2020, 21, 1. [Google Scholar] [CrossRef]
- Buechler, C.; Feder, S.; Haberl, E.M.; Aslanidis, C. Chemerin Isoforms and Activity in Obesity. Int. J. Mol. Sci. 2019, 20, 1128. [Google Scholar] [CrossRef]
- Er, L.K.; Wu, S.; Hsu, L.A.; Teng, M.S.; Sun, Y.C.; Ko, Y.L. Pleiotropic Associations of RARRES2 Gene Variants and Circulating Chemerin Levels: Potential Roles of Chemerin Involved in the Metabolic and Inflammation-Related Diseases. Mediat. Inflamm. 2018, 2018, 4670521. [Google Scholar] [CrossRef]
- Martín-Timón, I.; Sevillano-Collantes, C.; Segura-Galindo, A.; Del Cañizo-Gómez, F.J. Type 2 diabetes and cardiovascular disease: Have all risk factors the same strength? World J. Diabetes 2014, 5, 444–470. [Google Scholar] [CrossRef]
- Einarson, T.R.; Acs, A.; Ludwig, C.; Panton, U.H. Prevalence of cardiovascular disease in type 2 diabetes: A systematic literature review of scientific evidence from across the world in 2007–2017. Cardiovasc. Diabetol. 2018, 17, 83. [Google Scholar] [CrossRef]
- Hussein, Z.; Taher, S.W.; Gilcharan Singh, H.K.; Chee Siew Swee, W. Diabetes Care in Malaysia: Problems, New Models, and Solutions. Ann. Glob. Health 2015, 81, 851–862. [Google Scholar] [CrossRef]
- Chang, C.T.; Lee, P.Y.; Cheah, W.L. The prevalence of cardiovascular risk factors in the young and middle-aged rural population in Sarawak, Malaysia. Malays. J. Med. Sci. 2012, 19, 27–34. [Google Scholar]
- Knight, J.C. Regulatory polymorphisms underlying complex disease traits. J. Mol. Med. 2005, 83, 97–109. [Google Scholar] [CrossRef] [PubMed]
- Er, L.K.; Hsu, L.A.; Juang, J.J.; Wu, S.; Lin, J.F.; Ko, Y.L. Circulating Chemerin Levels, but not the RARRES2 Polymorphisms, Predict the Long-Term Outcome of Angiographically Confirmed Coronary Artery Disease. Int. J. Mol. Sci. 2019, 20, 1174. [Google Scholar] [CrossRef] [PubMed]
- Zheng, Q.; Jiang, J.; Huo, Y.; Chen, D. Genetic predisposition to type 2 diabetes is associated with severity of coronary artery disease in patients with acute coronary syndromes. Cardiovasc. Diabetol. 2019, 18, 1. [Google Scholar] [CrossRef] [PubMed]
- Hashemi, M.; Rezaei, H.; Eskandari-Nasab, E.; Kaykhaei, M.; Zakeri, Z.; Taheri, M. Association between chemerin rs17173608 and vaspin rs2236242 gene polymorphisms and the metabolic syndrome, a preliminary report. Gene 2012, 510, 113–117. [Google Scholar] [CrossRef]
- Yamauchi, E.; Suzuki, Y.; So, K.H.; Suzuki, K.; Katoh, K.; Roh, S.G. Single Nucleotide Polymorphism in the Coding Region of Bovine Chemerin Gene and Their Associations with Carcass Traits in Japanese Black Cattle. Asian-Australas. J. Anim. Sci. 2015, 28, 1084–1089. [Google Scholar] [CrossRef] [PubMed]
- Mehanna, E.; Mesbah, N.; Ghattas, M.; Saleh, S.; Abo-Elmatty, D. Association of chemerin Rs17173608 and vaspin Rs2236242 gene polymorphisms with metabolic syndrome in Egyptian women. Endocr. Res. 2015, 41, 43–48. [Google Scholar] [CrossRef] [PubMed]
- National Cardiovascular Disease Database. Acrm.org.my. 2021. Available online: http://www.acrm.org.my/ncvd/ (accessed on 1 March 2021).
- Dorian, J.; Coates, A.M.; Banks, S. The Impact of Altered Timing of Eating, Sleep and Work Patterns on Human Health; MDPI: Basel, Switzerland, 2018. [Google Scholar]
- Ysi.com. 2021. Available online: https://www.ysi.com/File%20Library/Documents/Guides/YSI-Biochemistry-Analyzer365Replacement-Guide_v1.pdf. (accessed on 8 March 2021).
- ADVIA Centaur CP Immunoassay System Siemens-healthineers.com. 2021. Available online: https://www.siemens-healthineers.com/en368my/immunoassay/systems/advia-centaur-cp-immunoassay-sys (accessed on 8 March 2021).
- Beckmancoulter.com. 2021. Available online: https://beckmancoulter.com/wsrportal/techdocs?docname=/cis/A38059/AC/EN_CCRP.pdf (accessed on 8 March 2020).
- Fliser, E.; Jerkovic, K.; Vidovic, T.; Gorenjak, M. Investigation of unusual high serum indices for lipemia in clear serum samples on Siemens analysers Dimension. Biochem. Med. 2012, 352–364. [Google Scholar] [CrossRef] [PubMed]
- Qu, H.Q.; Li, Q.; Rentfro, A.R.; Fisher-Hoch, S.P.; McCormick, J.B. The definition of insulin resistance using HOMA-IR for Americans of Mexican descent using machine learning. PLoS ONE 2011, 6, e21041. [Google Scholar] [CrossRef]
- Human Chemerin Quantikine ELISA www.rndsystems.com. 2021. Available online: https://www.rndsystems.com/products/human-chemerin380quantikine-elisa_dchm00#assay-procedure (accessed on 8 March 2021).
- Kwon, J.M.; Goate, A.M. The candidate gene approach. Alcohol. Res. Health. 2000, 24, 164–168. [Google Scholar]
- Movahed, Z.; Kohan, L.; Fallahi, S.; Tabiee, O. Influence of chemerin rs17173608 polymorphism on polycystic ovary syndrome susceptibility. Taiwan. J. Obstet Gynecol. 2015, 54, 280–283. [Google Scholar] [CrossRef]
- Genepop on the Web.Genepop.curtin.edu.au. 2021. Available online: https://genepop.curtin.edu.au/ (accessed on 28 January 2021).
- Hoo, Z.H.; Candlish, J.; Teare, D. What is an ROC curve? Emerg. Med. J. 2016, 34, 357–359. [Google Scholar] [CrossRef] [PubMed]
- Arambewela, M.H.; Somasundaram, N.P.; Jayasekara, H.B.P.R.; Fernando, K.R.A.S.; Kusumsiri, D.P. Prevalence of Chronic Complications, Their Risk Factors, and the Cardiovascular Risk Factors among Patients with Type 2 Diabetes Attending the Diabetic Clinic at a Tertiary Care Hospital in Sri Lanka. J. Diab. Res. 2018, 2018, 4504287. [Google Scholar] [CrossRef] [PubMed]
- Krishnan, M.N.; Zachariah, G.; Venugopal, K.; Jeyaseelan, L.; Thankappan, K.R. Prevalence of coronary artery disease and its risk factors in Kerala, South India: A community-based cross-sectional study. BMC Cardiovasc. Disord. 2016, 16, 12. [Google Scholar] [CrossRef] [PubMed]
- Duan, J.G.; Chen, X.Y.; Wang, L.; Lau, A.; Wong, A.; Thomas, G.N.; Tomlinson, B.; Liu, R.; Chan, J.C.; Leung, T.W.; et al. Sex differences in epidemiology and risk factors of acute coronary syndrome in Chinese patients with type 2 diabetes: A long-term prospective cohort study. PLoS ONE 2015, 10, e0122031. [Google Scholar] [CrossRef]
- Barrett-Connor, E. Menopause, atherosclerosis, and coronary artery disease. Curr. Opin. Pharmacol. 2013, 13, 186–191. [Google Scholar] [CrossRef]
- National Health and Morbidity Survey 2015-VOLUME, II. Available online: https://www.researchgate.net/publication/305213149_National_Health_and_Morbidity_Survey_2015-VOLUME_II_Non419Communicable_Diseases_Risk_Factors_Other_Health_Problems. (accessed on 28 March 2020).
- Tee, E.S.; Yap, R.W.K. Type 2 diabetes mellitus in Malaysia: Current trends and risk factors. Eur. J. Clin. Nutr. 2017, 71, 844–849. [Google Scholar] [CrossRef]
- Goldfine, A.B.; Phua, E.J.; Abrahamson, M.J. Glycemic management in patients with coronary artery disease and prediabetes or type 2 diabetes mellitus. Circulation 2014, 129, 2567–2573. [Google Scholar] [CrossRef]
- Dai, W.; Zhang, Z.; Zhao, S. Baseline levels of serum high sensitivity C reactive protein and lipids in predicting the residual risk of cardiovascular events in Chinese population with stable coronary artery disease: A prospective cohort study. Lipids Health Dis. 2018, 17, 273. [Google Scholar] [CrossRef]
- Müssig, K.; Staiger, H.; Machicao, F.; Claussen, C.D.; Stefan, N.; Fritsche, A.; Häring, H.U. RARRES2, encoding the novel adipokine chemerin, is a genetic determinant of disproportionate regional body fat distribution: A comparative magnetic resonance imaging study. Metabolism 2009, 58, 519–524. [Google Scholar] [CrossRef]
- Karastergiou, K.; Smith, S.R.; Greenberg, A.S.; Fried, S.K. Sex differences in human adipose tissues-the biology of pear shape. Biol. Sex Differ. 2012, 3, 13. [Google Scholar] [CrossRef]
- Sola, D.; Rossi, L.; Schianca, G.P.; Corlianò, F.; Fra, G.P.; Bartoli, E.; Derosa, G. Sulfonylureas and their use in clinical practice. Arch. Med. Sci. 2015, 11, 840–848. [Google Scholar] [CrossRef] [PubMed]
- Lachine, N.A.; Elnekiedy, A.A.; Megallaa, M.H.; Khalil, G.I.; Sadaka, M.A.; Rohoma, K.H.; Kassab, H.S. Serum chemerin and high-sensitivity C reactive protein as markers of subclinical atherosclerosis in Egyptian patients with type 2 diabetes. Ther. Adv. Endocrinol. Metab. 2016, 7, 47–56. [Google Scholar] [CrossRef] [PubMed]


| Outcome | : | Disease |
| Design | : | Case-control |
| Hypothesis | : | Gene only |
| Power | : | 0.800 |
| Significance | : | 0.050000, two-sided |
| Gene | : | Mode of inheritance—log-additive |
| Pathogenic allele frequency | : | 0.60 |
| Factors | T2D + CAD n = 150 | T2D n = 90 | CAD n = 60 | p-Value |
|---|---|---|---|---|
| Gender | ||||
| Male | a 110 (73.3%) | a 40 (44.4%) | a 44 (73.3%) | <0.001 * |
| Female | a 40 (26.7%) | a 50 (55.6%) | a 16 (26.7%) | |
| Age (years old) | b 62.90 ± 8.63 | b 58.12 ± 8.48 | b 66.27 ± 10.28 | <0.001 ¥ |
| Ethnicity | ||||
| Malay | a 57 (38.0%) | a 35 (38.9%) | a 17 (28.3%) | 0.001 * |
| Chinese | a 25 (16.7%) | a 15 (16.7%) | a 25 (41.7%) | |
| Indian | a 68 (45.3%) | a 40 (44.4%) | a 18 (30.0%) | |
| BMI (kg/m2) | b 25.23 ± 4.19 | b 25.38 ± 4.12 | b 24.95 ± 3.78 | 0.342 ¥ |
| Family history of T2D | a 99 (66.0%) | a 73 (81.1%) | a 40 (66.7%) | 0.049 * |
| Family history of CAD | a 85 (56.7%) | a 44 (48.9%) | a 39 (65.0%) | 0.197 * |
| FPG (mmol/L) | c 7.65 ± (6.00–9.93) | c 8.15 ± (6.00–10.13) | c 4.80 ± (4.33–5.38) | <0.001 ₺ |
| FPI (pmol/L) | c 27.40 ± (12.60–51.13) | c 19.15 ± (10.58–33.33) | c 30.90 ± (25.70–37.40) | <0.001 ₺ |
| HOMA-IR | c 9.80 ± (4.87–19.35) | c 6.92 ± (4.35–11.56) | c 6.73 ± (5.41–7.48) | 0.002 ₺ |
| A1C (%) | c 7.50 ± (6.68–8.63) | c 7.70 ± (6.40–9.50) | c 4.70 ± (4.23–5.20) | <0.001 ₺ |
| HsCRP (mg/L) | c 0.50 ± (0.15–1.01) | c 0.68 ± (0.25–1.07) | c 0.93 ± (0.70–1.06) | <0.001 ₺ |
| Lipid profile | ||||
| Total cholesterol (mmol/L) | c 4.10 ± (3.40–5.00) | c 4.31 ± (3.48–5.00) | c 4.35 ± (3.73–4.88) | 0.837 ₺ |
| LDL-c (mmol/L) | c 1.80 ± (1.40–2.51) | c 2.52 ± (1.81–2.84) | c 2.45 ± (1.77–2.92) | <0.001 ₺ |
| HDL-c (mmol/L) | c 1.30 ± (1.02–1.76) | c 1.04 ± (0.88–1.36) | c 1.08 ± (0.88–1.26) | <0.001 ₺ |
| Triglycerides (mmol/L) | c 1.50 ± (1.09–2.17) | c 1.65 ± (1.30–2.30) | c 1.75 ± (1.30–2.40) | 0.047 ₺ |
| Hypertension | a 142 (94.7%) | a 85 (94.4%) | a 57 (95.0%) | 1.000 Ᵹ |
| Dyslipidaemia | a 135 (90.0%) | a 81 (90.0%) | a 51 (85.0%) | 0.572 Ᵹ |
| Peripheral neuropathy | a 59 (39.3%) | a 40 (44.4%) | a 0 (0.0%) | <0.001 Ᵹ |
| Chronic kidney disease (CKD) | a 26 (17.3%) | a 18 (20.0%) | a 2 (3.3%) | 0.012 Ᵹ |
| Retinopathy | a 39 (26.0%) | a 28 (31.1%) | a 0 (0%) | <0.001 Ᵹ |
| Anaemia | a 2 (1.3%) | a 0 (0.0%) | a 2 (3.3%) | 0.190 Ᵹ |
| Gastritis | a 0 (0.0%) | a 4 (4.4%) | 3 (5.0%) | 0.011 Ᵹ |
| Biguanides | a 47 (31.3%) | a 70 (77.8%) | - | <0.001 * |
| Sulphonylureas | a 35 (23.3%) | a 62 (68.9%) | - | <0.001 * |
| DPP4i | a 1 (0.7%) | a 26 (28.9%) | - | <0.001 Ᵹ |
| AGI | a 0 (0.0%) | a 14 (15.6) | - | <0.001 Ᵹ |
| Meglitinides | a 0 (0.0%) | a 14 (15.6%) | - | <0.001 Ᵹ |
| Biguanide + SU | a 26 (17.3%) | a 63 (70.0%) | - | <0.001 * |
| SU + DPP4i | a 1 (0.7%) | a 5 (5.6%) | - | 0.035 Ᵹ |
| Biguanide + Insulin | a 49 (32.7%) | - | - | <0.001 ꟹ |
| Biguanide + SU + Insulin | a 8 (5.3%) | - | - | <0.001 ꟹ |
| Biguanide + DPP4i + Insulin | a 5 (3.3%) | - | - | <0.001 ꟹ |
| Biguanide + SGLT2 + Insulin | a 28 (18.7%) | - | - | <0.001 ꟹ |
| SGLT2 + Insulin | a 5 (3.3%) | - | - | <0.001 ꟹ |
| Antiplatelet Agents | a 144 (96.0%) | a 0 (0.0%) | a 59 (98.3%) | <0.001 Ᵹ |
| ACEI | a 83 (55.3%) | a 22 (24.4%) | a 12 (20.0%) | 0.004 * |
| ARB II | a 34 (22.7%) | a 61 (67.8%) | a 45 (75.0%) | 0.087 * |
| Calcium channel blockers | a 38 (25.3%) | a 47 (52.2%) | a 46 (76.7%) | 0.220 * |
| Beta blockers | a 82 (54.7%) | a 47 (52.2%) | a 10 (16.7%) | 0.355 * |
| Alpha blockers | a 3 (2.0%) | a 0 (0.0%) | a 0 (0.0%) | 0.001 Ᵹ |
| Nitrates | a 52 (34.7%) | a 0 (0.0%) | a 53 (88.3%) | 0.086 Ᵹ |
| Statins | a 149 (99.3%) | a 88 (97.8%) | a 60 (100.0%) | 0.649 Ᵹ |
| Diuretics | a 51 (34.0%) | a 28 (31.1%) | a 53 (88.3%) | 0.158 * |
| Haematinic agents | a 4 (2.7%) | a 3 (3.3%) | a 7 (11.7%) | 0.028 Ᵹ |
| Cardiac glycosides | a 13 (8.7%) | a 0 (0.0%) | a 0 (0.0%) | 0.001 Ᵹ |
| Clinical Factors | OR (95% CI) | ||
|---|---|---|---|
| T2D + CAD | T2D | CAD | |
| FPG (mmol/L) | a 0.921 (0.783–1.085) b 1.010 (0.906–1.127) | a 0.923 (0.775–1.099) b 0.930 (0.790–1.095) | a3.646 (1.000–13.304) b6.053 (1.601–22.880) |
| FPI (pmol/L) | a 0.996 (0.986–1.007) b 0.993 (0.984–1.002) | a 1.012 (0.980–1.046) b 1.014 (0.983–1.046) | a1.955 (1.854–2.068) b1.882 (1.787–1.990) |
| A1C (%) | a 0.984 (0.763–1.269) b 0.877 (0.708–1.086) | a 0.847 (0.635–1.130) b 0.883 (0.677–1.150) | a3.822 (0.976–14.966) b5.360 (1.352–21.255) |
| hs–CRP (mg/L) | a 0.404 (0.136–1.200) b 1.034 (0.703–1.521) | a 2.005 (0.558–7.210) b 2.708 (0.799–9.181) | a 1.336 (0.203–8.792) b 5.517 (0.799–38.077) |
| Lipid profile TC (mmol/L) | a 1.074 (0.746–1.545) b 0.799 (0.582–1.098) | a 1.091 (0.650–1.829) b 0.893 (0.544–1.467) | a 0.625 (0.304–1.284) b 0.823 (0.424–1.597) |
| LDL-c (mmol/L) | a 1.576 (0.954–2.602) b 1.189 (0.778–1.818) | a 1.291 (0.606–2.752) b 1.045 (0.503–2.170) | a 0.619 (0.245–1.565) b 0.995 (0.419–2.363) |
| HDL-c (mmol/L) | a 1.209 (0.720–2.029) b 0.993 (0.638–1.546) | a 1.591 (0.188–13.434) b 0.400 (0.050–3.192) | a 0.311 (0.017–5.663) b 0.276 (0.016–4.696) |
| Triglycerides (mmol/L) | a 1.293 (0.802–2.085) b 0.798 (0.509–1.251) | a 1.842 (0.795–4.268) b 1.390 (0.612–3.161) | a 0.656 (0.263–1.635) b 1.029 (0.449–2.359) |
| Hypertension | a 1.975 (0.337–11.559) b 0.919 (0.162–5.221) | a 4.735 (0.742–10.343) b 4.850 (0.960–8.066) | a 1.307 (0.700–14.434) b 1.403 (0.817–12.235) |
| Dyslipidaemia | a 0.882 (0.164–4.113) b 0.802 (0.223–2.767) | a 1.071 (0.090–12.807) b 2.368 (0.262–21.370) | a 0.333 (0.039–2.829) b 0.761 (0.120–4.816) |
| Peripheral neuropathy | a 2.871 (0.969–8.511) b 1.531 (0.725–3.233) | a 1.143 (0.339–3.850) b 1.444 (0.458–4.560) | a 0.100 (0.076–0.323) b 0.098 (0.082–0.285) |
| Chronic kidney disease (CKD) | a 0.690 (0.218–2.180) b 1.101 (0.409–2.964) | a 1.154 (0.238–5.605) b 0.785 (0.186–3.311) | a 1.317 (0.412–43.004) b 3.375 (0.189–60.238) |
| Retinopathy | a 0.872 (0.316–2.405) b 1.881 (0.765–4.625) | a 0.399 (0.093–1.714) b 0.495 (0.121–2.019) | a 0.204 (0.098–1.063) b 0.188 (0.094–1.007) |
| Anaemia | a 0.476 (0.046–6.406) b 0.537 (0.033–8.788) | - | a 2.750 (0.153–49.359) b 1.337 (0.877–34.435) |
| Gastritis | - | a 4.472 (0.855–9.031) b 6.708 (0.652–14.454) | - |
| Single-OHA | |||
| Biguanides | a 0.552 (0.194–1.567) b 1.246 (1.112–1.543) | a 0.185 (0.039–0.885) b 0.556 (0.164–1.883) | - |
| Sulphonylureas | a 0.541 (0.180–1.626) b 0.406 (0.174–0.945) | a8.000 (1.542–41.413) b 2.059 (0.399–10.622) | - |
| DPP4i | a 0.986 (0.730–1.269) b 0.014 (0.008–0.040) | a 2.556 (0.696–9.382) b 2.074 (0.631–6.817) | - |
| OHA-Combination | |||
| Biguanide + SU | a 0.466 (0.141–1.541) b 0.423 (0.164–1.093) | a 2.889 (0.676–12.345) b 1.625 (0.393–6.722) | - |
| SU + DPP4i | a 0.955 (0.890–1.112) b 0.020 (0.008–0.057) | a 1.236 (0.102–3.805) b 1.952 (0.295–12.914) | - |
| OHA- Insulin Combination | |||
| Biguanide + Insulin | a 1.487 (0.548–4.034) b 3.209 (1.330–7.741) | - | - |
| Biguanide + SU + Insulin | a 1.636 (0.187–14.350) b 3.429 (0.400–29.409) | - | - |
| Biguanide + DPP4i + Insulin | a 0.122 (0.011–1.413) b 0.262 (0.023–2.974) | - | - |
| Biguanide + SGLT2 + Insulin | a 1.754 (0.466–6.597) b 1.503 (0.575–3.928) | - | - |
| SGLT2 + Insulin | a 0.787 (0.078–7.962) b 1.650 (0.167–16.341) | - | - |
| Concomitant drugs | |||
| Antiplatelet Agents | a 8.200 (0.708–94.997) b 5.857 (0.591–58.043) | - | a 3.060 (2.063–11.533) b 1.020 (0.845–1.480) |
| ACEI | a 1.492 (0.580–3.835) b 0.829 (0.397–1.732) | a 0.778 (0.197–3.076) b 1.296 (0.337–4.990) | a2.375 (1.410–13.748) b2.300 (1.424–12.465) |
| ARB II | a 0.636 (0.226–1.787) b 1.373 (0.547–3.445) | a 2.000 (0.520–7.591) b 1.258 (0.342–4.634) | a 2.375 (0.410–13.748) b 1.250 (0.250–6.255) |
| Calcium channel blockers | a 0.520 (0.190–1.424) b 0.918 (0.392–2.149) | a7.485 (1.741–32.183) b 3.957 (0.988–15.850) | a 0.421 (0.073–2.437) b 0.667 (0.131–3.398) |
| Beta blockers | a 0.746 (0.283–1.970) b 1.492 (0.720–3.093) | a 0.400 (0.115–1.394) b 0.548 (0.170–1.769) | a3.000 (1.353–25.460) b1.848 (1.171–6.416) |
| Alpha blockers | a 1.635 (0.268–4.231) b 1.086 (0.096–12.320) | - | - |
| Nitrates | a 0.735 (0.280–1.928) b 1.018 (0.472–2.197) | - | a 0.333 (0.039–2.829) b 0.420 (0.058–3.029) |
| Fibrates | a 4.505 (0.650–15.369) b 4.508 (0.684–15.026) | - | - |
| Statins | a 0.030 (0.009–0.453) b 0.032 (0.012–0.086) | a 0.058 (0.035–0.097) b 0.039 (0.013–0.831) | - |
| Diuretics | a 0.611 (0.235–1.587) b 1.253 (0.569–2.759) | a 1.971 (0.527–7.374) b 1.160 (0.353–3.808) | a 0.159 (0.012–2.031) b 0.583 (0.088–3.880) |
| Haematinic agents | a 13.109 (0.995–20.246) b 0.531 (0.072–3.901) | a 0.032 (0.018–0.153) b 1.400 (0.118–16.581) | a 3.000 (0.353–25.460) b 2.381 (0.330–17.172) |
| Cardiac glycosides | a 1.636 (0.187–14.350) b 0.506 (0.153–1.674) | - | - |
| OR (95%CI) | |||
|---|---|---|---|
| T2D + CAD | T2D | CAD | |
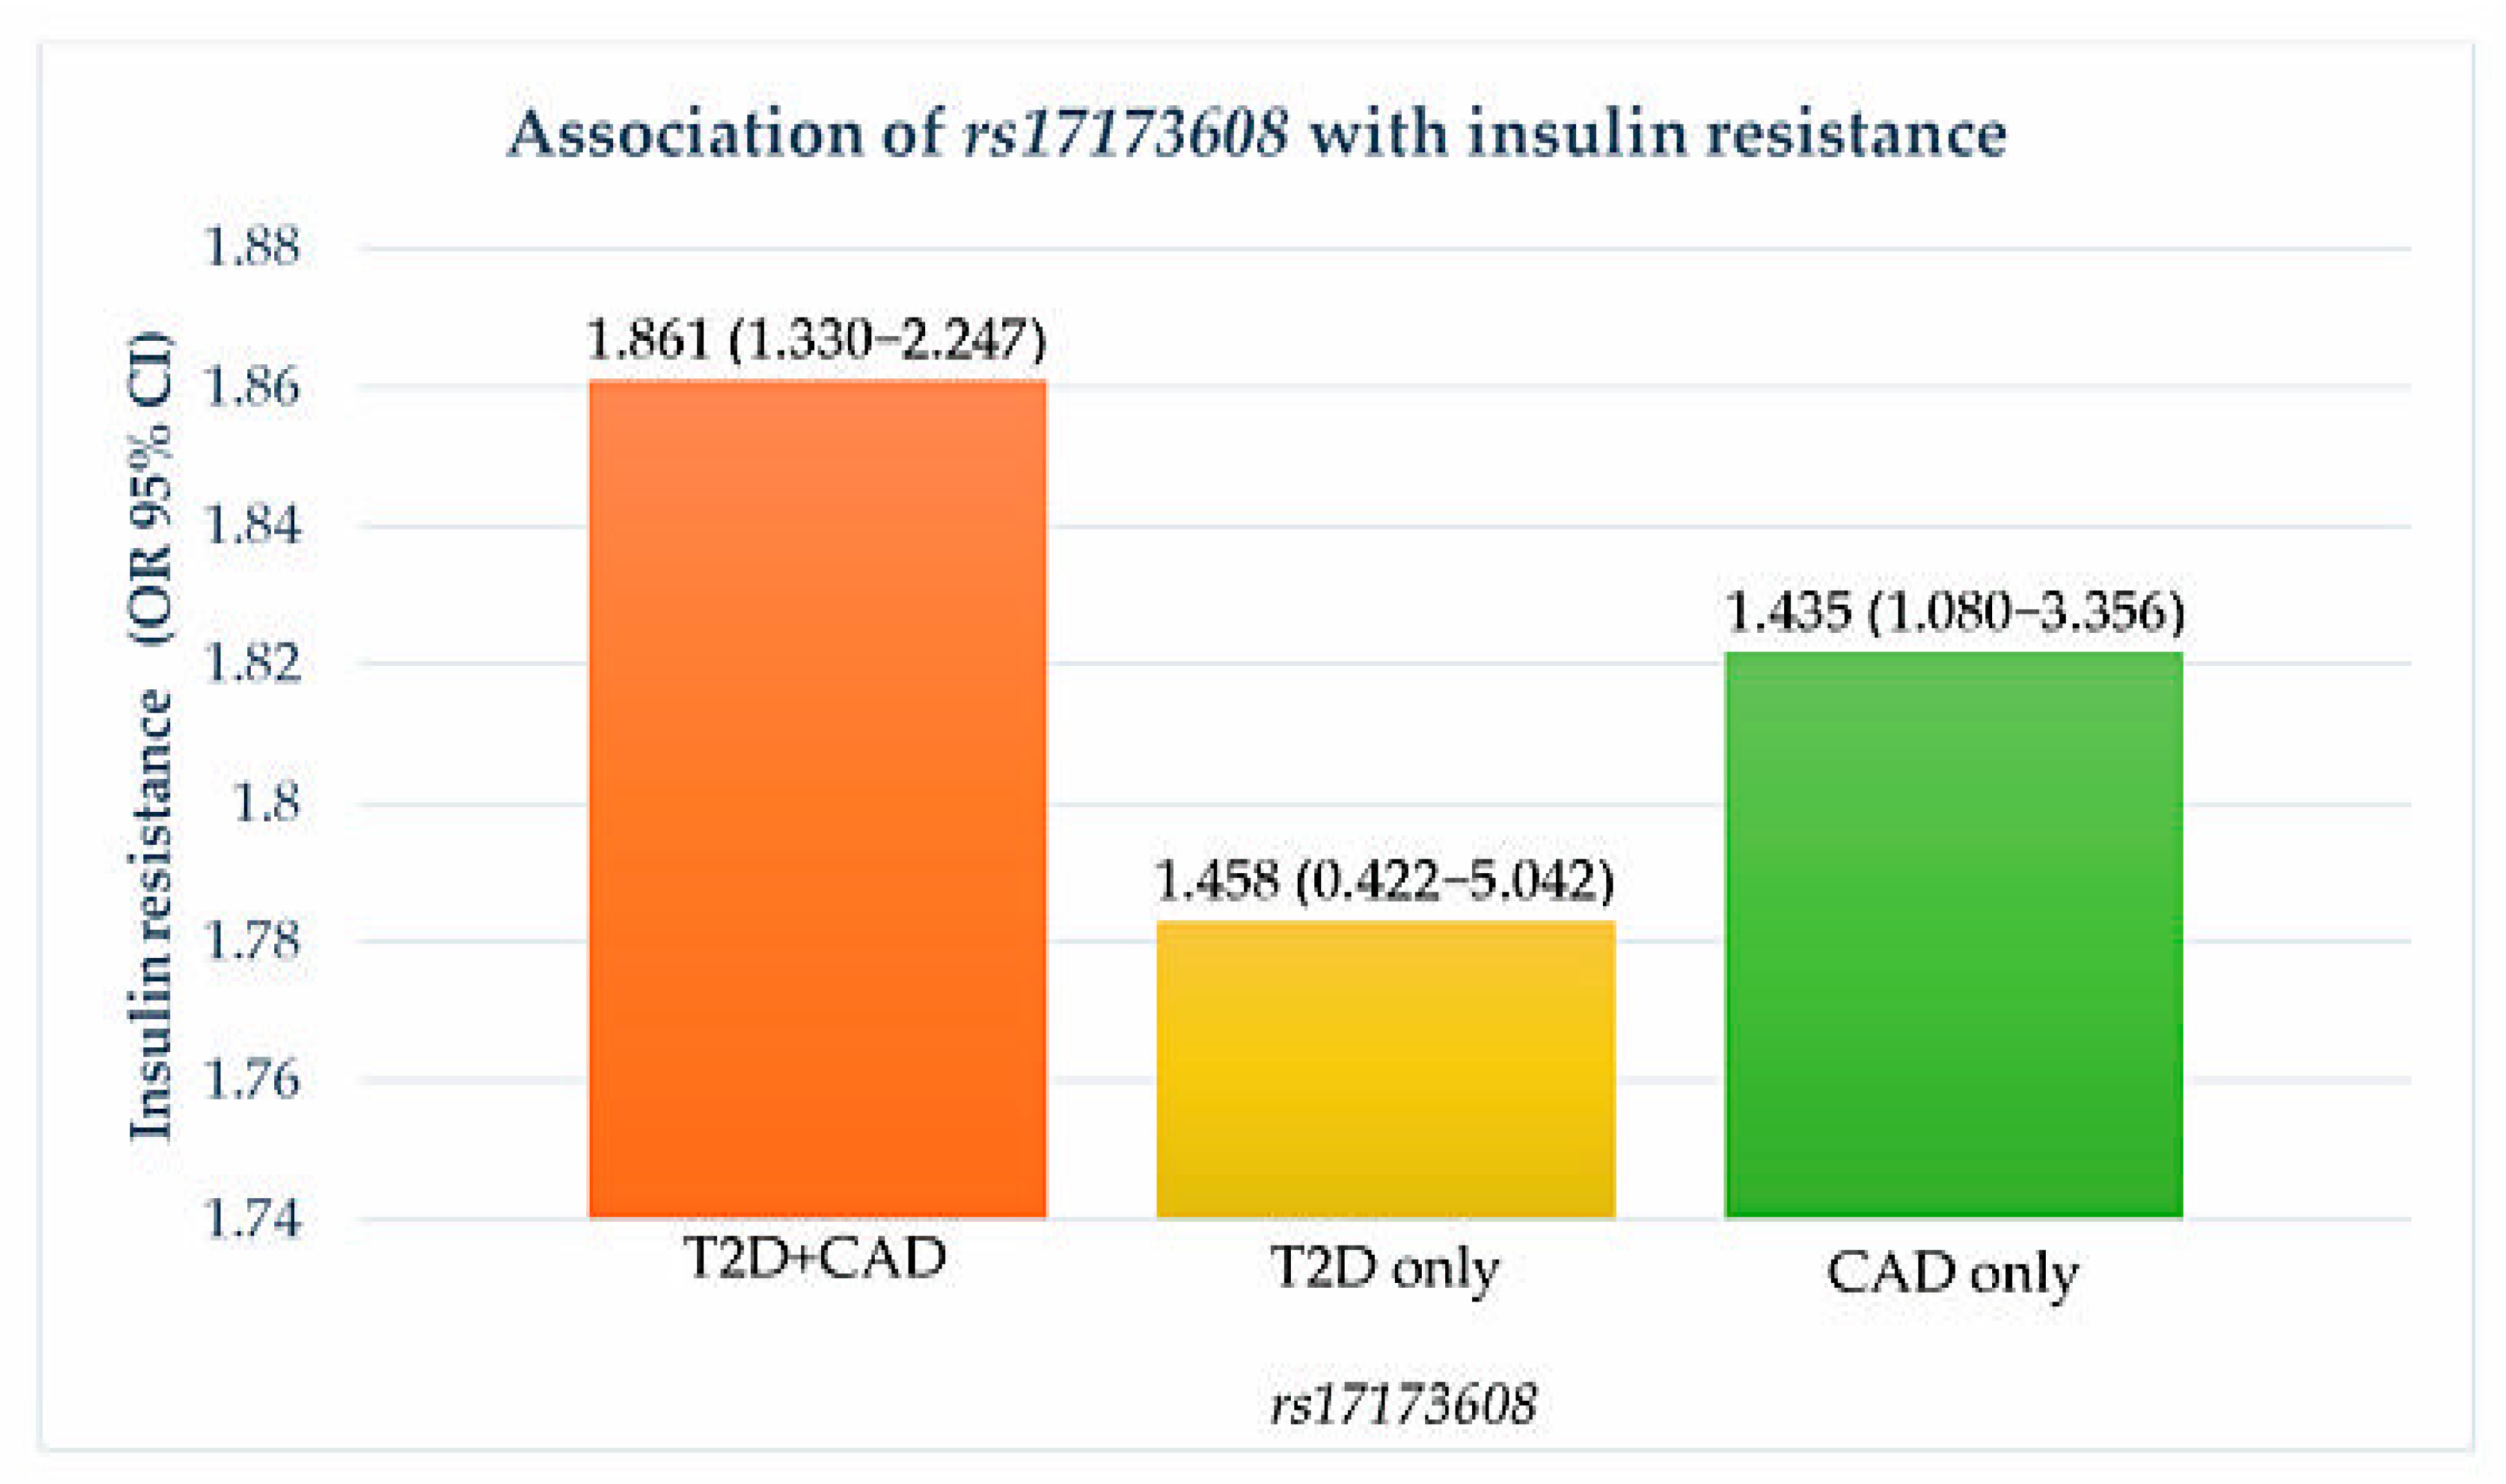
| Insulin resistance | 1.861 (1.330–2.247) * | 1.458 (0.422–5.042) * | 1.435 (1.080–3.356) * |
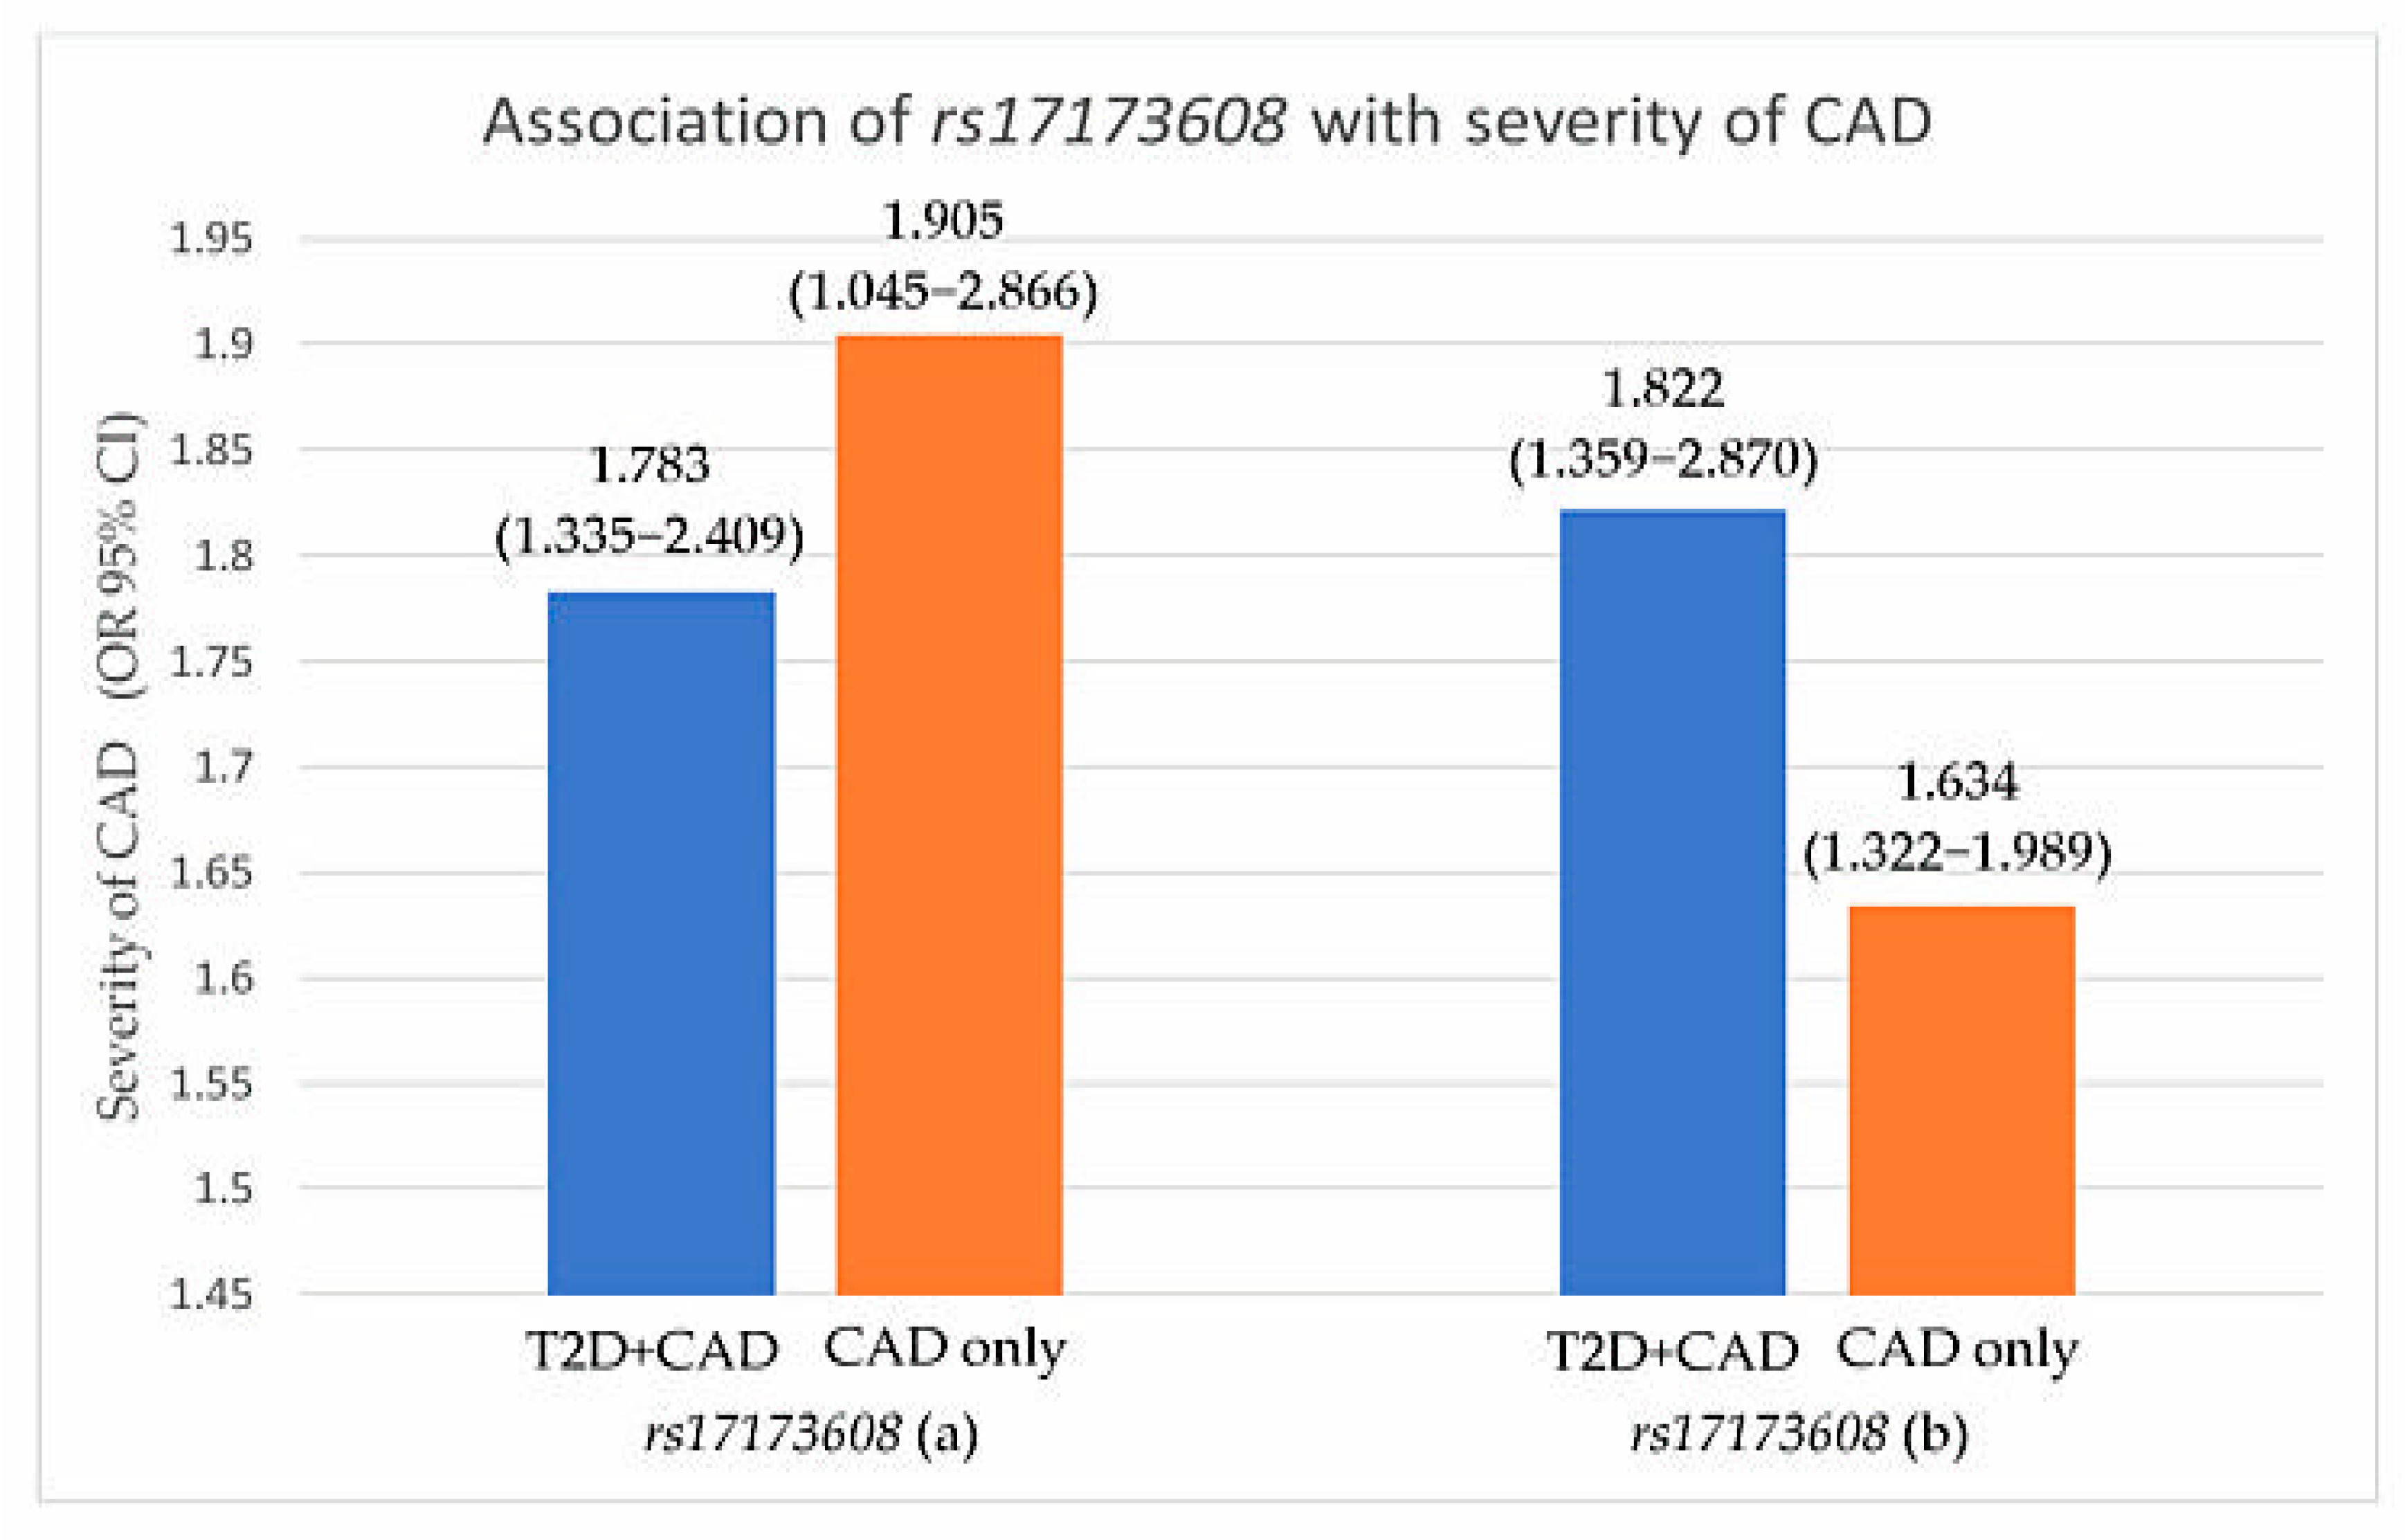
| Severity of CAD | a 1.783 (1.335–2.409) ¥ b 1.822 (1.359–2.870) ¥ | - | a 1.905 (1.045–2.866) ¥ b 1.634 (1.322–1.989) ¥ |
| Parameters | OR (95% Cl) | p-Value |
|---|---|---|
| rs17173608 | ||
| TT | 0.157 | |
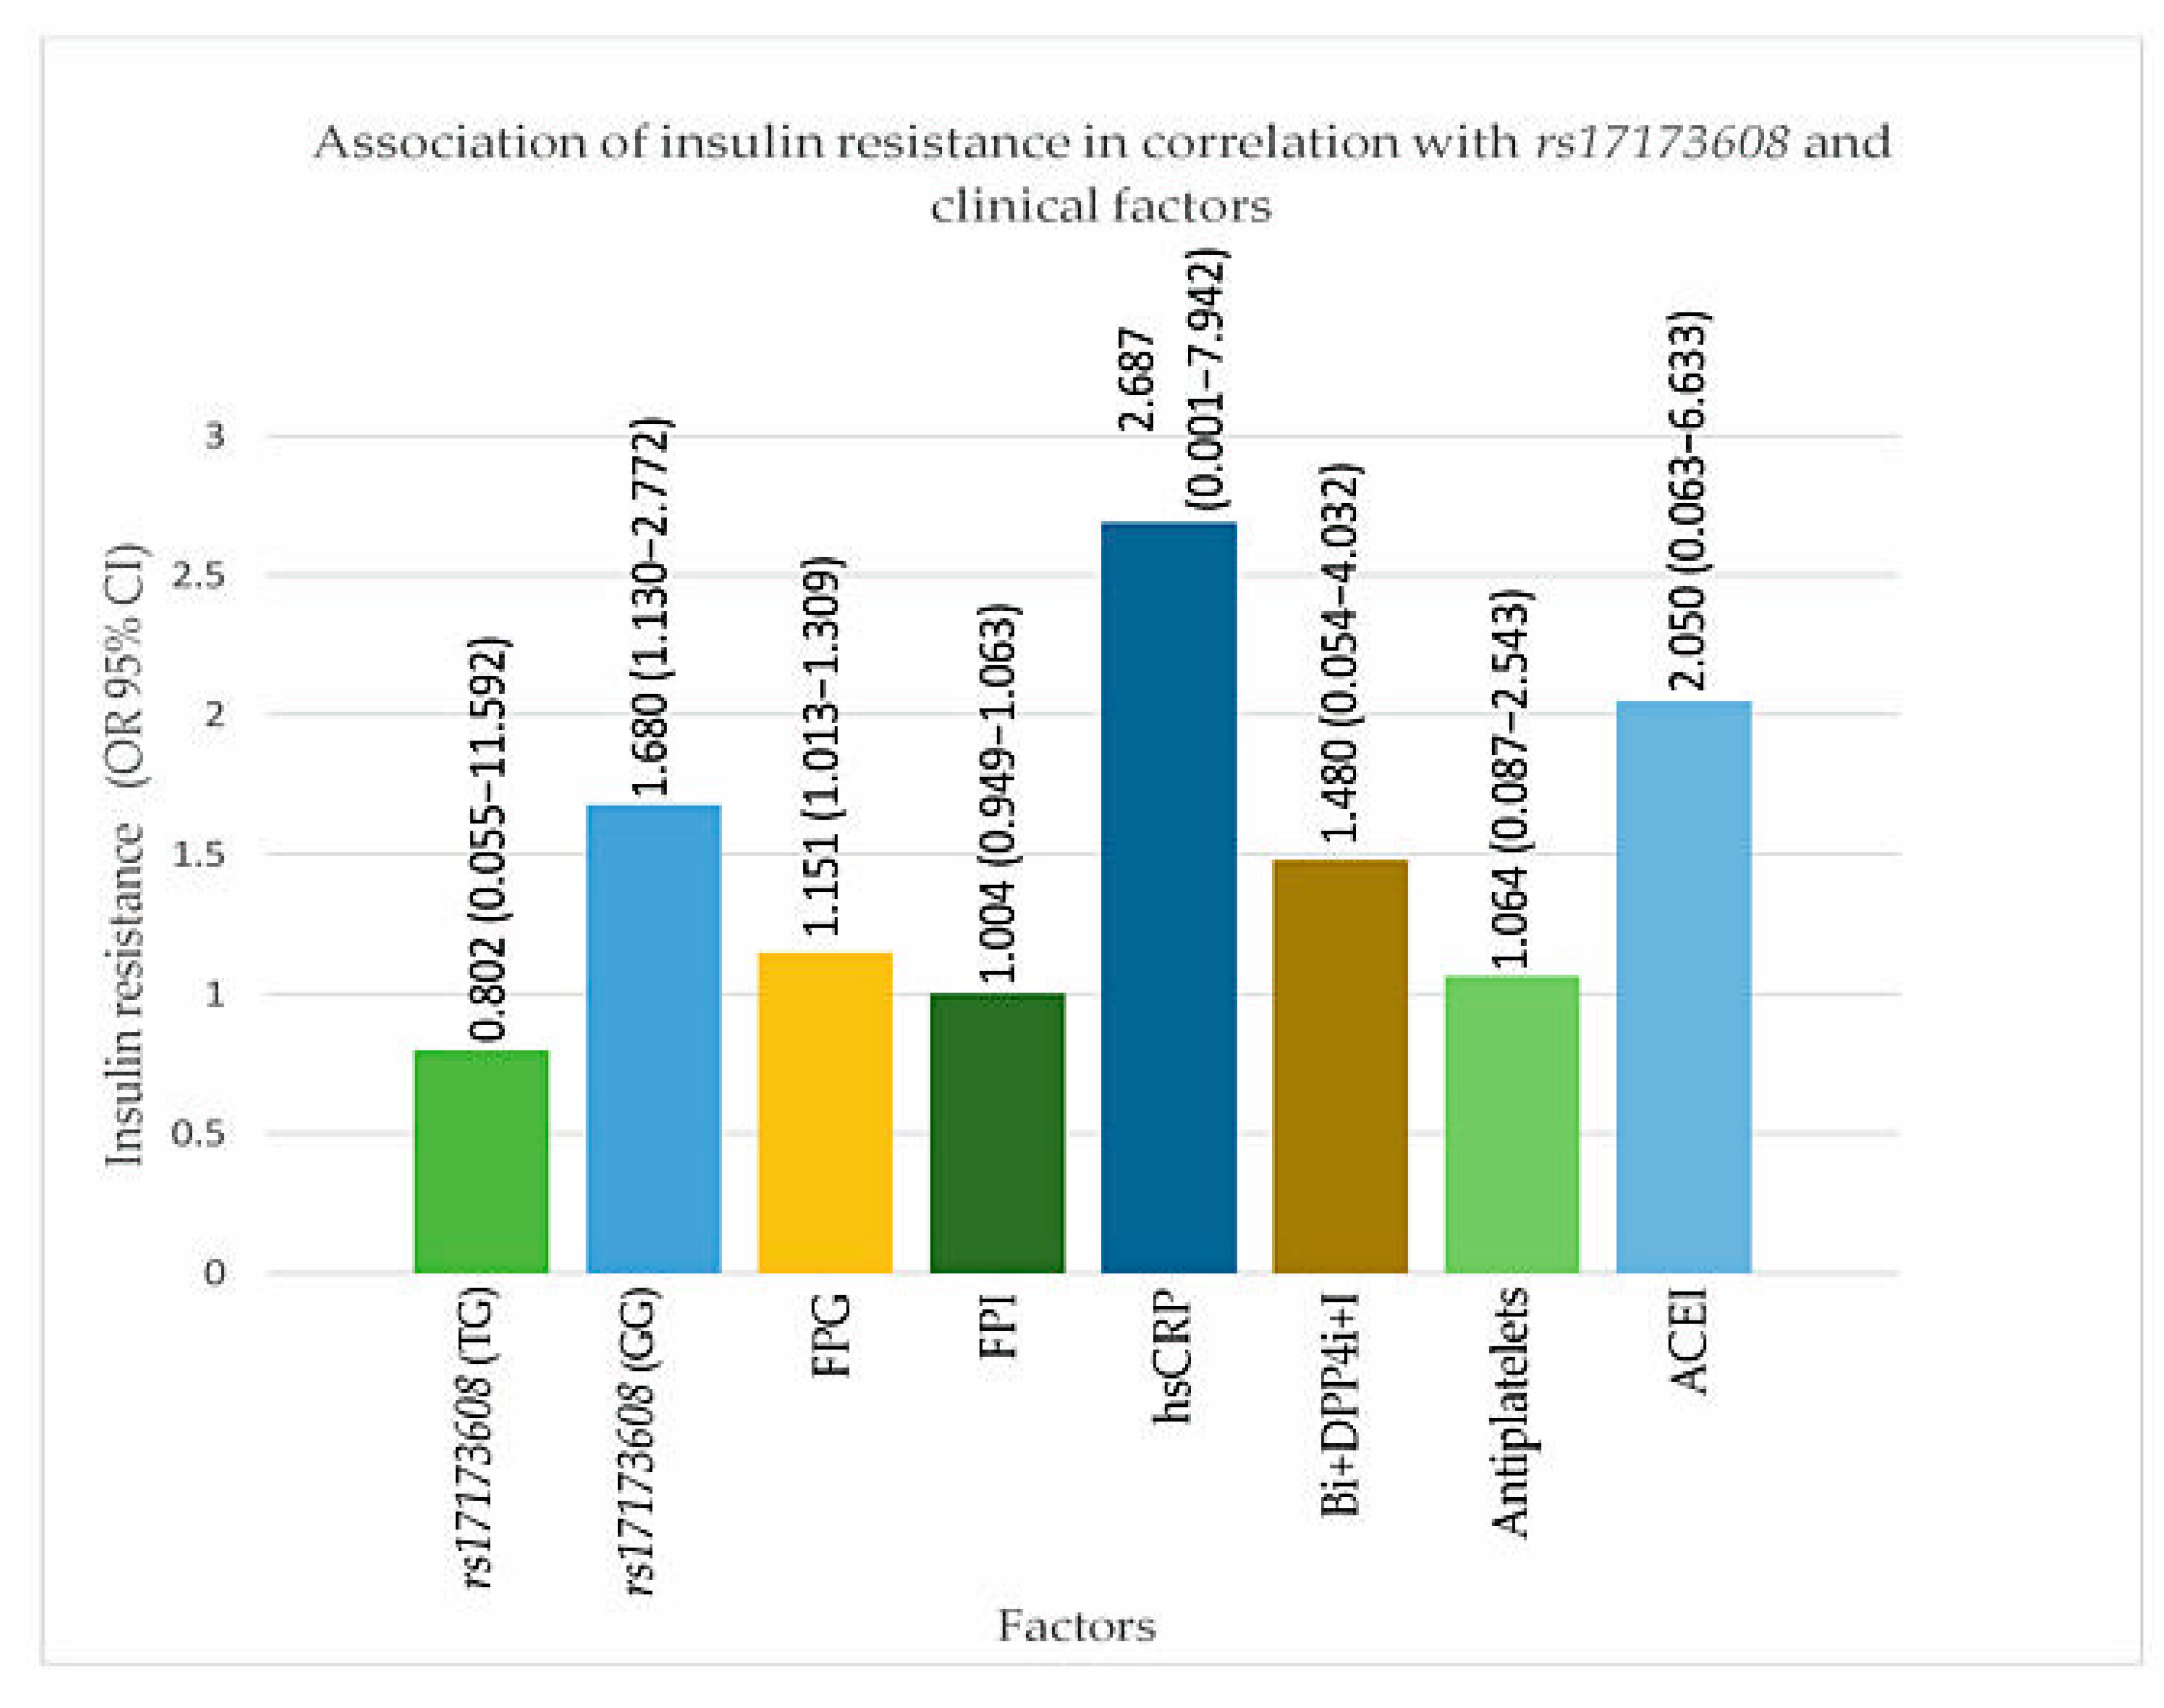
| TG | 0.802 (0.055–11.592) | 0.015 |
| GG | 1.680 (1.130–2.772) | 0.012 |
| FPG (mmol/L) | 1.151 (1.013–1.309) | 0.047 |
| FPI (pmol/L) | 1.004 (0.949–1.063) | 0.676 |
| hs–CRP | 2.687 (0.001–7.942) | 0.808 |
| Biguanide + DPP4i + Insulin | 1.480 (0.054–4.032) | 0.607 |
| Antiplatelet Agents | 1.064 (0.087–2.543) | 0.213 |
| ACEI | 2.050 (0.063–6.633) | 0.024 |
| Parameters | DVD | TVD | ||
|---|---|---|---|---|
| OR (95% CI) | p-Value | OR (95% CI) | p-Value | |
| rs17173608 | ||||
| TT | 0.052 | 0.122 | ||
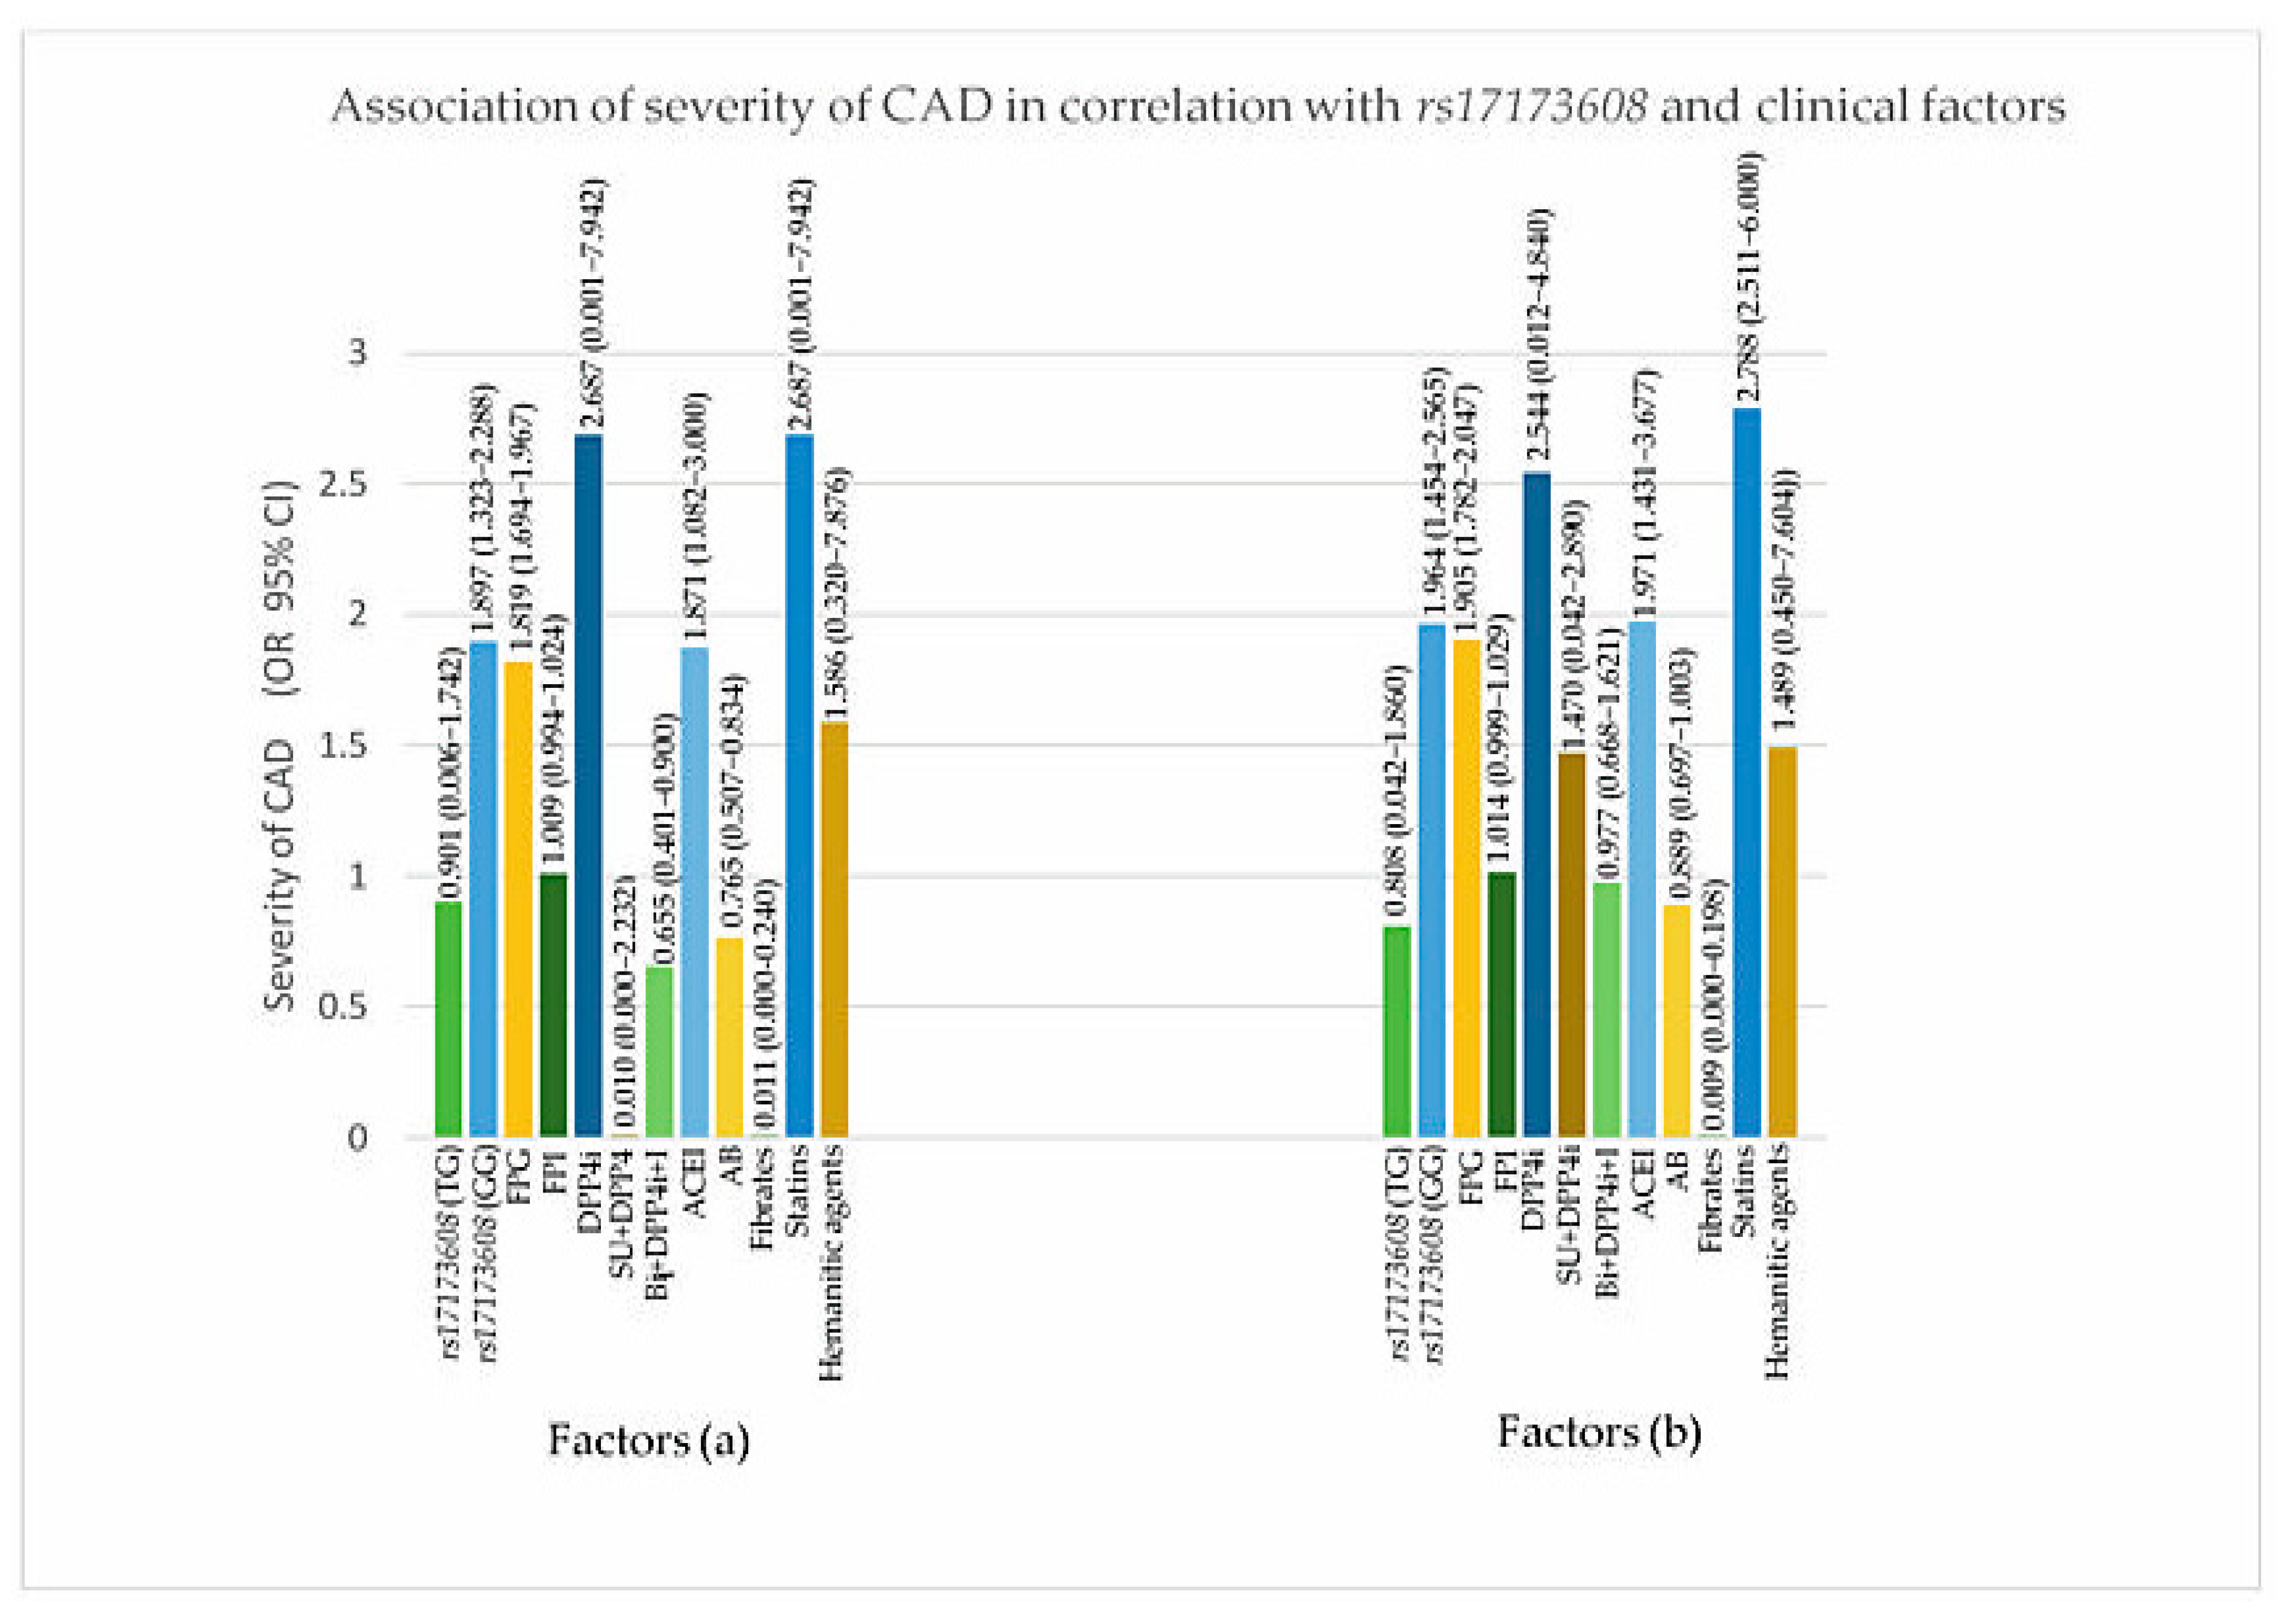
| TG | 0.901 (0.006–1.742) | 0.028 | 0.808 (0.042–1.860) | 0.036 |
| GG | 1.897 (1.323–2.288) | 0.042 | 1.964 (1.454–2.565) | 0.048 |
| FPG (mmol/L) | 1.819 (1.694–1.967) | 0.017 | 1.905 (1.782–2.047) | 0.032 |
| FPI (pmol/L) | 1.009 (0.994–1.024) | 0.255 | 1.014 (0.999–1.029) | 0.074 |
| DPP4i | 2.687 (0.001–7.942) | 0.808 | 2.544 (0.012–4.840) | 0.656 |
| SU + DPP4i | 0.010 (0.000–2.232) | 0.096 | 1.470 (0.042–2.890) | 0.996 |
| Biguanide + DPP4i + Insulin | 0.655 (0.401–0.900) | 0.995 | 0.977 (0.668–1.621) | 0.080 |
| ACEI | 1.871 (1.082–3.000) | 0.017 | 1.971 (1.431–3.677) | 0.025 |
| Alpha-blockers | 0.765 (0.507–0.834) | 0.990 | 0.889 (0.697–1.003) | 0.989 |
| Fibrates | 0.011 (0.000–0.240) | 0.996 | 0.009 (0.000–0.198) | 0.992 |
| Statins | 2.687 (0.001–7.942) | 0.808 | 2.788 (2.511–6.000) | 0.988 |
| Hematinic agents | 1.586 (0.320–7.876) | 0.090 | 1.489 (0.450–7.604) | 0.105 |
Publisher’s Note: MDPI stays neutral with regard to jurisdictional claims in published maps and institutional affiliations. |
© 2021 by the authors. Licensee MDPI, Basel, Switzerland. This article is an open access article distributed under the terms and conditions of the Creative Commons Attribution (CC BY) license (https://creativecommons.org/licenses/by/4.0/).
Share and Cite
Perumalsamy, S.; Wan Ahmad, W.A.; Zaman Huri, H. Single Nucleotide Polymorphism rs17173608 in the Chemerin Encoding Gene: Is It a Predictor of Insulin Resistance and Severity of Coronary Artery Disease in Non-Obese Type 2 Diabetes? Healthcare 2021, 9, 623. https://doi.org/10.3390/healthcare9060623
Perumalsamy S, Wan Ahmad WA, Zaman Huri H. Single Nucleotide Polymorphism rs17173608 in the Chemerin Encoding Gene: Is It a Predictor of Insulin Resistance and Severity of Coronary Artery Disease in Non-Obese Type 2 Diabetes? Healthcare. 2021; 9(6):623. https://doi.org/10.3390/healthcare9060623
Chicago/Turabian StylePerumalsamy, Sangeetha, Wan Azman Wan Ahmad, and Hasniza Zaman Huri. 2021. "Single Nucleotide Polymorphism rs17173608 in the Chemerin Encoding Gene: Is It a Predictor of Insulin Resistance and Severity of Coronary Artery Disease in Non-Obese Type 2 Diabetes?" Healthcare 9, no. 6: 623. https://doi.org/10.3390/healthcare9060623
APA StylePerumalsamy, S., Wan Ahmad, W. A., & Zaman Huri, H. (2021). Single Nucleotide Polymorphism rs17173608 in the Chemerin Encoding Gene: Is It a Predictor of Insulin Resistance and Severity of Coronary Artery Disease in Non-Obese Type 2 Diabetes? Healthcare, 9(6), 623. https://doi.org/10.3390/healthcare9060623


