
Postural Variabilities Associated with the Most Comfortable Sitting Postures: A Preliminary Study


Abstract
:1. Introduction
2. Materials and Methods
2.1. Participants
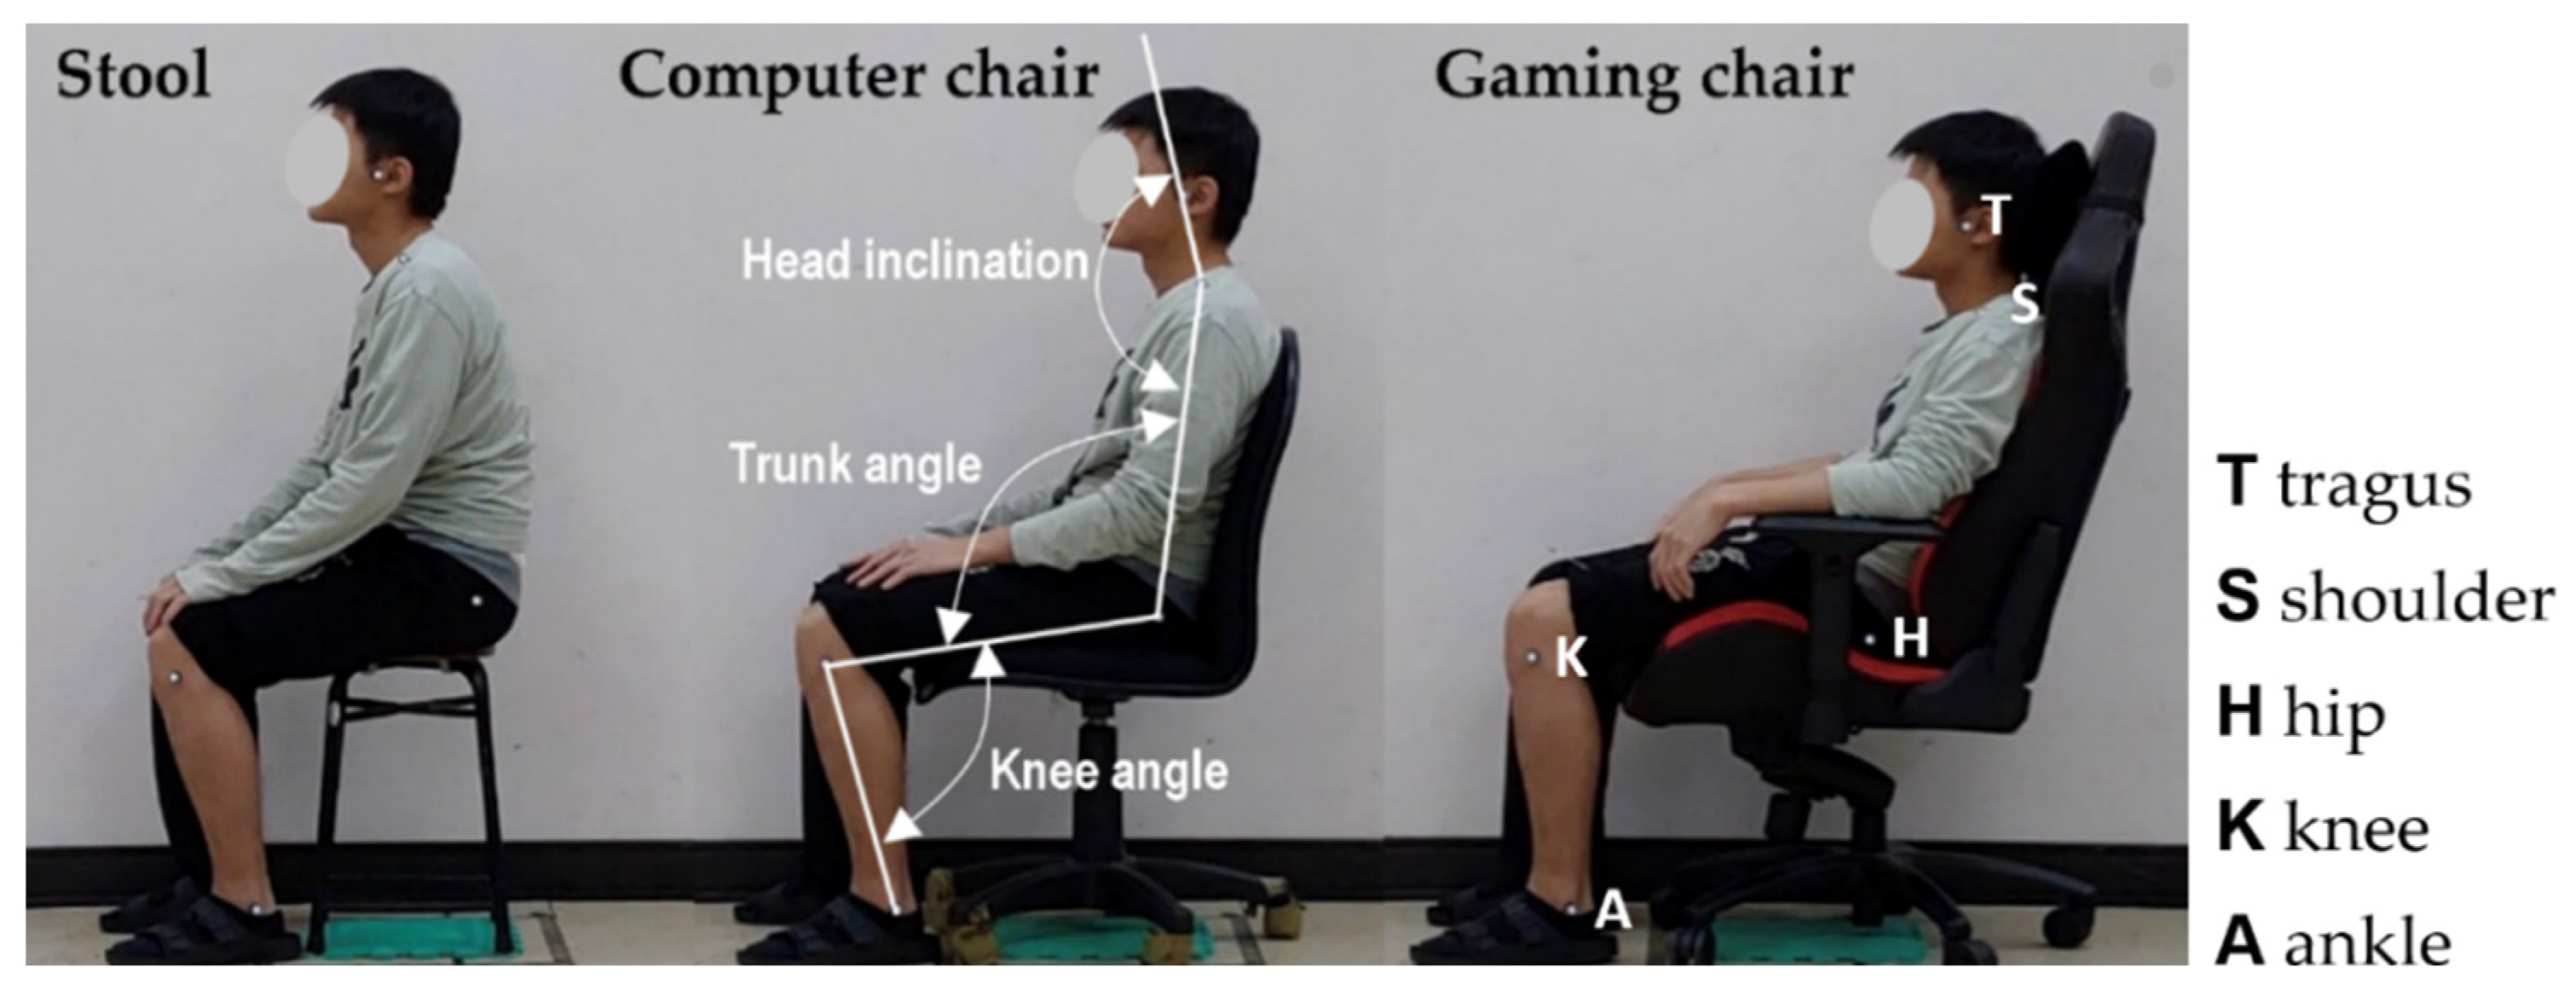
2.2. Chair Types
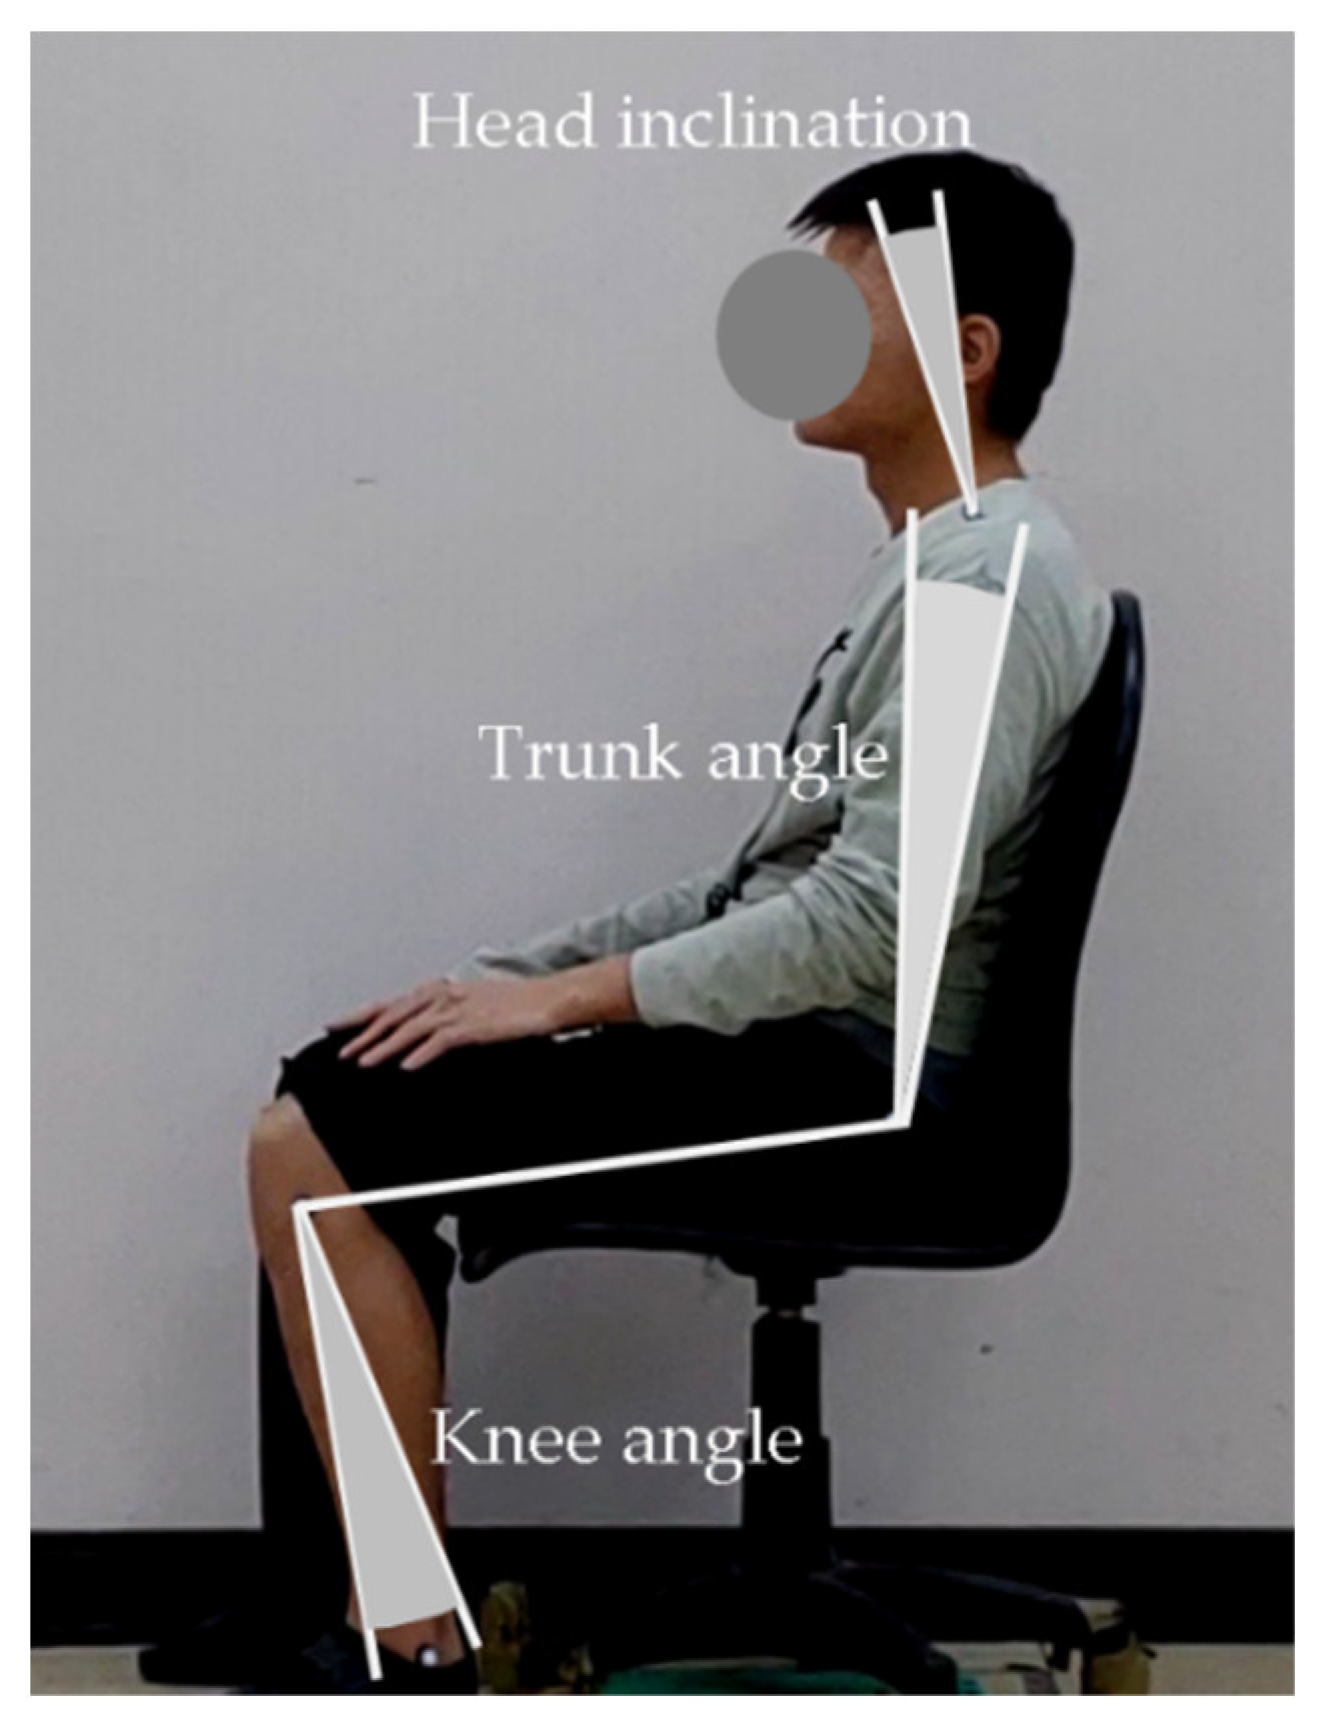
2.3. Global Joint Angle Measurements
2.4. Experimental Design and Procedure
In this experiment we would like to collect the most comfortable sitting posture. Please adjust your sitting posture as much as possible. We encourage you to use the seat adjustment devices and move your body joint angles until the most comfortable posture you perceive. Be sure that this posture for the seat makes you feel the most relaxed and the stresses on the body parts are minimum. If the most comfortable posture is achieved, please say YES.
2.5. Statistical Analysis
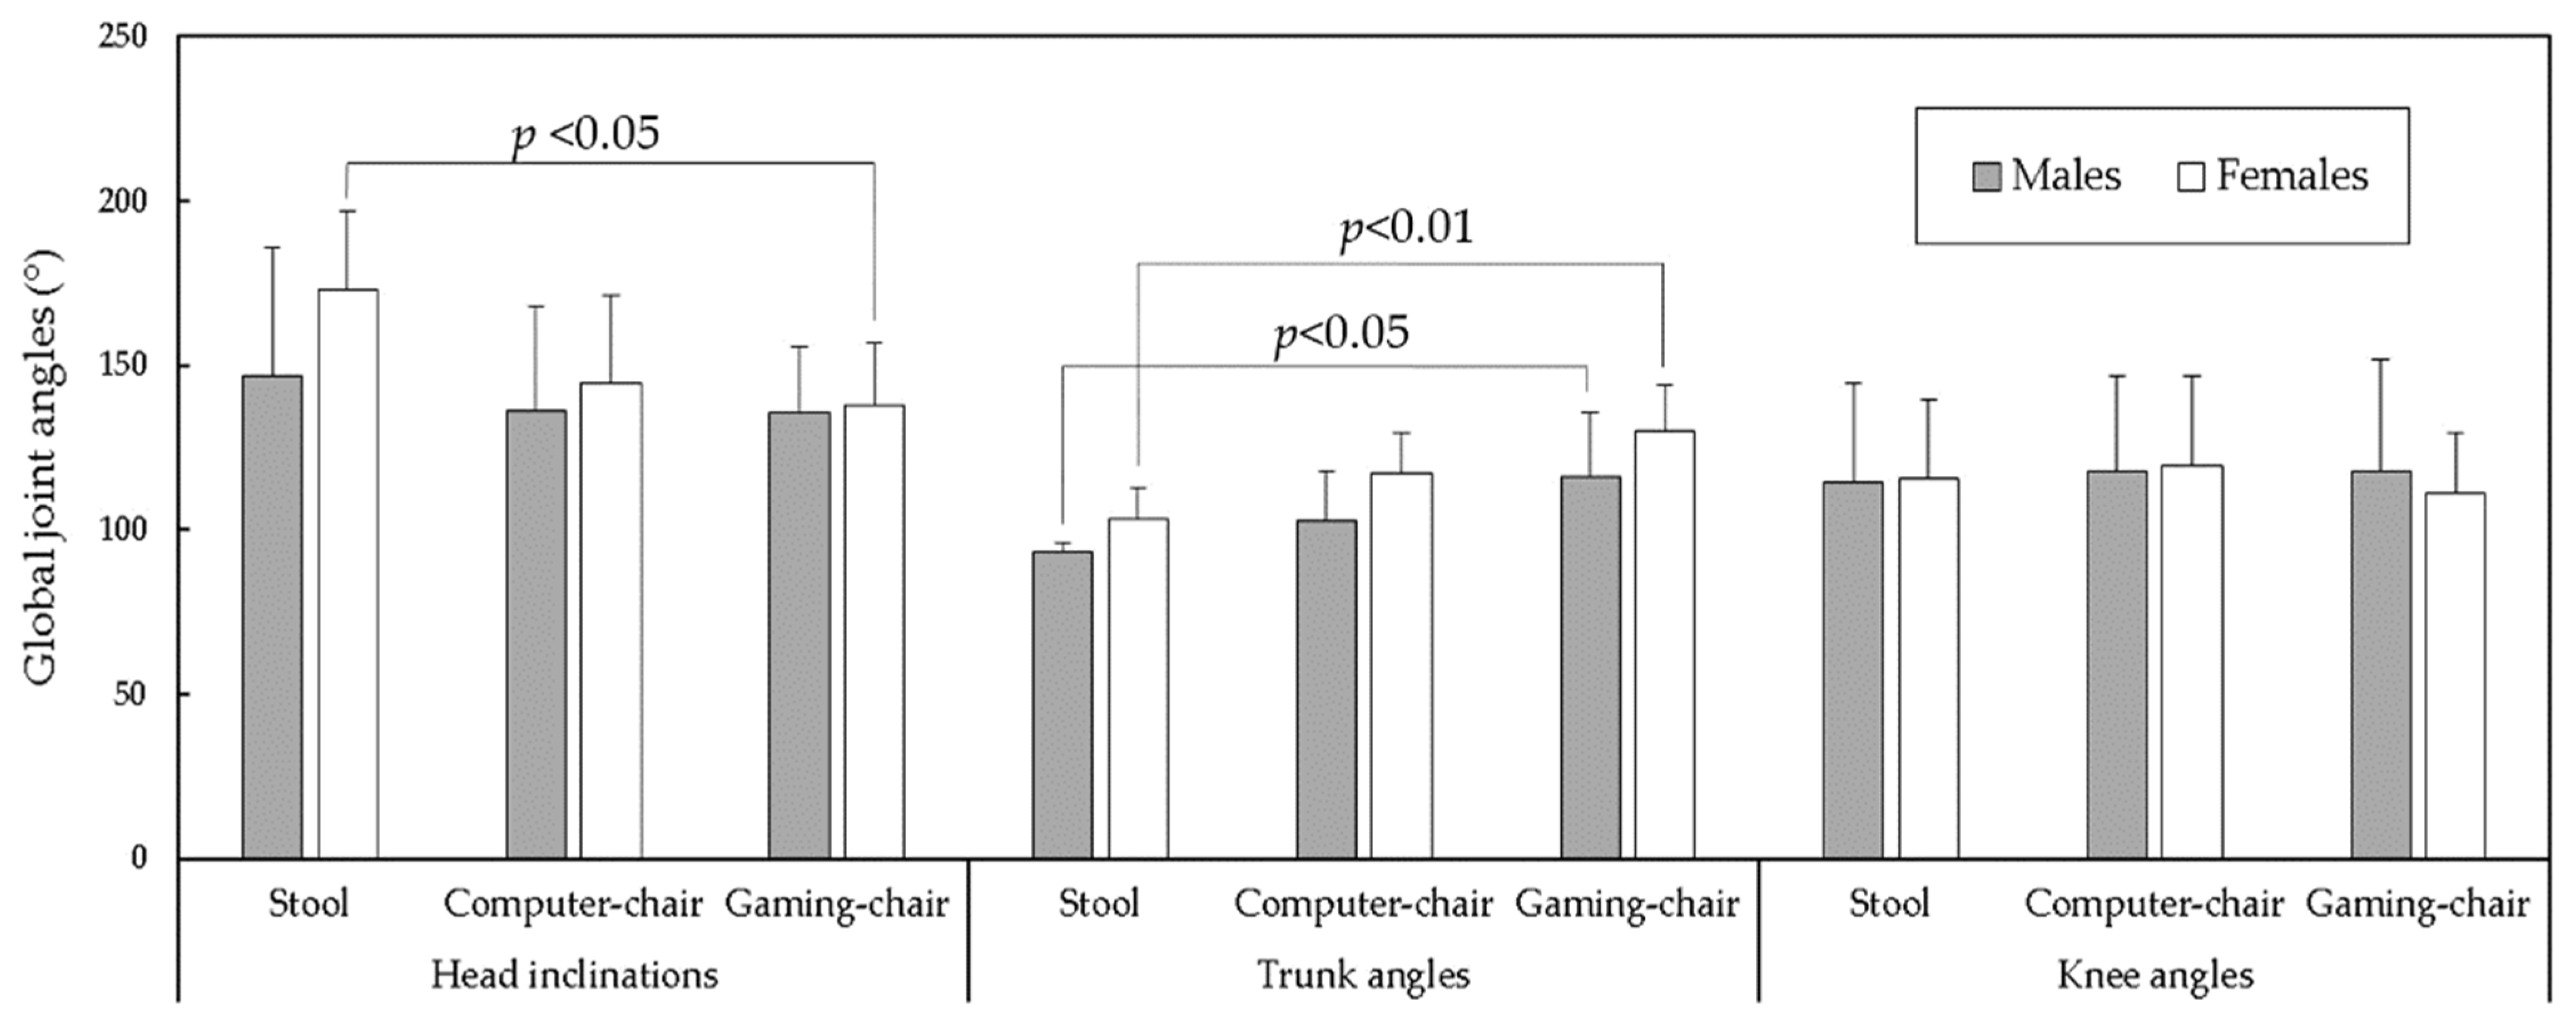
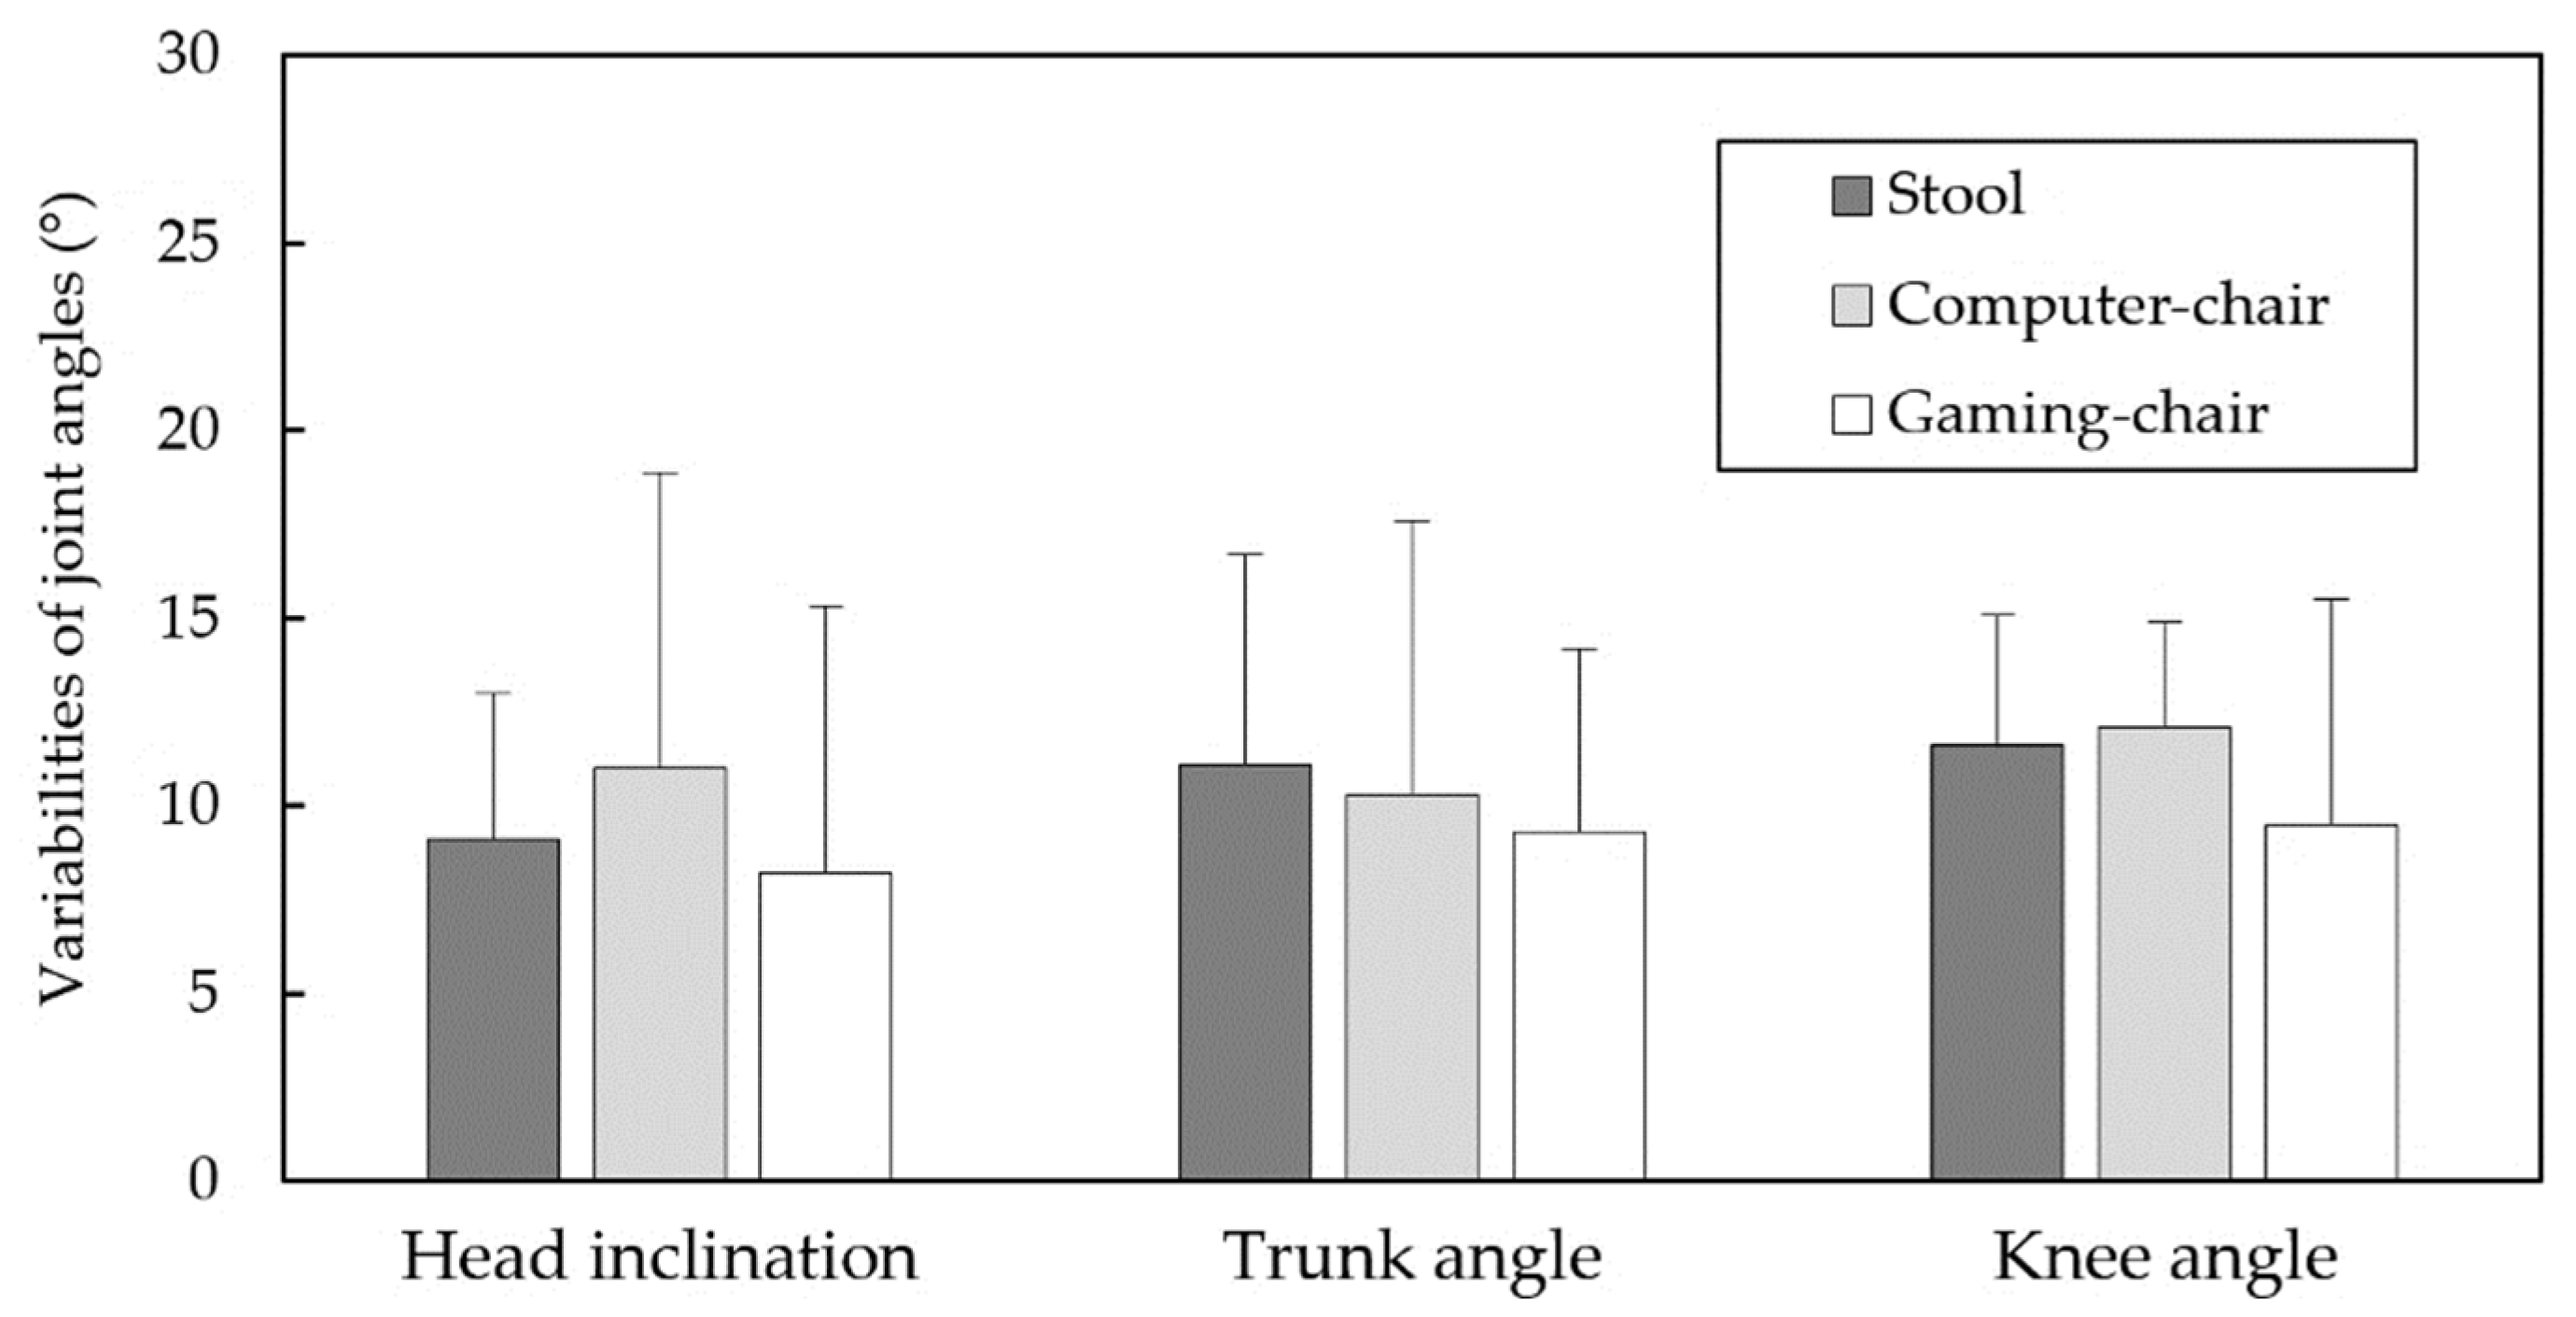
3. Results
4. Discussion
5. Conclusions
Author Contributions
Funding
Institutional Review Board Statement
Informed Consent Statement
Acknowledgments
Conflicts of Interest
References
- Underwood, D.; Sims, R. Do office workers adjust their chairs? End-user knowledge, use and barriers to chair adjustment. Appl. Ergon. 2019, 77, 100–106. [Google Scholar] [CrossRef]
- Waongenngarm, P.; van der Beek, A.J.; Akkarakittichoke, N.; Janwantanakul, P. Perceived musculoskeletal discomfort and its association with postural shifts during 4-h prolonged sitting in office workers. Appl. Ergon. 2020, 89, 103225. [Google Scholar] [CrossRef]
- Channak, S.; Klinsophon, T.; Janwantanakul, P. The effects of chair intervention on low back pain, discomfort, and trunk muscle activation in office workers: A systematic review. Int. J. Occup. Saf. Ergon. 2021, 1–35. [Google Scholar] [CrossRef]
- Gilman, S.L. Stand up Straight!: A History of Posture; Reaktion Books Ltd.: London, UK, 2018. [Google Scholar]
- Castanharo, R.; Duarte, M.; McGill, S. Corrective sitting strategies: An examination of muscle activity and spine loading. J. Electromyogr. Kinesiol. 2014, 24, 114–119. [Google Scholar] [CrossRef]
- Pope, M.H.; Goh, K.L.; Magnusson, M.L. Spine ergonomics. Annu. Rev. Biomed. Eng. 2002, 4, 49–68. [Google Scholar] [CrossRef] [PubMed] [Green Version]
- O’Sullivan, K.; O’Keeffe, M.; O’Sullivan, L.; O’Sullivan, P.; Dankaerts, W. Perceptions of sitting posture among members of the community, both with and without non-specific chronic low back pain. Man. Ther. 2013, 18, 551–556. [Google Scholar] [CrossRef]
- Dolan, P.; Adams, M.A.; Hutton, W.C. Commonly adopted postures and their effect on the lumbar spine. Spine 1988, 13, 197–201. [Google Scholar] [CrossRef] [PubMed]
- Korakakis, V.; O’Sullivan, K.; Whiteley, R.; O’Sullivan, P.B.; Korakaki, A.; Kotsifaki, A.; Tsaklis, P.V.; Tsiokanos, A.; Giakas, G. Notions of “optimal” posture are loaded with meaning. Perceptions of sitting posture among asymptomatic members of the community. Musculoskel. Sci. Pract. 2021, 51, 102310. [Google Scholar] [CrossRef]
- Barczyk-Pawelec, K.; Sipko, T. Active self-correction of spinal posture in pain-free women in response to the command “straighten your back”. Women Health 2017, 57, 1098–1114. [Google Scholar] [CrossRef] [PubMed]
- Mabb, S.; Bettany-Saltikov, J.; Hodgson, D. Habitual, perceived ideal and neutral sitting postures within an asymptomatic young adult population: Muscle activity and sagittal spinal curvature. Scoliosis 2013, 8, 1–2. [Google Scholar] [CrossRef] [Green Version]
- Korakakis, V.; O’Sullivan, K.; O’Sullivan, P.B.; Evagelinou, V.; Sotiralis, Y.; Sideris, A.; Sakellariou, K.; Karanasios, S.; Giakas, G. Physiotherapist perceptions of optimal sitting and standing posture. Muscoskel. Sci. Pract. 2018, 39, 24–31. [Google Scholar] [CrossRef] [PubMed]
- O’Sullivan, K.; O’Sullivan, P.; O’Sullivan, L.; Dankaerts, W. What do physiotherapists consider to be the best sitting spinal posture? Man. Ther. 2012, 17, 432–437. [Google Scholar] [CrossRef]
- Laird, R.A.; Gilbert, J.; Kent, P.; Keating, J.L. Comparing lumbo-pelvic kinematics in people with and without back pain: A systematic review and meta-analysis. BMC Muscoskel. Disord. 2014, 15, 1–13. [Google Scholar] [CrossRef]
- Slater, D.; Korakakis, V.; O’Sullivan, P.; Nolan, D.; O’Sullivan, K. “Sit up straight”: Time to Re-evaluate. J. Orthop. Sports Phys. Ther. 2019, 49, 562–564. [Google Scholar] [CrossRef] [PubMed]
- Adams, M.A. Biomechanics of back pain. Acupunct. Med. 2004, 22, 178–188. [Google Scholar] [CrossRef]
- Dunk, N.M.; Callaghan, J.P. Gender-based differences in postural responses to seated exposures. Clin. Biomech. 2005, 20, 1101–1110. [Google Scholar] [CrossRef]
- Poitras, S.; Blais, R.; Swaine, B.; Rossignol, M. Management of work-related low back pain: A population-based survey of physical therapists. Phys. Ther. 2005, 85, 1168–1181. [Google Scholar] [CrossRef]
- Abboud, J.; Nougarou, F.; Page, I.; Cantin, V.; Massicotte, D.; Descarreaux, M. Trunk motor variability in patients with non-specific chronic low back pain. Eur. J. Appl. Physiol. 2014, 114, 2645–2654. [Google Scholar] [CrossRef] [PubMed]
- Falla, D.; Gizzi, L.; Tschapek, M.; Erlenwein, J.; Petzke, F. Reduced task-induced variations in the distribution of activity across back muscle regions in individuals with low back pain. Pain 2014, 155, 944–953. [Google Scholar] [CrossRef]
- Groenesteijn, L.; Blok, M.; Formanoy, M.; de Korte, E.; Vink, P. Usage of office chair adjustments and controls by workers having shared and owned work spaces. In Ergonomics and Health Aspects of Work with Computers; Karsh, B.-T., Ed.; Springer: Berlin/Heidelberg, Germany, 2009; pp. 23–28. [Google Scholar]
- Helander, M.G. Forget about ergonomics in chair design? Focus on aesthetics and comfort! Ergonomics 2003, 46, 1306–1319. [Google Scholar] [CrossRef]
- Genaidy, A.M.; Karwowski, W. The effects of neutral posture deviations on perceived joint discomfort ratings in sitting and standing postures. Ergonomics 1993, 36, 785–792. [Google Scholar] [CrossRef] [PubMed]
- Kee, D.; Karwowski, W. The boundaries for joint angles of isocomfort for sitting and standing males based on perceived comfort of static joint postures. Ergonomics 2001, 44, 614–648. [Google Scholar] [CrossRef]
- Zhang, L.; Helander, M.G.; Drury, C.G. Identifying factors of comfort and discomfort in sitting. Hum. Factors 1996, 38, 377–389. [Google Scholar] [CrossRef]
- Daruis, D.D.I.; Deros, B.M.; Nor, M.J.M. Malaysian sitting anthropometry for seat fit parameters. Hum. Factors Ergon. Manuf. Serv. Ind. 2011, 21, 443–455. [Google Scholar] [CrossRef]
- Hiemstra-van Mastrigt, S.; Groenesteijn, L.; Vink, P.; Kuijt-Evers, L.F. Predicting passenger seat comfort and discomfort on the basis of human, context and seat characteristics: A literature review. Ergonomics 2017, 60, 889–911. [Google Scholar] [CrossRef]
- Wang, X.; Cardoso, M.; Beurier, G. Effects of seat parameters and sitters’ anthropometric dimensions on seat profile and optimal compressed seat pan surface. Appl. Ergon. 2018, 73, 13–21. [Google Scholar] [CrossRef] [Green Version]
- Vergara, M.; Page, Á. Relationship between comfort and back posture and mobility in sitting-posture. Appl. Ergon. 2002, 33, 1–8. [Google Scholar] [CrossRef]
- De Looze, M.P.; Kuijt-Evers, L.F.; Van Dieen, J.A.A.P. Sitting comfort and discomfort and the relationships with objective measures. Ergonomics 2003, 46, 985–997. [Google Scholar] [CrossRef]
- Wang, E.M.Y.; Wang, M.J.; Yeh, W.Y.; Shih, Y.C.; Lin, Y.C. Development of anthropometric work environment for Taiwanese workers. Int. J. Ind. Ergon. 1999, 23, 3–8. [Google Scholar] [CrossRef]
- Cohen, J. Statistical Power Analysis for the Behavioral Sciences, 2nd ed.; Lawrence Erlbaum Associates: Hillsdale, NJ, USA, 1988. [Google Scholar]
- Marek, T.; Norowol, C. The Influence of under- and over-Stimulation on Sitting Posture; Corlett, E.N., Wilson, J., Mannenica, I., Eds.; The Ergonomics of Working Postures; Taylor and Francis: London, UK, 1986. [Google Scholar]
- Claeys, K.; Brumagne, S.; Deklerck, J.; Vanderhaeghen, J.; Dankaerts, W. Sagittal evaluation of usual standing and sitting spinal posture. J. Bodyw. Mov. Ther. 2016, 20, 326–333. [Google Scholar] [CrossRef] [PubMed]
- Claus, A.P.; Hides, J.A.; Moseley, G.L.; Hodges, P.W. Is ‘ideal’ sitting posture real? Measurement of spinal curves in four sitting postures. Man. Ther. 2009, 14, 404–408. [Google Scholar] [CrossRef]
- Levine, D.; Whittle, M.W. The effects of pelvic movement on lumbar lordosis in the standing position. J. Orthop. Sports Phys. Ther. 1996, 24, 130–135. [Google Scholar] [CrossRef] [PubMed]
- Dunk, N.M.; Kedgley, A.E.; Jenkyn, T.R.; Callaghan, J.P. Evidence of a pelvis-driven flexion pattern: Are the joints of the lower lumbar spine fully flexed in seated postures? Clin. Biomech. 2009, 24, 164–168. [Google Scholar] [CrossRef] [PubMed]
- Endo, K.; Suzuki, H.; Nishimura, H.; Tanaka, H.; Shishido, T.; Yamamoto, K. Sagittal lumbar and pelvic alignment in the standing and sitting positions. J. Orthop. Sci. 2012, 17, 682–686. [Google Scholar] [CrossRef] [PubMed]
- Potter, J.J.; Sauer, J.L.; Weisshaar, C.L.; Thelen, D.G.; Ploeg, H.L. Gender differences in bicycle saddle pressure distribution during seated cycling. Med. Sci. Sports Exerc. 2008, 40, 1126–1134. [Google Scholar] [CrossRef] [Green Version]
- Anders, C.; Brose, G.; Hofmann, G.O.; Scholle, H.C. Gender specific activation patterns of trunk muscles during whole body tilt. Eur. J. Appl. Physiol. 2007, 101, 195–205. [Google Scholar] [CrossRef]
- O’Sullivan, P.B.; Smith, A.J.; Beales, D.J.; Straker, L.M. Association of biopsychosocial factors with degree of slump in sitting posture and self-report of back pain in adolescents: A cross-sectional study. Phys. Ther. 2011, 91, 470–483. [Google Scholar] [CrossRef] [Green Version]

| Head Inclination | Trunk Angle | Knee Angle | ||||
|---|---|---|---|---|---|---|
| Variables | F | p | F | p | F | p |
| Gender | 1.70 | 0.202 | 8.05 | <0.01 | 0.02 | 0.892 |
| Chair type | 2.32 | 0.116 | 10.10 | <0.001 | 0.08 | 0.925 |
| Gender × chair type | 0.58 | 0.566 | 0.09 | 0.914 | 0.10 | 0.906 |
| Head Inclination | Trunk Angle | Knee Angle | ||||
|---|---|---|---|---|---|---|
| Variables | F | p | F | p | F | p |
| Gender | 0.67 | 0.418 | 1.95 | 0.172 | 0.04 | 0.838 |
| Chair type | 1.29 | 0.290 | 0.23 | 0.795 | 0.60 | 0.553 |
| Gender × chair type | 1.52 | 0.235 | 0.65 | 0.528 | 0.557 | 0.579 |
| Head Inclination | Trunk Angle | Knee Angle | ||||
|---|---|---|---|---|---|---|
| Mean Joint Angle | F | p | F | p | F | p |
| Males | 0.24 | 0.793 | 3.62 | <0.05 | 0.02 | 0.979 |
| Females | 3.61 | <0.05 | 7.31 | <0.01 | 0.63 | 0.405 |
| Joint Angle Range | F | p | F | p | F | p |
| Males | 1.50 | 0.254 | 0.52 | 0.605 | 0.61 | 0.557 |
| Feamles | 1.12 | 0.350 | 0.25 | 0.785 | 0.57 | 0.578 |
Publisher’s Note: MDPI stays neutral with regard to jurisdictional claims in published maps and institutional affiliations. |
© 2021 by the authors. Licensee MDPI, Basel, Switzerland. This article is an open access article distributed under the terms and conditions of the Creative Commons Attribution (CC BY) license (https://creativecommons.org/licenses/by/4.0/).
Share and Cite
Chen, Y.-L.; Chan, Y.-C.; Zhang, L.-P. Postural Variabilities Associated with the Most Comfortable Sitting Postures: A Preliminary Study. Healthcare 2021, 9, 1685. https://doi.org/10.3390/healthcare9121685
Chen Y-L, Chan Y-C, Zhang L-P. Postural Variabilities Associated with the Most Comfortable Sitting Postures: A Preliminary Study. Healthcare. 2021; 9(12):1685. https://doi.org/10.3390/healthcare9121685
Chicago/Turabian StyleChen, Yi-Lang, You-Chun Chan, and Li-Peng Zhang. 2021. "Postural Variabilities Associated with the Most Comfortable Sitting Postures: A Preliminary Study" Healthcare 9, no. 12: 1685. https://doi.org/10.3390/healthcare9121685
APA StyleChen, Y.-L., Chan, Y.-C., & Zhang, L.-P. (2021). Postural Variabilities Associated with the Most Comfortable Sitting Postures: A Preliminary Study. Healthcare, 9(12), 1685. https://doi.org/10.3390/healthcare9121685