Models for Heart Failure Admissions and Admission Rates, 2016 through 2018
Abstract
1. Introduction
1.1. Demand for Treatment
1.2. Supply and Payment of Cardiologists
1.3. Relevant Methods
1.4. Research Question and Significance
2. Materials and Methods
2.1. Data
2.2. Variables
2.3. Models for Number of Heart Failure Admissions
2.3.1. Train and Test Sets
2.3.2. Imputation, Transformation, and Scaling
2.3.3. Explanatory Analysis for the Number of Heart Failure Diagnoses
2.3.4. Tree Models
2.4. Geospatial Analysis, State and County Heart Failure Admission Rates
2.5. Changes in DRGs
2.6. Software
3. Results
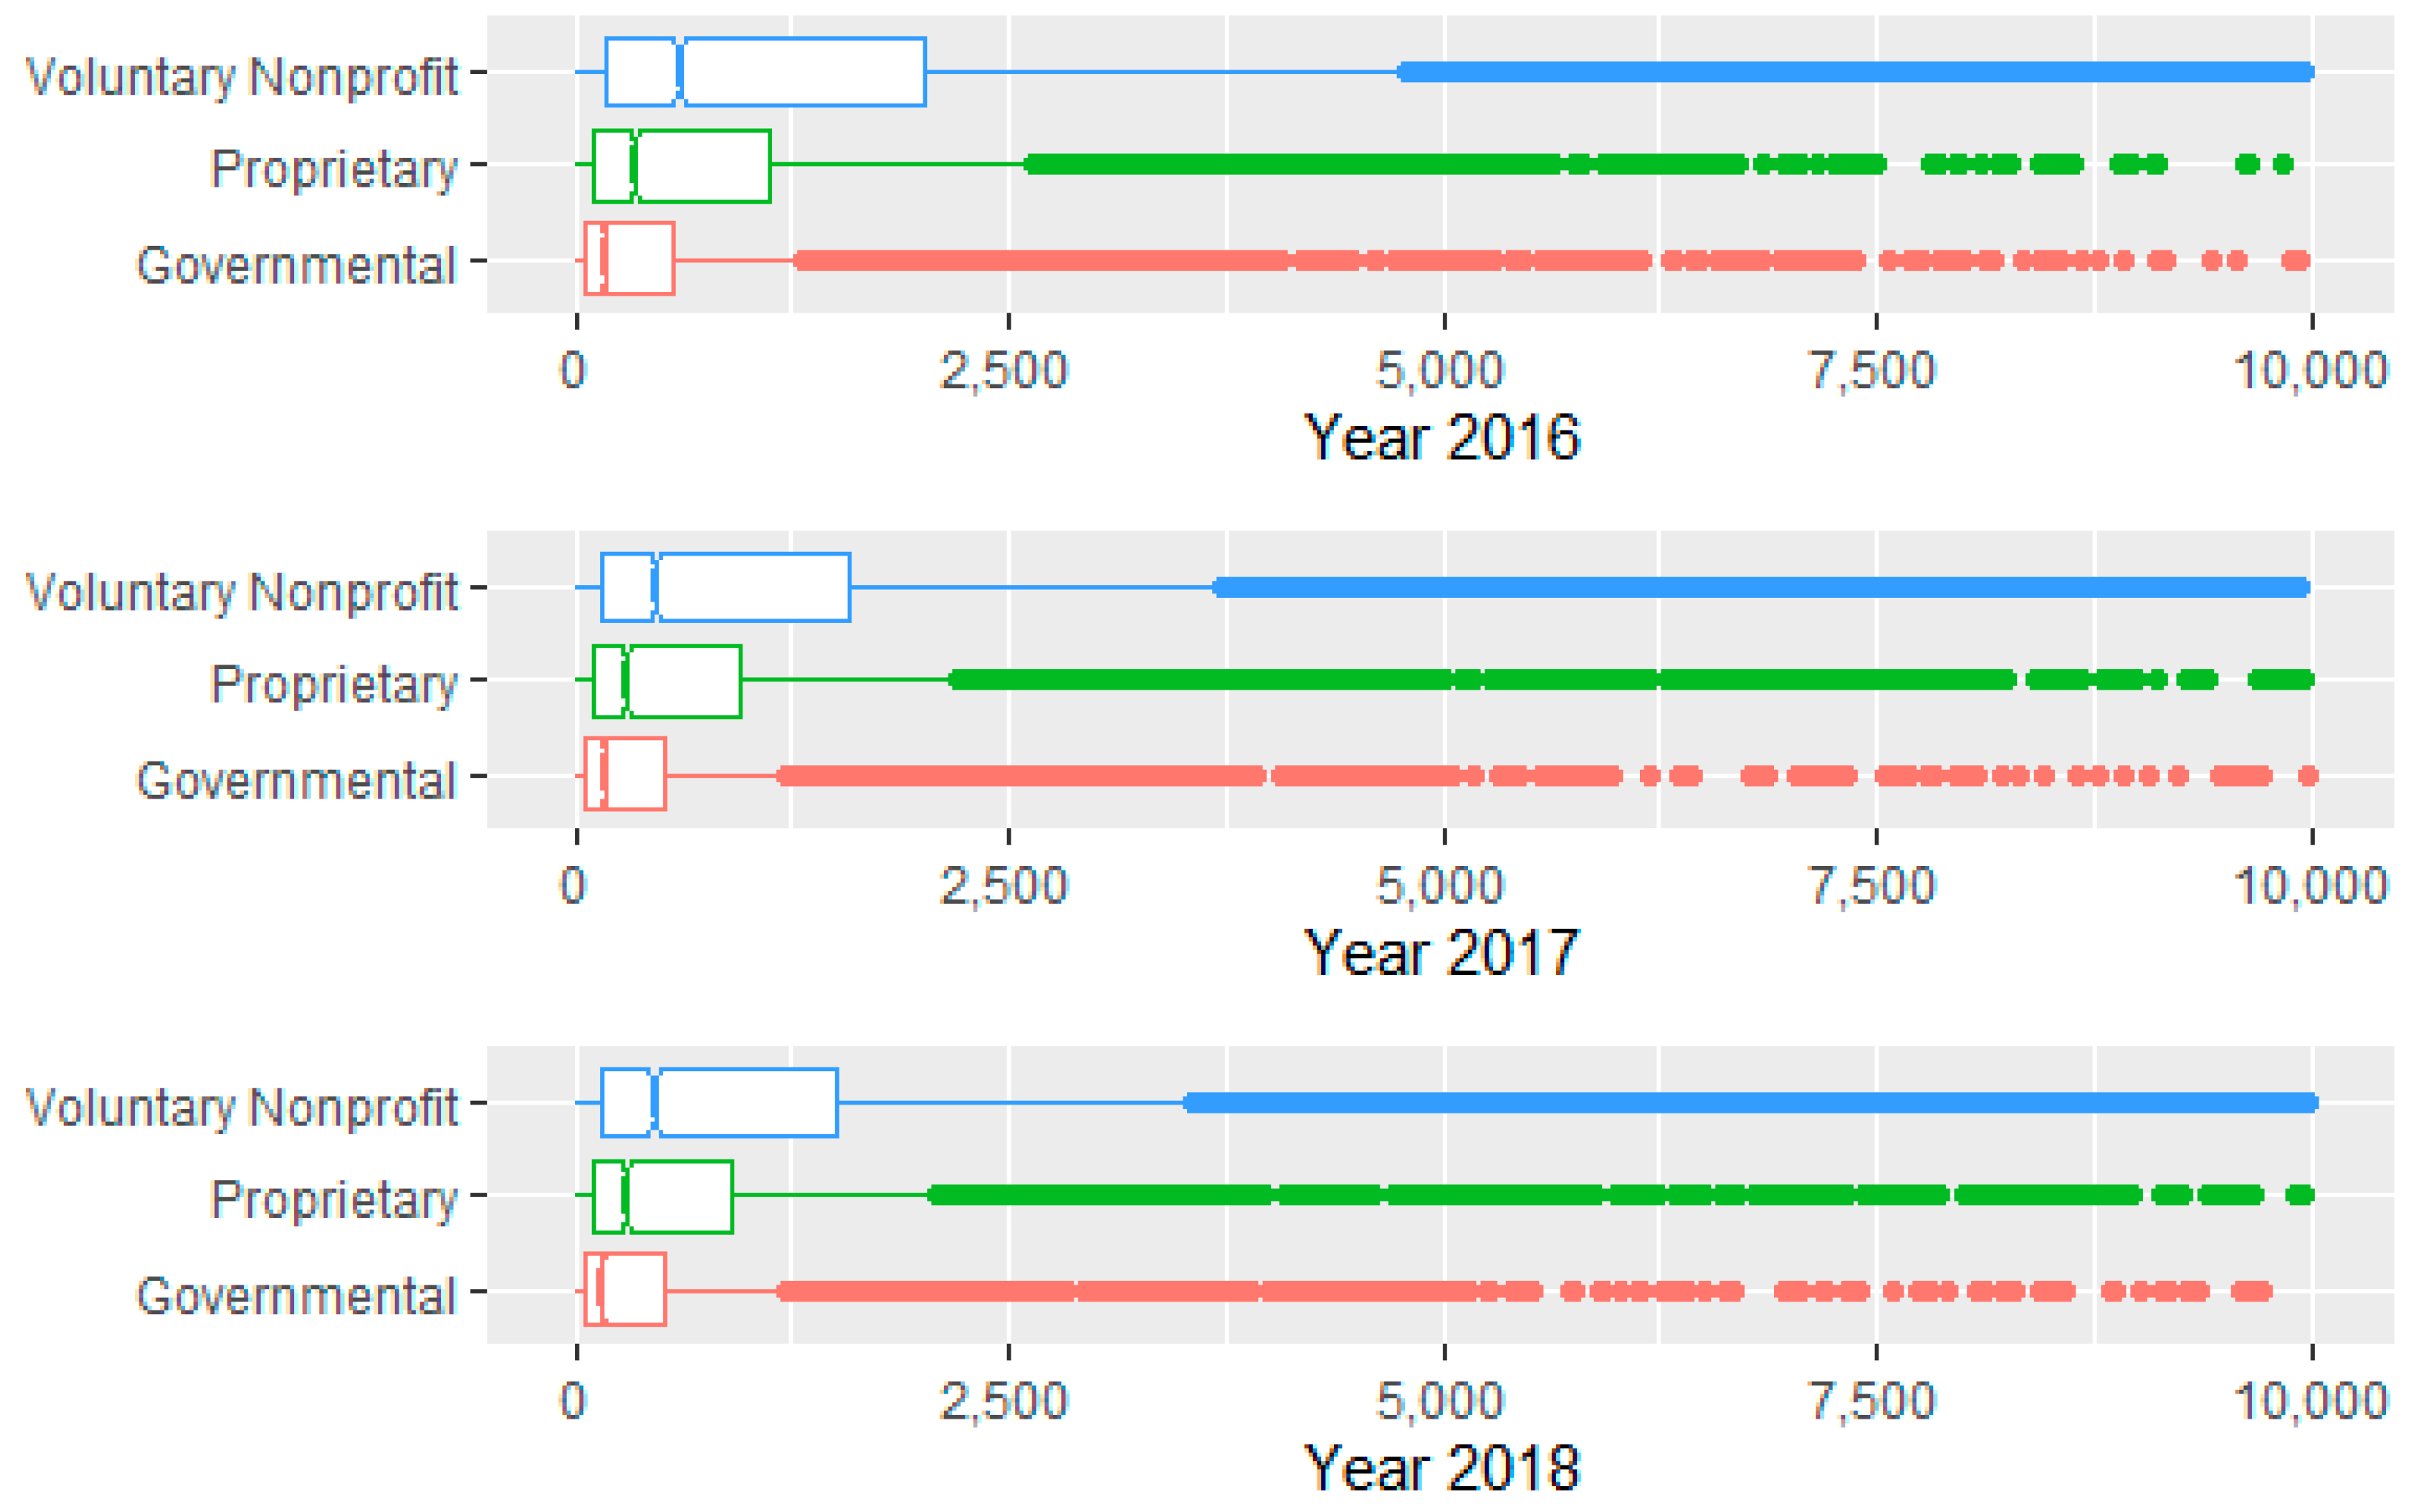
3.1. Descriptive Statistics—Quantitative Data
3.2. Descriptive Statistics—Categorical Data
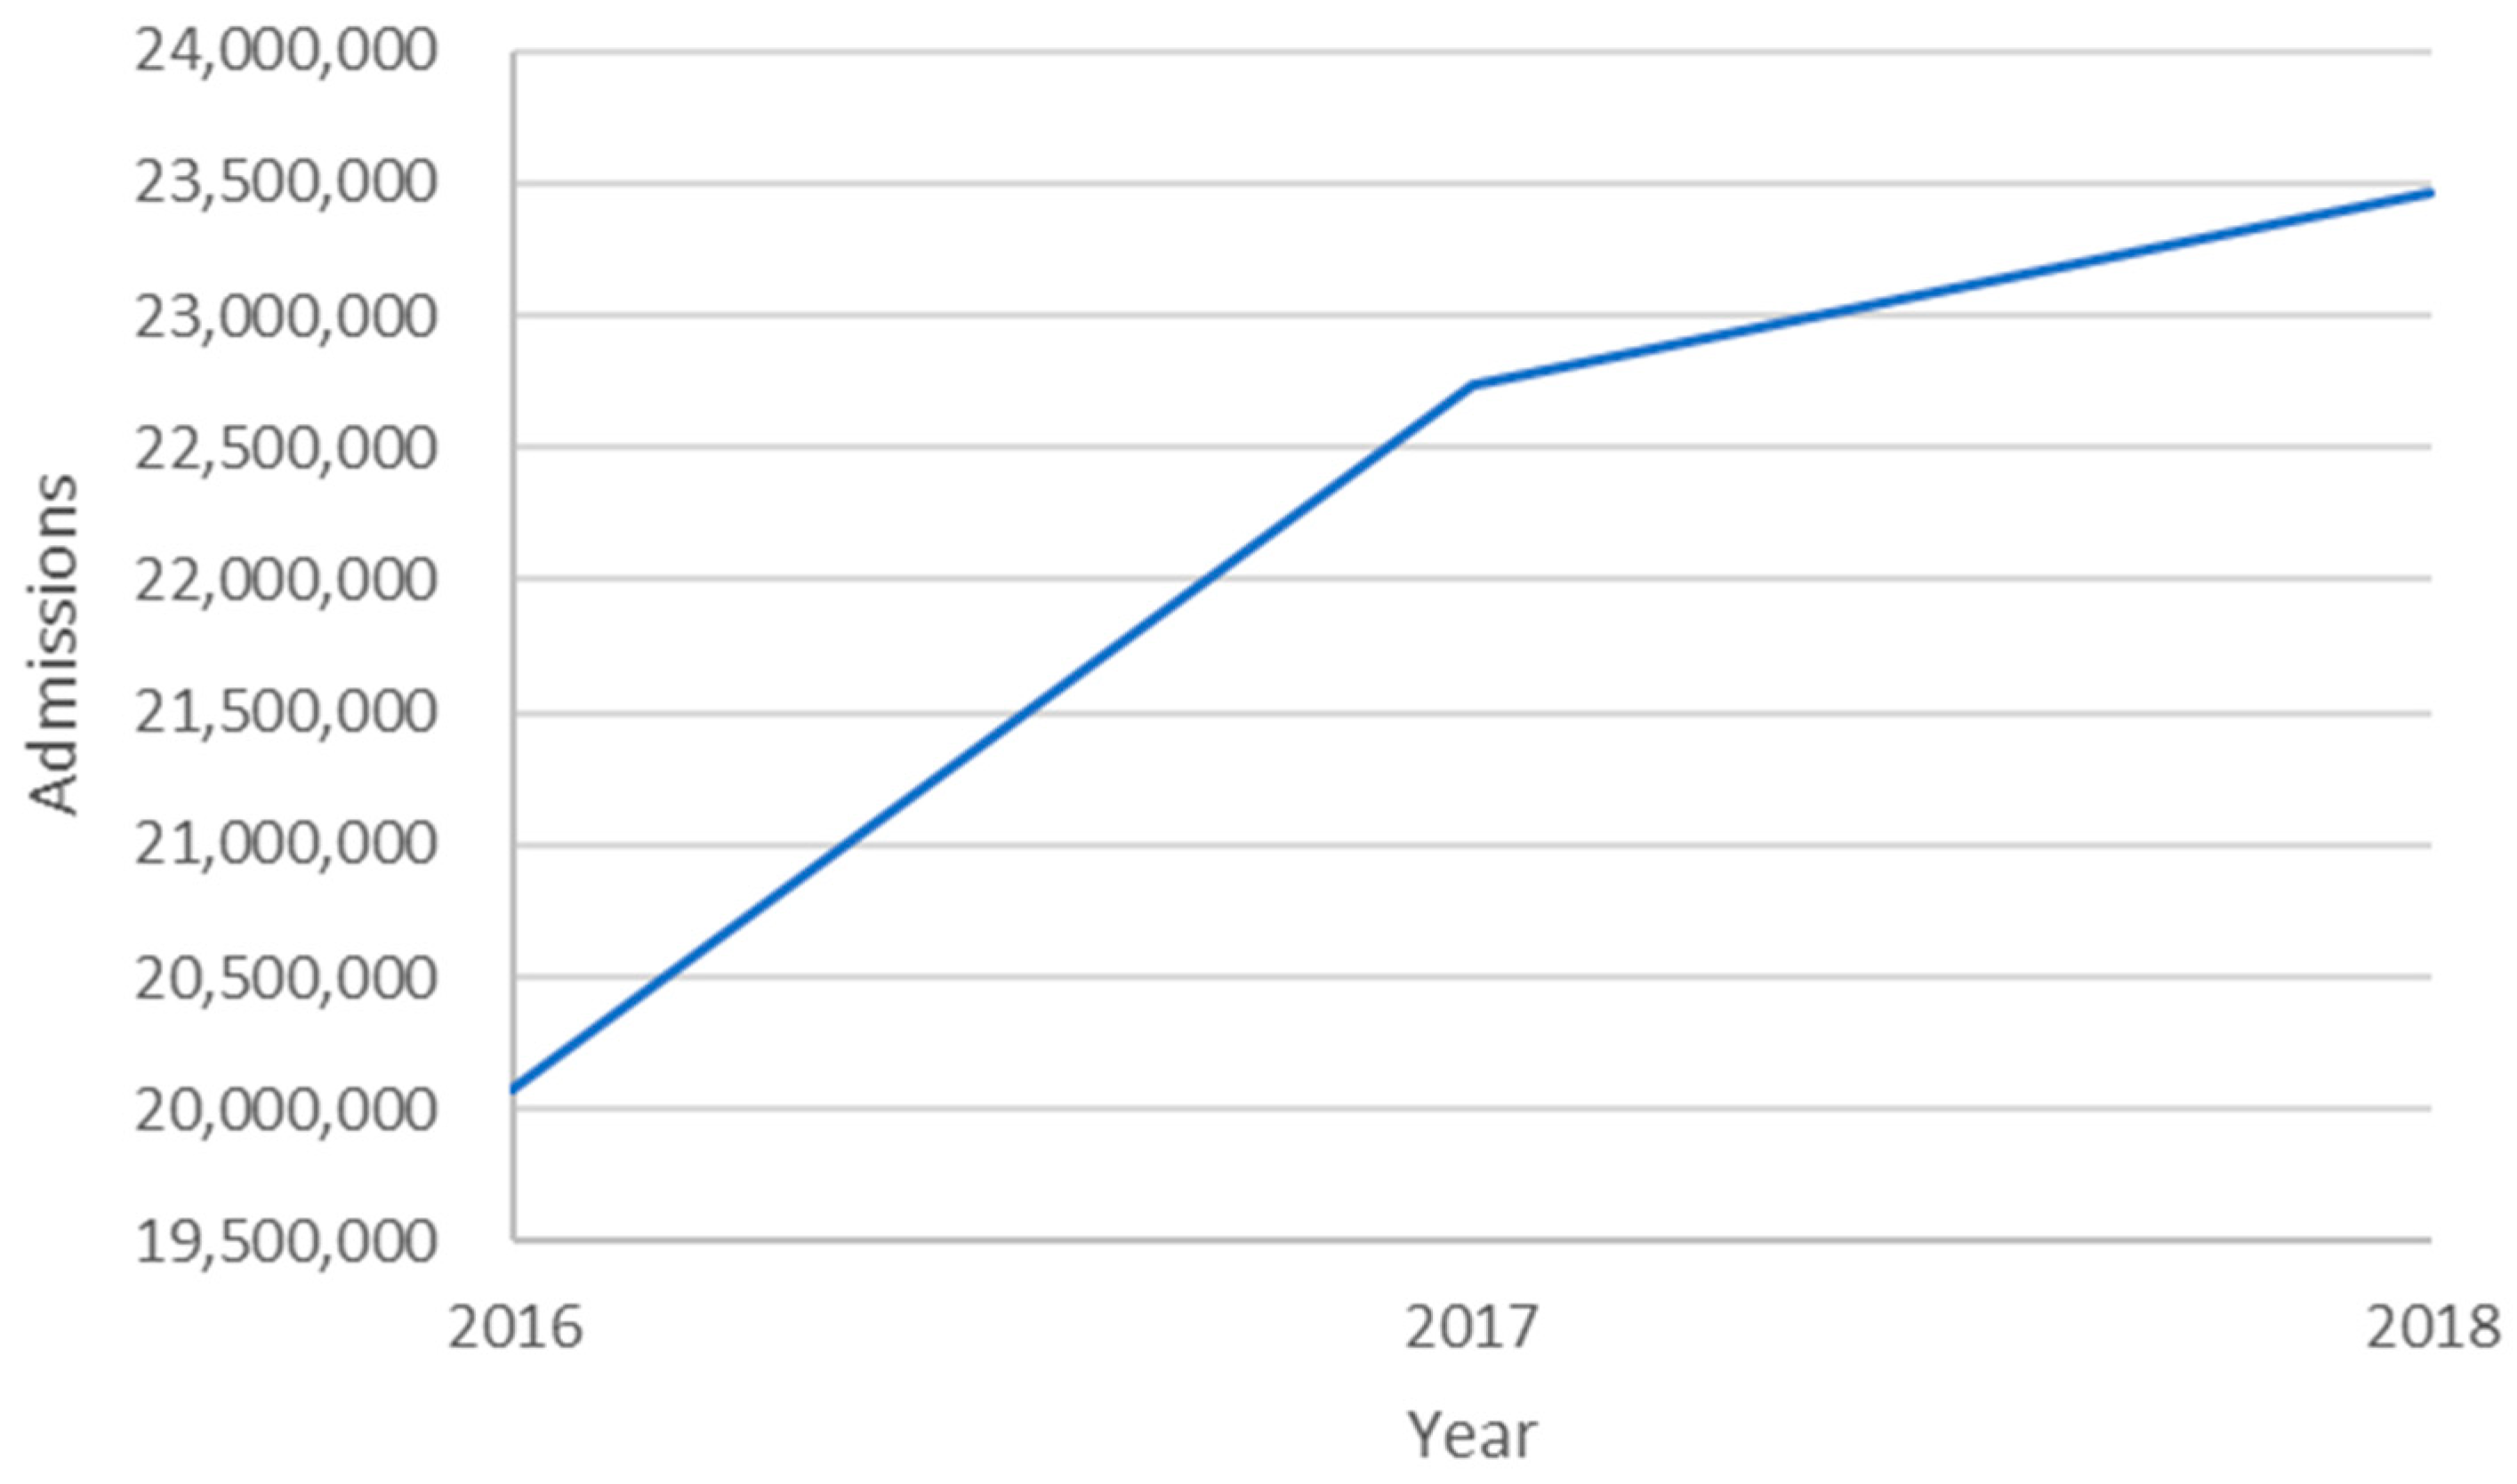
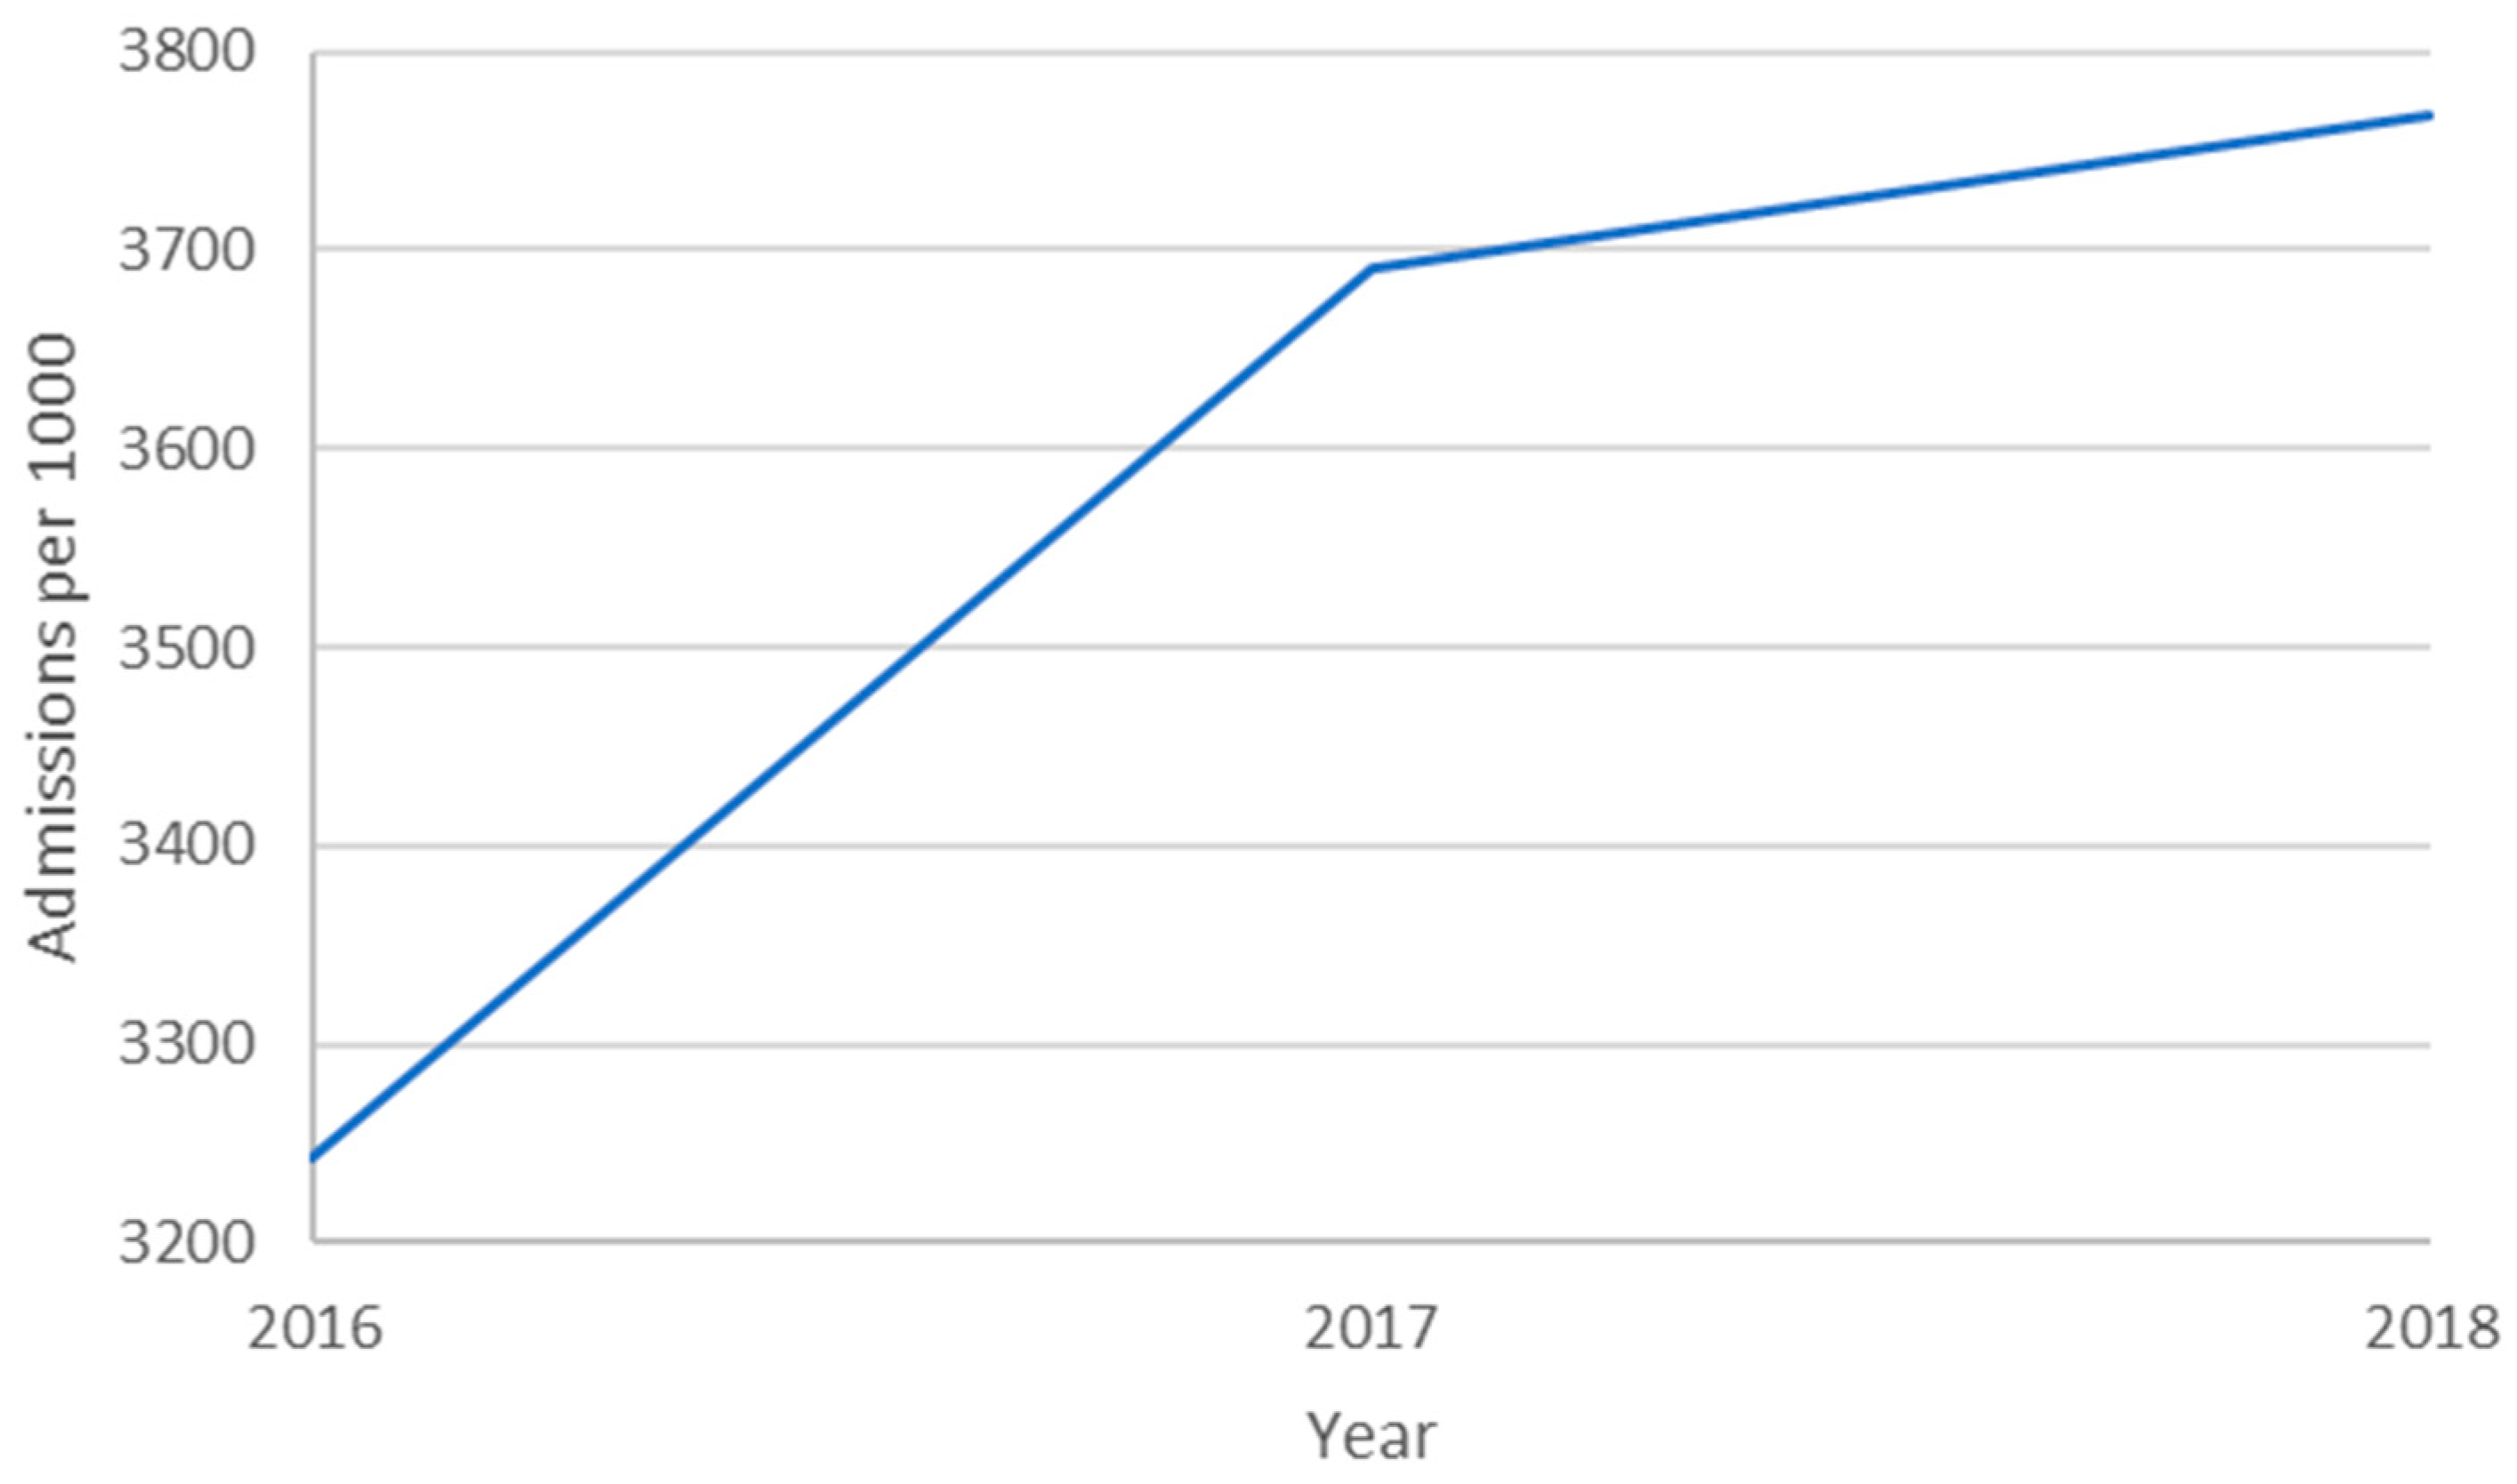
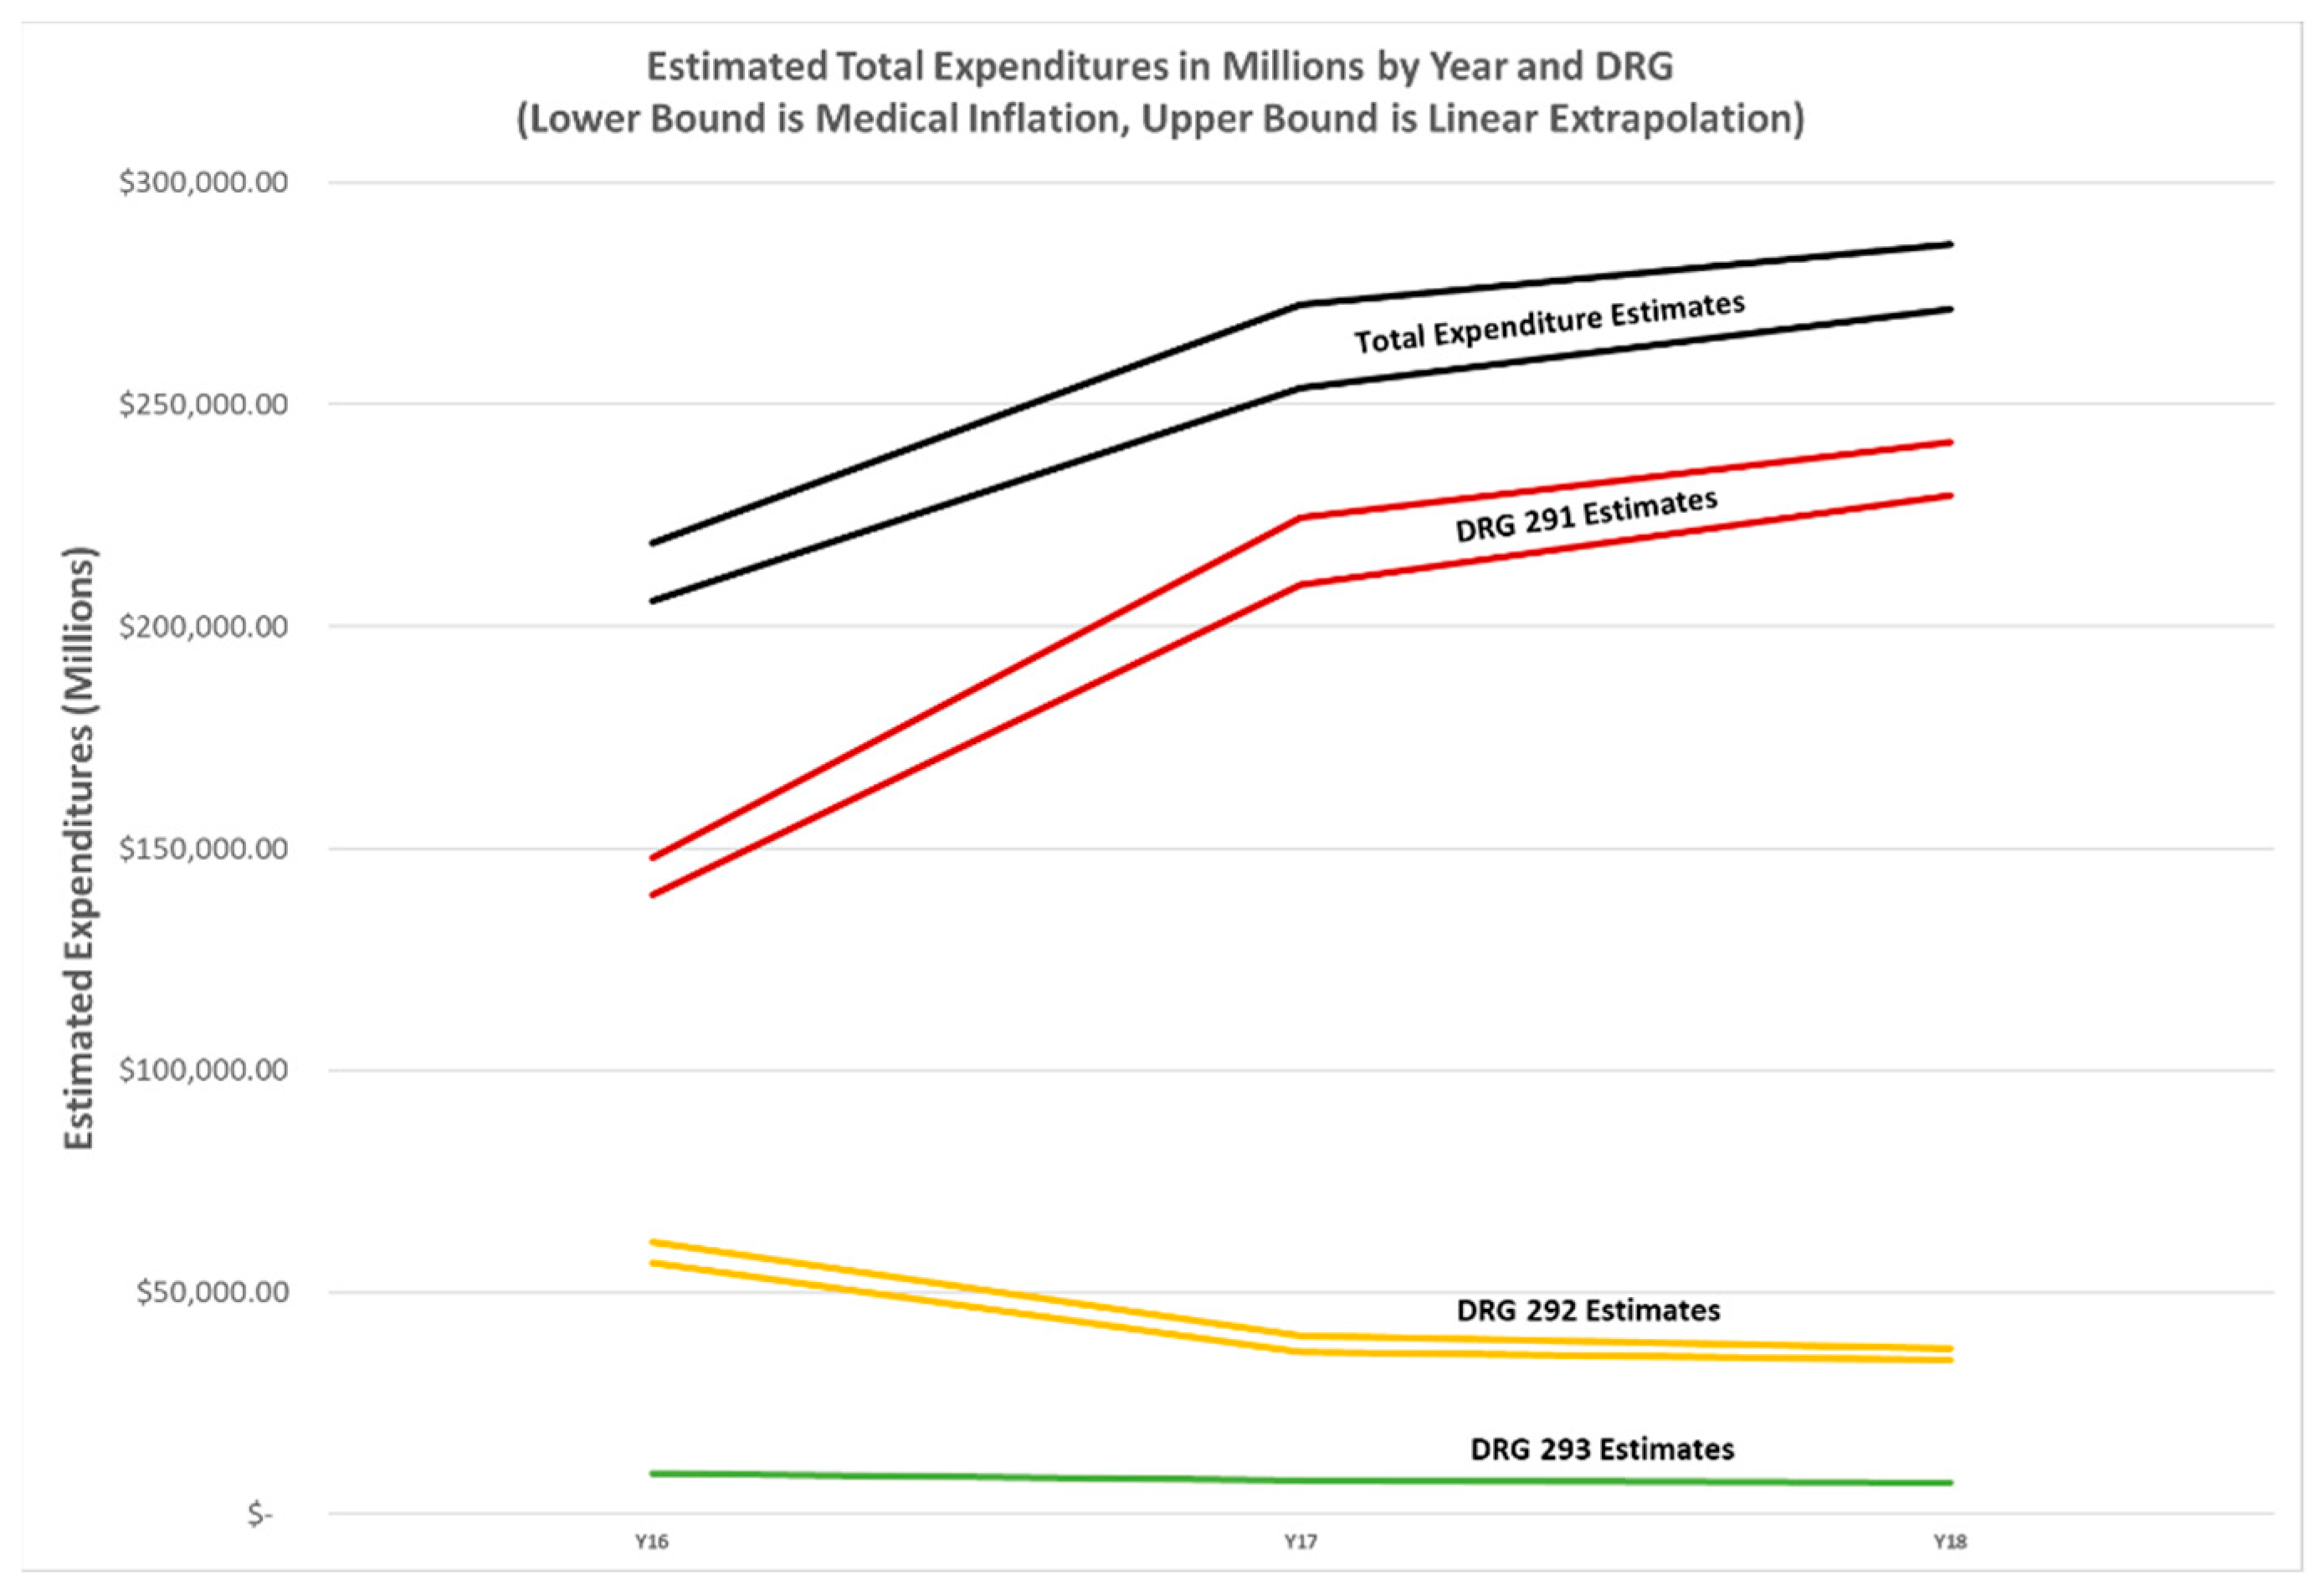
3.3. Descriptive Statistics—Financial Estimates
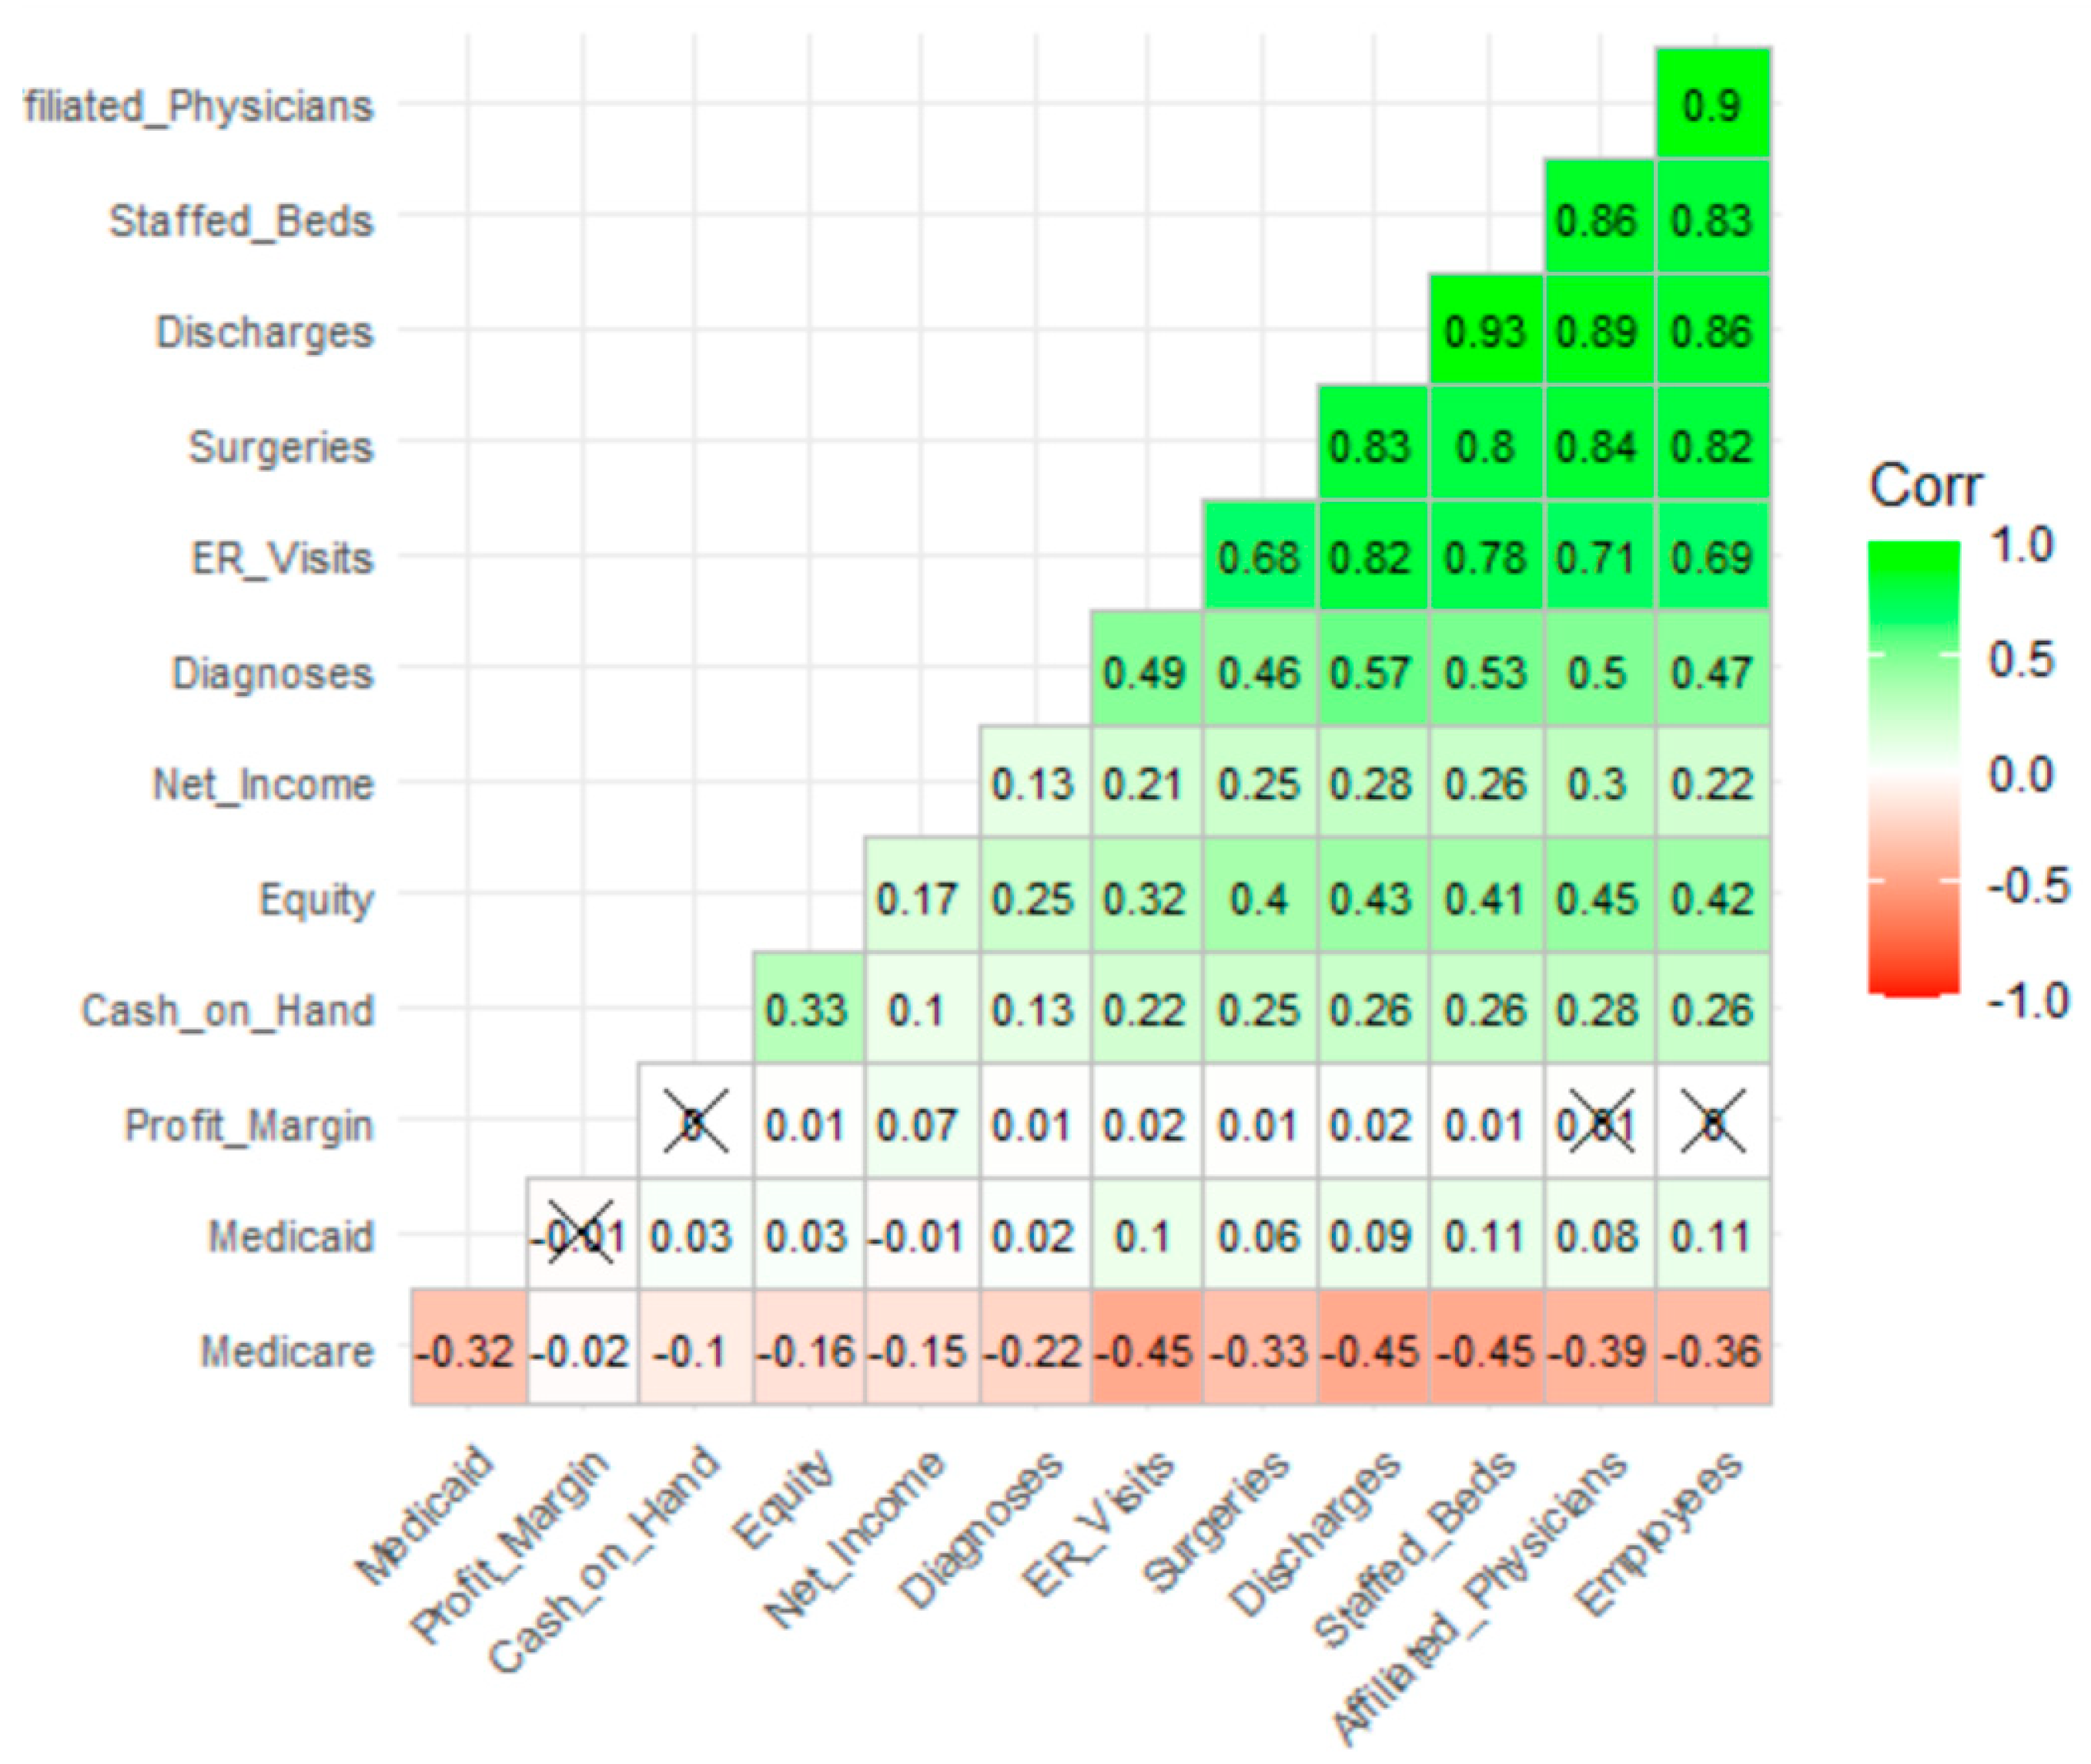
3.4. Descriptive Statistics—Correlational Analysis
3.5. Explanatory Models for Heart Failure Diagnoses, Hospital Unit of Analysis
3.5.1. Regression Models
3.5.2. Tree Ensemble Models
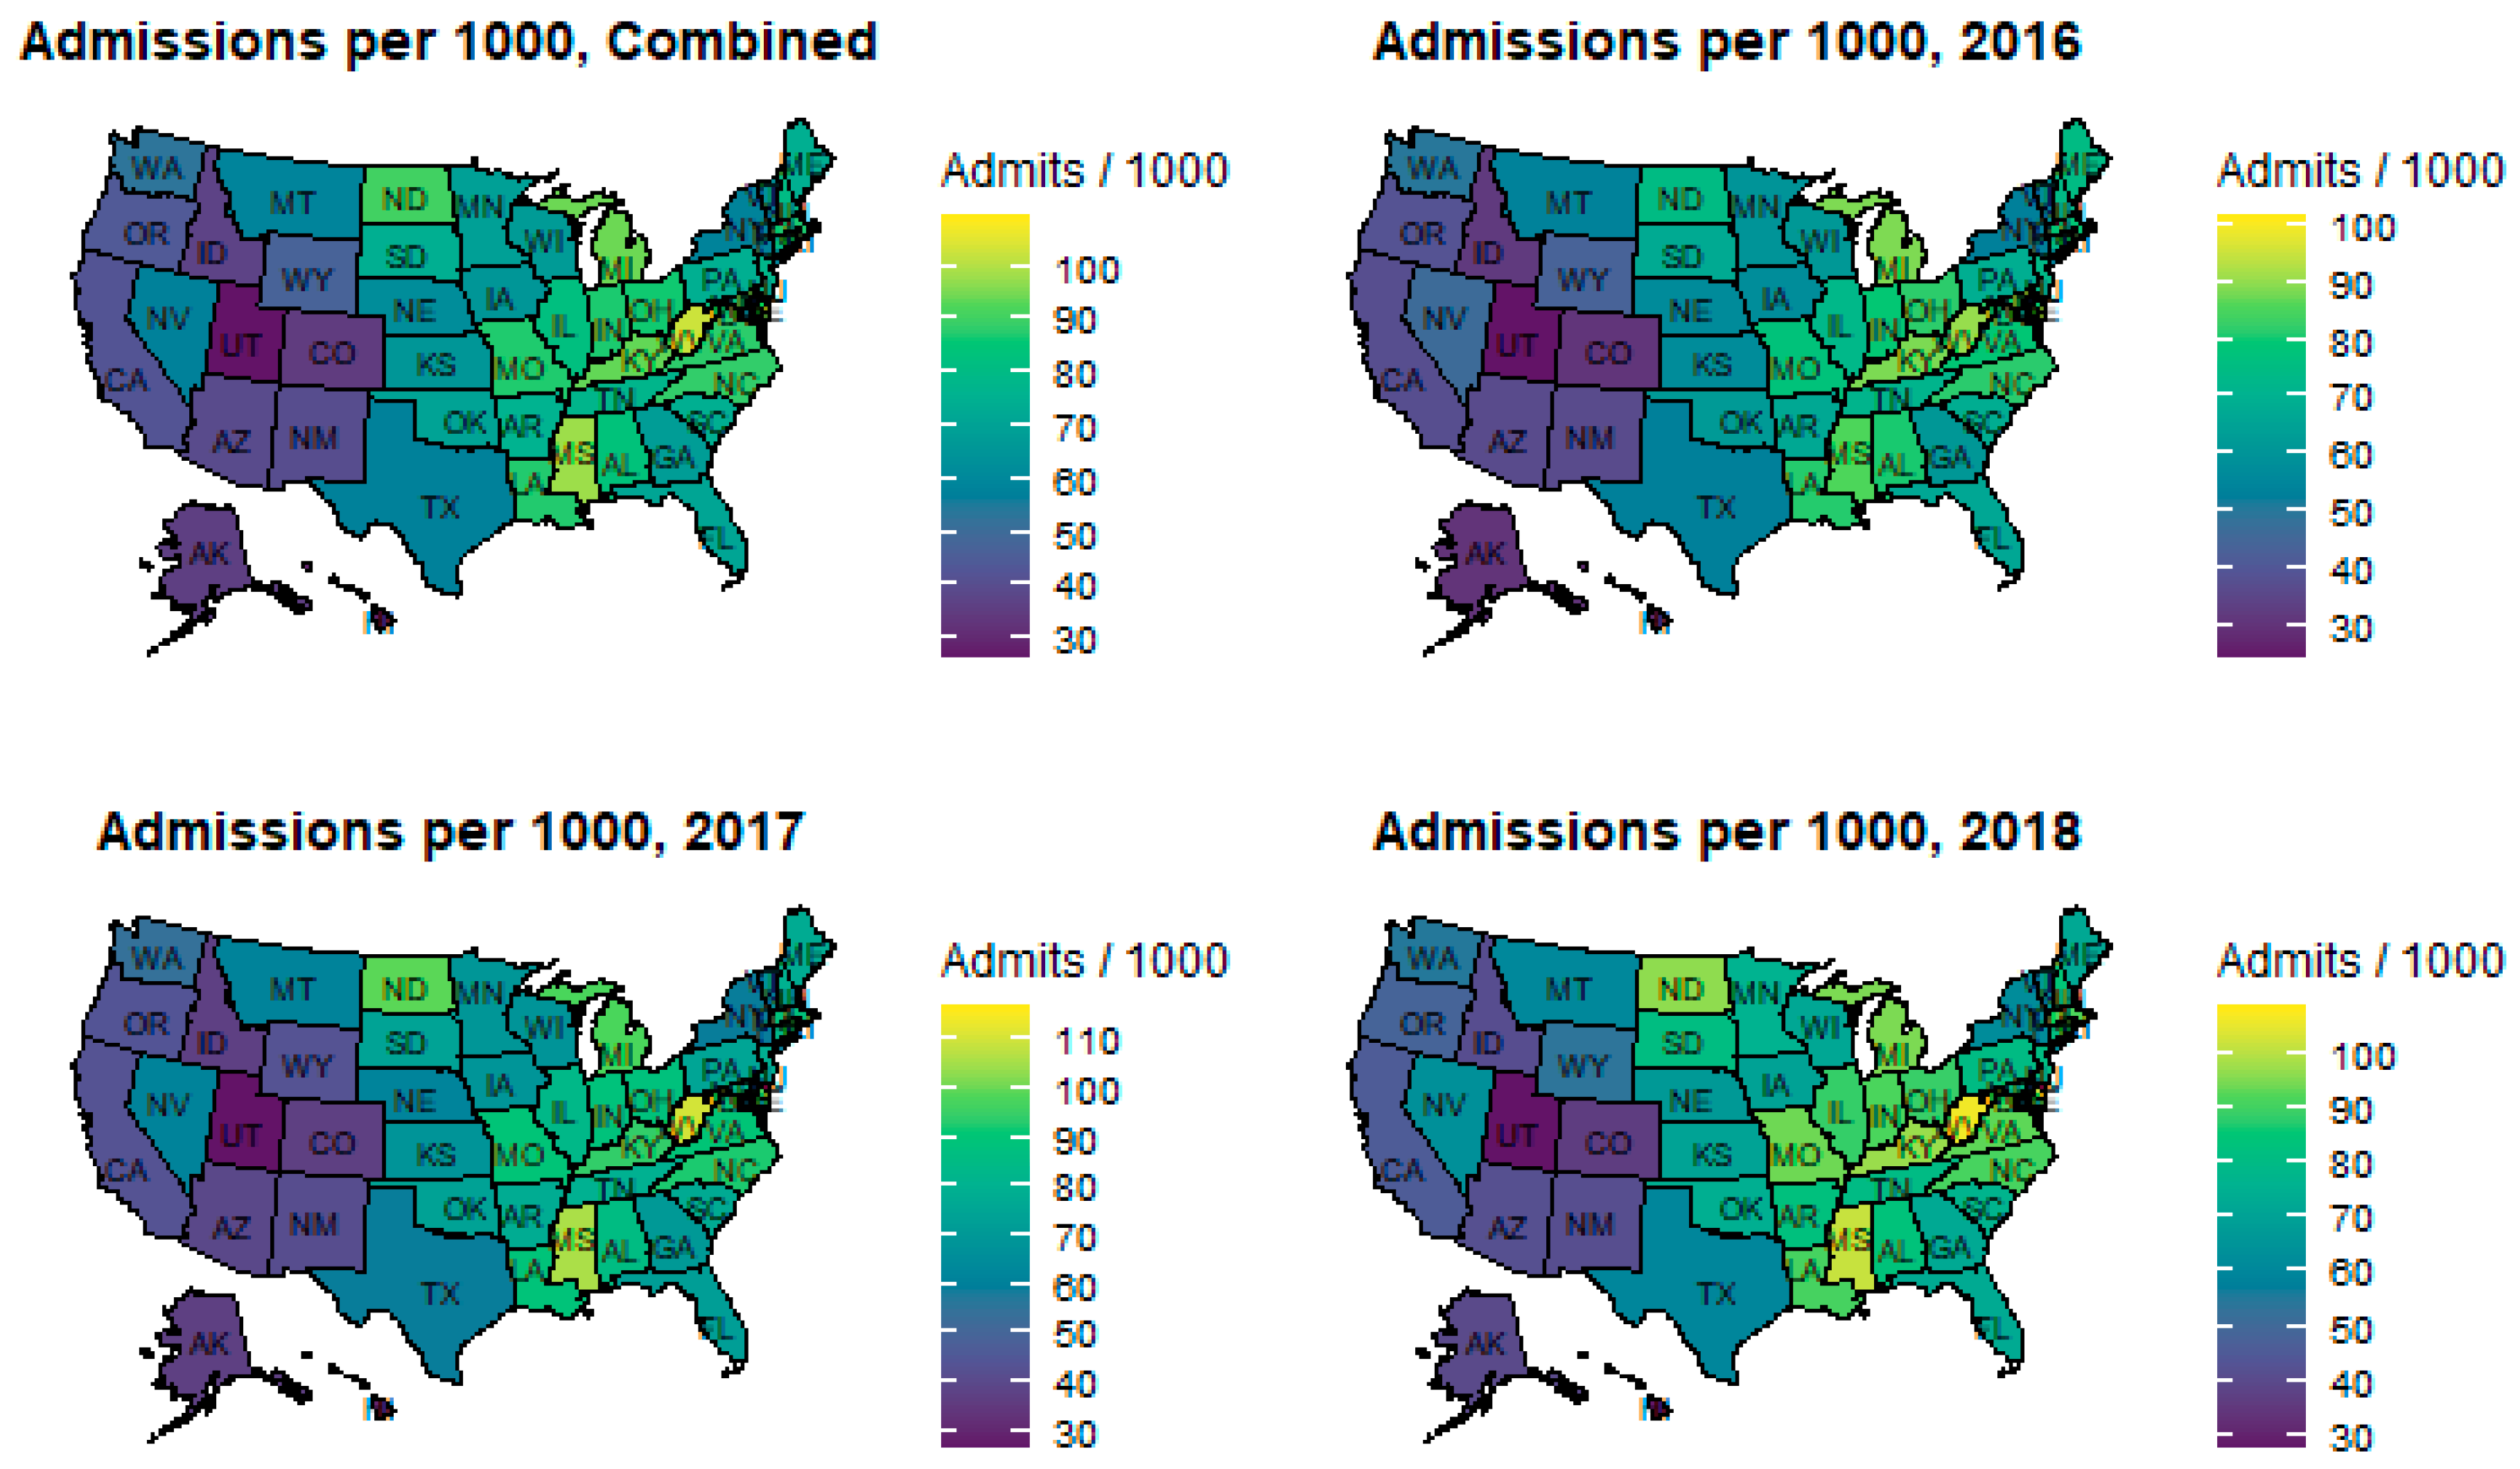
3.6. State-Level Geospatial Analysis
3.7. County-Level Spatial Analysis
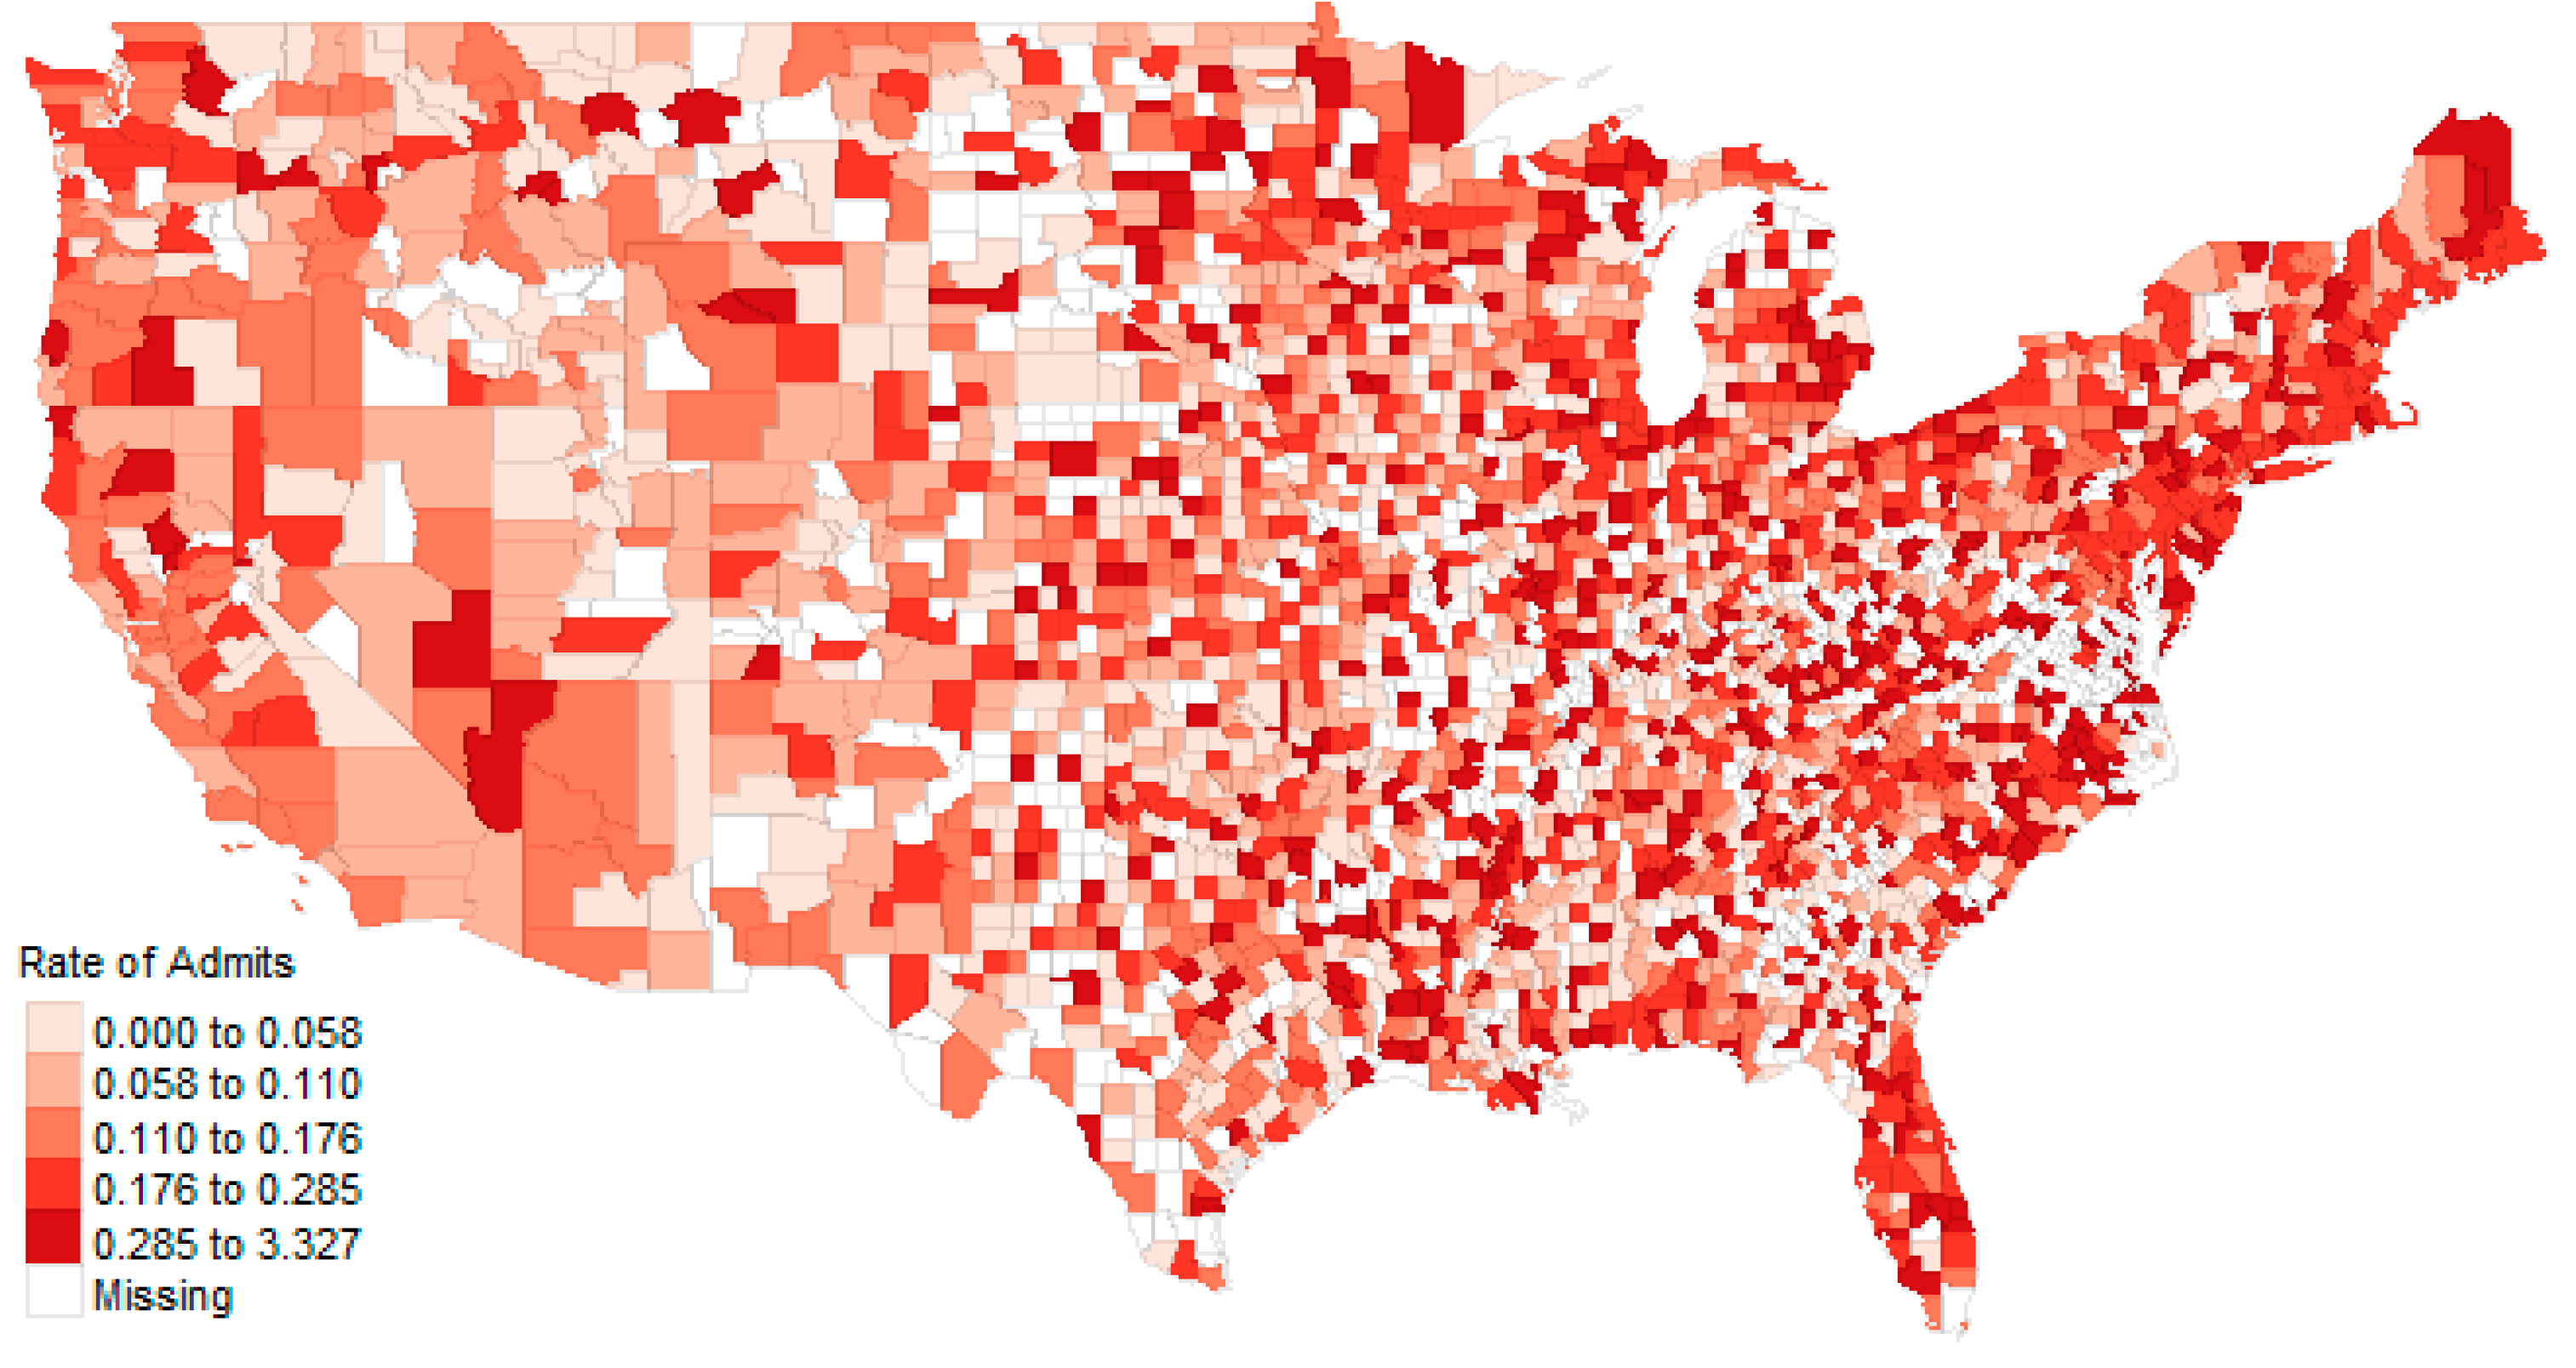
3.7.1. Maps
3.7.2. Regression Models, County-Level of Analysis
4. Discussion
4.1. Review of Findings
4.2. Limitations and Future Work
5. Conclusions
Author Contributions
Funding
Data Availability Statement
Conflicts of Interest
Appendix A
| List of Abbreviations | |
| ER | Emergency Room |
| CC | Complication of Comorbidity |
| CMS | Centers for Medicare and Medicaid |
| CON | Certificate of Need |
| DRG | Diagnostic-Related Group |
| ECMO | Extracorporeal Membrane Oxygenation |
| GIS | Geographical Information System |
| HF | Heart Failure |
| HFpEF | Heart Failure with preserved Ejection Fraction |
| HFrEF | Heart Failure with reduced Ejection Fraction |
| ICD | International Classification of Disease Version (-version) |
| MCC | Major Complication of Comorbidity |
Appendix B
| Variable | Linear | Lasso | Elastic Net | Variable | Linear | Lasso | Elastic Net | ||
|---|---|---|---|---|---|---|---|---|---|
| Workload | −0.439 | *** | −0.298 | −0.323 | State_MA | 0.010 | ** | 0.000 | 0.000 |
| Net Income | −0.043 | *** | 0.000 | 0.000 | State_MD | 0.013 | *** | 0.000 | 0.000 |
| Profit Margin | 0.026 | *** | 0.000 | 0.000 | State_ME | −0.002 | 0.000 | 0.000 | |
| Cash on Hand | −0.082 | * | 0.000 | 0.000 | State_MI | 0.013 | *** | 0.000 | 0.000 |
| Equity | 0.012 | *** | 0.000 | 0.000 | State_MN | 0.003 | 0.000 | 0.000 | |
| % Medicare | 0.029 | ** | 0.000 | 0.000 | State_MO | 0.005 | 0.000 | 0.000 | |
| % Medicaid | −0.002 | *** | 0.000 | 0.000 | State_MS | 0.003 | 0.000 | 0.000 | |
| Proprietary Ownership | 0.003 | 0.000 | 0.000 | State_MT | 0.004 | 0.000 | 0.000 | ||
| Non-profit Ownership | 0.006 | *** | 0.000 | 0.000 | State_NC | 0.016 | *** | 0.000 | 0.000 |
| Limited Med Sch Aff | 0.002 | *** | 0.000 | 0.000 | State_ND | 0.004 | 0.000 | 0.000 | |
| Major Med Sch Aff | −0.009 | 0.000 | 0.000 | State_NE | 0.001 | 0.000 | 0.000 | ||
| No Med Sch Aff | 0.000 | *** | 0.000 | 0.000 | State_NH | 0.002 | 0.000 | 0.000 | |
| Unknown Med Sch Aff | −0.005 | 0.000 | 0.000 | State_NJ | 0.012 | *** | 0.000 | 0.000 | |
| Critical Access Hospital | 0.074 | 0.000 | 0.000 | State_NM | −0.002 | 0.000 | 0.000 | ||
| DoD Hospital | 0.000 | *** | 0.000 | 0.000 | State_NV | 0.007 | 0.000 | 0.000 | |
| LTAC Hospital | 0.048 | *** | 0.000 | 0.000 | State_NY | −0.005 | 0.000 | 0.000 | |
| Psych Hospital | 0.067 | *** | 0.000 | 0.000 | State_OH | 0.007 | * | 0.000 | 0.000 |
| Rehab Hospital | 0.058 | *** | 0.000 | 0.000 | State_OK | 0.001 | 0.000 | 0.000 | |
| STAC Hospital | 0.084 | *** | 0.000 | 0.006 | State_OR | −0.002 | 0.000 | 0.000 | |
| State_AL | 0.005 | 0.000 | 0.000 | State_PA | 0.002 | 0.000 | 0.000 | ||
| State_AR | 0.003 | 0.000 | 0.000 | State_RI | 0.002 | 0.000 | 0.000 | ||
| State_AZ | −0.002 | 0.000 | 0.000 | State_SC | 0.006 | 0.000 | 0.000 | ||
| State_CA | 0.000 | 0.000 | 0.000 | State_SD | −0.002 | 0.000 | 0.000 | ||
| State_CO | −0.003 | 0.000 | 0.000 | State_TN | 0.003 | 0.000 | 0.000 | ||
| State_CT | 0.013 | ** | 0.000 | 0.000 | State_TX | 0.004 | 0.000 | 0.000 | |
| State_DC | 0.006 | 0.000 | 0.000 | State_UT | −0.004 | 0.000 | 0.000 | ||
| State_DE | 0.018 | ** | 0.000 | 0.000 | State_VA | 0.014 | *** | 0.000 | 0.000 |
| State_FL | 0.006 | 0.000 | 0.000 | State_VT | −0.001 | 0.000 | 0.000 | ||
| State_GA | 0.009 | ** | 0.000 | 0.000 | State_WA | 0.005 | 0.000 | 0.000 | |
| State_HI | −0.003 | 0.000 | 0.000 | State_WI | 0.003 | 0.000 | 0.000 | ||
| State_IA | 0.001 | 0.000 | 0.000 | State_WV | 0.002 | 0.000 | 0.000 | ||
| State_ID | 0.000 | 0.000 | 0.000 | State_WY | 0.002 | 0.000 | 0.000 | ||
| State_IL | 0.009 | ** | 0.000 | 0.000 | Urban | 0.004 | *** | 0.000 | 0.000 |
| State_IN | 0.006 | 0.000 | 0.000 | Year 2017 | 0.003 | *** | 0.000 | 0.000 | |
| State_KS | 0.002 | 0.000 | 0.000 | Year 2018 | 0.004 | *** | 0.000 | 0.000 | |
| State_KY | 0.005 | 0.000 | 0.000 | DRG 292 | −0.040 | *** | 0.000 | −0.016 | |
| State_LA | 0.006 | 0.000 | 0.000 | DRG 293 | −0.056 | *** | −0.013 | −0.029 |
References
- Savarese, G.; Lund, L.H. Global Public Health Burden of Heart Failure. Card. Fail. Rev. 2017, 3, 7–11. [Google Scholar] [CrossRef]
- CDC.gov. Heart Failure. Available online: https://www.cdc.gov/heartdisease/heart_failure.htm?CDC_AA_refVal=https%3A%2F%2Fwww.cdc.gov%2Fdhdsp%2Fdata_statistics%2Ffact_sheets%2Ffs_heart_failure.htm (accessed on 26 May 2020).
- Urbich, M.; Globe, G.; Pantiri, K.; Heisen, M.; Bennison, C.; Wirtz, H.S.; Di Tanna, G.L. A Systematic Review of Medical Costs Associated with Heart Failure in the USA (2014–2020). PharmacoEconomics 2020, 38, 1219–1236. [Google Scholar] [CrossRef] [PubMed]
- Levy, D.; Kenchaiah, S.; Larson, M.G.; Benjamin, E.J.; Kupka, M.J.; Ho, K.K.; Murabito, J.M.; Vasan, R.S. Long-Term Trends in the Incidence of and Survival with Heart Failure. N. Engl. J. Med. 2002, 347, 1397–1402. [Google Scholar] [CrossRef] [PubMed]
- Sanchis-Gomar, F.; Perez-Quilis, C.; Leischik, R.; Lucia, A. Epidemiology of coronary heart disease and acute coronary syndrome. Ann. Transl. Med. 2016, 4, 256. [Google Scholar] [CrossRef]
- McKee, P.A.; Castelli, W.P.; McNamara, P.M.; Kannel, W.B. The Natural History of Congestive Heart Failure: The Framingham Study. N. Engl. J. Med. 1971, 285, 1441–1446. [Google Scholar] [CrossRef]
- Remes, J.; Reunanen, A.; Aromaa, A.; Pyörälä, K. Incidence of heart failure in eastern Finland: A population-based surveillance study. Eur. Heart J. 1992, 13, 588–593. [Google Scholar] [CrossRef]
- Kenchaiah, S.; Narula, J.; Vasan, R.S. Risk factors for heart failure. Med. Clin. N. Am. 2004, 88, 1145–1172. [Google Scholar] [CrossRef]
- Gottdiener, J.S.; Arnold, A.M.; Aurigemma, G.P.; Polak, J.F.; Tracy, R.P.; Kitzman, D.W.; Gardin, J.M.; Rutledge, J.E.; Boineau, R.C. Predictors of congestive heart failure in the elderly: The cardiovascular health study. J. Am. Coll. Cardiol. 2000, 35, 1628–1637. [Google Scholar] [CrossRef]
- Lloyd-Jones, D.M.; Larson, M.G.; Leip, E.P.; Beiser, A.; D’Agostino, R.B.; Kannel, W.B.; Murabito, J.M.; Vasan, R.S.; Benjamin, E.J.; Levy, D. Lifetime risk for developing congestive heart failure: The Framingham Heart Study. Circulation 2002, 106, 3068–3072. [Google Scholar] [CrossRef]
- Bundkirchen, A.; Schwinger, R.H.G. Epidemiology and economic burden of chronic heart failure. Eur. Heart J. Suppl. 2004, 6, D57–D60. [Google Scholar] [CrossRef]
- Dalen, J.E.; Alpert, J.S.; Goldberg, R.J.; Weinstein, R.S. The Epidemic of the 20th Century: Coronary Heart Disease. Am. J. Med. 2014, 127, 807–812. [Google Scholar] [CrossRef] [PubMed]
- Fang, J.; Mensah, G.A.; Croft, J.B.; Keenan, N.L. Heart Failure-Related Hospitalization in the U.S., 1979 to 2004. J. Am. Coll. Cardiol. 2008, 52, 428–434. [Google Scholar] [CrossRef] [PubMed]
- Stewart, S.; MacIntyre, K.; Capewell, S.; McMurray, J.J. Heart failure and the aging population: An increasing burden in the 21st century? Heart 2003, 89, 49–53. [Google Scholar] [CrossRef] [PubMed]
- Cook, C.; Cole, G.; Asaria, P.; Jabbour, R.; Francis, D.P. The annual global economic burden of heart failure. Int. J. Cardiol. 2014, 171, 368–376. [Google Scholar] [CrossRef] [PubMed]
- Aamc.org. Number of People per Active Physician by Specialty. 2015. Available online: https://www.aamc.org/data-reports/workforce/interactive-data/number-people-active-physician-specialty-2015 (accessed on 26 May 2020).
- Heidenreich, P.A.; Trogdon, J.G.; Khavjou, O.A.; Butler, J.; Dracup, K.; Ezekowitz, M.D.; Finkelstein, E.A.; Hong, Y.; Johnston, S.C.; Khera, A.; et al. Forecasting the Future of Cardiovascular Disease in the United States. Circulation 2011, 123, 933–944. [Google Scholar] [CrossRef] [PubMed]
- Tsao, C.W.; Lyass, A.; Enserro, D.; Larson, M.G.; Ho, J.E.; Kizer, J.R.; Gottdiener, J.S.; Psaty, B.M.; Vasan, R.S. Temporal Trends in the Incidence of and Mortality Associated With Heart Failure With Preserved and Reduced Ejection Fraction. JACC Heart Fail. 2018, 6, 678–685. [Google Scholar] [CrossRef]
- Kan, H.J.; Kharrazi, H.; Chang, H.-Y.; Bodycombe, D.; Lemke, K.; Weiner, J.P. Exploring the use of machine learning for risk adjustment: A comparison of standard and penalized linear regression models in predicting health care costs in older adults. PLoS ONE 2019, 14, e0213258. [Google Scholar] [CrossRef]
- Rajalaxmi, A.S.A.; Rajalaxmi, R.R.; Abdullah, A.S. A Data mining Model for predicting the Coronary Heart Disease using Random Forest Classifier. In Proceedings of the International Conference in Recent Trends in Computational Methods, Communication and Controls, Online Meeting, 1–5 April 2012; IJCA: New York, NY, USA; pp. 22–25.
- Cutler, A.; Cutler, D.R.; Stevens, J.R. Random Forests. In Ensemble Machine Learning: Methods and Applications; Zhang, C., Ma, Y., Eds.; Springer: Boston, MA, USA, 2012; pp. 157–175. [Google Scholar]
- Sameer, S.; Singh, P.; Kumar, V.; Chauhan, P. Review of Geospatial Technology for Infectious Disease Surveillance: Use Case on COVID-19. J. Indian Soc. Remote Sens. 2020, 48, 1121–1138. [Google Scholar] [CrossRef]
- Ahmad, R.; Ali, W.N.; Nor, Z.M.; Ismail, Z.; Azahari, A.H.; Ibrahim, M.N.; Lee, H.L. Mapping of mosquito breeding sites in malaria endemic areas in Pos Lenjang, Kuala Lipis, Pahang, Malaysia. Malar. J. 2011, 10, 361. [Google Scholar] [CrossRef]
- Hanafi-Bojd, A.; Vatandoost, H.; Oshaghi, M.; Charrahy, Z.; Haghdoost, A.; Zamani, G.; Abedi, F.; Sedaghat, M.; Soltani, M.; Shahi, M.; et al. Spatial analysis and mapping of malaria risk in an endemic area, south of Iran: A GIS based decision making for planning of control. Acta Trop. 2012, 122, 132–137. [Google Scholar] [CrossRef]
- Kolivras, K.N. Mosquito Habitat and Dengue Risk Potential in Hawaii: A Conceptual Framework and GIS Application. Prof. Geogr. 2006, 58, 139–154. [Google Scholar] [CrossRef]
- Martin, C.; Curtis, B.; Fraser, C.; Sharp, B. The use of a GIS-based malaria information system for malaria research and control in South Africa. Health Place 2002, 8, 227–236. [Google Scholar] [CrossRef]
- Nykiforuk, C.I.J.; Flaman, L.M. Geographic Information Systems (GIS) for Health Promotion and Public Health: A Review. Health Promot. Pract. 2009, 12, 63–73. [Google Scholar] [CrossRef] [PubMed]
- Rasam, A.R.A.; Noor, A.M.M.; Ahmad, N.; Ghazali, R. MyGeoHealth: GIS-Based Cholera Transmission Risk System in Sabah, Malaysia. In Proceedings of the IEEE 7th International Colloquium on Signal Processing and Its Applications, Penang, Malaysia, 4–6 March 2011; pp. 474–479. [Google Scholar]
- Zhang, W.; Wang, L.; Fang, L.-Q.; Ma, J.; Xu, Y.; Jiang, J.; Hui, F.; Wang, J.; Liang, S.; Yang, H.; et al. Spatial analysis of malaria in Anhui province, China. Malar. J. 2008, 7, 206. [Google Scholar] [CrossRef]
- Zhang, Z.; Jin, J.-M.; Liu, F. The Application of Geographic Information System (GIS) in the Field of Public Health. In Proceedings of the 2010 Second IITA International Conference on Geoscience and Remote Sensing, Qingdao, China, 28–31 August 2010; pp. 442–445. [Google Scholar]
- Feinhandler, I.; Cilento, B.; Beauvais, B.; Harrop, J.; Fulton, L. Predictors of Death Rate during the COVID-19 Pandemic. Healthcare 2020, 8, 339. [Google Scholar] [CrossRef]
- Concannon, T.W.; Kent, D.M.; Normand, S.-L.; Newhouse, J.P.; Griffith, J.L.; Ruthazer, R.; Beshansky, J.R.; Wong, J.B.; Aversano, T.; Selker, H.P. A Geospatial Analysis of Emergency Transport and Inter-Hospital Transfer in ST-Segment Elevation Myocardial Infarction. Am. J. Cardiol. 2008, 101, 69–74. [Google Scholar] [CrossRef]
- Sun, W.; Gong, F.; Xu, J. Individual and contextual correlates of cardiovascular diseases among adults in the United States: A geospatial and multilevel analysis. GeoJournal 2020, 85, 1685–1700. [Google Scholar] [CrossRef]
- Bhunia, G.S.; Shit, P.K. Spatial Database for Public Health and Cartographic Visualization. In Geospatial Analysis of Public Health; Springer: Cham, Switzerland, 2019; pp. 29–57. [Google Scholar]
- Chakraborty, J. Revisiting Tobler’s First Law of Geography: Spatial Regression Models for Assessing Environmental Justice and Health Risk Disparities. In Geospatial Analysis of Environmental Health; Maantay, J.A., McLafferty, S., Eds.; Springer: Dordrecht, The Netherlands, 2011; pp. 337–356. [Google Scholar]
- Ramos, A.V.; Yamamura, M.; Arroyo, L.H.; Popolin, M.P.; Chiaravalloti, F.; Palha, P.F.; Uchôa, S.A.D.C.; Pieri, F.M.; Pinto, I.C.; Fiorati, R.C.; et al. Spatial clustering and local risk of leprosy in São Paulo, Brazil. PLoS Negl. Trop. Dis. 2017, 11, e0005381. [Google Scholar] [CrossRef]
- Brownwright, T.K.; Dodson, Z.M.; Van Panhuis, W.G. Spatial clustering of measles vaccination coverage among children in sub-Saharan Africa. BMC Public Health 2017, 17, 1–7. [Google Scholar] [CrossRef]
- Wende, M.E.; Stowe, E.W.; Eberth, J.M.; McLain, A.; Liese, A.D.; Breneman, C.B.; Josey, M.J.; Hughey, S.M.; Kaczynski, A.T. Spatial clustering patterns and regional variations for food and physical activity environments across the United States. Int. J. Environ. Health Res. 2020, 10, 1–15. [Google Scholar] [CrossRef] [PubMed]
- Ma, L.-G.; Chen, Q.-H.; Wang, Y.-Y.; Wang, J.; Ren, Z.-P.; Cao, Z.-F.; Cao, Y.-R.; Ma, X.; Wang, B. Spatial pattern and variations in the prevalence of congenital heart disease in children aged 4–18 years in the Qinghai-Tibetan Plateau. Sci. Total Environ. 2018, 627, 158–165. [Google Scholar] [CrossRef] [PubMed]
- MacQuillan, E.L.; Curtis, A.B.; Baker, K.M.; Paul, R.; Back, Y.O. Using GIS Mapping to Target Public Health Interventions: Examining Birth Outcomes Across GIS Techniques. J. Community Health 2017, 42, 633–638. [Google Scholar] [CrossRef] [PubMed]
- Fulton, L.; Dong, Z.S.; Zhan, F.B.; Kruse, C.S.; Granados, P.S. Geospatial-Temporal and Demand Models for Opioid Admissions, Implications for Policy. J. Clin. Med. 2019, 8, 993. [Google Scholar] [CrossRef] [PubMed]
- Fulton, L.; Kruse, C.S. Hospital-Based Back Surgery: Geospatial-Temporal, Explanatory, and Predictive Models. J. Med. Internet Res. 2019, 21, e14609. [Google Scholar] [CrossRef] [PubMed]
- DHC.com. Definitive Healthcare. Available online: https://www.definitivehc.com/ (accessed on 26 May 2020).
- Census.gov. Population Clock. Available online: https://www.census.gov/popclock/population_widget_200x402.php?component=density&no_scode#us (accessed on 26 May 2020).
- U.S. Census Bureau. County Population by Characteristics: 2010–2018; U.S. Census Bureau: Washington, DC, USA, 2020.
- CMS.gov. ICD-10-CM/PCS MS-DRG v37.0 Definitions Manual. Available online: https://www.cms.gov/icd10m/version37-fullcode-cms/fullcode_cms/P0140.html (accessed on 26 May 2020).
- Hastie, T.; Tibshirani, R.; Friedman, J. The Elements of Statistical Learning: Data Mining, Inference, and Prediction, 2nd ed.; Springer: New York, NY, USA, 2009. [Google Scholar]
- Zou, H.; Hastie, T. Regularization and variable selection via the elastic net. J. R. Stat. Soc. Ser. B Stat. Methodol. 2005, 67, 301–320. [Google Scholar] [CrossRef]
- Geurts, P.; Ernst, D.; Wehenkel, L. Extremely randomized trees. Mach. Learn. 2006, 63, 3–42. [Google Scholar] [CrossRef]
- Prettenhofer, P.; Louppe, G. Gradient Boosted Regression Trees in Scikit-Learn. In Proceedings of the PyData 2014, London, UK, 21–23 February 2014. [Google Scholar]
- Breiman, L. Bagging Predictors. Mach. Learn. 1996, 24, 123–140. [Google Scholar] [CrossRef]
- Buitinck, L.; Louppe, G.; Blondel, M.; Pedregosa, F.; Mueller, A.; Grisel, O.; Niculae, V.; Prettenhofer, P.; Gramfort, A.; Grobler, J.; et al. API design for machine learning software: Experiences from the scikit-learn project. In Proceedings of the European Conference on Machine Learning and Principles and Practices of Knowledge Discovery in Databases, Prague, Czech Republic, 23–27 September 2013. [Google Scholar]
- Mahara, G.; Wang, C.; Yang, K.; Chen, S.; Guo, J.; Gao, Q.; Wang, W.; Wang, Q.; Guo, X. The Association between Environmental Factors and Scarlet Fever Incidence in Beijing Region: Using GIS and Spatial Regression Models. Int. J. Environ. Res. Public Health 2016, 13, 1083. [Google Scholar] [CrossRef]
- Scott, D.W.; Christian, J.B. Finding Outliers in Models of Spatial Data. Available online: http://www.stat.rice.edu/~scottdw/DG/dgo03.pdf (accessed on 22 August 2020).
- Friedman, M. The Use of Ranks to Avoid the Assumption of Normality Implicit in the Analysis of Variance. J. Am. Stat. Assoc. 2006, 32, 675. [Google Scholar] [CrossRef]
- Python Core Team. Python: A Dynamic, Open Source Programming Language; Python Software Foundation: Wilmington, DE, USA, 2015. [Google Scholar]
- Tennekes, M. tmap: Thematic Maps in R. J. Stat. Softw. 2018, 84, 1–39. [Google Scholar] [CrossRef]
- Pebesma, E. Simple Features for R: Standardized Support for Spatial Vector Data. R J. 2018, 10, 439–446. [Google Scholar] [CrossRef]
- Bivand, R.S.; Pebesma, E.; Gómez-Rubio, V. Applied Spatial Data Analysis with R; Springer Science and Business Media LLC: Berlin, Germany, 2013; ISBN 978-1-4614-7617-7. [Google Scholar]
- Cheng, J.; Karambelkar, B.; Xie, Y. Leaflet: Create Interactive Web Maps with the JavaScript ’Leaflet’ Library. Available online: https://CRAN.R-project.org/package=leaflet (accessed on 1 October 2020).
- Fulton, L. Heart Failure Analysis. Available online: https://rpubs.com/R-Minator/heart (accessed on 26 December 2020).
- Bls.gov. Producer Price Index by Industry: General Medical and Surgical Hospitals (PCU622110622110). FRED. St. Louis Fed. Available online: https://fred.stlouisfed.org/series/PCU622110622110 (accessed on 30 May 2020).
- Ahip.org. National Comparisons of Commercial and Medicare Fee-for-Service Payments to Hospitals. American Health Insurance Programs Data Brief. Available online: https://www.ahip.org/wp-content/uploads/2016/02/HospitalPriceComparison_2.10.16.pdf (accessed on 30 May 2020).
- Fulton, L. Heart Failure Analysis, State Analysis. Available online: https://rpubs.com/R-Minator/HeartState (accessed on 26 December 2020).
- CDC. Adult Obesity Prevalence Maps. Overweight & Obesity. CDC. Available online: https://www.cdc.gov/obesity/data/prevalence-maps.html (accessed on 30 May 2020).
- Moran, P.A.P. Notes on Continuous Stochastic Phenomena. Biometrika 2006, 37, 17. [Google Scholar] [CrossRef]
- Fulton, L. Heart Failure Analysis, County Analysis. Available online: https://rpubs.com/R-Minator/HeartCounty (accessed on 26 December 2020).
- Liu, L.; Yin, X.; Chen, M.; Jia, H.; Eisen, H.J.; Hofman, A. Geographic Variation in Heart Failure Mortality and Its Association With Hypertension, Diabetes, and Behavioral-Related Risk Factors in 1723 Counties of the United States. Front. Public Health 2018, 6, 132. [Google Scholar] [CrossRef] [PubMed]
- Reyes, E.B.; Ha, J.-W.; Firdaus, I.; Ghazi, A.M.; Phrommintikul, A.; Sim, D.; Vu, Q.N.; Siu, C.W.; Yin, W.-H.; Cowie, M. Heart failure across Asia: Same healthcare burden but differences in organization of care. Int. J. Cardiol. 2016, 223, 163–167. [Google Scholar] [CrossRef] [PubMed]
- Dewan, P.; Rørth, R.; Jhund, P.S.; Ferreira, J.P.; Zannad, F.; Shen, L.; Køber, L.; Abraham, W.T.; Desai, A.S.; Dickstein, K. Income inequality and outcomes in heart failure: A global between-country analysis. JACC Heart Fail. 2019, 7, 336–346. [Google Scholar] [CrossRef] [PubMed]
- Lisa Roat, R.C.C. Understanding the Impact of ICD-10 on DRGs—ICD10monitor. Available online: https://www.icd10monitor.com/understanding-the-impact-of-icd-10-on-drgs (accessed on 30 May 2020).
- Pinson, R. The ABCs of DRGs. Available online: https://acphospitalist.org/archives/2019/05/coding-corner-the-abcs-of-drgs.htm (accessed on 30 May 2020).
- Fitch, K.; Pelizarri, P.; Pyenson, B. The High Cost of Heart Failure for the Medicare Population: An Actuarial Cost Analysis. Available online: https://us.milliman.com/en/insight/the-high-cost-of-heart-failure-for-the-medicare-population-an-actuarial-cost-analysis (accessed on 30 May 2020).
- Ahrq.gov. National Inpatient Hospital Costs: The Most Expensive Conditions by Payer, 2013 #204. Available online: https://www.hcup-us.ahrq.gov/reports/statbriefs/sb204-Most-Expensive-Hospital-Conditions.jsp (accessed on 30 May 2020).
- Kilgore, M.L.; Patel, H.K.; Kielhorn, A.; Maya, J.F.; Sharma, P. Economic burden of hospitalizations of Medicare beneficiaries with heart failure. Risk Manag. Health Policy 2017, 10, 63–70. [Google Scholar] [CrossRef]
- Kuehn, B. Obesity Rates Increasing. JAMA 2018, 320, 1632. [Google Scholar] [CrossRef]
- MEDPAC.gov. Medicare Payment Advisory Commission. Report to the Congress: Medicare and the Health Care. Delivery System. Available online: http://www.medpac.gov/docs/default-source/reports/chapter-2-the-next-generation-of-medicare-beneficiaries-june-2015-report-.pdf (accessed on 19 December 2019).
- Maio, S.; Baldacci, S.; Carrozzi, L.; Pistelli, F.; Angino, A.; Simoni, M.; Sarno, G.; Cerrai, S.; Martini, F.; Fresta, M.; et al. Respiratory symptoms/diseases prevalence is still increasing: A 25-yr population study. Respir. Med. 2016, 110, 58–65. [Google Scholar] [CrossRef]
- Guilford-Blake, R. Clinician Shortage Ahead? Cardiology’s Workforce Prepares for a Pair of Silver Tsunamis. Available online: https://www.cardiovascularbusiness.com/clinician-shortage-ahead-cardiologys-workforce-prepares-pair-silver-tsunamis (accessed on 30 May 2020).
- Sauer, J. Cardiology Workforce Analysis. Available online: https://www.medaxiom.com/clientuploads/documents/Workforce_Analysis.pdf (accessed on 30 May 2020).
- Recker, S. ECMO Programs: A Financial Synopsis. CathLab Dig. 2019, 27, 1. [Google Scholar]
- Sts.org. Changes to ECMO MS-DRG Assignment Impacts Hospital Payment. STS. Available online: https://www.sts.org/advocacy/changes-ecmo-ms-drg-assignment-impacts-hospital-payment (accessed on 30 May 2020).
- Rose, R.; Combs, P.; Piech, R.; Labuhn, C.; Jeevanandam, V.; Song, T. The CMS Changes to a US ECMO Reimbursement: The Financial Impact upon ECMO Programs. J. Heart Lung Transplant. 2019, 38, S261. [Google Scholar] [CrossRef]
- Sobal, L. Has Employment of Cardiologists Been a Successful Strategy?—Part 1—American College of Cardiology. Available online: http://www.acc.org/membership/sections-and-councils/cardiovascular-management-section/section-updates/2019/11/06/09/49/has-employment-of-cardiologists-been-a-successful-strategy-part-1 (accessed on 30 May 2020).
- Consolidation and Hybridization in the Health Care Enterprise: How are Cardiologists Affected? Available online: https://www.healio.com/news/cardiology/20180328/consolidation-and-hybridization-in-the-health-care-enterprise-how-are-cardiologists-affected (accessed on 26 December 2020).
- Dafny, L.S. How Do Hospitals Respond to Price Changes? Am. Econ. Rev. 2005, 95, 1525–1547. [Google Scholar] [CrossRef] [PubMed]
- Moore, B.J.; McDermott, K.W.; Elixhauser, A. ICD-10-CM Diagnosis Coding in HCUP Data: Comparisons with ICD-9-CM and Precautions for Trend Analyses. Available online: https://www.hcup-us.ahrq.gov/datainnovations/ICD-10_DXCCS_Trends112817.pdf (accessed on 30 May 2020).
- Ho, V.; Ku-Goto, M.; Jollis, J.G. Certificate of Need (CON) for Cardiac Care: Controversy over the Contributions of CON. Health Serv. Res. 2008, 44, 483–500. [Google Scholar] [CrossRef] [PubMed]
- Do Certificate-of-Need Laws Still Make Sense in 2019? Available online: https://www.managedhealthcareexecutive.com/view/do-certificate-need-laws-still-make-sense-2019 (accessed on 26 December 2020).






| Technical Variables | Defined | Measurement |
| % Medicare | Percent of patients reimbursing via Medicare | Ratio |
| % Medicaid | Percent of patients reimbursing via Medicaid | Ratio |
| Diagnostic-Related Groups | DRG 291, DRG 292, DRG 293 | Categorical |
| Ownership | Hospital Ownership | Categorical |
| Medical School Affiliation | None, Limited, Major, Graduate Affiliation | Categorical |
| Hospital Type | Children, Critical Access, Long-Term, Psychiatric, Rehab, Short-Term | Categorical |
| Workload Variables | Defined | Measurement |
| Discharges | Number of patients discharged from admission | Integer |
| ER Visits | Number of emergency room visits | Integer |
| Affiliated Physicians | Number of physicians affiliated with hospital | Integer |
| Employees | Number of direct employees of hospital | Integer |
| Staffed Beds | Number of staffed beds operated by hospital | Integer |
| Surgeries | Number of surgeries performed | Integer |
| Financial Variables | Defined | Measurement |
| Net Income | Net revenues minus loss | Ratio |
| Operating Profit Margin | Profit divided by revenue | Ratio |
| Cash on Hand | Cash available to the organization | Ratio |
| Equity | Assets minus liabilities | Ratio |
| Geospatial Variables (and Time Window) | Defined | Measurement |
| State | Indicator variables for hospital’s state | Dichotomous |
| County | Indicator variables for county in states | Dichotomous |
| Urban/Rural | Indicator variable for metropolitan status | Dichotomous |
| Year | Indicator variables for year of observation (2016 through 2018) | Dichotomous |
| n = 40,257 | Mean | SD | Median | Min | Max |
|---|---|---|---|---|---|
| Number DRGs | 1640.258 | 3334.942 | 385 | 11 | 57,461 |
| Staffed Beds | 146.507 | 172.468 | 86 | 2 | 2753 |
| Affiliated Physicians | 231.786 | 353.461 | 104 | 1 | 4328 |
| Employees | 1008.034 | 1683.991 | 436 | 4 | 26,491 |
| Percent Medicare | 0.448 | 0.186 | 0.422 | 0 | 0.983 |
| Percent Medicaid | 0.087 | 0.091 | 0.063 | 0 | 0.869 |
| Discharges | 7014.259 | 9908.036 | 2811 | 1 | 129,339 |
| ER Visits | 32,864.497 | 33,976.188 | 25,085 | 0 | 543,457 |
| Surgeries | 6349.317 | 7987.273 | 4464 | 0 | 130,741 |
| Net Income ($ in M) | $17.23 | $117.65 | $2.04 | −$1.21 | $33.01 |
| Cash on Hand ($ in M) | $20.28 | $120.24 | $1.99 | −$2.51 | $3.88 |
| Profit Margin | −0.03 | 1.25 | −0.02 | −15.45 | 62.07 |
| Equity ($ in M) | $174.11 | $625.76 | $33.94 | −$3.25 | $10.24 |
| DRG | 2016 | 2017 | 2018 |
|---|---|---|---|
| DRG 291 | $12,780 | $13,155 | $13,243 |
| DRG 292 | $8934 | $9245 | $9257 |
| DRG 293 | $5788 | $5891 | $5998 |
| DRG | 2016 | 2017 | 2018 |
|---|---|---|---|
| DRG 291 | $12,058 | $12,273 | $12,582 |
| DRG 292 | $8267 | $8414 | $8626 |
| DRG 293 | $5693 | $5795 | $5491 |
| Variable | Linear Model | Queen Model | Rook Model | |||
|---|---|---|---|---|---|---|
| Rho | 0.993 | *** | 0.993 | *** | ||
| (Intercept) | −0.221 | −0.101 | −0.123 | |||
| Income | −0.055 | 0.011 | 0.01 | |||
| Profit Margin | −0.418 | −0.458 | ** | −0.458 | ** | |
| Cash on Hand | −0.162 | 0.015 | 0.023 | |||
| Equity | 0.183 | 0.060 | 0.049 | |||
| % Medicare | 0.842 | *** | 0.221 | 0.24 | ||
| % Medicaid | −0.163 | 0.058 | 0.061 | |||
| % Non-Profit | 0.129 | −0.128 | −0.122 | |||
| % Med School | 0.386 | 0.398 | *** | 0.408 | *** | |
| % STAC | 0.483 | ** | −0.016 | −0.015 | ||
| Workload | −0.004 | −0.162 | −0.152 |
| Variable | Linear Model | Queen Model | Rook Model | |||
|---|---|---|---|---|---|---|
| Rho | −0.539 | *** | −0.538 | *** | ||
| (Intercept) | 0.019 | 0.048 | *** | 0.047 | *** | |
| Income | 0.010 | 0.015 | 0.015 | |||
| Profit Margin | −0.007 | * | −0.002 | −0.002 | ||
| Cash on Hand | −0.063 | * | −0.058 | *** | −0.057 | *** |
| Equity | 0.090 | * | 0.081 | *** | 0.081 | *** |
| % Medicare | 0.049 | ** | 0.050 | *** | 0.050 | *** |
| % Medicaid | 0.012 | * | −0.001 | −0.001 | ||
| % Non-Profit | 0.013 | ** | 0.016 | *** | 0.016 | *** |
| Mean Affiliated Providers | 0.045 | ** | 0.044 | *** | 0.044 | *** |
| % STAC | 0.041 | ** | 0.044 | *** | 0.044 | *** |
| Workload | 0.084 | * | 0.079 | *** | 0.079 | *** |
Publisher’s Note: MDPI stays neutral with regard to jurisdictional claims in published maps and institutional affiliations. |
© 2020 by the authors. Licensee MDPI, Basel, Switzerland. This article is an open access article distributed under the terms and conditions of the Creative Commons Attribution (CC BY) license (http://creativecommons.org/licenses/by/4.0/).
Share and Cite
Kruse, C.S.; Beauvais, B.M.; Brooks, M.S.; Mileski, M.; Fulton, L.V. Models for Heart Failure Admissions and Admission Rates, 2016 through 2018. Healthcare 2021, 9, 22. https://doi.org/10.3390/healthcare9010022
Kruse CS, Beauvais BM, Brooks MS, Mileski M, Fulton LV. Models for Heart Failure Admissions and Admission Rates, 2016 through 2018. Healthcare. 2021; 9(1):22. https://doi.org/10.3390/healthcare9010022
Chicago/Turabian StyleKruse, Clemens Scott, Bradley M. Beauvais, Matthew S. Brooks, Michael Mileski, and Lawrence V. Fulton. 2021. "Models for Heart Failure Admissions and Admission Rates, 2016 through 2018" Healthcare 9, no. 1: 22. https://doi.org/10.3390/healthcare9010022
APA StyleKruse, C. S., Beauvais, B. M., Brooks, M. S., Mileski, M., & Fulton, L. V. (2021). Models for Heart Failure Admissions and Admission Rates, 2016 through 2018. Healthcare, 9(1), 22. https://doi.org/10.3390/healthcare9010022


