Low Vision Profile in Jordan: A Vision Rehabilitation Center-Based Study


Abstract
1. Introduction
2. Materials and Methods
3. Results
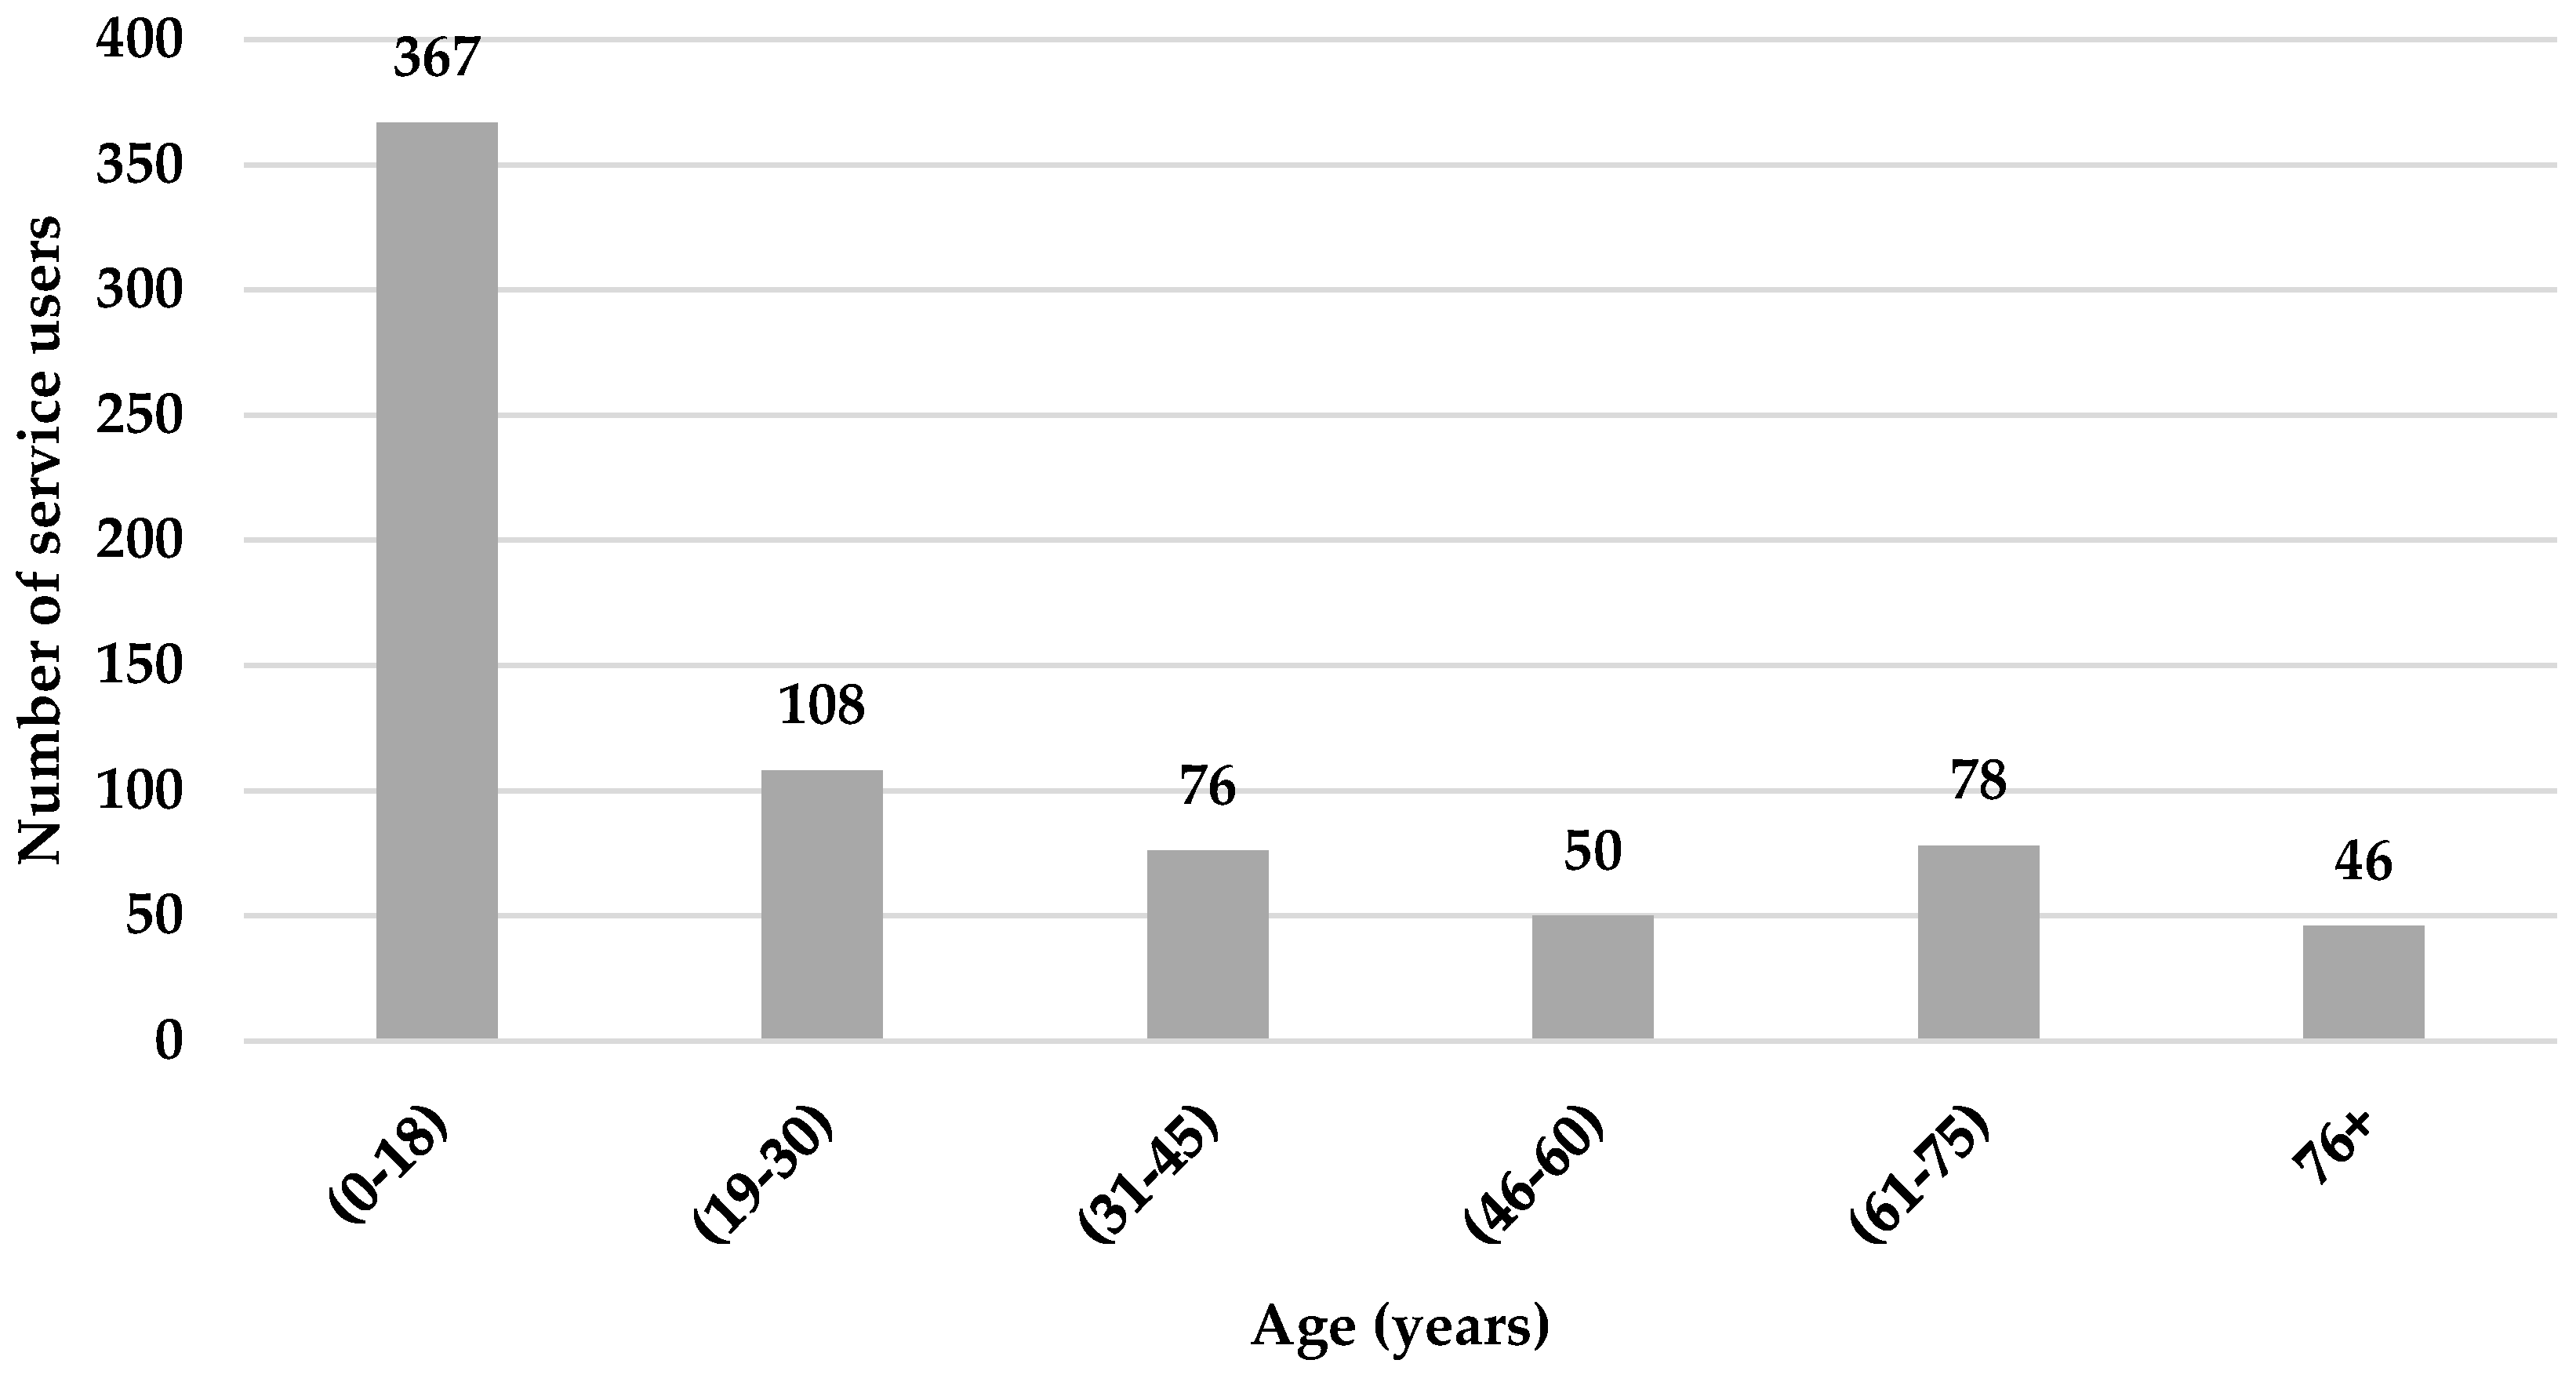
3.1. Age and Gender
3.2. Referral and Geographical Distribution
3.3. Main and Secondary Functional Problems
3.4. Ocular Pathology
4. Discussion
5. Conclusions
Author Contributions
Funding
Institutional Review Board Statement
Informed Consent Statement
Data Availability Statement
Conflicts of Interest
References
- World Health Organization. Global Data on Visual Impairments; WHO: Geneva, Switzerland, 2010; Available online: https://www.who.int/blindness/GLOBALDATAFINALforweb.pdf (accessed on 15 May 2020).
- World Health Organization. World Report on Vision; WHO: Geneva, Switzerland, 2019. [Google Scholar]
- Verma, K.M.; Tondon, M. Evaluation of low vision and its rehabilitation in various disorders. Indian J. Clin. Exp. Ophthalmol. 2015, 1, 218. [Google Scholar] [CrossRef]
- Haymes, S.A.; Johnston, A.W.; Heyes, A.D. Relationship between vision impairment and ability to perform activities of daily living. Ophthalmic Physiol. Opt. 2002, 22, 79–91. [Google Scholar] [CrossRef] [PubMed]
- Stelmack, J. Quality of Life of Low-Vision Patients and Outcomes of Low-Vision Rehabilitation. Optom. Vis. Sci. 2001, 78, 335–342. [Google Scholar] [CrossRef] [PubMed]
- Draper, E.M.; Feng, R.; Appel, S.D.; Graboyes, M.; Engle, E.; Ciner, E.B.; Ellenberg, J.H.; Stambolian, D. Low Vision Rehabilitation for Adult African Americans in Two Settings. Optom. Vis. Sci. 2016, 93, 673–682. [Google Scholar] [CrossRef] [PubMed]
- Rainey, L.; Nispen, R.V.; Rens, G.V. Evaluating rehabilitation goals of visually impaired children in multidisciplinary care according to ICF-CY guidelines. Acta Ophthalmol. 2013, 92, 689–696. [Google Scholar] [CrossRef] [PubMed]
- Chiang, P.P.-C. The Global Mapping of Low Vision Services. Ph.D. Thesis, The University of Melbourne, Melbourne, Australia, 2009. [Google Scholar]
- O’connor, P.M.; Mu, L.C.; Keeffe, J.E. Access and utilization of a new low-vision rehabilitation service. Clin. Exp. Ophthalmol. 2008, 36, 547–552. [Google Scholar] [CrossRef]
- Chiang, P.P.-C.; O’Connor, P.M.; Mesurier, R.T.L.; Keeffe, J.E. A Global Survey of Low Vision Service Provision. Ophthalmic Epidemiol. 2011, 18, 109–121. [Google Scholar] [CrossRef]
- Boonstra, N.; Limburg, H.; Tijmes, N.; Genderen, M.V.; Schuil, J.; Nispen, R.V. Changes in causes of low vision between 1988 and 2009 in a Dutch population of children. Acta Ophthalmol. 2011, 90, 277–286. [Google Scholar] [CrossRef]
- Gold, D.; Zuvela, B.; Hodge, W.G. Perspectives on low vision service in Canada: A pilot study. Can. J. Ophthalmol. 2006, 41, 348–354. [Google Scholar] [CrossRef]
- Gothwal, V. Characteristics of a paediatric low vision population in a private eye hospital in India. Ophthalmic Physiol. Opt. 2000, 20, 212–219. [Google Scholar] [CrossRef]
- Shaaban, S.; El-Lakkany, A.; Swelam, A.; Anwar, G. Low vision Aids provision for visually impaired Egyptian patients-a clinical outcome. Middle East Afr. J. Ophthalmol. 2009, 16, 29. [Google Scholar] [CrossRef] [PubMed]
- Singh, S.S. Bridging the Gap between Medical Low Vision and Visual Rehabilitation Services in Developing Nations. Delhi J. Ophthalmol. 2017, 27, 287–289. [Google Scholar] [CrossRef]
- Dickinson, C.; Linck, P.; Tudor-Edwards, R.; Binns, A.; Bunce, C.; Harper, R.; Jackson, J.; Lindsay, J.; Suttie, A.; Wolffsohn, J.; et al. A profile of low vision services in England: The Low Vision Service Model Evaluation (LOVSME) project. Eye 2011, 25, 829–831. [Google Scholar] [CrossRef] [PubMed][Green Version]
- Lam, N.; Leat, S.J.; Leung, A. Low-vision Service Provision by Optometrists. Optom. Vis. Sci. 2015, 92, 365–374. [Google Scholar] [CrossRef]
- Wang, B.Z.; Pesudovs, K.; Keane, M.C.; Daly, A.; Chen, C.S. Evaluating the Effectiveness of Multidisciplinary Low-Vision Rehabilitation. Optom. Vis. Sci. 2012, 89, 1399–1408. [Google Scholar] [CrossRef]
- Leat, S.J. A Proposed Model for Integrated Low-Vision Rehabilitation Services in Canada. Optom. Vis. Sci. 2016, 93, 77–84. [Google Scholar] [CrossRef]
- Lozano, R.; Fullman, N.; Mumford, J.E.; Knight, M.; Barthelemy, C.M.; Abbafati, C.; Abbastabar, H.; Abd-Allah, F.; Abdollahi, M.; Abedi, A.; et al. Measuring universal health coverage based on an index of effective coverage of health services in 204 countries and territories, 1990–2019: A systematic analysis for the Global Burden of Disease Study 2019. Lancet 2020, 396, 1250–1284. [Google Scholar] [CrossRef]
- Olusanya, B.; Onoja, G.; Ibraheem, W.; Bekibele, C. Profile of patients presenting at a low vision clinic in a developing country. BMC Ophthalmol. 2012, 12, 31. [Google Scholar] [CrossRef]
- Jordan Statistical Yearbook 2017. Department of Statistics Web Site. Available online: http://dosweb.dos.gov.jo/products/statistical_yearbook2017/ (accessed on 15 May 2020).
- Elliott, D.B.; Trukolo-Ilic, M.; Strong, J.G.; Pace, R.; Plotkin, A.; Bevers, P. Demographic characteristics of the vision-disabled elderly. Investig. Ophthalmol. Vis. Sci. 1997, 38, 2566–2575. [Google Scholar]
- Wolffsohn, J.S.; Cochrane, A.L. The Changing Face of the Visually Impaired: The Kooyong Low Vision Clinic’s Past, Present, and Future. Optom. Vis. Sci. 1999, 76, 747–754. [Google Scholar] [CrossRef]
- Kim, J.H.; Joo, K.S.; Moon, N.J. Characteristics of 681 Low Vision Patients in Korea. J. Korean Med. Sci. 2010, 25, 1217. [Google Scholar] [CrossRef] [PubMed]
- Mohidin, N.; Yusoff, S. Profile of a low vision clinic population. Clin. Exp. Optom. 1998, 81, 198–202. [Google Scholar] [CrossRef] [PubMed]
- Thakur, A.K.; Joshi, P.; Kandel, H.; Bhatta, S. Profile of low vision clinics in eastern region of Nepal. Br. J. Vis. Impair. 2011, 29, 215–226. [Google Scholar] [CrossRef]
- Gyawali, R.; Paudel, N.; Adhikari, P. Quality of life in Nepalese patients with low vision and the impact of low vision services. J. Optom. 2012, 5, 188–195. [Google Scholar] [CrossRef]
- Paudel, P.; Khadka, J.; Sharma, A. Profile of a low vision population. Int. Congr. Ser. 2005, 1282, 252–256. [Google Scholar] [CrossRef]
- Leat, S. The experience of a university based low vision clinic. Ophthalmic Physiol. Opt. 1990, 10, 98. [Google Scholar]
- Shuttleworth, G.N.; Dunlop, A.; Collins, J.K.; James, C.R. How effective is an integrated approach to low vision rehabilitation? Two year follow up results from south Devon. Br. J. Ophthalmol. 1995, 79, 719–723. [Google Scholar] [CrossRef][Green Version]
- Lindsay, J.; Bickerstaff, D.; Mcglade, A.; Toner, A.; Jackson, A.J. Low vision service delivery: An audit of newly developed outreach clinics in Northern Ireland*. Ophthalmic Physiol. Opt. 2004, 24, 360–368. [Google Scholar] [CrossRef]
- Hammoud, H.R. Illiteracy in the Arab World. Paper Commissioned for the EFA Global Monitoring Report 2006, Literacy for Life, UNESCO. 2005. Available online: https://unesdoc.unesco.org/ark:/48223/pf0000146282 (accessed on 22 May 2020).
- Fletcher, A.E. Low Uptake of Eye Services in Rural India. Arch. Ophthalmol. 1999, 117, 1393. [Google Scholar] [CrossRef]
- Snellingen, T.; Shrestha, B.R.; Gharti, M.P.; Shrestha, J.K.; Upadhyay, M.P.; Pokhrel, R.P. Socioeconomic barriers to cataract surgery in Nepal: The south Asian cataract management study. Br. J. Ophthalmol. 1998, 82, 1424–1428. [Google Scholar] [CrossRef]
- Keeffe, J.E.; Lovie-Kitchin, J.E.; Taylor, H.R. Referral to low vision services by ophthalmologists. Aust. N. Z. J. Ophthalmol. 1996, 24, 207–214. [Google Scholar] [CrossRef] [PubMed]
- Jamous, K.F.; Jalbert, I.; Kalloniatis, M.; Boon, M.Y. Australian optometric and ophthalmologic referral pathways for people with age-related macular degeneration, diabetic retinopathy and glaucoma. Clin. Exp. Optom. 2013, 97, 248–255. [Google Scholar] [CrossRef] [PubMed]
- Spafford, M.M.; Rudman, D.L.; Leipert, B.D.; Klinger, L.; Huot, S. When Self-Presentation Trumps Access: Why Older Adults with Low Vision Go Without Low-Vision Services. J. Appl. Gerontol. 2009, 29, 579–602. [Google Scholar] [CrossRef]
- Pollard, T.L.; Simpson, J.A.; Lamoureux, E.L.; Keeffe, J.E. Barriers to accessing low vision services. Ophthalmic Physiol. Opt. 2003, 23, 321–327. [Google Scholar] [CrossRef] [PubMed]
- Maclachlan, J.; Rudman, D.L.; Klinger, L. Low Vision: A Preliminary Exploration of Its Impact on the Daily Lives of Older Women and Perceived Constraints to Service Use. Phys. Occup. Ther. Geriatr. 2007, 26, 43–62. [Google Scholar] [CrossRef]
- Southall, K.; Wittich, W. Barriers to Low Vision Rehabilitation: A Qualitative Approach. J. Vis. Impair. Blind. 2012, 106, 261–274. [Google Scholar] [CrossRef]
- Overbury, O.; Wittich, W. Barriers to Low Vision Rehabilitation: The Montreal Barriers Study. Investig. Opthalmol. Vis. Sci. 2011, 52, 8933. [Google Scholar] [CrossRef]
- Adam, R.; Pickering, D. Where Are All the Clients? Barriers to Referral for Low Vision Rehabilitation. Vis. Impair. Res. 2007, 9, 45–50. [Google Scholar] [CrossRef]
- Mwilambwe, A.; Wittich, W.; Freeman, E.E. Disparities in awareness and use of low-vision rehabilitation. Can. J. Ophthalmol. 2009, 44, 686–691. [Google Scholar] [CrossRef]
- Gold, D.; Simson, H. Identifying the needs of people in Canada who are blind or visually impaired: Preliminary results of a nation-wide study. Int. Congr. Ser. 2005, 1282, 139–142. [Google Scholar] [CrossRef]
- Walter, C.; Althouse, R.; Humble, H.; Leys, M.; Odom, J. West Virginia survey of visual health: Low vision and barriers to access. Vis. Impair. Res. 2004, 6, 53–71. [Google Scholar] [CrossRef]
- Owsley, C. Characteristics of Low-Vision Rehabilitation Services in the United States. Arch. Ophthalmol. 2009, 127, 681. [Google Scholar] [CrossRef] [PubMed]
- Brown, J.C.; Goldstein, J.E.; Chan, T.L.; Massof, R.; Ramulu, P. Characterizing Functional Complaints in Patients Seeking Outpatient Low-Vision Services in the United States. Ophthalmology 2014, 121, 1655–1662. [Google Scholar] [CrossRef] [PubMed]
- Mousa, A.; El Byoumi, M.B. Visual Function of Egyptian Children with Low Vision and the Demographic Determinants. Middle East Afr. J. Ophthalmol. 2010, 17, 78–82. [Google Scholar]
- Baarah, B.; Shatnawi, R.; Khatatbeh, A. Causes of permanent severe visual impairment and blindness among Jordanian population. Middle East Afr. J. Ophthalmol. 2018, 25, 25. [Google Scholar] [CrossRef]
- Pardhan, S.; Mahomed, I. The clinical characteristics of Asian and Caucasian patients on Bradford’s Low Vision Register. Eye 2002, 16, 572–576. [Google Scholar] [CrossRef][Green Version]
- Wong, T.Y. Prevalence and Causes of Low Vision and Blindness in an Urban Malay Population. Arch. Ophthalmol. 2008, 126, 1091. [Google Scholar] [CrossRef]
- Bourne, R.R.A.; Jonas, J.B.; Flaxman, S.R.; Keeffe, J.; Leasher, J.; Naidoo, K.; Parodi, M.B.; Pesudovs, K.; Price, H.; White, R.A.; et al. Prevalence and causes of vision loss in high-income countries and in Eastern and Central Europe: 1990–2010. Br. J. Ophthalmol. 2014, 98, 629–638. [Google Scholar] [CrossRef]
- Keeffe, J.; Taylor, H.R.; Fotis, K.; Pesudovs, K.; Flaxman, S.R.; Jonas, J.B.; Leasher, J.; Naidoo, K.; Price, H.; White, R.A.; et al. Prevalence and causes of vision loss in Southeast Asia and Oceania: 1990–2010. Br. J. Ophthalmol. 2014, 98, 586–591. [Google Scholar] [CrossRef]
- Elder, M.J.; Cock, R.D. Childhood blindness in the West Bank and Gaza strip: Prevalence, aetiology and hereditary factors. Eye 1993, 7, 580–583. [Google Scholar] [CrossRef]
- Bamashmus, M.; Akily, S.A. Profile of childhood blindness and low vision in Yemen: A hospital-based study. East. Mediterr. Health J. 2010, 16, 425–428. [Google Scholar] [CrossRef] [PubMed]
- Shah, M.; Khan, M.; Khan, M.T.; Khan, M.Y.; Saeed, N. Causes of visual impairment in children with low vision. J. Coll. Phys. Surg. Pak. 2011, 21, 88–92. [Google Scholar]
- Waddell, K.M. Childhood blindness and low vision in Uganda. Eye 1998, 12, 184–192. [Google Scholar] [CrossRef] [PubMed]
- Khandekar, R.; Kishore, H.; Mansu, R.; Awan, H. The Status of Childhood Blindness and Functional Low Vision in the Eastern Mediterranean Region in 2012. Middle East Afr. J. Ophthalmol. 2014, 21, 336. [Google Scholar] [CrossRef]
- Durnian, J.M.; Cheeseman, R.; Kumar, A.; Raja, V.; Newman, W.; Chandna, A. Childhood sight impairment: A 10-year picture. Eye 2009, 24, 112–117. [Google Scholar] [CrossRef]
- Maida, J.M.; Mathers, K.; Alley, C.L. Pediatric ophthalmology in the developing world. Curr. Opin. Ophthalmol. 2008, 19, 403–408. [Google Scholar] [CrossRef]
- Gilbert, C.; Foster, A. Childhood blindness in the context of VISION 2020-the right to sight. Bull. World Health Organ. 2001, 79, 227–232. [Google Scholar]


| Region | No. | % |
|---|---|---|
| Amman (Capital) | 453 | 62.5 |
| North-eastern Jordan | 105 | 14.5 |
| North Jordan | 64 | 8.8 |
| North-western Jordan | 48 | 6.6 |
| South Jordan | 23 | 3.2 |
| From Other Countries | 22 | 3.0 |
| Syrian Refugee camps | 10 | 1.4 |
| Total | 725 | 100 |
| Ocular Pathology | Ages (Years) | Total | ||||||||
|---|---|---|---|---|---|---|---|---|---|---|
| ≤18 | >18 | |||||||||
| Males | Females | Males | Females | |||||||
| No. | % | No. | % | No. | % | No. | % | No. | % | |
| Retinal diseases | 85 | 43.4 | 83 | 48.5 | 136 | 63.6 | 83 | 57.6 | 387 | 53.4 |
| No medical diagnosis | 31 | 15.8 | 18 | 10.5 | 14 | 6.5 | 17 | 11.8 | 80 | 11 |
| Albinism | 25 | 12.8 | 21 | 12.3 | 12 | 5.5 | 6 | 4.2 | 64 | 8.8 |
| Optic nerve diseases | 12 | 6.1 | 12 | 7.0 | 15 | 7.0 | 13 | 9.0 | 52 | 7.2 |
| Other ocular diseases | 14 | 7.1 | 13 | 7.6 | 13 | 6.1 | 7 | 4.9 | 47 | 6.5 |
| Glaucoma | 13 | 6.6 | 10 | 5.8 | 12 | 5.6 | 12 | 8.3 | 47 | 6.5 |
| Cataract | 6 | 3.1 | 6 | 3.5 | 11 | 5.1 | 5 | 3.5 | 28 | 3.9 |
| Multiple disabilities associated with visual impairment | 10 | 5.1 | 8 | 4.6 | 1 | 0.5 | 1 | 0.7 | 20 | 2.8 |
| Total | 196 | 100 | 171 | 100 | 214 | 100 | 144 | 100 | 725 | 100 |
| p-value | 0.704 | 0.412 | ||||||||
| 0.509 | ||||||||||
| Types of Retinal Diseases | No. | % |
|---|---|---|
| Retinitis pigmentosa | 95 | 24.5 |
| Macular dystrophies | 48 | 12.4 |
| Retinal dystrophies | 48 | 12.4 |
| Age macular degeneration | 40 | 10.3 |
| Stargardt’s disease | 38 | 9.8 |
| Diabetic retinopathy | 36 | 9.3 |
| Rod-cone dystrophy | 31 | 8.0 |
| Retinal detachment | 24 | 6.2 |
| Retinopathy of prematurity | 20 | 5.2 |
| Achromatopsia | 7 | 1.8 |
| Total | 387 | 100 |
Publisher’s Note: MDPI stays neutral with regard to jurisdictional claims in published maps and institutional affiliations. |
© 2020 by the authors. Licensee MDPI, Basel, Switzerland. This article is an open access article distributed under the terms and conditions of the Creative Commons Attribution (CC BY) license (http://creativecommons.org/licenses/by/4.0/).
Share and Cite
Qutishat, Y.; Shublaq, S.; Masoud, M.; Alnuman, N. Low Vision Profile in Jordan: A Vision Rehabilitation Center-Based Study. Healthcare 2021, 9, 20. https://doi.org/10.3390/healthcare9010020
Qutishat Y, Shublaq S, Masoud M, Alnuman N. Low Vision Profile in Jordan: A Vision Rehabilitation Center-Based Study. Healthcare. 2021; 9(1):20. https://doi.org/10.3390/healthcare9010020
Chicago/Turabian StyleQutishat, Yuser, Sami Shublaq, Maisaa Masoud, and Nasim Alnuman. 2021. "Low Vision Profile in Jordan: A Vision Rehabilitation Center-Based Study" Healthcare 9, no. 1: 20. https://doi.org/10.3390/healthcare9010020
APA StyleQutishat, Y., Shublaq, S., Masoud, M., & Alnuman, N. (2021). Low Vision Profile in Jordan: A Vision Rehabilitation Center-Based Study. Healthcare, 9(1), 20. https://doi.org/10.3390/healthcare9010020