Who Has an Unsuccessful Observation Care Stay?

Abstract
:1. Introduction
2. Methods
2.1. Study Design
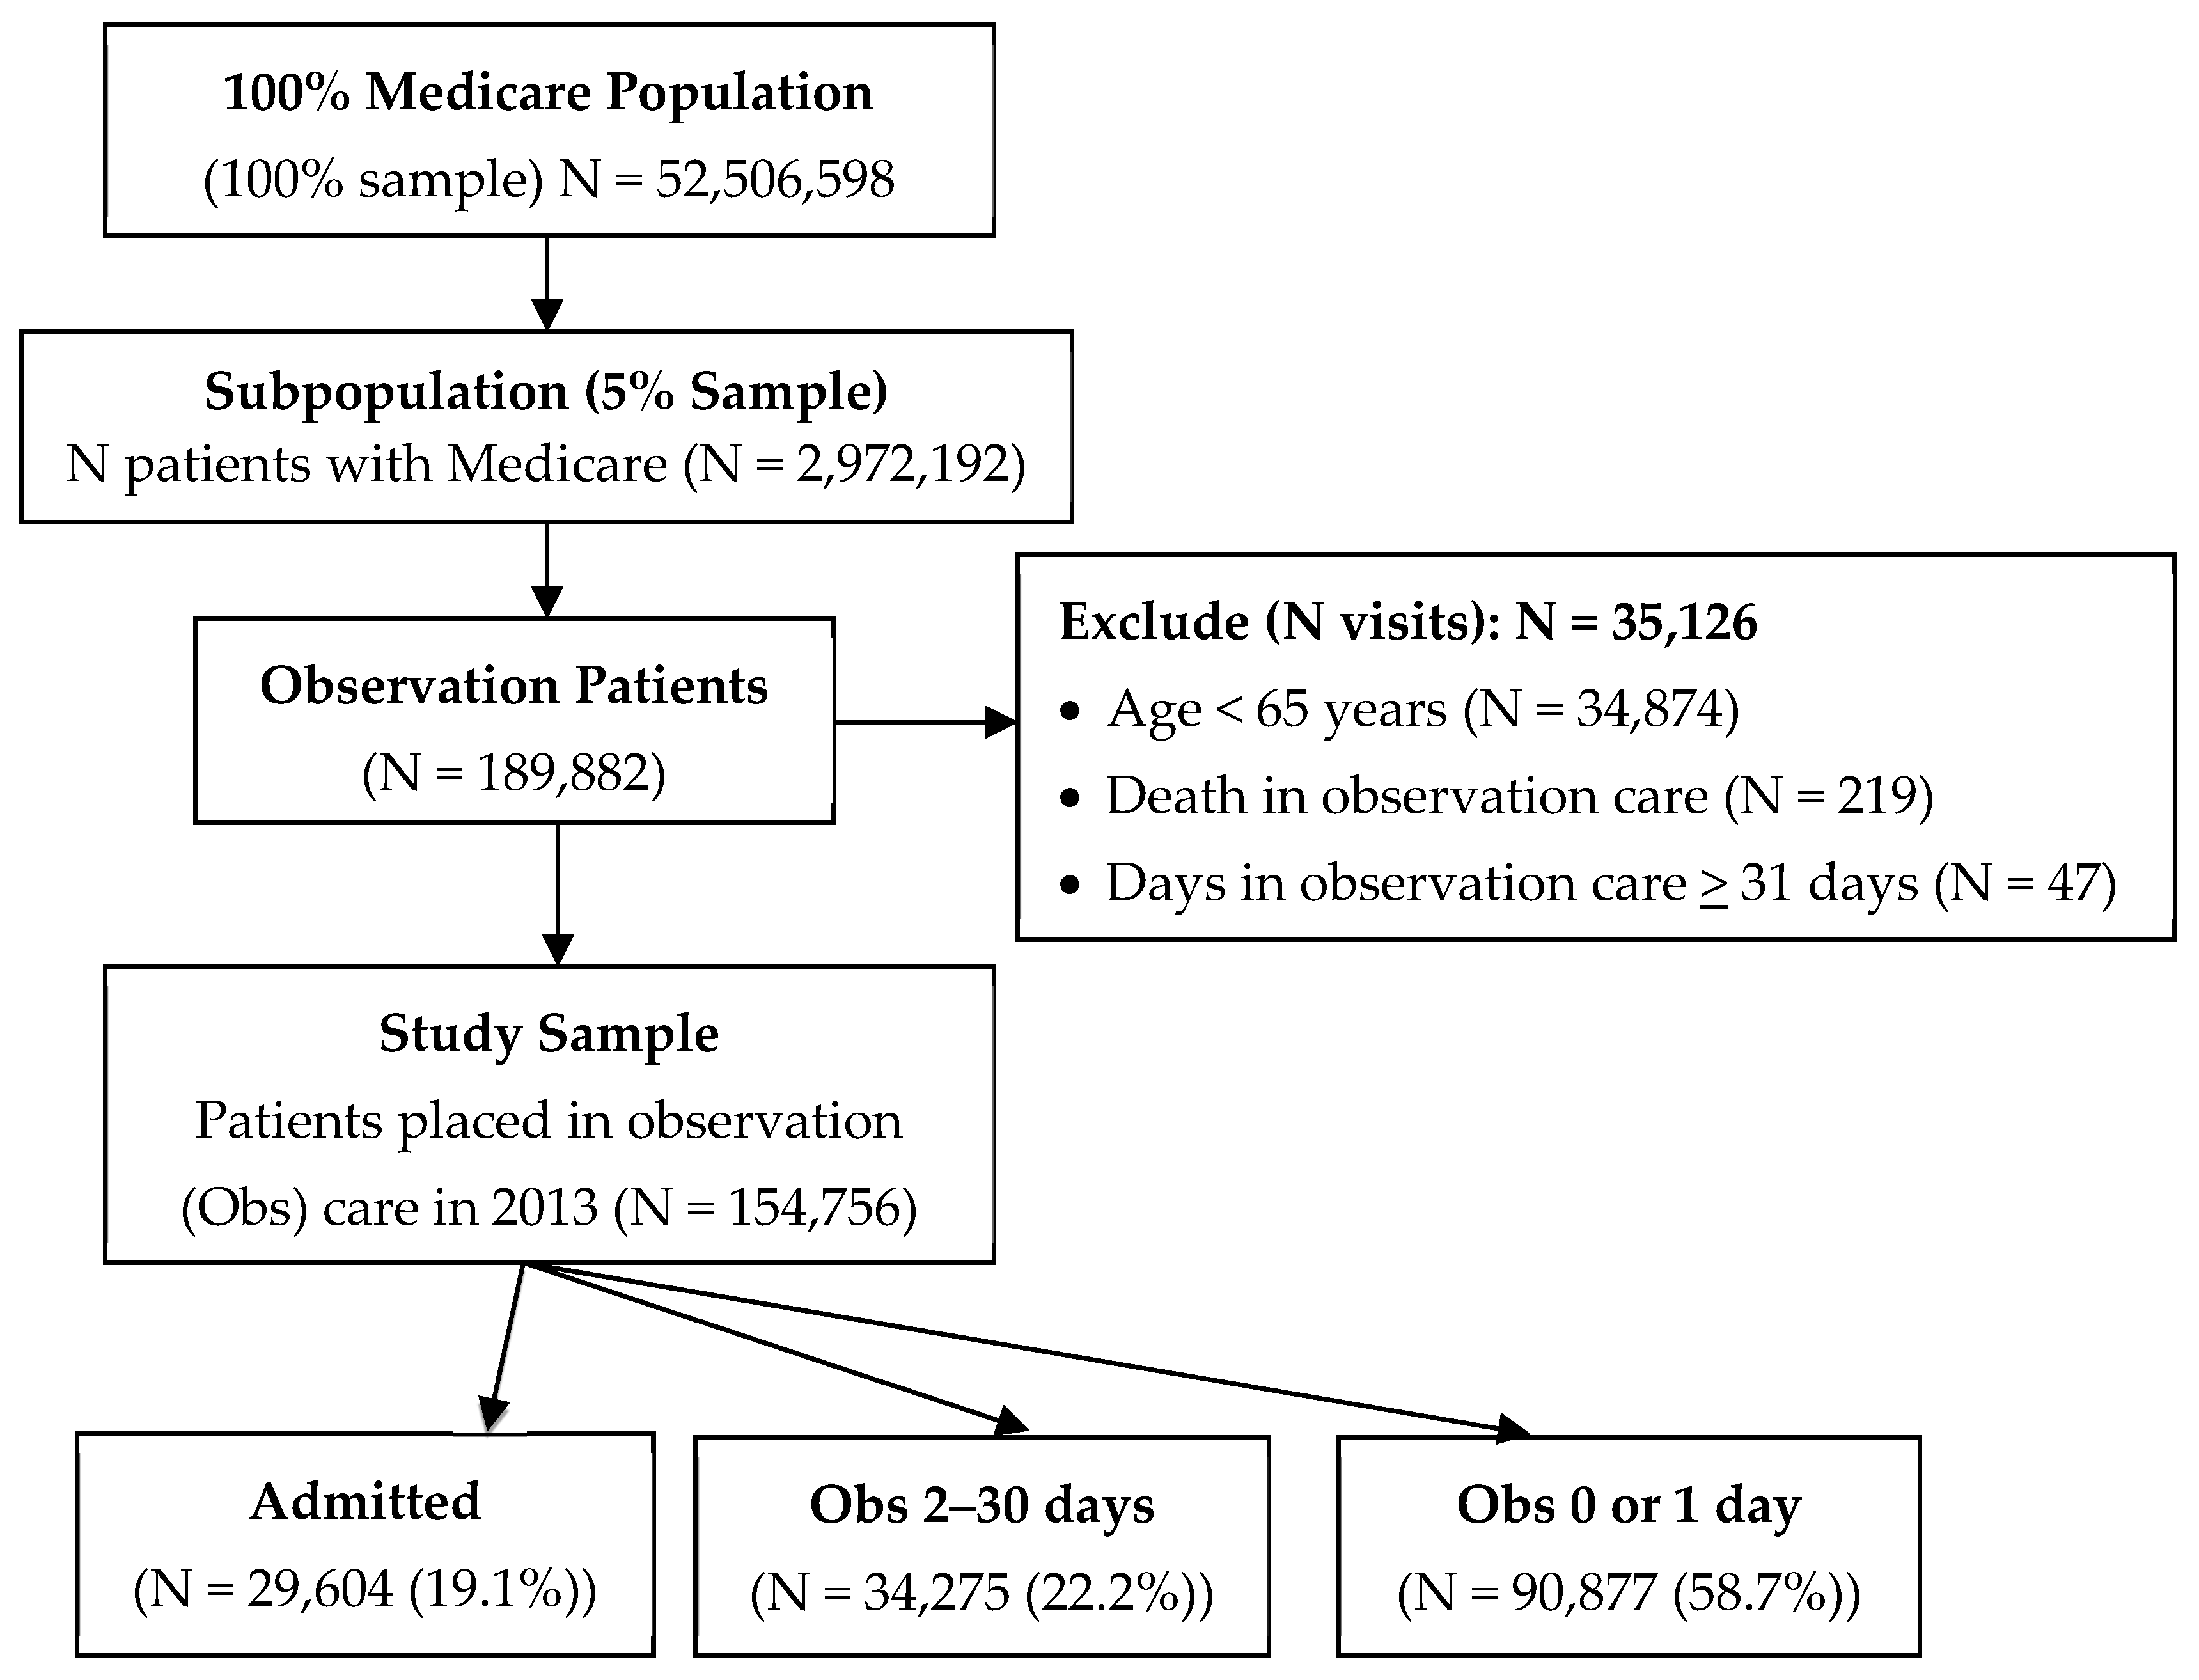
2.2. Setting and Selection of Participants
2.3. Data Sources
2.4. Measures
2.5. Data Analysis
3. Results
3.1. Sample Characteristics
3.2. Main Results
4. Discussion
Limitations
5. Conclusions
Author Contributions
Funding
Conflicts of Interest
Appendix A

| Name of Chronic Condition | Variable Name in the Dataset |
|---|---|
| Acute Myocardial Infarction | AMIc |
| Alzheimer’s Disease | ALZHc |
| Alzheimer’s Disease and Related Disorders | ALZH_DEMENc |
| Atrial Fibrillation | ATRIAL_FIBc |
| Cataract | CATARACTc |
| Chronic Kidney Disease | CHRONICKIDNEYc |
| Chronic Obstructive Pulmonary Disease | COPDc |
| Heart Failure | CHFc |
| Diabetes | DIABETESc |
| Glaucoma | GLAUCOMAc |
| Hip/Pelvic Fracture | HIP_FRACTUREc |
| Ischemic Heart Disease | ISCHEMICHEARTc |
| Depression | DEPRESSIONc |
| Osteoporosis | OSTEOPOROSISc |
| Rheumatoid Arthritis/Osteoarthritis | RA_OAc |
| Stroke/Transient Ischemic Attack | STROKE_TIAc |
| Breast Cancer | CANCER_BREASTc |
| Colorectal Cancer | CANCER_COLORECTALc |
| Prostate Cancer | CANCER_PROSTATEc |
| Lung Cancer | CANCER_LUNGc |
| Endometrial Cancer | CANCER_ENDOMETRIALc |
| Anemia | ANEMIAc |
| Asthma | ASTHMAc |
| Hyperlipidemia | HYPERLc |
| Benign Prostatic Hyperplasia | HYPERPc |
| Hypertension | HYPERTc |
| Acquired Hypothyroidism | HYPOTHc |
| Diagnosis | Codes |
|---|---|
| Injuries: Sprains, fractures and joint disorders | 16.1 16.2 16.7 |
| Injuries: Major trauma related: Spinal cord, Intracranial, Crushing/internal organ injury | 16.3 16.4 16.5 |
| Injuries: Other including burns, wounds, poisonings, superficial injuries | 16.6 16.8 16.9 16.11 16.12 |
| Symptoms: Abdominal pain | 17.1.7 |
| Symptoms: Chest pain | 7.2.5 |
| Symptoms: Dizziness, vertigo and syncope | 6.8.2 17.1.1 |
| Symptoms: Headache | 6.5 |
| Symptoms: Other symptoms, signs and ill-defined conditions | 17.1.2 17.1.3 17.1.4 17.1.5 17.1.6 17.1.8 17.1.9 |
| Infection: Upper respiratory infections excluding pneumonia | 8.1.2 8.1.3 8.1.4 8.1.5 |
| Infection: Intestinal Infections | 9.1 |
| Infection: Urinary Tract infection and symptoms | 10.1.4 |
| Infection: Other Infectious and Parasitic Diseases: Meningitis, Infective arthritis, Bacterial, Mycoses, Viral | 1 6.1 13.1 |
| Infection: Skin and SubQ Infection | 12.1 |
| Endocrine; nutritional; and metabolic diseases and immunity disorders | 3.1 3.4 3.5 3.6 3.7 3.8 3.9 3.10 3.11 |
| Diabetes with and without complications | 3.2 3.3 |
| HTN | 7.1 |
| Other Heart Disease: Valvular disease, Carditis | 7.2.1 7.2.2 7.2.6 7.2.7 7.2.10 |
| Dysrythmias and conduction disorders | 7.2.8 7.2.9 |
| Ischemic Heart Disease and MI | 7.2.3 7.2.4 |
| CHF | 7.2.11 |
| Circulatory Disorders: Diseases of arteries; arterioles; veins; lymphatics and capillaries | 7.4 7.5 |
| Cerebrovascular Disease | 7.3 |
| Diseases of the blood and blood-forming organs | 4 |
| Neoplasms | 2 |
| Mental Illness | 5 |
| Nervous System Disorders | 6.2 6.3 6.4 6.6 6.7 6.8.1 6.8.3 6.9 |
| Pneumonia | 8.1.1 |
| Other Respiratory Disease | 8.6 8.7 8.8 8.9 |
| COPD | 8.2 |
| Asthma | 8.3 |
| Pleurisy, Pneumothorax, and Pneumonitis | 8.4 8.5 |
| GI System Diseases | 9.2 9.3 9.4 9.5 9.6 9.7 9.8 9.9 9.10 9.11 9.12 |
| Other Renal and GU Diseases | 10.1.5 10.1.6 10.1.7 10.2 10.3 10.1.8 |
| Renal Disease | 10.1.1 10.1.2 10.1.3 |
| Pregnancy and childbirth related disorders | 11 |
| Congenital and Perinatal Anomalies | 14 15 |
| Diseases of the musculoskeletal system, skin and connective tissue | 12.2 12.3 12.4 13.2 13.3 13.4 13.5 13.6 13.7 13.8 13.9 |
| Complications and Adverse events | 16.10 |
| Other: Residual codes and other factors influencing healthcare | 17.2 18 |
References
- Cafardi, S.G.; Pines, J.M.; Deb, P.; Powers, C.A.; Shrank, W.H. Increased observation services in Medicare beneficiaries with chest pain. Am. J. Emerg. Med. 2016, 34, 16–19. [Google Scholar] [CrossRef] [PubMed]
- Feng, Z.; Wright, B.; Mor, V. Sharp rise in Medicare enrollees being held in hospitals for observation raises concerns about causes and consequences. Health Aff. 2012, 31, 1251–1259. [Google Scholar] [CrossRef] [PubMed]
- Wright, B.; O’Shea, A.M.; Ayyagari, P.; Ugwi, P.G.; Kaboli, P.; Vaughan Sarrazin, M. Observation rates at veterans’ hospitals more than doubled during 2005–13, similar to medicare trends. Health Aff. 2015, 34, 1730–1737. [Google Scholar] [CrossRef] [PubMed]
- Centers for Medicare & Medicaid Services. Part B hospital (including inpatient hospital Part B and OPPS). In Medicare Claims Processing Manual; Chapter 4; CMS: Baltimore, MD, USA, 2011. Available online: https://www.cms.gov/Regulations-and-Guidance/Guidance/Manuals/downloads//clm104c04.pdf (assessed on 21 November 2018).
- Aston, G. Observation units: A tightrope act. Hosp. Health Netw. 2012, 86, 32–36. [Google Scholar] [PubMed]
- Gabayan, G.Z.; Derose, S.F.; Asch, S.M.; Yiu, S.; Lancaster, E.M.; Poon, K.T.; Hoffman, J.R.; Sun, B.C. Patterns and predictors of short-term death after emergency department discharge. Ann. Emerg. Med. 2011, 58, 551–558. [Google Scholar] [CrossRef] [PubMed]
- Gabayan, G.Z.; Asch, S.M.; Hsia, R.Y.; Zingmond, D.; Liang, L.; Han, W.; McCreath, H.; Weiss, R.E.; Sun, B.C. Factors associated with short-term bounce-back admissions following emergency department discharge. Ann. Emerg. Med. 2013, 62, 136–144. [Google Scholar] [CrossRef] [PubMed]
- Gabayan, G.Z.; Sarkisian, C.A.; Liang, L.J.; Sun, B.C. Predictors of admission after emergency department discharge in older adults. J. Am. Geriatr. Soc. 2015, 63, 39–45. [Google Scholar] [CrossRef] [PubMed]
- Clinical Classification Software (CCS) for ICD-9-CM. Available online: https://www.hcup-us.ahrq.gov/toolssoftware/ccs/ccs.jsp (assessed on 21 January 2015).
- Centers for Medicare & Medicaid Services. Fact Sheet: Two-Midnight Rule. Available online: https://www.cms.gov/Newsroom/MediaReleaseDatabase/Fact-sheets/2015-Fact-sheets-items/2015-07-01-2.html (accessed on 1 March 2017).
- Diggie, P.J.; Heagerty, P.; Liang, K.Y.; Zeger, S.L. Analysis of Longitudinal Data, 2nd ed.; Oxford University Press: Oxford, UK, 2002. [Google Scholar]
- Baugh, C.W.; Venkatesh, A.K.; Hilton, J.A.; Samuel, P.A.; Schuur, J.D.; Bohan, J.S. Making greater use of dedicated hospital observation units for many short-stay patients could save $3.1 billion a year. Health Aff. 2012, 31, 2314–2323. [Google Scholar] [CrossRef] [PubMed]
- Blecker, S.; Gavin, N.P.; Park, H.; Ladapo, J.A.; Katz, S.D. Observation units as substitutes for hospitalization or home discharge. Ann. Emerg. Med. 2016, 67, 706–713. [Google Scholar] [CrossRef] [PubMed]
- Abrahamian, F.M.; Deblieux, P.M.; Emerman, C.L.; Kollef, M.H.; Kupersmith, E.; Leeper, K.V., Jr.; Paterson, D.L.; Shorr, A.F. Health care-associated pneumonia: identification and initial management in the ED. Am. J. Emerg. Med. 2008, 26, 1–11. [Google Scholar] [CrossRef] [PubMed]
- Kollef, M.H.; Shorr, A.; Tabak, Y.P.; Gupta, V.; Liu, L.Z.; Johannes, R.S. Epidemiology and outcomes of health-care-associated pneumonia: Results from a large US database of culture-positive pneumonia. Chest 2005, 128, 3854–3862. [Google Scholar] [CrossRef] [PubMed]
- Shaughnessy, P.W.; Kramer, A.M. The increased needs of patients in nursing homes and patients receiving home health care. N. Engl. J. Med. 1990, 322, 21–27. [Google Scholar] [CrossRef] [PubMed]
| Characteristic | Total (N) | Admitted N (%) | OBS 2–30 Days N (%) | OBS 0 or 1 Day N (%) |
|---|---|---|---|---|
| Age 1 | ||||
| 65–69 | 31,219 | 4636 (14.9) | 5983 (19.2) | 20,600 (65.9) |
| 70–74 | 30,182 | 4954 (16.4) | 5986 (19.8) | 19,242 (63.8) |
| 75–79 | 29,487 | 5583 (18.9) | 6368 (21.6) | 17,536 (59.5) |
| 80+ | 63,866 | 14,431 (22.6) | 15,938 (25.0) | 33,499 (52.4) |
| Gender | ||||
| Female | 96,762 | 18,567 (19.2) | 22,577 (23.3) | 55,618 (57.5) |
| Male | 57,994 | 11,037 (19.0) | 11,698 (20.2) | 35,259 (60.8) |
| Race/Ethnicity 4 | ||||
| White | 134,753 | 25,158 (18.7) | 29,317 (21.8) | 80,278 (59.6) |
| lack | 13,215 | 3045 (23.0) | 3421 (25.9) | 6749 (51.1) |
| Asian | 1885 | 414 (22.0) | 420 (22.3) | 1051 (55.8) |
| Hispanic | 2156 | 538 (25.0) | 547 (25.4) | 1071 (49.7) |
| North American N | 645 | 92 (14.3) | 168 (26.0) | 385 (59.7) |
| Day of week of service | ||||
| Weekday | 131,486 | 22,631 (17.2) | 27,549 (21.0) | 81,306 (61.8) |
| Weekend | 23,270 | 6973 (30.0) | 6726 (28.9) | 9571 (41.1) |
| Observation care from an ED | ||||
| NO | 69,041 | 4001 (5.8) | 11,286 (16.3) | 53,754 (77.9) |
| YES | 85,715 | 25,603 (29.9) | 22,989 (26.8) | 37,123 (43.3) |
| SNF 2 utilization | ||||
| NO | 74,420 | 1 (0) | 17,045 (22.9) | 57,374 (77.1) |
| YES | 80,336 | 29,603 (36.8) | 17,230 (21.5) | 33,503 (41.7) |
| Comorbidity 3 | ||||
| Acute Myocardial Infarction | 12,860 | 2932 (22.8) | 3108 (24.2) | 6820 (53.0) |
| Alzheimer’s Disease | 12,844 | 3113 (24.2) | 3721 (29.0) | 6010 (46.8) |
| Alzheimer’s Disease and Related Disorders | 32,060 | 7578 (23.6) | 9106 (28.4) | 15,376 (48.0) |
| Atrial Fibrillation | 36,946 | 7815 (21.2) | 9088 (24.6) | 20,043 (54.2) |
| Cataract | 109,907 | 19,547 (17.8) | 25,474 (23.2) | 64,886 (59.0) |
| Chronic Kidney Disease | 55,218 | 11,993 (21.7) | 13,873 (25.1) | 29,352 (53.2) |
| Chronic Obstructive Pulmonary Disease | 56,578 | 12,029 (21.3) | 14,175 (25.1) | 30,374 (53.7) |
| Heart Failure | 62,989 | 14,094 (22.4) | 16,040 (25.5) | 32,855 (52.2) |
| Diabetes | 66,402 | 13,334 (20.1) | 16,143 (24.3) | 36,925 (55.6) |
| Glaucoma | 37,932 | 6681 (17.6) | 8980 (23.7) | 22,271 (58.7) |
| Hip/Pelvic Fracture | 9112 | 2119 (23.3) | 2456 (27.0) | 4537 (49.8) |
| Ischemic Heart Disease | 97,143 | 19,525 (20.1) | 23,272 (24.0) | 54,346 (55.9) |
| Depression | 59,719 | 11,590 (19.4) | 14,993 (25.1) | 33,136 (55.5) |
| Osteoporosis | 43,268 | 8067 (18.6) | 10,805 (25.0) | 24,396 (56.4) |
| Rheumatoid Arthritis/Osteoarthritis | 101,301 | 18,242 (18.0) | 24,036 (23.7) | 59,023 (58.3) |
| Stroke/Transient Ischemic Attack | 35,114 | 7997 (22.8) | 9170 (26.1) | 17,947 (51.1) |
| Breast Cancer | 12,449 | 1843 (14.8) | 2939 (23.6) | 7667 (61.6) |
| Colorectal Cancer | 6647 | 1212 (18.2) | 1620 (24.4) | 3815 (57.4) |
| Prostate Cancer | 10,135 | 1663 (16.4) | 2074 (20.5) | 6398 (63.1) |
| Lung Cancer | 4644 | 789 (17.0) | 1119 (24.1) | 2736 (58.9) |
| Endometrial Cancer | 2167 | 345 (15.9) | 539 (24.9) | 1283 (59.2) |
| Anemia | 100,552 | 19,592 (19.5) | 24,596 (24.5) | 56,364 (56.1) |
| Asthma | 27,545 | 5612 (20.4) | 6807 (24.7) | 15,126 (54.9) |
| Hyperlipidemia | 125,221 | 22,660 (18.1) | 28,804 (23.0) | 73,757 (58.9) |
| Benign Prostatic Hyperplasia | 30,077 | 5293 (17.6) | 6521 (21.7) | 18,263 (60.7) |
| Hypertension | 134,494 | 25,096 (18.7) | 31,324 (23.3) | 78,074 (58.1) |
| Acquired Hypothyroidism | 47,856 | 9040 (18.9) | 11,673 (24.4) | 27,143 (56.7) |
| Characteristic | Total (N = 154,756) | Obs 0–1 Day (N = 90,877) | Admitted (N = 29,604) | Obs 2–30 Days (N = 34,275) |
|---|---|---|---|---|
| N (%) | N (%) | N (%) | N (%) | |
| Diseases of the musculoskeletal system skin and connective tissue | 17,401 (11.2) | 13,278 (76.3) | 1095 (6.3) | 3028 (17.4) |
| Chest pain | 15,202 (9.8) | 11,283 (74.2) | 707 (4.7) | 3212 (21.1) |
| Neoplasms | 12,298 (7.9) | 9142 (74.3) | 840 (6.8) | 2316 (18.8) |
| GI System Diseases | 9932 (6.4) | 4295 (43.2) | 3120 (31.4) | 2517 (25.3) |
| Dizziness vertigo and syncope | 7439 (4.8) | 4244 (57.1) | 689 (9.3) | 2506 (33.7) |
| Other Residual codes | 6823 (4.4) | 5117 (75) | 302 (4.4) | 1404 (20.6) |
| Dysrhythmias and condition disorders | 6169 (4) | 3430 (55.6) | 1639 (26.6) | 1100 (17.8) |
| Nervous System Disorders | 5725 (3.7) | 3935 (68.7) | 728 (12.7) | 1062 (18.6) |
| Ischemic Heart Disease | 5346 (3.5) | 2421 (45.3) | 2055 (38.4) | 870 (16.3) |
| Endocrine nutritional immunity and metabolic disorders | 5066 (3.3) | 2782 (54.9) | 984 (19.4) | 1300 (25.7) |
| Other Renal and GU Diseases | 4941 (3.2) | 3572 (72.3) | 436 (8.8) | 933 (18.9) |
| Circulatory Disorders: Disease of arteries arterioles vei | 4547 (2.9) | 2420 (53.2) | 910 (20) | 1217 (26.8) |
| Minor Injuries | 4150 (2.7) | 1568 (37.8) | 1206 (29.1) | 1376 (33.2) |
| Cerebrovascular Disease | 3789 (2.4) | 1422 (37.5) | 1575 (41.6) | 792 (20.9) |
| Other Injuries | 3666 (2.4) | 2201 (60) | 301 (8.2) | 1164 (31.8) |
| Other Respiratory Disease | 3240 (2.1) | 2182 (67.3) | 439 (13.5) | 619 (19.1) |
| Urinary Tract Infection | 3218 (2.1) | 1014 (31.5) | 1320 (41) | 884 (27.5) |
| Diseases of the blood | 3122 (2) | 2007 (64.3) | 462 (14.8) | 653 (20.9) |
| Chronic obstructive pulmonary disease COPD | 3045 (2) | 1130 (37.1) | 1180 (38.8) | 735 (24.1) |
| Congestive Heart Failure | 2994 (1.9) | 871 (29.1) | 1476 (49.3) | 647 (21.6) |
| Complications and Adverse events | 2958 (1.9) | 1363 (46.1) | 922 (31.2) | 673 (22.8) |
| Other Symptoms | 2699 (1.7) | 1512 (56) | 252 (9.3) | 935 (34.6) |
| Hypertension HTN | 2459 (1.6) | 1581 (64.3) | 421 (17.1) | 457 (18.6) |
| Diabetes with and without complications | 2455 (1.6) | 1509 (61.5) | 360 (14.7) | 586 (23.9) |
| Other Infectious and Parasitic Diseases | 2343 (1.5) | 954 (40.7) | 1166 (49.8) | 223 (9.5) |
| Pneumonia | 1857 (1.2) | 444 (23.9) | 1077 (58) | 336 (18.1) |
| Abdominal pain | 1644 (1.1) | 914 (55.6) | 137 (8.3) | 593 (36.1) |
| Renal Disease | 1642 (1.1) | 471 (28.7) | 899 (54.8) | 272 (16.6) |
| Mental Illness | 1592 (1) | 730 (45.9) | 384 (24.1) | 478 (30) |
| Patient Characteristics | Odds Ratio (95% CI) | p |
|---|---|---|
| Age (REF = 65–69) | ||
| 70–74 | 1.05 (1.01–1.09) | 0.0066 |
| 75–79 | 1.14 (1.1–1.18) | <0.0001 |
| 80+ | 1.23 (1.19–1.27) | <0.0001 |
| Gender | ||
| Male vs. Female | 0.92 (0.9–0.94) | <0.0001 |
| Race/Ethnicity (REF = White) | ||
| Black | 1.22 (1.17–1.27) | <0.0001 |
| Others | 1.06 (0.97–1.15) | 0.2049 |
| Asian/PI | 1.17 (1.05–1.31) | 0.0051 |
| Hispanic | 1.11 (1.01–1.22) | 0.036 |
| Day of week of service | ||
| Weekend vs. Weekday | 1.28 (1.24–1.32) | <0.0001 |
| Observation care from an ED visit | ||
| Yes vs. No | 2.84 (2.74–2.95) | <0.0001 |
| Ever used SNF services in 2013 | ||
| Yes vs. No | 2.85 (2.68–3.02) | <0.0001 |
| Number of chronic conditions 1 | 0.98 (0.98–0.99) | <0.0001 |
| Observation diagnosis (REF = Urinary Tract Infection) | ||
| Intestinal Infection | 1.56 (1.32–1.83) | <0.0001 |
| Pneumonia | 1.26 (1.13–1.41) | <0.0001 |
| Other Infectious and Parasitic Diseases 2 | 1.13 (1.01–1.27) | 0.0278 |
| Renal Disease | 1.08 (0.96–1.23) | 0.2008 |
| Skin and Subcutaneous Infections | 1.04 (0.93–1.18) | 0.4759 |
| CHF | 0.97 (0.88–1.07) | 0.5597 |
| Asthma | 0.96 (0.82–1.13) | 0.6567 |
| Minor Injuries | 0.86 (0.79–0.94) | 0.0009 |
| GI system Diseases | 0.83 (0.76–0.89) | <0.0001 |
| COPD | 0.82 (0.75–0.91) | <0.0001 |
| Non-atherosclerotic Heart Disease | 0.79 (0.68–0.91) | 0.0012 |
| Non-infectious Lung Disease | 0.76 (0.65–0.88) | 0.0004 |
| Complications and Adverse events | 0.75 (0.68–0.83) | <0.0001 |
| Ischemic Heart Disease | 0.73 (0.67–0.81) | <0.0001 |
| Circulatory Disorders | 0.73 (0.66–0.81) | <0.0001 |
| Cerebrovascular Diseases | 0.72 (0.66–0.79) | <0.0001 |
| Mental Illness | 0.65 (0.57–0.74) | <0.0001 |
| Upper Respiratory Infection | 0.64 (0.56–0.72) | <0.0001 |
| Diabetes Mellitus | 0.62 (0.55–0.7) | <0.0001 |
| Endocrine, nutritional, immunity and metabolic disorders | 0.6 (0.55–0.65) | <0.0001 |
| Neoplasms | 0.59 (0.54–0.66) | <0.0001 |
| Other Renal and GI Diseases | 0.58 (0.52–0.64) | <0.0001 |
| Dysrhythmias | 0.53 (0.49–0.59) | <0.0001 |
| Congenital Diseases | 0.53 (0.34–0.83) | 0.0058 |
| Major Injuries | 0.52 (0.43–0.63) | <0.0001 |
| Nervous system Disorders | 0.51 (0.46–0.56) | <0.0001 |
| Other Injuries | 0.49 (0.44–0.55) | <0.0001 |
| Diseases of the musculoskeletal system, skin and connective tissue | 0.49 (0.45–0.53) | <0.0001 |
| Hypertension | 0.48 (0.43–0.54) | <0.0001 |
| Symptoms: Abdominal Pain | 0.47 (0.42–0.54) | <0.0001 |
| Symptoms: Others | 0.47 (0.42–0.51) | <0.0001 |
| Diseases of the blood | 0.45 (0.4–0.51) | <0.0001 |
| Other Residual Codes | 0.42 (0.38–0.47) | <0.0001 |
| Symptoms: Dizziness, Vertigo and Syncope | 0.38 (0.35–0.42) | <0.0001 |
| Other Respiratory Diseases | 0.38 (0.34–0.42) | <0.0001 |
| Symptoms: Headache | 0.32 (0.26–0.41) | <0.0001 |
| Symptoms: Chest Pain | 0.17 (0.16–0.19) | <0.0001 |
© 2018 by the authors. Licensee MDPI, Basel, Switzerland. This article is an open access article distributed under the terms and conditions of the Creative Commons Attribution (CC BY) license (http://creativecommons.org/licenses/by/4.0/).
Share and Cite
Gabayan, G.Z.; Doyle, B.; Liang, L.-J.; Donkor, K.; Huang, D.Y.-C.; Sarkisian, C.A. Who Has an Unsuccessful Observation Care Stay? Healthcare 2018, 6, 138. https://doi.org/10.3390/healthcare6040138
Gabayan GZ, Doyle B, Liang L-J, Donkor K, Huang DY-C, Sarkisian CA. Who Has an Unsuccessful Observation Care Stay? Healthcare. 2018; 6(4):138. https://doi.org/10.3390/healthcare6040138
Chicago/Turabian StyleGabayan, Gelareh Z., Brian Doyle, Li-Jung Liang, Kwame Donkor, David Yu-Chuang Huang, and Catherine A. Sarkisian. 2018. "Who Has an Unsuccessful Observation Care Stay?" Healthcare 6, no. 4: 138. https://doi.org/10.3390/healthcare6040138
APA StyleGabayan, G. Z., Doyle, B., Liang, L.-J., Donkor, K., Huang, D. Y.-C., & Sarkisian, C. A. (2018). Who Has an Unsuccessful Observation Care Stay? Healthcare, 6(4), 138. https://doi.org/10.3390/healthcare6040138