Abstract
Background/Objectives: The increasing application of artificial intelligence (AI) and machine learning (ML) in health and medicine has attracted a great deal of research interest in recent decades. This study aims to provide a global and historical picture of research concerning AI and ML in health and medicine. Methods: We used the Scopus database for searching and extracted articles published between 2000 and 2024. Then, we generated information about productivity, citations, collaboration, most impactful research topics, emerging research topics, and author keywords using Microsoft Excel 365 and VOSviewer software (version 1.6.20). Results: We retrieved a total of 22,113 research articles, with a notable surge in research activity in recent years. Core journals were Scientific Reports and IEEE Access, and core institutions included Harvard Medical School and the Ministry of Education of the People’s Republic of China, while core countries comprised the United States, China, India, the United Kingdom, and Saudi Arabia. Citation trends indicated substantial growth and recognition of AI’s and ML impact on health and medicine. Frequent author keywords identified key research hotspots, including specific diseases like Alzheimer’s disease, Parkinson’s diseases, COVID-19, and diabetes. The author keyword analysis identified “deep learning”, “convolutional neural network”, and “classification” as dominant research themes. Conclusions: AI’s transformative potential in AI and ML in health and medicine holds promise for improving global health outcomes.
1. Introduction
Over the course of several decades, artificial intelligence (AI) has developed to encompass increasingly sophisticated algorithms that function similarly to the human brain [1]. Similar to medical disciplines, artificial intelligence (AI) has numerous subfields, including computer vision, deep learning, and machine learning. The use of unique characteristics to find patterns that can be utilized to examine a given circumstance is known as machine learning. After that, the machine can “learn” from it and use that knowledge in similar situations in the future. Instead of using a static algorithm, this prediction tool can be actively used in clinical decision-making to customize patient care. Machine learning has developed into what is now called deep learning, which is made up of algorithms that build an artificial neural network (ANN) that can learn and make decisions on its own, much like the human brain [2,3,4]. A computer’s ability to learn and comprehend from a sequence of images or videos is known as computer vision [5].
The rapid advancement of artificial intelligence (AI) and machine learning (ML) is reshaping the landscape of healthcare, providing new opportunities for disease detection, diagnosis, and treatment optimization [6,7]. AI-driven algorithms are increasingly applied in medical imaging, predictive analytics, and personalized medicine [8,9,10], facilitating earlier and more accurate diagnosis, improved risk stratification, and timely intervention, advancing healthcare systems toward proactive disease management, reduced morbidity, and enhanced patient outcomes [11,12]. As AI continues to transform healthcare delivery, understanding the evolution of AI and ML research in medicine is crucial for identifying trends, emerging themes, and key contributors in this field.
As the scope of AI applications broadens, its impact on healthcare has garnered significant attention in the scholarly literature. With the rapid integration of AI into the medical domain, scholarly research on this subject has significantly expanded in recent years. This growing body of literature necessitates a comprehensive examination of research trajectories and emerging trends in AI and ML within health and medicine. Bibliometric analysis serves as a robust methodological approach for systematically evaluating global research trends, identifying emerging themes, and recognizing influential contributions across diverse disciplines [13,14,15,16]. Previous bibliometric studies have assessed AI or ML in health or medicine [17,18,19], or country-level contributions [20], but the global and comprehensive assessments of both AI and ML research trends in health and medicine remain limited. Accordingly, this study offers a comprehensive global analysis of both AI and ML research trends in the healthcare and medicine sector from 2000 to 2024. Specifically, this study aims to (1) evaluate annual publication and citation trends, (2) identify key contributors, including leading authors, countries, journals, and institutions, (3) assess highly cited publications and the evolution of thematic research over time, and (4) uncover contemporary research hotspots in AI and ML applications in health and medicine through an analysis of author keywords.
By providing a structured and data-driven overview of AI and ML research in healthcare, this study offers valuable insights for researchers, policymakers, and funding agencies. Understanding these research trends can inform future scientific endeavors and strategic investments, ensuring that AI-driven innovations continue to advance global health outcomes.
2. Materials and Methods
2.1. Study Design
This study is a comprehensive bibliometric, descriptive, and retrospective analysis of all original English-published articles that focused on AI and ML in health and medicine.
2.2. Database Used for Literature Retrieval
We retrieved and examined every research paper on AI and ML in health and medicine that was available in the Scopus database. One benefit of Scopus is that it includes PubMed and has twice as many indexed journals as Web of Science [21]. Because it retrieved the greatest number of publications, using the Scopus database alone is therefore justified. Numerous features in Scopus also make it easier to analyze citations, count research collaboration, and export data to Microsoft Excel for additional tabulation and mapping. Scopus has been utilized as the method to retrieve the necessary data in numerous published bibliometric research [14,15,16].
2.3. Search Strategy and Inclusion and Exclusion Criteria
This study employed a query in the search fields of the article title (Supplementary Material, Table S1). On 1 January 2025, a search strategy was carried out, created based on the search strategies of several previous bibliometric articles [18,22]. A question mark was used in the search strategy to capture a wide range of related keywords, and quotation marks were applied to retrieve exact phrases as specified in the search query. The final search strategy was employed after several preliminary attempts and validation processes. It included two main aspects: (AI and ML) and (health and medicine). Stringent inclusion and exclusion criteria were implemented to ensure both relevance and analytical focus. Inclusions involved articles published within the period from 1 January 2000 to 31 December 2024, to focus on contemporary research, articles written in English, and peer-reviewed original research articles. The exclusion criteria were duplicate articles, articles written in non-English languages, non-journal literature such as conferences, book series, trade journals, and undefined, and articles unrelated to AI/ML in health and medicine.
2.4. Validation of Data
To validate the data, title searches were performed to confirm the absence of false positives, with assistance from two colleagues in the medical fields. The retrieved articles were cross-referenced with highly cited publications in Google Scholar to enhance the comprehensiveness of the analysis. The consistency of the metadata and alignment with active journals and prolific authors further confirmed the credibility of the search approach.
2.5. Study Selection and Bias
Information such as the title, authors, institutions, document type, journal, DOI, abstract, publication year, organization, citations, keywords, open-access status, and funding details were extracted and saved as a CSV file for subsequent analysis. Articles were screened to exclude those out of scope, and any missing information was completed. Duplicate records were removed based on the title and DOI. To minimize potential bias, articles were ranked by citations, and the top 1000 most cited articles were reviewed to ensure relevance. We also compared the publication output of prolific authors with their contributions to the field to ensure accuracy and mitigate bias.
2.6. Scientific Literature Bibliometric Indicators
The cleaned list was exported to Microsoft Excel 395 and R package (v.4.2.2) “bibliometrix, Biblioshiny”. Advanced bibliometric indicators were calculated, including the total number of publications (TP), total citations (TC), average citations (AC), sole-authored publications (SA), co-authored publications (CA), number of contributing authors (NCA), annual collaboration index (ACI), number of cited publications (NCP), citations per cited publication (CCP), collaboration index (CI), collaboration coefficient (CC), number of active years of publication (NAY), productivity per active year of publication (PAY), average citation per year (AC/Y), publication year (PY-start), and author indices (h-index, g-index, and m-index). These indicators were measured and compared by the year of publication and citations. The 20 most prolific contributing countries, institutions, journals, authors, and publications were also identified and calculated with their relevant indicators.
2.7. Data Analysis and Mapping
Bibliometric analyses were conducted using Microsoft Excel 365, VOSviewer software (version 1.6.20), and the R package (v.4.2.2) “bibliometrix, biblioshiny”. After cleaning the data, we identified the most impactful and visible research topics and emerging research trends using Excel and RStudio. The “bibliometrix” format was employed to store the data, and the “biblioshiny” package was utilized to extract a range of features related to the research literature between [23,24].
We performed a comprehensive analysis and cartographic representation of the research landscape using VOSviewer [25], widely recognized for its capability to map and visualize the relationships between terms, authors, and research topics. It is particularly effective for visualizing co-authorship networks and co-occurrence data, which are essential for understanding the structure of research trends. By integrating Scopus data, we analyzed frequent author keywords and visualized research topics and their interrelationships. Nodes in the VOSviewer maps represent keywords, with their size reflecting frequency and their color indicating thematic clusters. Lines connecting nodes show relationships, with thicker lines indicating stronger associations. In addition, a co-authorship network visualization of authors and countries was conducted to identify international collaboration patterns.
Biblioshiny was utilized to visualize author productivity through Lotka’s law, highlighting the most productive authors. Further visualizations included the conceptual structural map, which encompassed both a thematic map and thematic evolution analysis.
The thematic map is a plot that was created on a two-dimensional matrix using the conceptual network. In this plot, the significance of each theme within the research area is based on its centrality, as demonstrated by the relevance of the keywords. Additionally, the development of each theme is indicated by its density, as measured by the degree of development [26,27]. Accordingly, themes were distributed into four demarcated quadrants, termed niche, basic, motor, and emerging/declining themes. The conditions for constructing the thematic map in this field included the author’s chosen keywords and a predetermined word count, which was set at 1000. Each bubble depicted in the plot represents a distinct network cluster, with the label assigned to the bubble corresponding to the word inside that cluster with the highest-frequency value. The relative size of each bubble corresponds to the frequency of the cluster words.
In addition to the thematic map, the thematic evolution showed the historical development of AI and ML in health and medicine-related publications. By analyzing the author keywords, the thematic evolution charts the progression of themes and how they have changed over time. This analysis was conducted using ’biblioshiny’ spanning over five distinct time segments. The division of time into these segments reflects the subjective judgment of the authors, aimed at better representing the evolution of themes.
3. Results
3.1. Bibliometric Analysis of All Articles Output
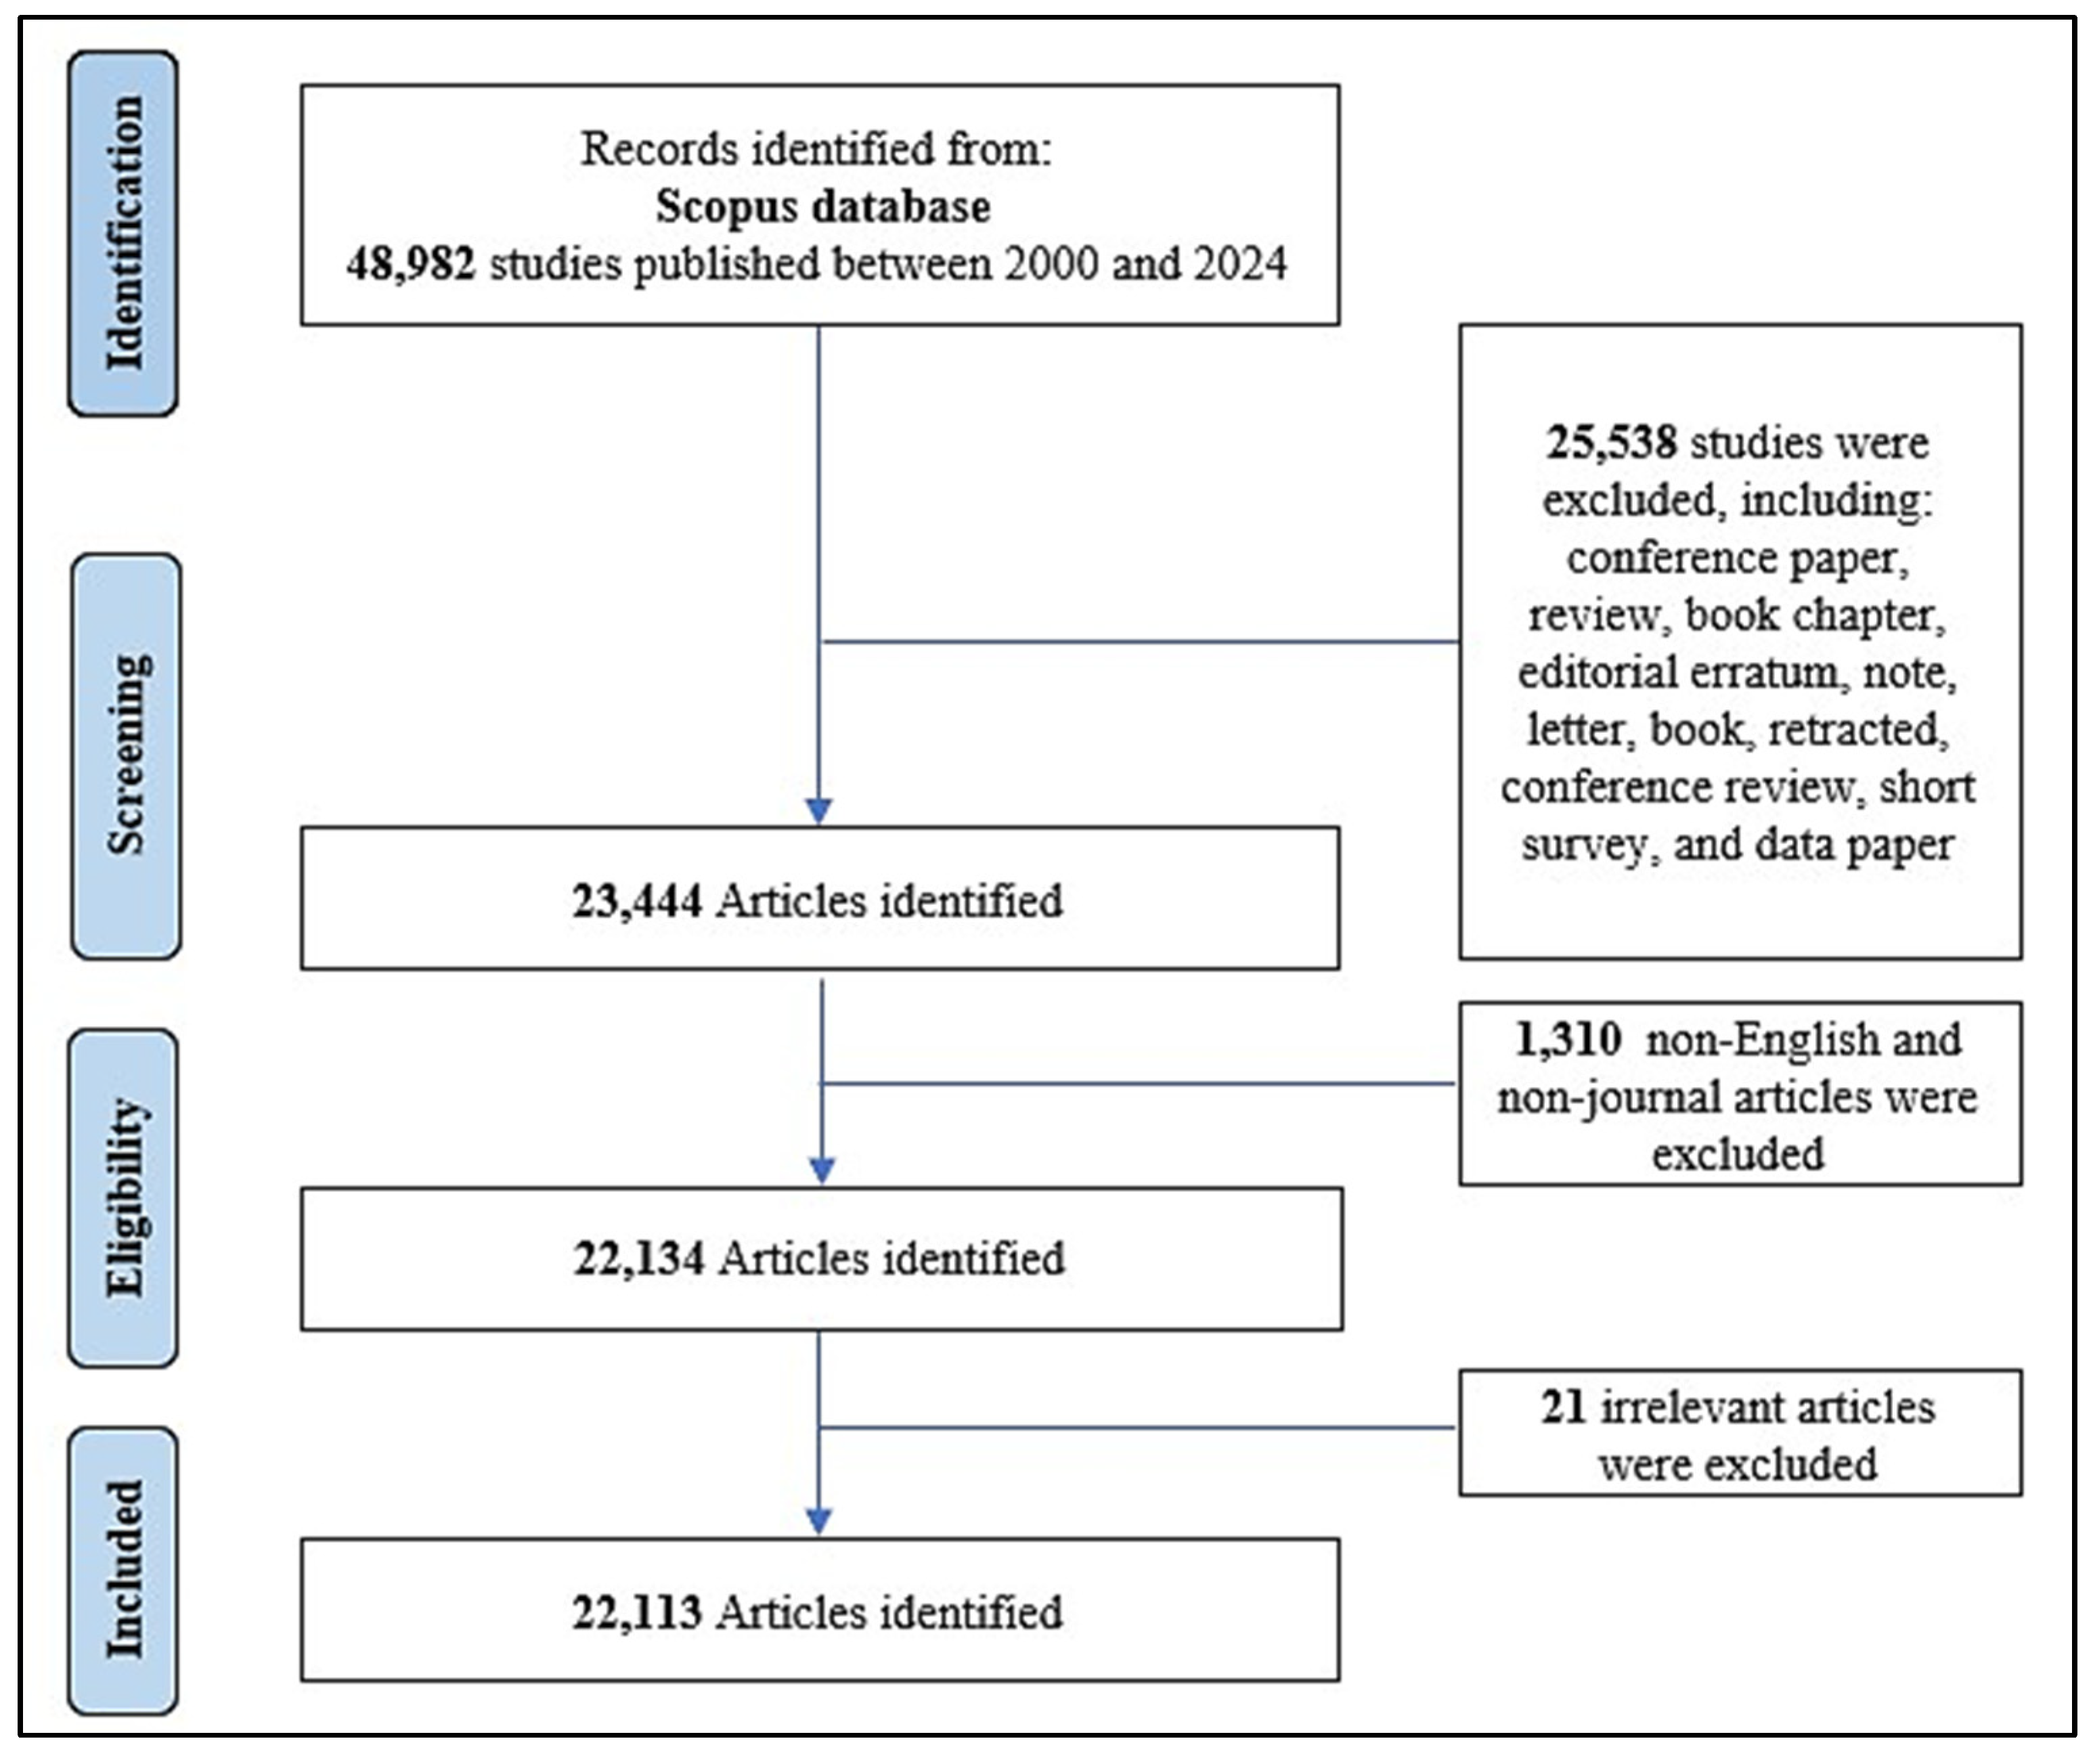
The search strategy retrieved 22,134 articles, of which 21 were excluded by the manual screening (Figure 1). A total of 22,113 articles, spanning 25 active years, were included in the analysis. These articles collectively received 546,819 citations, with an average of 24.7 citations per article (Table 1). The research output demonstrates a steady annual growth rate of 24.8% and a high citation impact, as reflected in an h-index of 253 and a g-index of 410. The number of contributing authors was 76,167, indicating a higher level of collaboration and significant international collaboration, as evidenced by an international co-authorship rate of 264%.
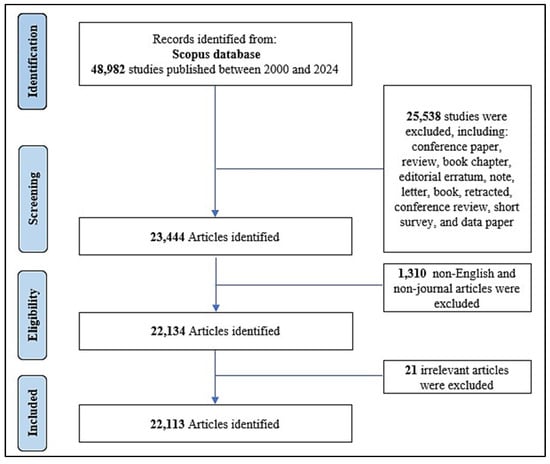
Figure 1.
Flow chart of AI/ML in health and medicine-related literature search and screening.

Table 1.
Main bibliometric indicator for RCTs in DM research.
3.2. Annual Publication and Citation Trends
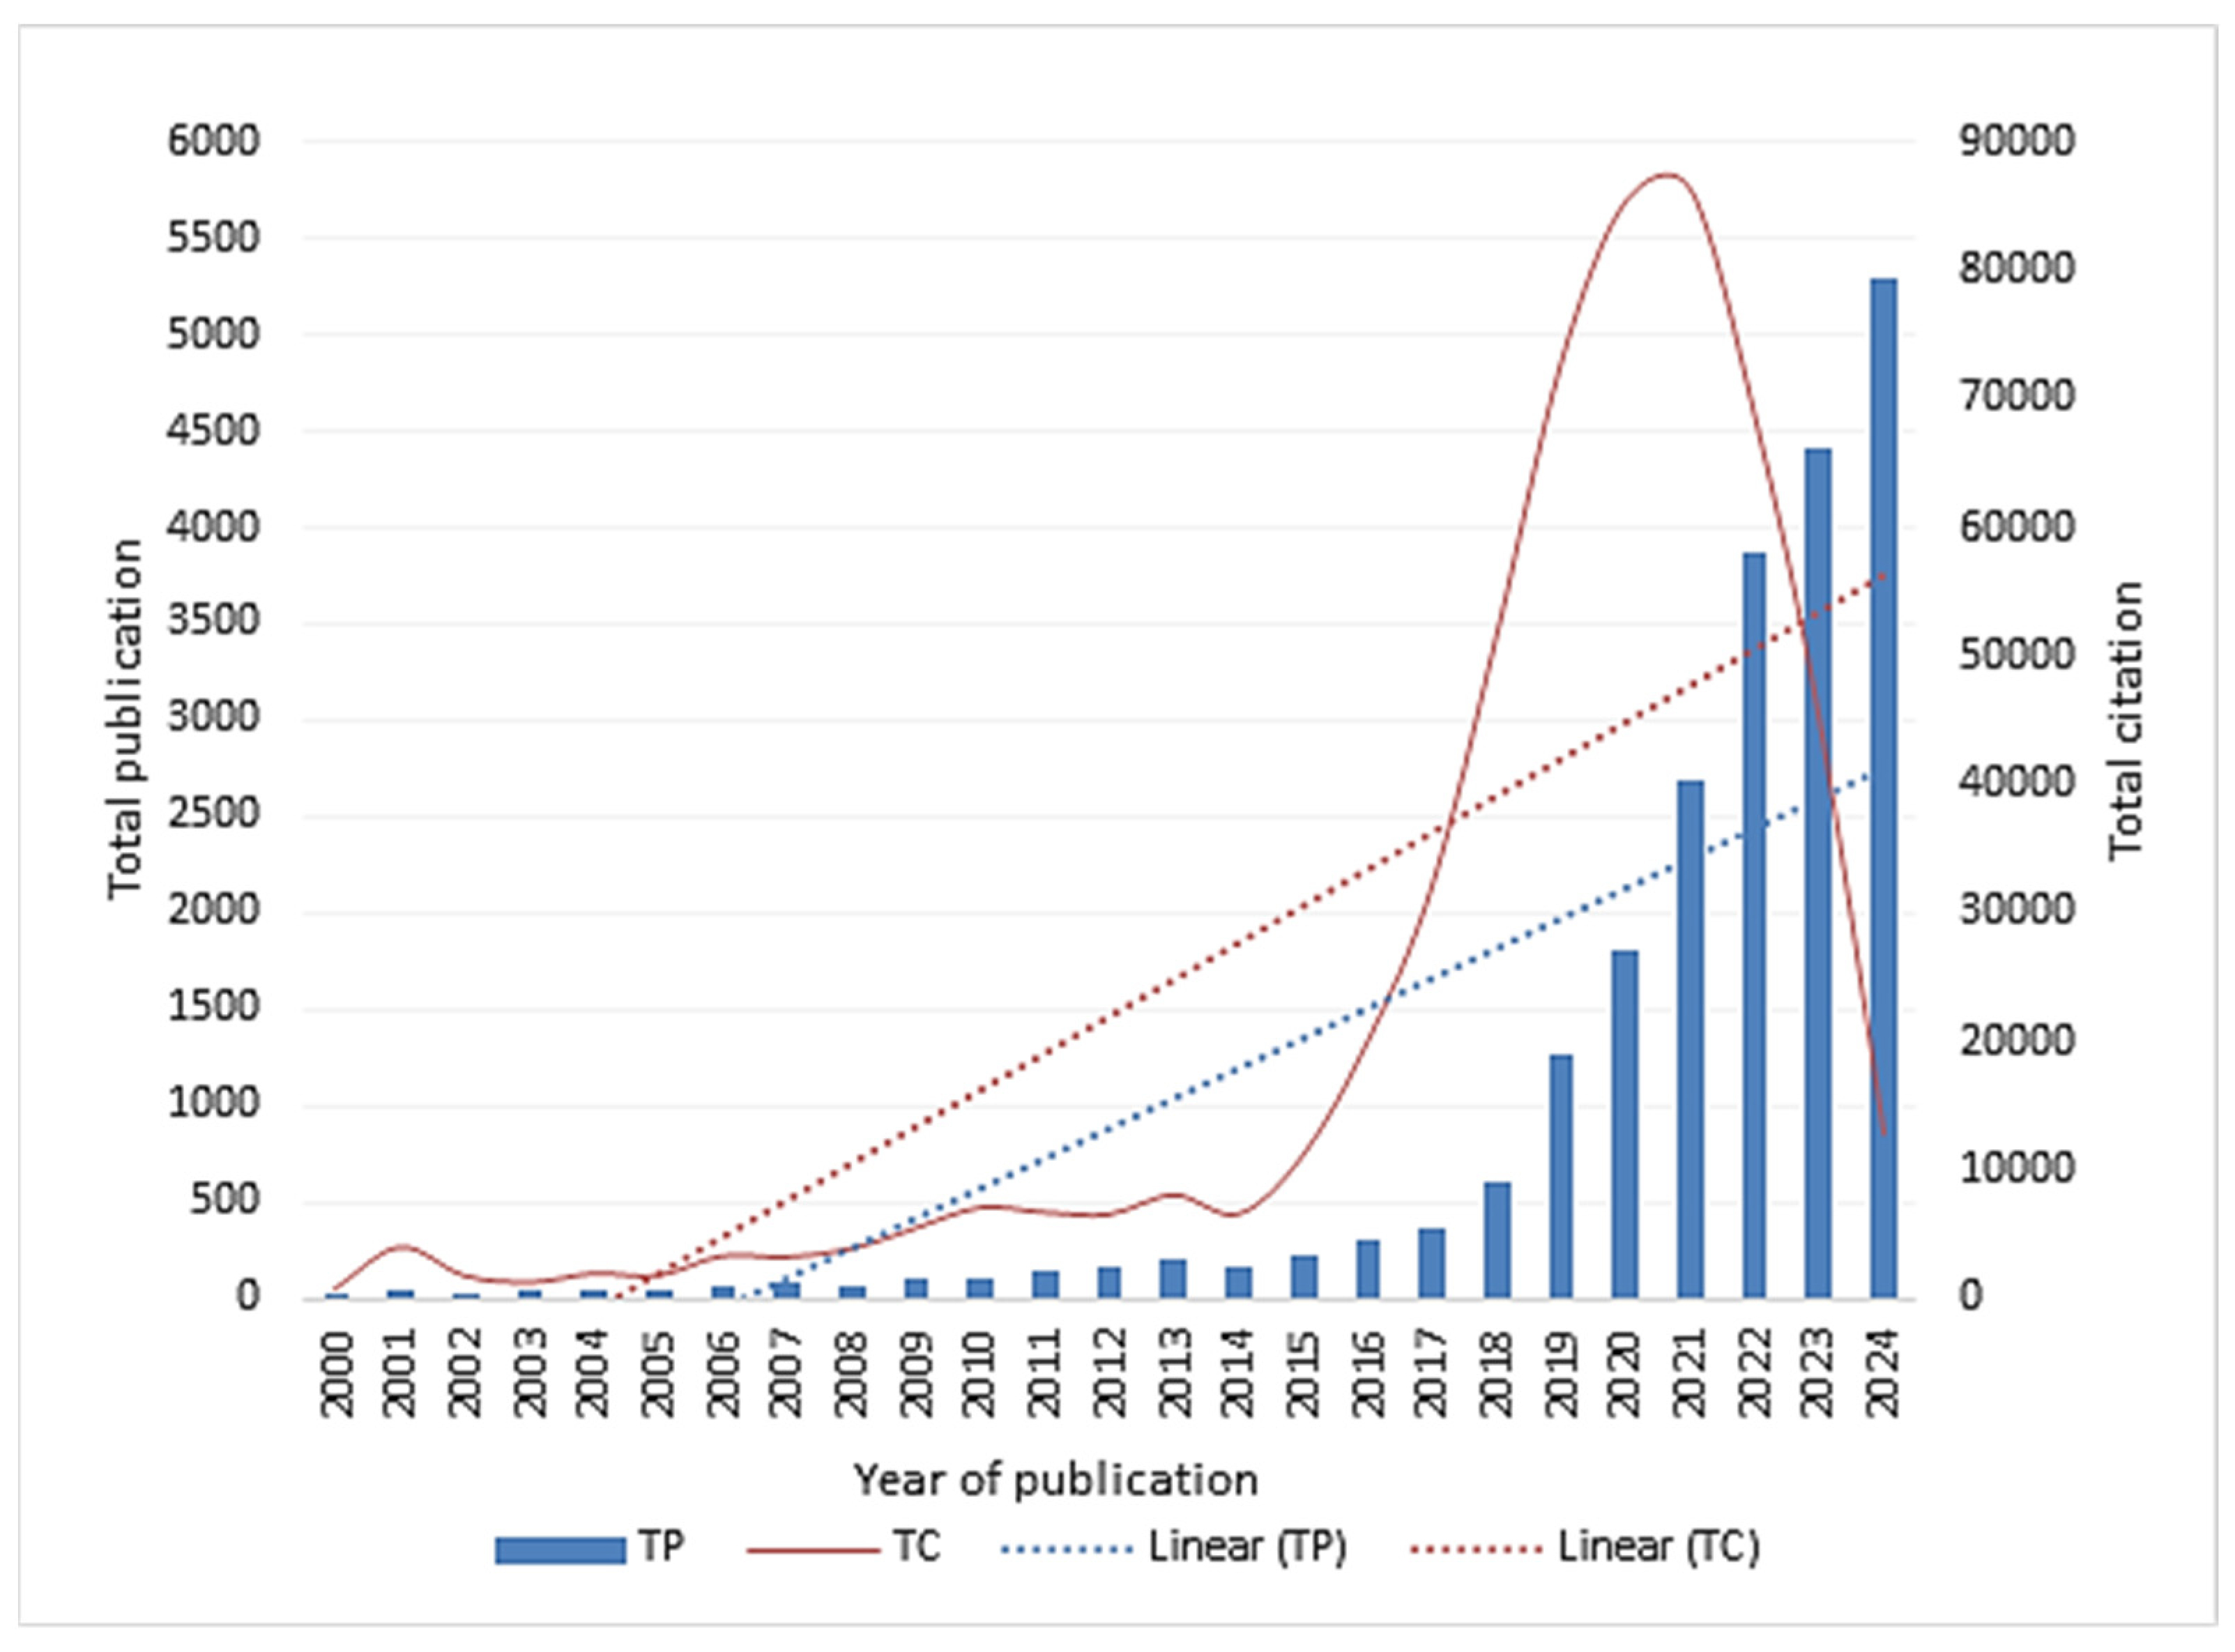
Figure 2 presents the annual publication and citation trends from 2000 to 2024. The trend analysis indicates a steady increase in the total number of publications over time. The number of citations received by articles in this field has grown significantly over the years, starting from 694 in 2000 and reaching 86,284 in 2021. This indicates a substantial increase in the recognition and impact of the subject over time. The number of citations accelerated as the years progressed. For example, the number of citations increased dramatically from 2015. This linear growth suggests that the work gained increasing attention and influence as time went on. The steep increase in the number of citations, especially in the later years, resembles an exponential growth pattern. Exponential growth is an indication of widespread recognition of the topic investigated.
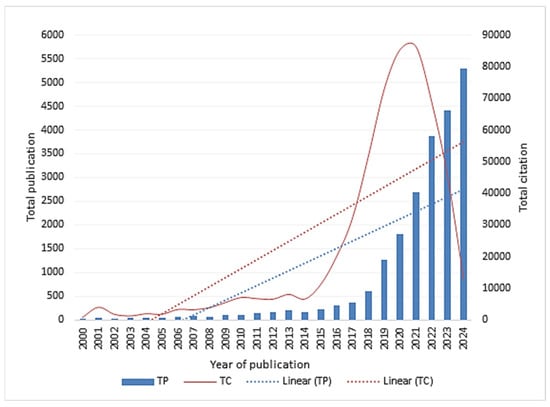
Figure 2.
Annual publication and citation trends from 2000 to 2024.
Table 2 presents the main bibliometric indicators of publications by the year of publication. Overall, all bibliometric indices have improved over the years of publication. The number of publications ranged between 26 in 2000 and 5300 in 2024.
Table 2.
Bibliometrics by the year of publication for total publications.
3.3. Most Prolific Countries and Global Research Collaboration
As shown in Table 3, the United States emerges as the leading contributor to research in this field, accounting for 4752 articles, representing 21.5% of the total output. China ranks second with 4637 articles (21.0%), followed by India with 4000 articles (18.1%). The United Kingdom and Saudi Arabia also demonstrate notable contributions, with 1402 (6.3%) and 1128 (5.1%) articles, respectively.
Table 3.
A bibliometric analysis of the 20 most collaborated countries.
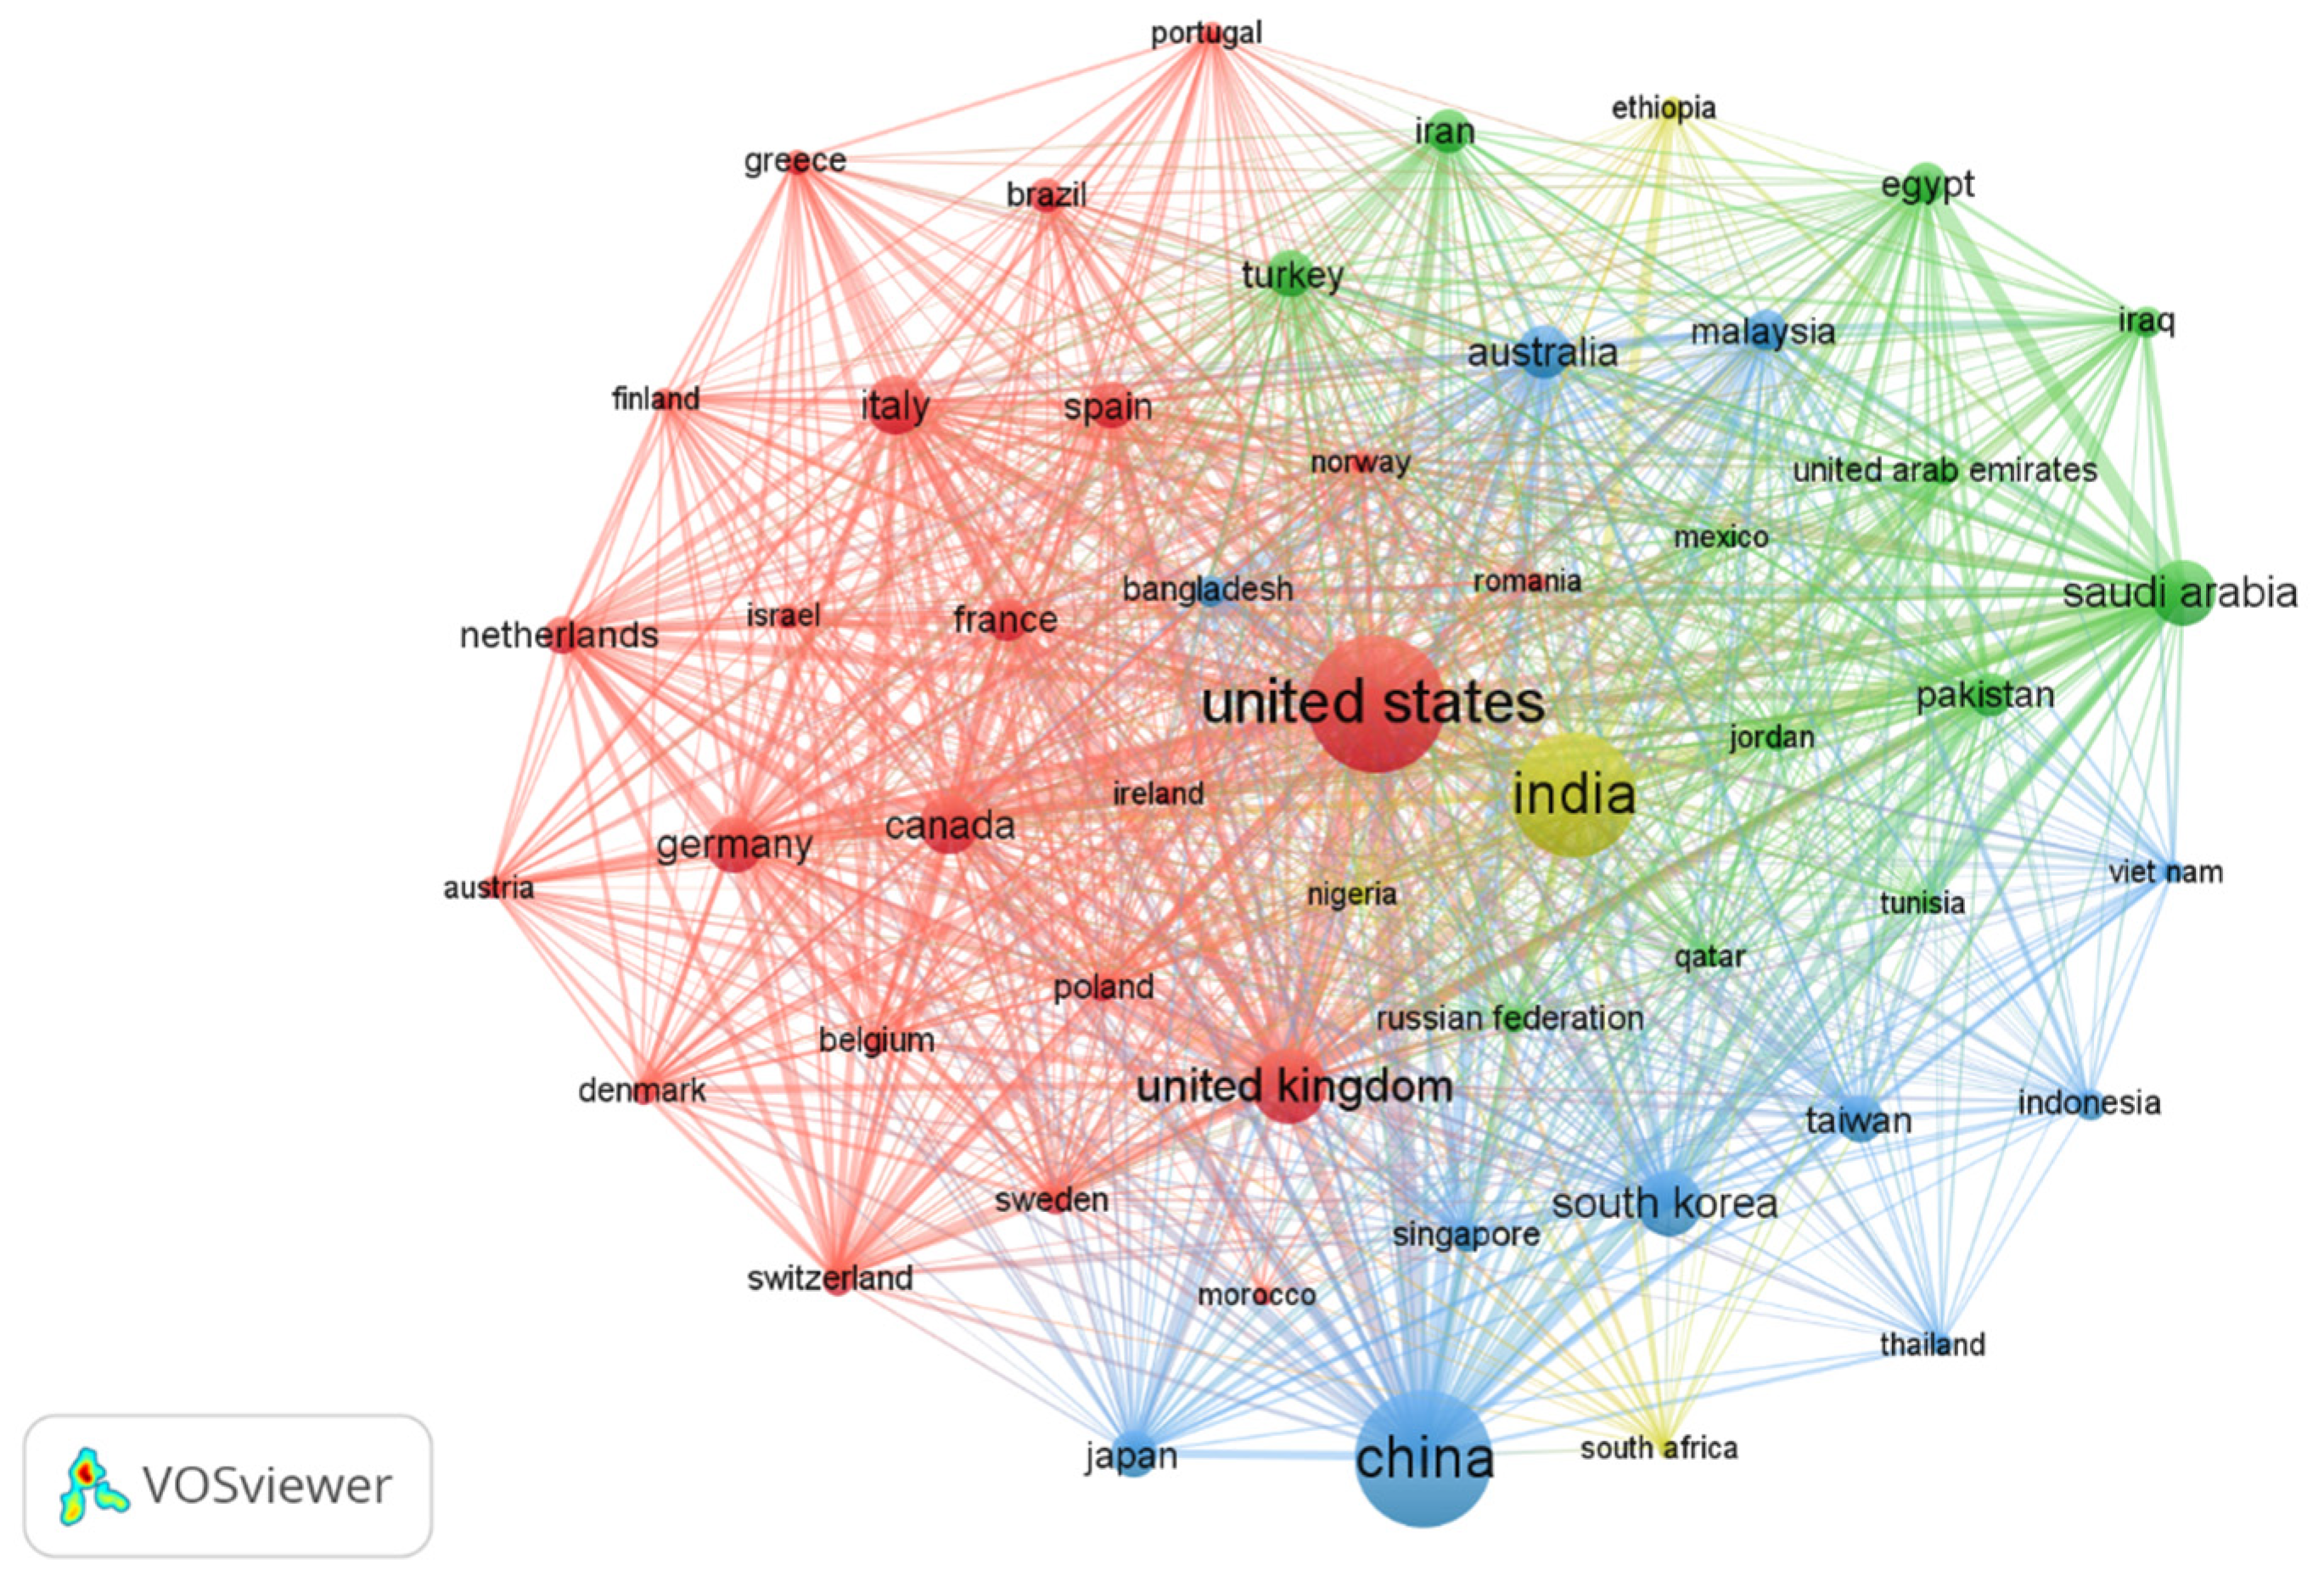
The network visualization map of countries, which considers countries with a minimum contribution of 88 articles, provides valuable insights into the dynamics of global research collaboration within a specific field (Figure 3). Within this map, a total of 50 countries are represented in this network, and noteworthy observations emerge. Primarily, the United States plays a significant role, exhibiting the highest number of connections and occupying a prominent position in the network. This highlights its significant research contributions and extensive collaborative efforts in the domain. The significant role of the United States in global research collaboration is evident from its extensive network connections (Links = 49, TLS = 3342), positioning it as a key facilitator of international scientific cooperation. A particularly noteworthy finding is the strong research partnership between the United States and India, as indicated by the substantial link strength between these nations (Links = 49, TLS = 1841). This reflects a high degree of scholarly engagement and exchange, reinforcing the global nature of scientific research. Additionally, the United Kingdom (Links = 49, TLS = 2125) and India (Links = 49, TLS = 1730) emerge as significant collaborators with the United States, further highlighting the importance of cross-border scientific cooperation in advancing research within this field. Interestingly, Saudi Arabia (Links = 49, TLS = 1706) stands out on the map with a large node size. This suggests that Saudi Arabia has made substantial contributions to research within the field and has its network of collaborations with various countries. Notably, the map highlights a particularly strong research partnership between Saudi Arabia and India. This collaboration underscores the active exchange of knowledge sharing and expertise between researchers and institutions in these two countries, further enriching the global research landscape in this domain. Cooperation between countries/regions has promoted the development of research.
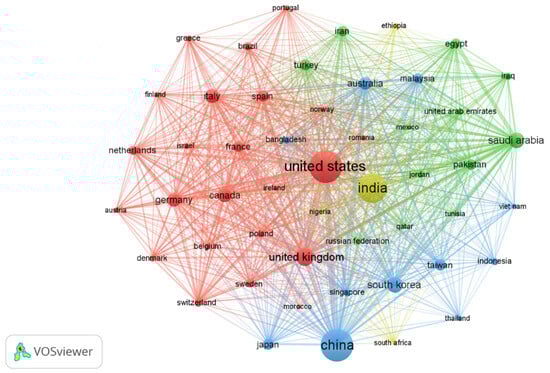
Figure 3.
Network visualization map for co-authorship international collaboration. Minimum number of publications of a country = 88, minimum number of citations of a country = 0. Of the 139 countries, 50 meet the thresholds.
3.4. Most Prolific and Impactful Institutions and Journals
According to the total number of publications, the top 20 institutions are listed in Table 4. With 292 papers (1.3%), Harvard Medical School was the most productive institution. The Ministry of Education of the People’s Republic of China came in second with 274 articles (1.2%), and the Chinese Academy of Sciences came in third with 219 articles (0.99%). Twenty institutions published at least 125 articles in all. It is interesting to note that six of the top 20 universities are in the US.
Table 4.
Bibliometric analysis of the 20 most prolific institutions.
There were core journals that had a pivotal role in the field (Table 5). Scientific Reports led the pack with 521 articles, accounting for 2.4% of the publications in the field. Right on its heels is IEEE Access, contributing significantly with 491 articles, making up 2.2% of the articles. PLoS ONE takes a noteworthy position, featuring 289 articles (1.3%), while the Applied Sciences (Switzerland) journal follows closely with 203 articles (0.92%).
Table 5.
Bibliometric analysis of the 20 most prolific journals.
3.5. Authors’ Publication and Collaboration Analysis
Following Lotka’s law, we used Biblioshiny to analyze the distribution of author productivity and publication frequency to examine the relationship between authorship and research output. The findings indicate that most authors (n = 60,563) have contributed a single publication, while 14,816 authors have published between two and ten articles. In contrast, a small group of 788 authors has produced more than ten publications. Table 6 presents the 20 most prolific authors from a total of 76,167, ranked according to their total number of publications (TP). Each of these top authors has contributed at least 117 articles, with publication counts ranging from 117 to 347. Wang Y is identified as the most productive author (TP = 347; 2.0%), followed by Li Y (TP = 274; 1.8%) and Liu Y (TP = 256; 1.8%).
Table 6.
Most relevant authors.
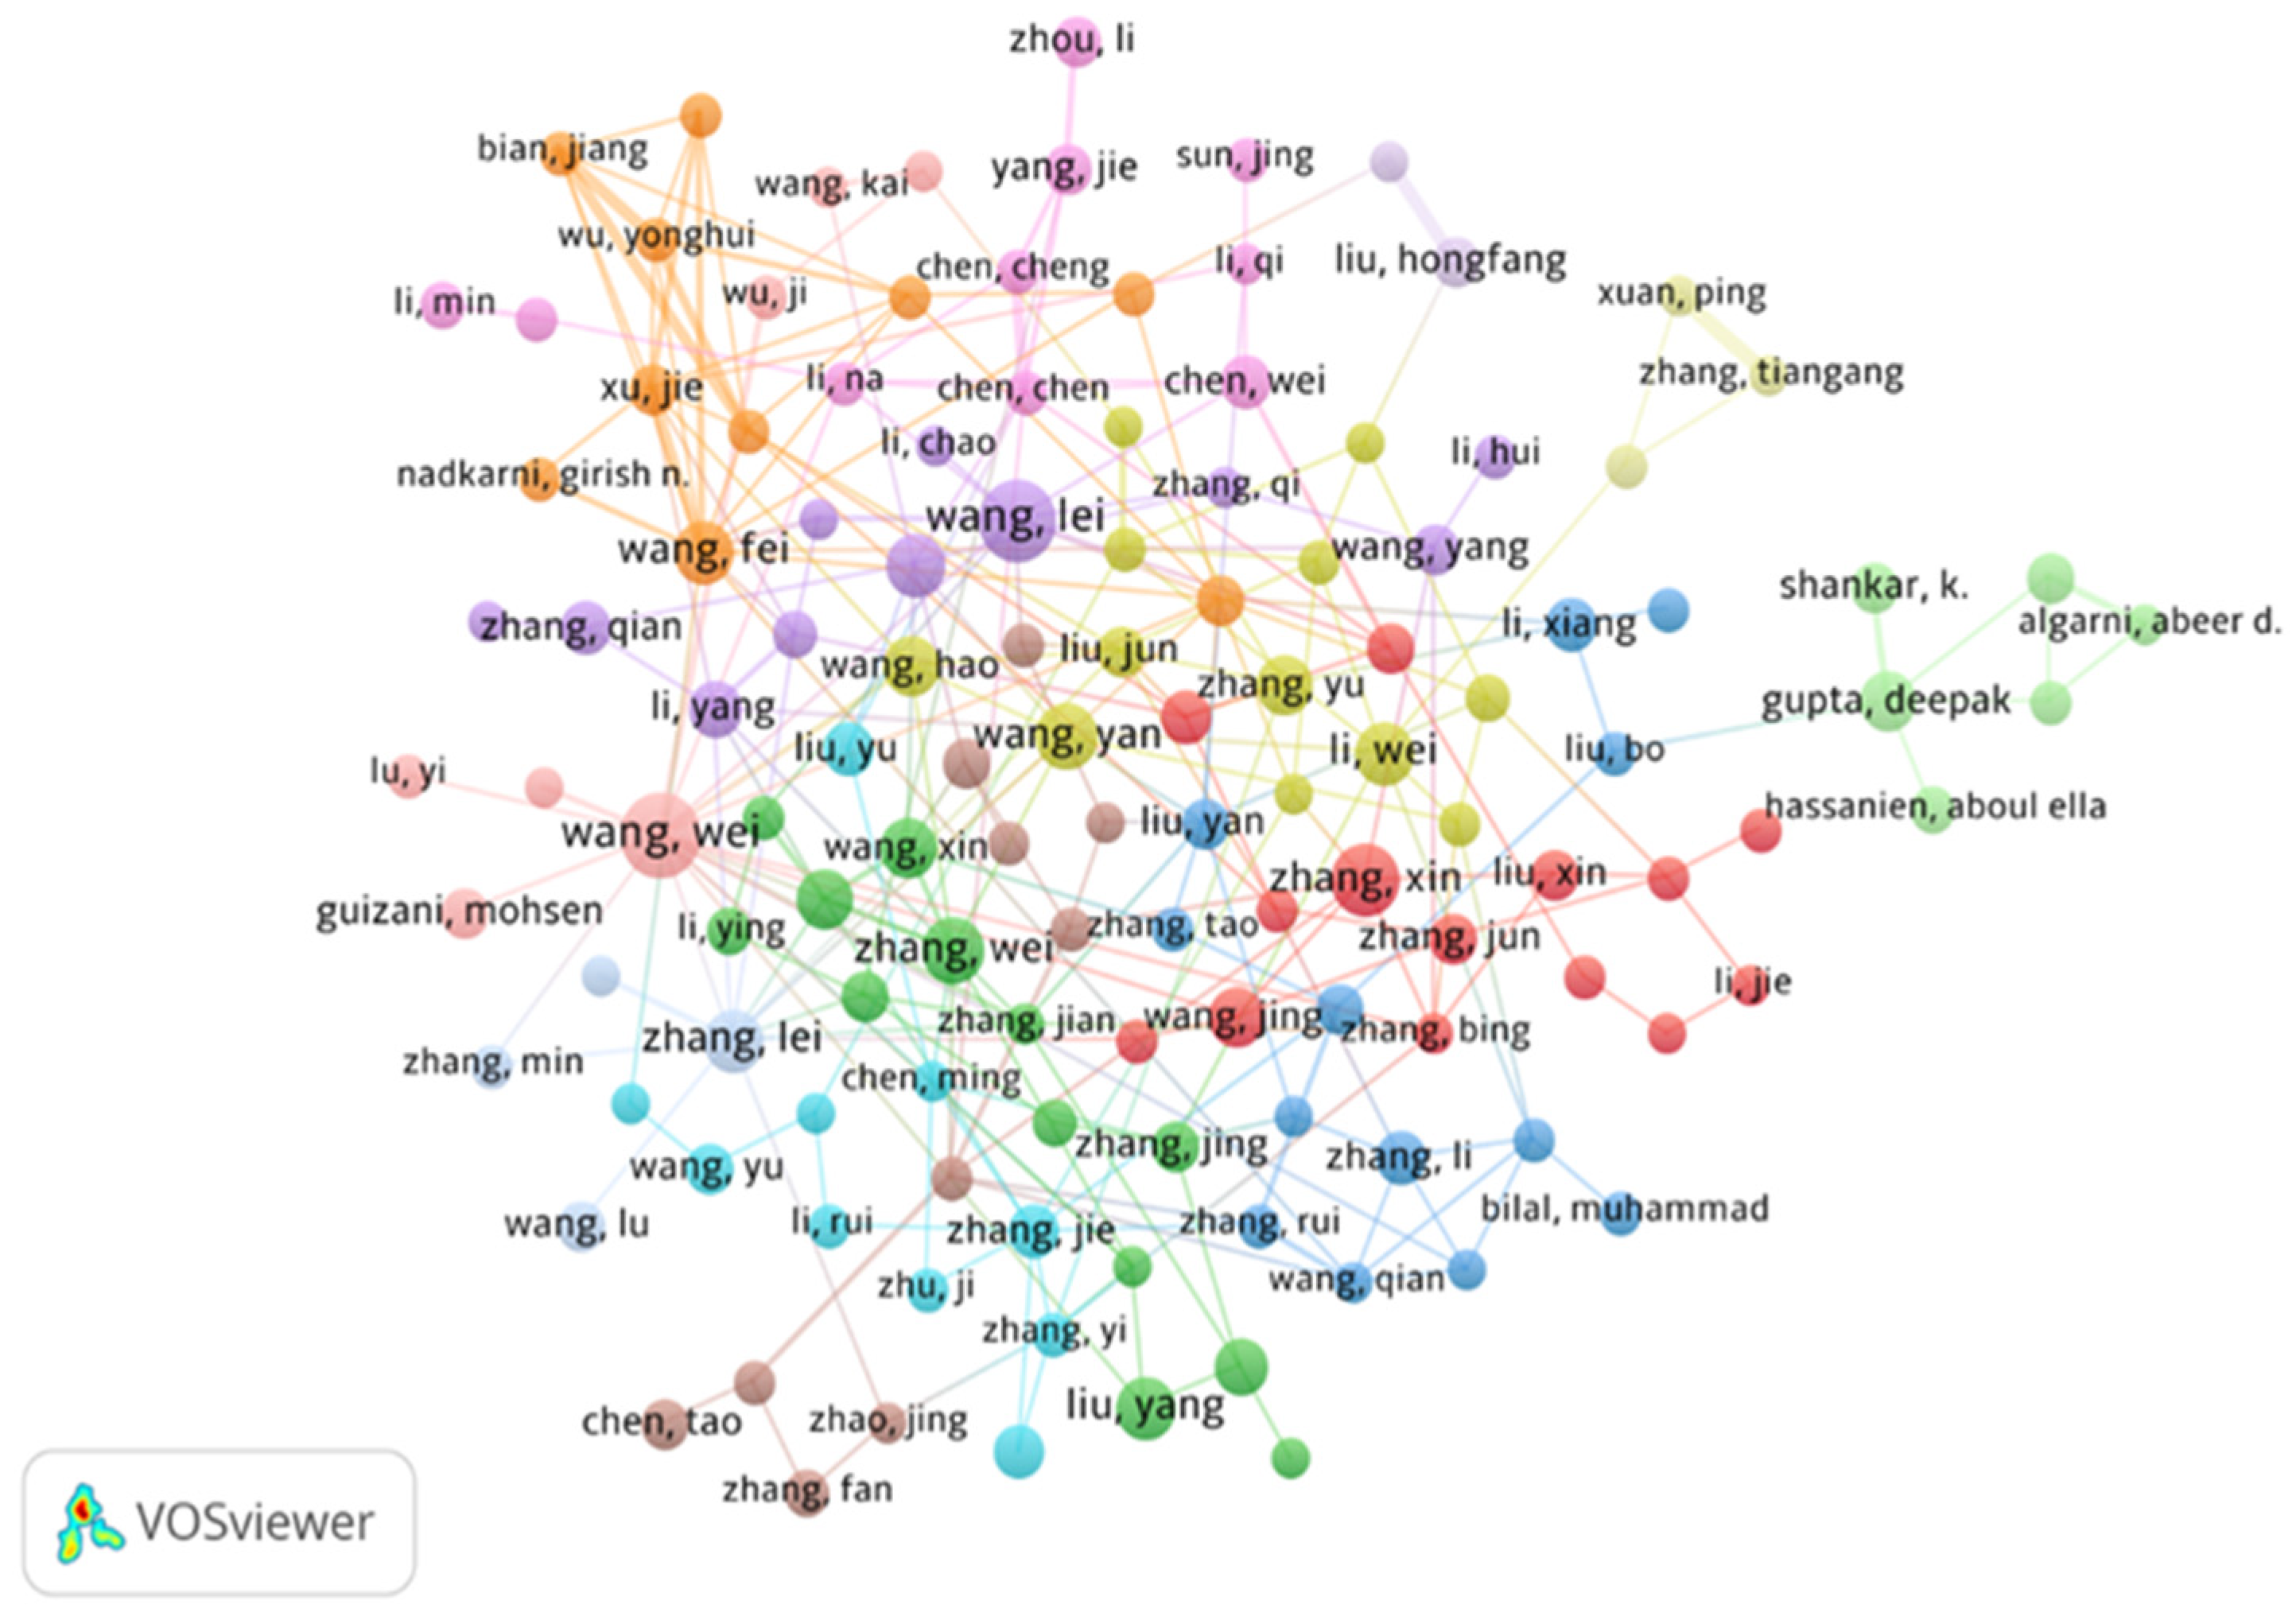
In terms of total citations (TC) and impact indices, which consider career length, Zhang Y emerges as the most influential author (TC = 9839; h-index = 38; g-index = 95), followed by Wang J (TC = 7994; h-index = 33; g-index = 86) and Liu Y (TC = 7853; h-index = 39; g-index = 84). To further refine the bibliometric assessment, a network visualization analysis was conducted (Figure 4). In the co-authorship network, authors are represented as nodes, where connections signify co-authored publications, and the thickness of the lines reflects the strength of collaboration. The analysis focuses on authors with a minimum of ten publications, without a citation threshold. Overall, the network map identifies 125 authors organized into 14 clusters, providing insights into collaborative structures within the field.
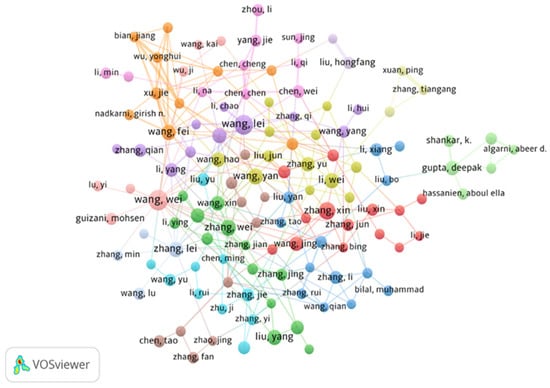
Figure 4.
VOSviewer network of author co-authorship maps weighted by the number of articles (minimum number of publications of an author = 10, citation = 0, clusters = 14). Of the 76,167 authors, 174 met the thresholds: of them, 125 collaborated. Because some names may overlap, others may not be shown.
3.6. Most Impactful and Visible Research Topics
An article’s scientific impact and visibility are reflected in the number of citations it has received. The most influential research subjects were determined by analyzing the top 50 cited articles to determine which ones were the most visible and impactful in the area. Deep learning in medical imaging, disease prediction and diagnosis using AI, AI in electronic health record (EHR) analysis, AI for COVID-19 detection and diagnosis, explainability and trust in AI for healthcare, federated and privacy-preserving AI in medicine, personalized medicine and AI-based treatment optimization, and AI-powered genomics and drug discovery are the most significant and well-known research topics in AI and ML in medicine and health, according to the top 50 cited recent articles.
3.7. Emerging Research Topics
The dataset’s most recent publications featured several studies that integrate multiple emerging research areas. Among these studies and based on the recently published 50 articles, the most emerging research-related fields include AI and ML in disease prediction and diagnosis, explainable AI (XAI) in healthcare, AI in medical imaging and radiology, natural language processing (NLP) in smart healthcare, blockchain and cybersecurity in healthcare, IoT and edge AI in medical and bioinformatics applications, AI in precision medicine and biomarker discovery, AI for environmental and public health applications, AI in drug discovery and FDA-approved medical devices, AI in structural health monitoring, and smart cities.
3.8. Keyword Analysis
3.8.1. Most Investigated Topics (Research Hotspots)
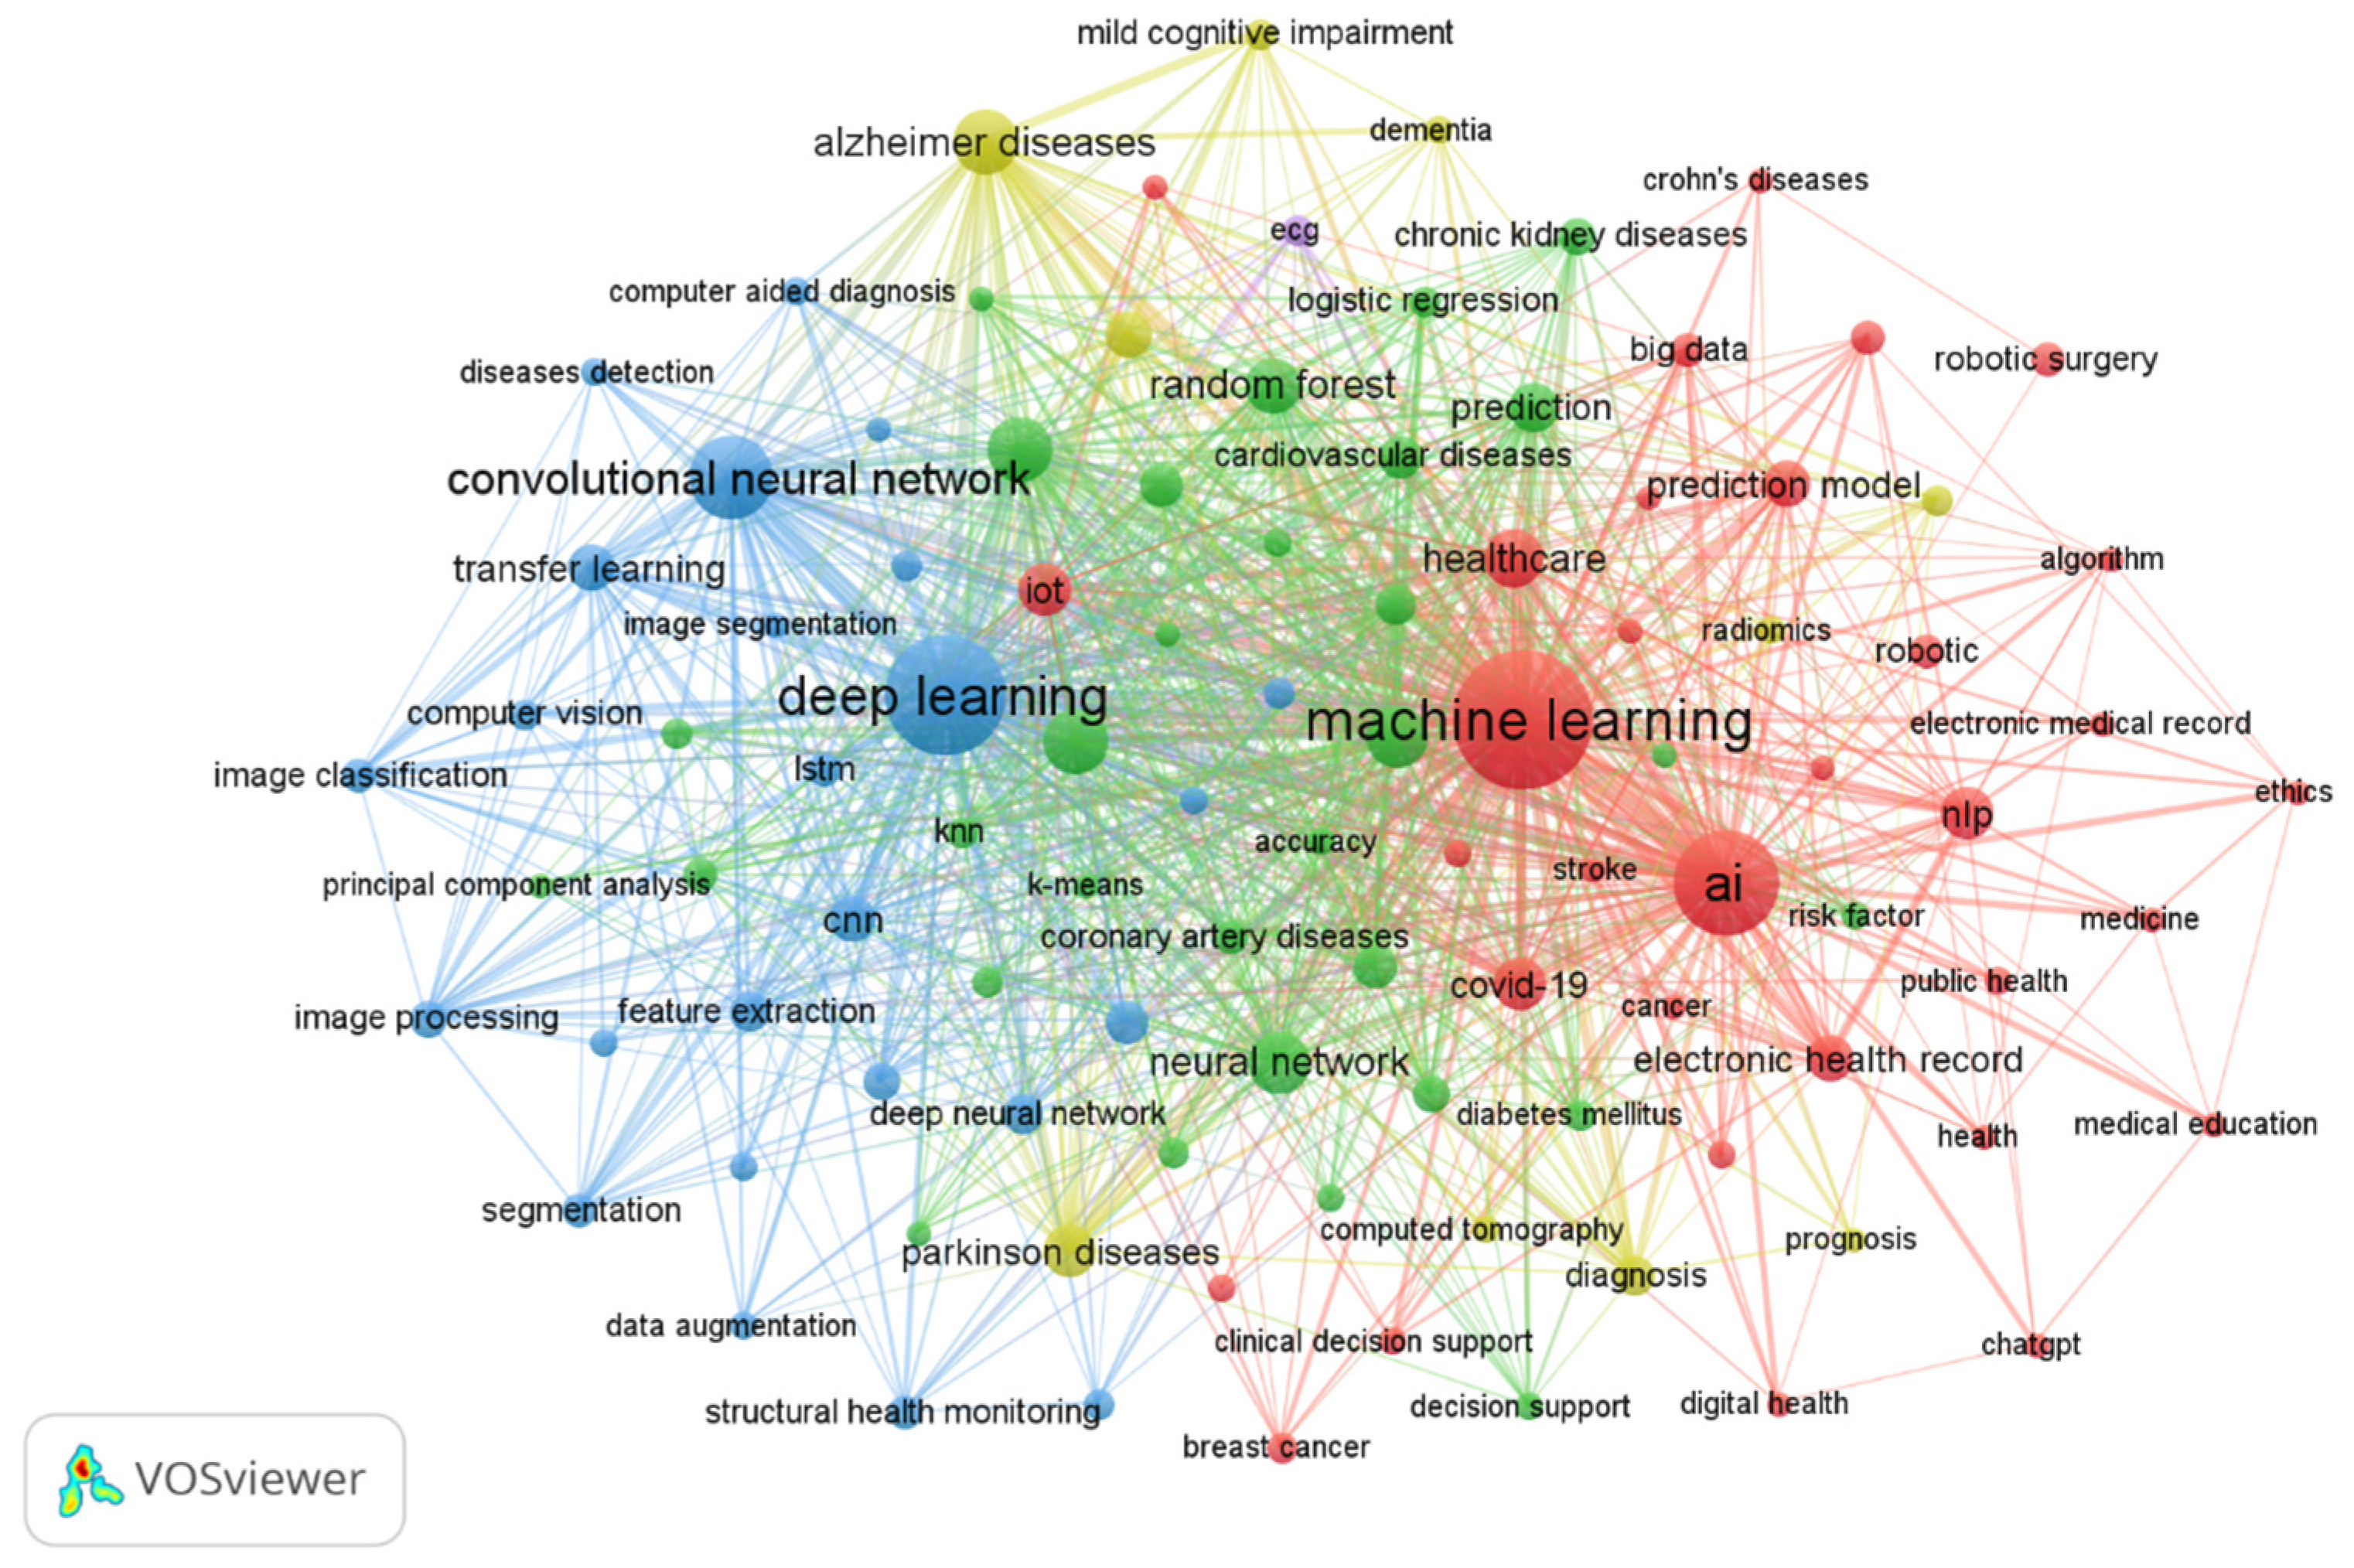
By generating a network visualization map of author keywords, focusing on those appearing at least 17 times, we constructed a map comprising 100 distinct keywords (Figure 5). Within this network visualization map, the nodes rendered in the largest size correspond to the most commonly recurring items found within the literature, signifying key research focal points. The following list presents these prominent research hotspots, as visually depicted in the map, and based on the number of occurrences and TLSs provided by the VOSviewer program:
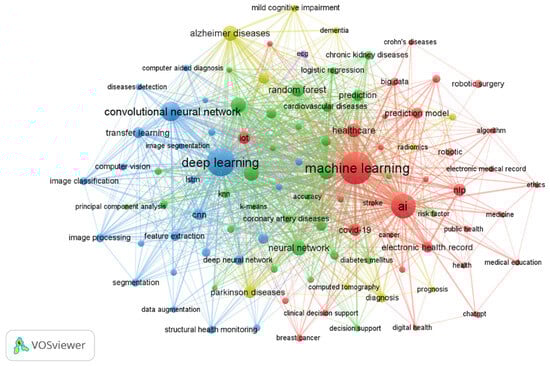
Figure 5.
Co-occurrence analysis of authors’ keywords. The minimum number of occurrences of a keyword = 17; 100 meet the threshold.
- Machine learning and deep learning (8978 Occurrences, TLS: 13,113);
- Artificial intelligence (2745 Occurrences, TLS: 3784);
- Convolutional neural network (1540 Occurrences, TLS: 2393);
- Classification (857 Occurrences, TLS: 1906);
- Artificial neural network (775 Occurrences, TLS: 881);
- Prediction and modeling (754 Occurrences, TLS: 1502);
- Support vector machine (745 Occurrences, TLS: 1537);
- Healthcare AND clinical decision support (706 Occurrences, TLS: 880);
- Natural language processing (470 Occurrences, TLS: 672);
- Electronic health record (384 Occurrences, TLS: 685);
- Specific diseases (Ailments): Several specific diseases were explored in the dataset:
- -
- Alzheimer’s disease (823 Occurrences, TLS: 1552);
- -
- Parkinson’s disease (502 Occurrences, TLS: 804);
- -
- COVID-19 (479 Occurrences, TLS: 840);
- -
- Cardiovascular diseases (287 Occurrences, TLS: 603);
- -
- Heart diseases (275 Occurrences, TLS: 697);
- -
- Chronic kidney diseases (191 Occurrences, TLS: 360);
- -
- Coronary artery diseases (183 Occurrences, TLS: 324);
- -
- Breast cancer (125 Occurrences, TLS: 225);
- -
- Diabetes mellitus (123 Occurrences, TLS: 284);
- -
- Dementia (101 Occurrences, TLS: 245);
- -
- Depression (92 Occurrences, TLS: 165);
- -
- Crohn’s disease (79 Occurrences, TLS: 96);
- -
- Stroke (73 Occurrences, TLS: 94).
3.8.2. Conceptual Structural Map of a Field: Thematic Map and Thematic Evolution
The primary goal of the thematic map examination was to intuitively analyze the development of themes in AI and ML-related research in health and medicine between 2000 and 2024. To do this, we built a two-dimensional matrix using the conceptual network and divided it into four distinct quadrants based on the centrality and density of themes (Figure 6a).
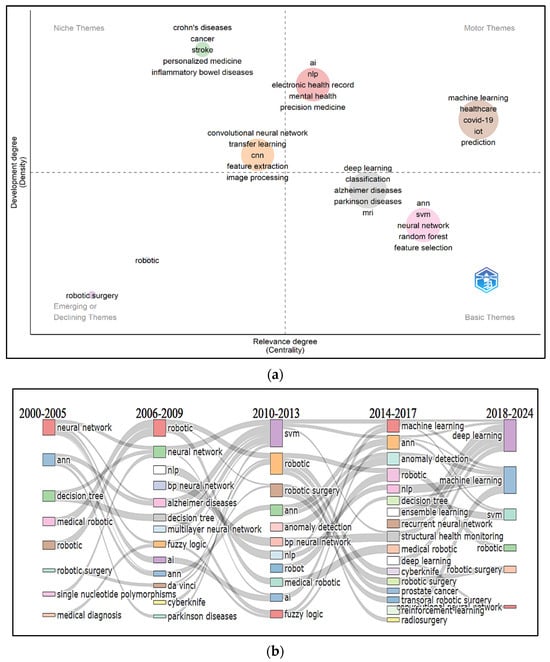
Figure 6.
(a) Thematic analysis map developed by using a conceptual structure for authors’ keywords. (b) Thematic evolution of each topic and theme under five time slices. A longitudinal representation is adopted to facilitate an understanding of the tendencies of certain topics to merge with other themes or split into several other themes over the study period.
In the upper-left quadrant, labeled as ‘Niche Themes’, we find highly developed themes that remain isolated. These themes have strong internal connections but do not connect well with others, which limits their broader significance. The themes elucidated in this quadrant are related to several topics, the most frequent being “Crohn’s disease”, “cancer”, “stroke”, “personalized medicine”, “inflammatory bowel diseases”, and “CNN”. The lower-left quadrant, called ‘Emerging or Declining Themes’, highlights themes with both low density and centrality, suggesting they are not well-developed or may be losing relevance. This quadrant includes themes like “robotic” and “robotic surgery”. The upper-right quadrant, referred to as ‘Motor Themes,’ is where we see themes with both high density and centrality. These themes are well-developed, highly relevant, and connected to others. Key themes in this quadrant include topics like the “electronic health record”, “mental health”, “precision medicine”, “COVID-19”, and “IoT”. Finally, the lower-right quadrant, known as ‘Basic Themes,’ represents foundational and transversal themes. These are important for further study but have not been fully developed yet. The themes displayed in this quadrant are “deep learning”, “classification”, “Alzheimer’s disease”, “Parkinson’s disease”, “MRI”, “SVM”, “neural networks”, “Random Forest”, and “feature selection”.
Alluvial graphs were created by splitting the time into various time slices to better clarify the theme evolution within the subject field under investigation. We determined five time slices based on the distribution of articles annually, with four cutting points established in 2005, 2009, 2013, and 2017. Most of the extracted papers in the first time slice of 2000–2005 concentrate on the early applications of AI and robotics, as can be seen in Figure 6b: “ANN”, “decision tree”, “robotic and robotic surgery”, and “medical diagnosis”. In the second time slice (2006–2009), studies emphasize the expansion into medical AI and NLP. AI has begun to be applied in medical contexts, including neurodegenerative diseases (“Alzheimer’s disease” and “Parkinson’s disease”). Robotics, particularly in surgery (e.g., “Da Vinci system”), have gained prominence. In the third time slice (2010–2013), “SVM”, “robotic surgery”, “anomaly detection”, and “fuzzy logic” emerge as key themes. This period sees the rise of machine learning models and a focus on robotic-assisted surgery. In the fourth time slice (2014–2017), research continues to emphasize deep learning and AI in healthcare, with an increased focus on deep learning and neural networks in health applications, including cancer diagnosis, robotic surgery, and radiosurgery. In the last time slice (2018–2024), studies have a more oriented exploration of key themes: “deep learning and machine learning”, “SVM”, “robotic surgery”, and “convolutional neural network”.
4. Discussion
By examining the pertinent literature, we performed a bibliometric analysis for this study. From the standpoint of trends in the quantity of publications and citations, as well as the collaboration of nations and regions, the quantity of publications and collaboration of authors, journals, and cited journals, as well as keywords, we have examined the present research overall in this field. This study’s significance lies in its contribution to understanding the evolving trends, key contributors, and key research themes associated with the field. By employing bibliometric analysis, this study not only quantifies scholarly output but also identifies key research themes and their interrelationships. Furthermore, the incorporation of advanced metrics, such as keyword mapping, offers a multidimensional understanding of international research networking and research hotspots, contributing to the field’s advancement.
Regarding the number of publications, the yearly output of academic articles in this area generally showed an upward tendency, with a notable uptick in 2021 as a result of the COVID-19 pandemic. The fact that it continues to maintain a high number of publications suggests that this subject of study is still highly valuable and a hotspot. The upward trend in publications and citations aligns with the global increase in AI research in health and medicine [18].
The United States, China, and India were the top three countries in terms of publications and citations in the examination of nations in the research domain. This conclusion is consistent with a recent study that demonstrates the growing importance of donors from nations including the United States, India, and China [28]. This demonstrates the broad recognition of AI’s potential to significantly transform healthcare and underscores the importance of international collaboration in advancing the field. Furthermore, according to the most recent study, the United States has a major influence on the area and is now the top creator of scholarly papers [29]. The distribution of active countries serves as a stark reminder of the existing imbalance in research engagement between affluent destination nations and low- to middle-income source countries. Notably, scholarly contributions heavily favor WHO regions encompassing the Americas and Europe, while regions like Africa and the Eastern Mediterranean exhibit limited involvement in research endeavors. Several EMR countries, particularly low- and middle-income nations, are underrepresented in the research landscape. Factors such as political instability, limited funding, insufficient infrastructure, and lack of expertise hinder their participation. These challenges result in a low research output and limited visibility on the global stage. Efforts to enhance research capabilities in low-productive countries could include targeted funding, capacity-building programs, and the development of regional research networks [30]. Further, encouraging collaborations between well-resourced institutions and those in less developed areas can foster knowledge transfer and support local innovation [31,32]. The top countries must make a deliberate effort to share their knowledge and collaborate with these countries in future research endeavors.
The main groups in charge of advancing this area of study can be identified by looking at institutional connections. Outstanding research output is produced by establishments like King Saud University and Harvard Medical School. These important revelations support the development of interdisciplinary partnerships and cooperative networks to further research into AI-driven healthcare innovation. These findings are consistent with a prior study that indicated Harvard Medical School and King Saud University were the most productive institutions [28]. Furthermore, the Harvard Medical School had the most publications of any university, according to the most current study [29].
The thematic mapping revealed distinct research clusters, each representing a key thematic area in AI and ML research in healthcare. The map outlines the research themes and results in the identification of eight distinct thematic clusters that were micro-examined as follows:
The niche themes have two clusters with several hot topics as mentioned before in Figure 6a. The most cited studies within these clusters discuss the EMG-triggered robotic therapy system for stroke rehabilitation, which assists patient movements based on muscle activation to enhance motor recovery [33]. Another study presents a deep convolutional neural network for classifying interstitial lung disease patterns in CT images, achieving high accuracy in distinguishing between different lung abnormalities [34]. The topics in the motor themes are critical to the field and exhibit strong interconnections with other themes. These themes reflect ongoing trends in healthcare, where AI and ML play a significant role in improving diagnostic accuracy, treatment strategies, and patient outcomes. The most cited studies in those clusters explore AI applications in healthcare, categorizing them into virtual (informatics and decision support) and physical (robotics and nanotechnology) branches while addressing historical evolution, ethical concerns, and future implementation strategies [35]. A study presents a convolutional neural network-based multimodal disease risk prediction (CNN-MDRP) algorithm that analyzes both structured and unstructured hospital data to predict chronic diseases, achieving a prediction accuracy of 94.8% [36]. The emerging/declining themes have low centrality and low development, meaning they are either emerging or losing relevance. Despite their low density and centrality, these topics are still relevant in certain healthcare contexts. Future research could explore why these themes have not gained widespread traction and could involve investigating the technological, clinical, or financial barriers to their broader adoption. The most cited studies in those clusters explored and compared robotic versus fluoroscopy-guided pedicle screw insertion for metastatic spinal disease, assessing accuracy, safety, and clinical outcomes in a matched-cohort analysis [37]. They also evaluated the efficacy, benefits, and limitations of robotic and laparoscopic surgery for colorectal diseases, focusing on surgical precision, patient outcomes, and procedural feasibility [38]. The topics in the basic themes are fundamental to advancing AI and ML in healthcare and are crucial for future breakthroughs. Future research could focus on developing new deep learning architectures tailored to specific healthcare problems, such as improving early-stage diagnosis of diseases like Alzheimer’s or exploring novel classification methods for better medical imaging outcomes. The most impactful studies in those clusters explore adversarial attacks on deep learning-based medical image analysis systems, highlighting vulnerabilities, attack methods, and their implications for clinical reliability. It also discusses potential defense strategies to enhance the robustness and security of AI-driven medical imaging applications [39] and emphasizes the use of random forest-based similarity measures to improve the multi-modal classification of Alzheimer’s disease, enhancing diagnostic accuracy [40]. AI-driven models such as machine learning fuzzy logic are increasingly used for CKD detection, progression prediction, and personalized treatment plans [41,42]. AI-based radiology tools and predictive analytics are advancing the diagnosis and treatment of diseases such as tuberculosis, pneumonia, and influenza [43,44,45]. AI is being integrated into diagnostic processes for urinary tract infections (UTIs) and other related conditions, improving accuracy and early detection [46].
The thematic evolution shows a transition from basic neural networks and decision trees to advanced AI models, such as deep learning and reinforcement learning. Thematic shifts align with technological advancements, particularly in robotics and AI-driven healthcare solutions. The growing complexity of machine learning techniques indicates an increasing reliance on AI for precision medicine and automated decision-making. Recently, the combination of digitalization, artificial intelligence (AI), and robotics in healthcare has garnered considerable interest. These technological advancements are reshaping healthcare delivery, enhancing both care quality and efficiency. Recent research has emphasized the complex effects of these innovations. A recent study examines the relationship between AI, robotics, and policy within healthcare systems. It outlines how digitalization and AI can enhance care delivery and workforce interactions while providing policy suggestions for the smooth integration of these technologies into current healthcare structures. The study underscores the necessity of strategic alignment between technology and healthcare policy to achieve a fair and effective implementation across diverse healthcare sectors [47].
The current study looked closely at research trends and potentials. The use of AI in radiology is the subject of extensive research [48]. Present models concentrate on applying machine learning techniques to help process images, lower diagnostic mistakes, and increase the effectiveness of radiological imaging operations [49]. For instance, a study that was published in Nature showed that an AI model created by Google Health was able to identify breast cancer from mammograms more correctly than human radiologists [50]. The substantial potential of AI in the field of diagnostic imaging is demonstrated by this study [51]. Another significant area of study is pharmacogenomics, where AI offers individualized treatment plans according to a patient’s genetic composition, surroundings, and behavior. Advances in fields like pharmacogenomics are being used by AI-powered systems, like the AI tools that predict how patients will react to different cancer therapies, to create accurate predictive models of potential treatments [52]. A major trend during the COVID-19 pandemic was telehealth, where artificial intelligence (AI) improved remote patient monitoring (RPM), specifically virtual care [53]. The use of chatbots and virtual assistants in Babylon Health and other services is one example of this [54]. These technologies increase the population’s access to healthcare by giving consumers preliminary diagnoses and health recommendations. These subjects are seen as promising because they may help with some of the problems facing healthcare, like the increasing strain on healthcare systems, the need to raise service quality, and the need for individualized care. These themes, which highlight patient-centered, data-driven healthcare made possible by AI, have wide-ranging implications for future research. Developing these technologies, resolving their ethical issues, and incorporating them into other healthcare delivery systems will probably receive more attention. Growing interest in the topic and developments in other related areas of AI between 2015 and 2024 have led to a rise in articles about AI in healthcare.
It is clear from a closer look at the articles that a large amount of research and innovation has been concentrated on using machine learning (ML), especially in areas like medical imaging, diagnosis and treatment, and predictive analysis [55]. Large datasets, the processing power required to work with them, and improvements in algorithmic approaches have all contributed to the increased interest in these topics. The need to efficiently handle and glean insights from unstructured clinical data, like electronic health records (EHRs) and medical literature, has propelled the development of natural language processing [56].
Furthermore, the potential to enhance the AI-enabled functionality of robots has drawn attention to the field of healthcare robotics, including surgical assistant robots and other medical aid robots [57]. In healthcare systems, the introduction of new technologies like deep learning and data storage has simplified the process of resolving ever-more complex problems [58]. Furthermore, handling and analyzing enormous amounts of healthcare data has been made easier by the use of cloud computing and big data analytics. Research on innovative technological solutions for healthcare has expanded as a result of the COVID-19 pandemic’s increasing demand for digital health solutions. These elements have expanded the scope and perspectives of study in this quickly developing topic and raised the quantity of published resources pertaining to AI in healthcare.
Strengths and Limitations
The use of advanced bibliometric tools like VOSviewer and the R package “bibliometrix” allowed for detailed mapping of research trends, collaboration networks, and thematic evolution. These methodologies provided a comprehensive view of the research landscape and facilitated the identification of emerging areas of interest. Regarding the study’s limitations, several factors deserve consideration. Firstly, the reliance solely on the Scopus database presents a limitation. This singular source, although extensive, may not encompass the entirety of relevant articles in the field, potentially introducing bias into the selection of materials. Additionally, language and publication bias could have influenced this study’s findings. The inclusion criteria restricting articles to the English language might have inadvertently excluded valuable research published in other languages, potentially introducing language-related biases. Moreover, focusing primarily on primary research articles might have omitted valuable insights from comprehensive review articles. Although efforts were invested in validating the data, there remains the possibility of missing relevant articles, and the validation process may not be entirely foolproof, introducing an element of uncertainty. The quality assessment of the selected studies introduces potential subjectivity. The “citation lag” phenomenon affects the citation counts of recent publications, as they have had less time to accumulate citations. This should be considered when interpreting citation-based metrics, especially for newer studies. Although the bibliometric methodology employed here has some limitations, we believe that these findings offer full use of information to scientists and funding bodies regarding publication trends and ongoing collaborative work in this research field.
The thematic evolution shows a transition from basic neural networks and decision trees to advanced AI models, such as deep learning and reinforcement learning. Thematic shifts align with technological advancements, particularly in robotics and AI-driven healthcare solutions. The growing complexity of machine learning techniques indicates an increasing reliance on AI for precision medicine and automated decision-making.
5. Conclusions
This study explores the role of AI in health and medicine, providing an overview of its current state, identifying emerging trends, and evaluating its progression over time.
Key research hotspots include AI applications in disease prediction, diagnosis, machine learning, deep learning, and specific conditions such as Alzheimer’s, Parkinson’s, COVID-19, and cancer. Future research should focus on optimizing AI algorithms, ensuring clinical validation, and addressing ethical and implementation challenges. Interdisciplinary collaboration among AI researchers, clinicians, and policymakers is essential for translating AI advancements into real-world healthcare solutions.
International collaboration is a significant aspect of AI research, with the United States playing a leading role alongside India, the United Kingdom, and China. This cooperation fosters knowledge exchange and enriches the research landscape. Moving forward, validating AI-driven models in clinical settings while addressing ethical considerations, patient privacy, and data security will be crucial. Educating healthcare professionals on AI-driven healthcare and building trust in AI systems are also vital for successful integration into clinical workflows.
Future research should prioritize transparency, interpretability, and ethical standards while ensuring AI models are trained on diverse datasets to mitigate biases. Further exploration of AI in predictive analytics, personalized medicine, and telehealth is necessary to address emerging technological concerns. Expanding bibliometric analyses beyond citation metrics would also enhance our understanding of AI research dynamics. By adhering to these guidelines, the academic community can contribute to the responsible and beneficial application of AI in healthcare.
Supplementary Materials
The following supporting information can be downloaded at https://www.mdpi.com/article/10.3390/healthcare13080892/s1, Table S1: Search results from Scopus database.
Author Contributions
Conceptualization, A.M.A.-D.; methodology, A.M.A.-D.; software, A.A. and A.M.A.-D.; validation, A.D. and A.M.A.-D.; formal analysis, A.M.A.-D.; investigation, A.M.A.-D., A.A. and A.D.; resources, A.M.A.-D., A.A. and A.D.; data curation, A.D. and A.M.A.-D.; writing—original draft preparation, A.D. and A.M.A.-D.; A.D., M.A. (Mahmoud Altawalbih), F.A., R.A.K., R.T., A.M.A.-D., A.A., T.O.Q. and M.A. (Mohammed ALBashtawy) contributed to writing, reviewing, editing, and interpreting the findings; visualization, A.M.A.-D.; supervision, A.M.A.-D.; project administration, A.M.A.-D. and A.D. All authors have read and agreed to the published version of the manuscript.
Funding
This research was funded by the Deanship of Research at Jordan University of Science and Technology, Jordan (grant number: 20240512).
Institutional Review Board Statement
Not applicable.
Informed Consent Statement
Not applicable.
Data Availability Statement
Data presented in this study are included in the article/Supplementary Materials; further inquiries can be directed to the corresponding author.
Acknowledgments
The AI tool was used solely to assist in drafting and polishing the English.
Conflicts of Interest
The authors declare no conflicts of interest. The funders had no role in the design of this study; in the collection, analyses, or interpretation of data; in the writing of the manuscript; or in the decision to publish the results.
Abbreviations
The following abbreviations are used in this manuscript:
| AI | artificial intelligence |
| ML | machine learning |
| LD | linear dichroism |
| TP | total publications |
| TC | total citations |
| AC | average citations |
| SA | sole-authored publications |
| CA | co-authored publications |
| NCA | number of contributing authors |
| ACI | annual collaboration index |
| NCP | number of cited publications |
| CCP | citations per cited publication |
| CI | collaboration index |
| CC | collaboration coefficient |
| NAY | number of active years of publication |
| PAY | productivity per active year of publication |
| AC/Y | average citation per year |
| PY-start | publication year |
| EHR | electronic health record |
| NLP | natural language processing |
| IoT | Internet of Things |
| CNN | convolution neural network |
| MRI | magnetic resonance imaging |
| SVM | support vector machine |
| ANN | artificial neural network |
References
- Kaul, V.; Enslin, S.; Gross, S.A. History of artificial intelligence in medicine. Gastrointest. Endosc. 2020, 92, 807–812. [Google Scholar] [CrossRef] [PubMed]
- Greenhill, A.T.; Edmunds, B.R. A primer of artificial intelligence in medicine. Tech. Innov. Gastrointest. Endosc. 2020, 22, 85–89. [Google Scholar] [CrossRef]
- Hoogenboom, S.A.; Bagci, U.; Wallace, M.B. Artificial intelligence in gastroenterology. The current state of play and the potential. How will it affect our practice and when? Tech. Innov. Gastrointest. Endosc. 2020, 22, 42–47. [Google Scholar] [CrossRef]
- Le Berre, C.; Sandborn, W.J.; Aridhi, S.; Devignes, M.-D.; Fournier, L.; Smaïl-Tabbone, M.; Danese, S.; Peyrin-Biroulet, L. Application of artificial intelligence to gastroenterology and hepatology. Gastroenterology 2020, 158, 76–94. [Google Scholar] [CrossRef]
- Ruffle, J.K.; Farmer, A.D.; Aziz, Q. Artificial Intelligence-Assisted Gastroenterology—Promises and Pitfalls. Off. J. Am. Coll. Gastroenterol. ACG 2019, 114, 422–428. [Google Scholar] [CrossRef]
- Huang, S.; Yang, J.; Fong, S.; Zhao, Q. Artificial intelligence in cancer diagnosis and prognosis: Opportunities and challenges. Cancer Lett. 2020, 471, 61–71. [Google Scholar] [CrossRef]
- Mitsala, A.; Tsalikidis, C.; Pitiakoudis, M.; Simopoulos, C.; Tsaroucha, A.K. Artificial Intelligence in Colorectal Cancer Screening, Diagnosis and Treatment. A New Era. Curr. Oncol. 2021, 28, 1581–1607. [Google Scholar] [CrossRef]
- Guo, Y.; Hao, Z.; Zhao, S.; Gong, J.; Yang, F. Artificial Intelligence in Health Care: Bibliometric Analysis. J. Med. Internet Res. 2020, 22, e18228. [Google Scholar] [CrossRef]
- Park, C.W.; Seo, S.W.; Kang, N.; Ko, B.; Choi, B.W.; Park, C.M.; Chang, D.K.; Kim, H.; Kim, H.; Lee, H.; et al. Artificial Intelligence in Health Care: Current Applications and Issues. J. Korean Med. Sci. 2020, 35, e379. [Google Scholar] [CrossRef]
- Salwei, M.E.; Carayon, P. A Sociotechnical Systems Framework for the Application of Artificial Intelligence in Health Care Delivery. J. Cogn. Eng. Decis. Mak. 2022, 16, 194–206. [Google Scholar] [CrossRef]
- Bellazzi, R.; Abu-Hanna, A. Artificial intelligence in medicine AIME’07. Artif. Intell. Med. 2009, 46, 1–3. [Google Scholar] [CrossRef] [PubMed]
- Patel, V.L.; Shortliffe, E.H.; Stefanelli, M.; Szolovits, P.; Berthold, M.R.; Bellazzi, R.; Abu-Hanna, A. The coming of age of artificial intelligence in medicine. Artif. Intell. Med. 2009, 46, 5–17. [Google Scholar] [CrossRef] [PubMed]
- Guler, A.T.; Waaijer, C.J.F.; Palmblad, M. Scientific workflows for bibliometrics. Scientometrics 2016, 107, 385–398. [Google Scholar] [CrossRef]
- Al-Dekah, A.M.; Alrawashdeh, A.; Bellizzi, S.; Al-Mistarehi, A.-H.; Kheirallah, K.A. The status quo of psychology research on refugees, asylum-seekers and displaced people: A global bibliometric analysis. Int. J. Migr. Health Soc. Care 2024, 21, 84–110. [Google Scholar] [CrossRef]
- Alsulaiman, J.W.; Alzoubi, A.; Alrawashdeh, A.; Al-Dekah, A.M.; Abubaker, S.; Amayreh, W.; Sweileh, W.M.; Alzoubi, H.M.; Kheirallah, K.A. Mapping trends and hotspots of research on COVID-19 vaccine effectiveness: A comprehensive bibliometric analysis of global research. J. Infect. Public. Health 2025, 18, 102597. [Google Scholar] [CrossRef]
- Albadayneh, B.A.; Alrawashdeh, A.; Obeidat, N.; Al-Dekah, A.M.; Zghool, A.W.; Abdelrahman, M. Medical magnetic resonance imaging publications in Arab countries: A 25-year bibliometric analysis. Heliyon 2024, 10, e28512. [Google Scholar] [CrossRef]
- Andrade-Arenas, L.; Yactayo-Arias, C. A bibliometric analysis of the advance of artificial intelligence in medicine. Int. J. Electr. Comput. Eng. IJECE 2024, 14, 3350–3361. [Google Scholar] [CrossRef]
- Tran, B.X.; Vu, G.T.; Ha, G.H.; Vuong, Q.-H.; Ho, M.-T.; Vuong, T.-T.; La, V.-P.; Ho, M.-T.; Nghiem, K.-C.P.; Nguyen, H.L.T. Global evolution of research in artificial intelligence in health and medicine: A bibliometric study. J. Clin. Med. 2019, 8, 360. [Google Scholar] [CrossRef]
- Jimma, B.L. Artificial intelligence in healthcare: A bibliometric analysis. Telemat. Inform. Rep. 2023, 9, 100041. [Google Scholar] [CrossRef]
- Liang, X.; Zhang, R.; Wang, S.; Hang, R.; Wang, S.; Zhao, Y.; Sun, Y.; Huang, Z. Bibliometric analysis of medical and health research collaboration between China and ASEAN countries. Digit. Health 2023, 9, 20552076231184993. [Google Scholar] [CrossRef]
- Elsevier. Scopus. 2024. Available online: https://www.elsevier.com/products/scopus (accessed on 18 February 2025).
- Musa, I.H.; Afolabi, L.O.; Zamit, I.; Musa, T.H.; Musa, H.H.; Tassang, A.; Akintunde, T.Y.; Li, W. Artificial intelligence and machine learning in cancer research: A systematic and thematic analysis of the top 100 cited articles indexed in Scopus database. Cancer Control 2022, 29, 10732748221095946. [Google Scholar] [CrossRef] [PubMed]
- Wenwen, W.U.; Yaofei, X.I.E.; Xiangxiang, L.I.U.; Yaohua, G.U.; Zhang, Y.; Xinlong, T.U.; Xiaodong, T.A.N. Analysis of scientific collaboration networks among authors, institutions, and countries studying adolescent myopia prevention and control: A review article. Iran. J. Public. Health 2019, 48, 621. [Google Scholar]
- Aria, M.; Cuccurullo, C. bibliometrix: An R-tool for comprehensive science mapping analysis. J. Informetr. 2017, 11, 959–975. [Google Scholar] [CrossRef]
- van Eck, N.J.; Waltman, L. Software survey: VOSviewer, a computer program for bibliometric mapping. Scientometrics 2010, 84, 523–538. [Google Scholar] [CrossRef]
- Callon, M.; Courtial, J.-P.; Turner, W.A.; Bauin, S. From translations to problematic networks: An introduction to co-word analysis. Soc. Sci. Inf. 1983, 22, 191–235. [Google Scholar] [CrossRef]
- Cobo, M.J.; López-Herrera, A.G.; Herrera-Viedma, E.; Herrera, F. Science mapping software tools: Review, analysis, and cooperative study among tools. J. Am. Soc. Inf. Sci. Technol. 2011, 62, 1382–1402. [Google Scholar] [CrossRef]
- Senthil, R.; Anand, T.; Somala, C.S.; Saravanan, K.M. Bibliometric analysis of artificial intelligence in healthcare research: Trends and future directions. Future Healthc. J. 2024, 11, 100182. [Google Scholar] [CrossRef]
- Lin, M.; Lin, L.; Lin, L.; Lin, Z.; Yan, X. A bibliometric analysis of the advance of artificial intelligence in medicine. Front. Med. 2025, 12, 1504428. [Google Scholar] [CrossRef]
- UK Collaborative on Development Research. The UK Collaborative on Development Research Research Capacity Strengthening: Lessons from UK-Funded Initiatives in Low-and Middle-Income Countries; UK Collaborative on Development Research: London, UK, 2022. [Google Scholar]
- The UK Collaborative on Development Sciences. Rapid Mapping of International Funders’ Research Capacity Strengthening Priorities; UK Collaborative on Development Sciences: London, UK, 2015. [Google Scholar]
- Maher, D.; Aseffa, A.; Kay, S.; Bayona, M.T. External funding to strengthen capacity for research in low-income and middle-income countries: Exigence, excellence and equity. BMJ Glob. Health 2020, 5, e002212. [Google Scholar] [CrossRef]
- Dipietro, L.; Ferraro, M.; Palazzolo, J.J.; Krebs, H.I.; Volpe, B.T.; Hogan, N. Customized interactive robotic treatment for stroke: EMG-triggered therapy. IEEE Trans. Neural Syst. Rehabil. Eng. 2005, 13, 325–334. [Google Scholar] [CrossRef]
- Anthimopoulos, M.; Christodoulidis, S.; Ebner, L.; Christe, A.; Mougiakakou, S. Lung pattern classification for interstitial lung diseases using a deep convolutional neural network. IEEE Trans. Med. Imaging 2016, 35, 1207–1216. [Google Scholar] [CrossRef] [PubMed]
- Hamet, P.; Tremblay, J. Artificial intelligence in medicine. Metabolism 2017, 69, S36–S40. [Google Scholar] [CrossRef] [PubMed]
- Chen, M.; Hao, Y.; Hwang, K.; Wang, L.; Wang, L. Disease prediction by machine learning over big data from healthcare communities. IEEE Access 2017, 5, 8869–8879. [Google Scholar] [CrossRef]
- Solomiichuk, V.; Fleischhammer, J.; Molliqaj, G.; Warda, J.; Alaid, A.; von Eckardstein, K.; Schaller, K.; Tessitore, E.; Rohde, V.; Schatlo, B. Robotic versus fluoroscopy-guided pedicle screw insertion for metastatic spinal disease: A matched-cohort comparison. Neurosurg. Focus 2017, 42, E13. [Google Scholar] [CrossRef]
- D’Annibale, A.; Morpurgo, E.; Fiscon, V.; Trevisan, P.; Sovernigo, G.; Orsini, C.; Guidolin, D. Robotic and laparoscopic surgery for treatment of colorectal diseases. Dis. Colon. Rectum 2004, 47, 2162–2168. [Google Scholar] [CrossRef]
- Ma, X.; Niu, Y.; Gu, L.; Wang, Y.; Zhao, Y.; Bailey, J.; Lu, F. Understanding adversarial attacks on deep learning based medical image analysis systems. Pattern Recognit. 2021, 110, 107332. [Google Scholar] [CrossRef]
- Gray, K.R.; Aljabar, P.; Heckemann, R.A.; Hammers, A.; Rueckert, D.; Alzheimer’s Disease Neuroimaging, I. Random forest-based similarity measures for multi-modal classification of Alzheimer’s disease. NeuroImage 2013, 65, 167–175. [Google Scholar] [CrossRef]
- Prasad, M.L.; Kiran, A.; Shaker Reddy, P.C. Chronic Kidney Disease Risk Prediction Using Machine Learning Techniques. J. Inf. Technol. Manag. 2024, 16, 118–134. [Google Scholar]
- Vineetha, K.R.; Maharajan, M.S.; Bhagyashree, K.; Sivakumar, N. Classification of adaptive back propagation neural network along with fuzzy logic in chronic kidney disease. e-Prime-Adv. Electr. Eng. Electron. Energy 2024, 7, 100463. [Google Scholar]
- Kim, H.-J.; Kwak, N.; Yoon, S.H.; Park, N.; Kim, Y.R.; Lee, J.H.; Lee, J.Y.; Park, Y.; Kang, Y.A.; Kim, S. Artificial intelligence-based radiographic extent analysis to predict tuberculosis treatment outcomes: A multicenter cohort study. Sci. Rep. 2024, 14, 13162. [Google Scholar] [CrossRef]
- Mohan, G.; Subashini, M.M.; Balan, S.; Singh, S. A multiclass deep learning algorithm for healthy lung, Covid-19 and pneumonia disease detection from chest X-ray images. Discov. Artif. Intell. 2024, 4, 20. [Google Scholar] [CrossRef]
- Kumar, R.; Maheshwari, S.; Sharma, A.; Linda, S.; Kumar, S.; Chatterjee, I. Ensemble learning-based early detection of influenza disease. Multimed. Tools Appl. 2024, 83, 5723–5743. [Google Scholar] [CrossRef] [PubMed]
- Jhang, J.-F.; Yu, W.-R.; Huang, W.-T.; Kuo, H.-C. Combination of urinary biomarkers and machine-learning models provided a higher predictive accuracy to predict long-term treatment outcomes of patients with interstitial cystitis/bladder pain syndrome. World J. Urol. 2024, 42, 173. [Google Scholar] [CrossRef]
- Breuer, S.; Müller, R. Digitalization, AI, and robotics for good care and work? German policy imaginaries of healthcare technologies. Sci. Public. Policy 2024, 51, 951–962. [Google Scholar] [CrossRef]
- Mello-Thoms, C.; Mello, C.A.B. Clinical applications of artificial intelligence in radiology. Br. J. Radiol. 2023, 96, 20221031. [Google Scholar] [CrossRef]
- Khalifa, M.; Albadawy, M. AI in diagnostic imaging: Revolutionising accuracy and efficiency. Comput. Methods Programs Biomed. Update 2024, 5, 100146. [Google Scholar] [CrossRef]
- Killock, D. AI outperforms radiologists in mammographic screening. Nat. Rev. Clin. Oncol. 2020, 17, 134. [Google Scholar] [CrossRef]
- Ha, S.M.; Jang, M.-j.; Youn, I.; Yoen, H.; Ji, H.; Lee, S.H.; Yi, A.; Chang, J.M. Screening outcomes of mammography with AI in dense breasts: A comparative study with supplemental screening US. Radiology 2024, 312, e233391. [Google Scholar] [CrossRef]
- Sinha, S.; Vegesna, R.; Mukherjee, S.; Kammula, A.V.; Dhruba, S.R.; Wu, W.; Kerr, D.L.; Nair, N.U.; Jones, M.G.; Yosef, N. PERCEPTION predicts patient response and resistance to treatment using single-cell transcriptomics of their tumors. Nat. Cancer 2024, 5, 938–952. [Google Scholar] [CrossRef]
- Shaik, T.; Tao, X.; Higgins, N.; Li, L.; Gururajan, R.; Zhou, X.; Acharya, U.R. Remote patient monitoring using artificial intelligence: Current state, applications, and challenges. Wiley Interdiscip. Rev. Data Min. Knowl. Discov. 2023, 13, e1485. [Google Scholar] [CrossRef]
- Bajwa, J.; Munir, U.; Nori, A.; Williams, B. Artificial intelligence in healthcare: Transforming the practice of medicine. Future Healthc. J. 2021, 8, e188–e194. [Google Scholar] [CrossRef] [PubMed]
- Javaid, M.; Haleem, A.; Singh, R.P.; Suman, R.; Rab, S. Significance of machine learning in healthcare: Features, pillars and applications. Int. J. Intell. Netw. 2022, 3, 58–73. [Google Scholar] [CrossRef]
- Wieland-Jorna, Y.; van Kooten, D.; Verheij, R.A.; de Man, Y.; Francke, A.L.; Oosterveld-Vlug, M.G. Natural language processing systems for extracting information from electronic health records about activities of daily living. A systematic review. JAMIA Open 2024, 7, ooae044. [Google Scholar] [CrossRef] [PubMed]
- Javaid, M.; Haleem, A.; Singh, R.P.; Rab, S.; Suman, R.; Kumar, L. Utilization of robotics for healthcare: A scoping review. J. Ind. Integr. Manag. 2022, 7, 2250015. [Google Scholar] [CrossRef]
- Amiri, Z.; Heidari, A.; Navimipour, N.J.; Esmaeilpour, M.; Yazdani, Y. The deep learning applications in IoT-based bio-and medical informatics: A systematic literature review. Neural Comput. Appl. 2024, 36, 5757–5797. [Google Scholar] [CrossRef]

Disclaimer/Publisher’s Note: The statements, opinions and data contained in all publications are solely those of the individual author(s) and contributor(s) and not of MDPI and/or the editor(s). MDPI and/or the editor(s) disclaim responsibility for any injury to people or property resulting from any ideas, methods, instructions or products referred to in the content. |
© 2025 by the authors. Licensee MDPI, Basel, Switzerland. This article is an open access article distributed under the terms and conditions of the Creative Commons Attribution (CC BY) license (https://creativecommons.org/licenses/by/4.0/).