Abstract
Background/Objectives: This study aimed to examine the association between self-perceived cardiorespiratory fitness and health outcomes in long-term breast cancer survivors (LTBCSs) and identify possible predictors in women at least 5 years post-diagnosis. Methods: A cross-sectional study was carried out involving 80 LTBCSs, divided into three groups according to their self-reported cardiorespiratory fitness levels: very poor/poor (1–2), average (3), and good/very good (4–5). Sociodemographic and clinical data were collected, and this study analyzed variables measured at least five years after diagnosis, focusing on various factors including physical fitness, physical activity (PA) levels, cancer-related fatigue (CRF), mood, pain, and health-related quality of life (HRQoL). ANOVA, Mann–Whitney U, and chi-square tests were performed, along with correlation and multiple regression analyses. Cohen’s d was used to calculate effect sizes. Results: Among the 80 LTBCSs, 35% reported very poor/poor self-perceived cardiorespiratory fitness, 35% reported average levels, and 30% reported good/very good levels. Individuals with lower self-perceived cardiorespiratory fitness levels showed significant declines in physical fitness, greater physical inactivity, increased CRF, higher pain levels, and a poorer HRQoL (p < 0.05). Regression analysis identified “self-perceived muscle strength” (β = 0.40; p < 0.01) and “nausea and vomiting” (β = −0.37; p < 0.01) as significant predictors of higher self-perceived cardiorespiratory fitness (adjusted r2 = 0.472). Conclusions: These findings highlight the importance of self-perceived cardiorespiratory fitness as a relevant indicator of health outcomes in LTBCSs. Given its association with physical fitness, sedentary behavior, CRF, pain, and HRQoL, assessing patients’ perceptions may provide valuable insights for developing tailored rehabilitation strategies. Future interventions should consider both subjective and objective measures to optimize the long-term health and quality of life in this population.
1. Introduction
Breast cancer (BC) statistics indicate that the incidence rate among women was 23.8%, while the mortality risk reached 15.4% worldwide in 2022 [1]. The introduction of mass mammographic screening has facilitated the earlier detection of smaller and less aggressive tumors. Combined with therapeutic advancements, a significant increase has been seen in the number of BC survivors in recent decades [1]. However, as the survivor population grows, making BC a long-term condition for many, the long-term (i.e., beyond five years since BC diagnosis) adverse effects of treatment have gained increasing attention. This has led to a broad body of scientific research aimed at assessing the health status of these long-term breast cancer survivors (LTBCSs) and developing rehabilitation programs to address the sequelae that persist five years post-diagnosis [2]. Despite these efforts, some aspects of long-term survivorship remain underexplored, particularly the impact of self-perceived physical fitness and its various components. Gaining a deeper understanding of these factors is crucial for designing more effective rehabilitation strategies to enhance the long-term well-being of this population.
In this sense, self-perceived physical fitness serves not only as a health indicator but also as a predictor of mortality [3]. This concept encompasses multiple components, such as cardiorespiratory fitness, muscular strength, agility, speed, and flexibility [4], while also reflecting an individual’s physical capabilities and their ability to handle daily challenges with energy and efficiency [4]. As a relatively stable measure, it provides valuable insight into habitual physical activity (PA) levels [5].
Among the various components of physical fitness, cardiorespiratory fitness stands out as a key indicator of overall health and health-related quality of life (HRQoL) [6]. Additionally, studies in various populations, including adolescents, adults, and short-term BC survivors, have linked higher self-perceived cardiorespiratory fitness to improved physical and mental health as well as to an enhanced HRQoL [7,8,9,10]. It is also associated with a greater likelihood of engaging in PA and adopting healthier lifestyles [8]. However, despite these findings, research specifically examining self-perceived cardiorespiratory fitness in LTBCSs and its potential links to their physical, emotional, and mental well-being remains limited.
Cardiorespiratory fitness can be assessed using various methods. Laboratory-based assessments, such as maximal oxygen uptake (VO₂max) tests, are considered the gold standard due to their precision and objectivity. Notwithstanding, these methods are resource-intensive, requiring specialized equipment, trained personnel, and significant time investment, making them impractical for large-scale or routine evaluations [11]. As a practical alternative, self-reported measures have been developed to estimate cardiorespiratory fitness without requiring exhaustive testing. Research has shown that non-exercise models incorporating variables such as age, sex, body mass index, resting heart rate, and both self-reported physical fitness and PA levels can reliably predict cardiorespiratory fitness [12,13,14,15]. These self-assessment tools offer a feasible approach for large-scale screenings, particularly in populations where traditional testing is impractical, thereby informing public health strategies and targeted interventions.
Finally, considering the existing evidence supporting the benefits of cardiorespiratory fitness, along with the utility of self-perceived measures as a viable alternative when direct assessments are not feasible [11,12,13,14,15,16,17], it is notable that the relationship between self-perceived cardiorespiratory fitness and health outcomes in LTBCSs remains largely unexplored. Future studies should aim to fill this gap by examining how self-perceived cardiorespiratory fitness influences various health parameters and whether targeted interventions could enhance both perceived and actual fitness levels in this population. Therefore, the purpose of this study was to explore the association between self-perceived cardiorespiratory fitness and health outcomes in LTBCSs as well as identify possible predictors in women at least 5 years post-breast-cancer diagnosis.
2. Materials and Methods
2.1. Design and Participants
This cross-sectional study was conducted between late 2022 and early 2023 at the Sport and Health Joint University Institute (iMUDS), following the Declaration of Helsinki (14/2017) [18] and approved by the Biomedical Research Ethics Committee of Granada (CEIm) (1038-N-16 I.P/07/26/2018).
A total of 80 LTBCSs participated in this study. Eligible participants were identified and recruited through the oncology department of the University Hospital Complex of Granada during the specified study period. Additional details can be found in Supplementary Figure S1.
Participants were informed about the study objectives via telephone and given the opportunity to ask questions before providing written informed consent during an in-person assessment session conducted by a trained physiotherapist from the research team. Each session lasted approximately one hour and took place on a single day, during which participants completed a comprehensive assessment dossier. This dossier included all questions related to demographic and clinical variables, as well as validated questionnaires assessing the study variables.
A trained physiotherapist, experienced in oncology patient assessment, supervised the process, ensuring the participants understood the questionnaires and providing assistance if needed. The physiotherapist overseeing the assessment was different from the team member responsible for digitizing the responses, ensuring data integrity. Additionally, the statistical analysis was conducted by a separate researcher, independent from both the assessment and data entry processes.
2.2. Eligibility Criteria and Group Classification
2.2.1. Inclusion Criteria
- Female sex.
- Age ≥ 18 years.
- Diagnosis of stage I–IIIa breast cancer at least five years prior to enrollment.
- No participation in structured fitness-related assessments within the past three months (to avoid bias in self-reported fitness levels).
2.2.2. Exclusion Criteria
- Any condition preventing the completion of the assessment protocol.
- Inability to understand the study procedures.
Participants were classified based on self-perceived cardiorespiratory fitness using the International Fitness Scale (IFIS), a validated instrument which is rated on a 1–5-point scale. Based on the prior literature [14,19], participants were grouped as follows: very poor/poor (1–2), average (3), and good/very good (4–5).
The necessary sample size was estimated using G*Power (Version 3.1.9.7) for a comparison of three independent groups. Assuming a medium effect size (f = 0.25), an alpha level of 0.05, and a power of 0.80, the required total sample size was 72 participants (24 per group). Finally, we recruited 80 participants, ensuring adequate statistical power for the analyses.
2.3. Variables
2.3.1. Demographic and Clinical Data Collection
Information was obtained through organized interviews using a customized questionnaire designed to collect sociodemographic and clinical data. Clinical variables included the time since diagnosis, tumor stage, family history of BC, surgical procedures, types of treatment received, current medications, presence of metastasis or recurrence, menopausal status, utilization of psychological or physiotherapy services, and lifestyle factors such as tobacco and alcohol use.
2.3.2. Physical Fitness
Self-perceived fitness levels were evaluated using the IFIS with responses measured on a 5-point Likert scale, ranging from 1 (very poor) to 5 (very good). The tool consists of five core questions that assess overall physical fitness along with specific aspects such as cardiorespiratory endurance, muscular strength, speed/agility, and flexibility relative to peers. This questionnaire has demonstrated reliability, with a Cronbach’s alpha of 0.80 [14].
2.3.3. Physical Activity Level
The Minnesota Leisure Time Physical Activity (MLTPA) questionnaire was used to assess the average frequency and total hours dedicated to PA over the past week. This tool has demonstrated high reliability, with an intraclass correlation coefficient (ICC) of 0.95 [20]. The evaluation was based on a preselected list of specific physical activities. Energy expenditure was determined by merging the reported weekly duration (in hours) of each activity by its corresponding metabolic equivalent of task (MET) value [21], which reflects the energy cost of an activity. A higher final score indicates a greater amount of time spent engaging in PA each week.
2.3.4. Cancer-Related Fatigue
The Piper Fatigue Scale (PFS) was used to assess cancer-related fatigue (CRF). This is a 22-item tool, which measures CRF across four main dimensions: behavioral severity, affective, sensory, and cognitive/mood. The overall score from this scale indicates the level of CRF, with higher scores reflecting greater fatigue [22,23]. The reliability of this tool has been confirmed, with a Cronbach’s alpha of 0.86 [24]. Based on previous research, two scoring models (Models A and B) were suggested as effective for classifying CRF severity. In Model A, CRF is categorized into the following: 0 = none, 1–3 = mild, 4–6 = moderate, and 7–10 = severe; Model B categorizes it as 0 = none, 1–2 = mild, 3–5 = moderate, and 6–10 = severe [22,23]. Importantly, moderate CRF, irrespective of the model used, is considered clinically significant [25]. Patients who screen positive for moderate-to-severe CRF should receive a diagnostic evaluation to identify any underlying or comorbid conditions that may require treatment [26].
2.3.5. Mood State
The Scale for Mood Assessment (EVEA) was used to evaluate four different mood dimensions, with a Cronbach’s alpha between 0.88 and 0.93 [27]. This tool consists of 16 items, each rated on a Likert scale from 0 to 10. The scores for each mood dimension—sadness/depression, anxiety, anger/hostility, and happiness—are calculated by averaging the scores of the items within each respective category. Higher final scores indicate a greater intensity of the corresponding mood dimension.
2.3.6. Pain Measures
Pain intensity was evaluated using the Visual Analogue Scale (VAS), a 10 cm scale known for its high reliability (ICC = 0.97) [28], where 0 signifies “no pain” and 10 represents the “worst possible pain.” Participants were asked to rate the pain in both their affected and unaffected arms at the time of the assessment. For those with bilateral BC where both arms were impacted, the arm deemed “affected” was identified based on these factors: (1) the patient’s subjective pain report when comparing the two arms, (2) the level of surgical intervention, and (3) the presence of lymphedema or other post-surgical complications. Additionally, the Brief Pain Inventory (BPI) short form, with Cronbach’s alpha values ranging from 0.87 to 0.89 [29], was employed to measure pain intensity (severity) through four questions and its impact on daily life (interference) through seven questions. Higher scores reflect greater pain intensity and more significant interference with daily activities.
2.3.7. Health-Related Quality of Life
Two validated tools were used to assess HRQoL: the EORTC QLQ-C30 (version 3.0) and its BC-specific module, the QLQ-BR23. The reliability of these tools has been established, with Cronbach’s alpha values ranging from 0.46 to 0.94 [30,31]. Each question is answered on a 4-point Likert scale (1 = not at all, 4 = very much) and then transformed to a scale of 0 to 100. When interpreting the results, higher scores on the functional and global HRQoL scales indicate better health, while higher scores on the symptom scales suggest a greater symptom impact. Additionally, a summary score for the QLQ-C30 was calculated by combining the scores from 13 scales and items, excluding the global health status and financial impact scales. For the summary score, higher values correspond to better HRQoL [32].
2.3.8. Statistical Analysis
Data analysis was performed using IBM SPSS Statistics (version 27.0, Armonk, NY, USA), with significance set at p < 0.05 and a 95% confidence interval (CI). Normality was assessed via the Kolmogorov–Smirnov test (p > 0.05). For normally distributed continuous variables, ANOVA compared the three self-perceived cardiorespiratory fitness groups: very poor/poor (1–2), average (3), and good/very good (4–5). Non-normally distributed variables were analyzed using the Kruskal–Wallis test, with Mann–Whitney U tests for pairwise comparisons. Chi-square tests were used for categorical and ordinal variables. Effect sizes (Cohen’s d) were categorized as negligible (d = 0–0.19), small (d = 0.2–0.49), moderate (d = 0.5–0.79), large (d = 0.8–1.19), and very large (d ≥ 1.20) [33].
To analyze the relationship between self-perceived cardiorespiratory fitness (measured by IFIS) and other variables, Spearman correlation analysis was used. Stepwise multiple regression identified factors influencing its variability. Variables were included if they correlated significantly with the dependent variable and had inter-variable correlations below 0.70 to avoid collinearity [34,35]. A forward selection method sequentially added significant predictors, assessing statistical significance at each step. Standardized β coefficients were calculated for the final model. Non-normally distributed variables, identified via the Kolmogorov–Smirnov test, were transformed using logarithmic and square root methods to meet regression assumptions.
3. Results
3.1. Demographic and Clinical Characteristics
Following similar approaches used in previous studies [14,19], participants were classified as having very poor/poor (35%), average (35%), or good/very good (30%) self-perceived cardiorespiratory fitness. No significant differences were observed between the groups regarding the demographic and clinical characteristics of the 80 LTBCSs based on their self-reported cardiorespiratory fitness levels.
The average age of the participants with very poor/poor self-perceived cardiorespiratory fitness was 47.20 ± 8.26 years, while those with an average level had a mean age of 49.46 ± 7.09 years, and participants with good/very good fitness levels had an average age of 52.04 ± 8.41 years. In the very poor/poor fitness group, 42.8% were on sick leave, 46.4% had undergone a quadrantectomy, and 25% had metastasis. In the average fitness group, 49.3% were on sick leave, 39.3% had undergone a quadrantectomy, and 14.3% had metastasis. Among those in the good/very good fitness group, 25% were on sick leave, 62.5% had undergone a quadrantectomy, and 12.5% had metastasis. Further details on the demographic and clinical characteristics can be found in Table 1.

Table 1.
Demographic, clinical, and medical characteristics of LTBCSs according to the level of cardiorespiratory fitness.
3.2. Physical Fitness
The analysis of physical fitness, as assessed with the IFIS, revealed significant differences between the groups. The comparisons of self-perceived cardiorespiratory fitness levels indicated that LTBCSs with good/very good self-reported fitness exhibited higher scores across all domains compared to both the very poor/poor (U = 98.50 to 131.00; p < 0.01; d > 1.20) and average (U = 147.50 to 177.50; p < 0.01; d = 0.81 to 1.10) groups. Furthermore, the very poor/poor group demonstrated significantly lower scores for speed/agility compared to the average group (U = 258.50; p = 0.01; d = 0.69). A visual summary of these findings is presented in Table 2.
Table 2.
Physical fitness, physical activity level, cancer-related fatigue, mood state, and pain of LTBCSs according to the level of cardiorespiratory fitness.
3.3. Physical Activity Level
The comparison of MLTPA scores between groups revealed a significant difference between LTBCSs with very poor/poor self-perceived cardiorespiratory fitness and those with good/very good levels. Specifically, a greater proportion of LTBCSs in the very poor/poor group were classified as “inactive” (42.8%), while only 20.8% of those in the good/very good group were categorized as “inactive” (p = 0.02). No significant differences were observed between the other group comparisons (p > 0.05). Further details are provided in Table 2.
3.4. Cancer-Related Fatigue
The analysis of the PFS domains showed significant differences when comparing the very poor/poor and average groups to the good/very good group. LTBCSs with very poor/poor self-perceived cardiorespiratory fitness reported significantly higher values in all domains compared to the good/very good group (U = 138.50 to 170.00; p < 0.01; d = 0.98 to 1.14). Likewise, the average group had significantly higher values across all domains when compared to the good/very good group (U = 126.00 to 153.00; p < 0.01; d = 0.29 to 1.19). No significant differences were found between the very poor/poor and average groups (p > 0.05). Additional details are available in Table 2.
Regarding the two cut scores, A and B, the analysis revealed that LTBCSs with very poor/poor and average self-perceived cardiorespiratory fitness levels reported significantly higher proportions of “severe” CRF for both cut scores. Specifically, in the very poor/poor group, 14.2% (A) and 28.5% (B) had severe CRF, while, in the average group, 17.9% (A) and 21.4% (B) exhibited severe CRF. In contrast, no LTBCSs in the good/very good group reported severe CRF (A = 0%, B = 0%) (p = < 0.01 to 0.03). No significant differences were found when comparing the very poor/poor group to the average group for either of the two cut scores (p > 0.05). These findings are summarized in Table 2.
3.5. Mood State
The analysis of the EVEA outcomes, assessing mood states, showed no significant differences between groups for any of the three comparisons (p > 0.05). Detailed values can be found in Table 2.
3.6. Pain
The analysis of pain, based on VAS scores, showed no significant differences between the group comparisons. However, when using the BPI, significant differences were observed for “pain intensity” and “pain interference” between the very poor/poor (U = 164.00 and 154.50; all p < 0.01; d = 0.94 to 1.12) and average (U = 211.00 and 212.50; all p = 0.02; d = 0.56 to 0.68) groups in comparison to the good/very good group. Specifically, the good/very good group reported significantly lower values than the other two groups. No significant differences were found between the BPI values of the very poor/poor and average groups. These results are presented in Table 2.
3.7. Health-Related Quality of Life
The analysis of HRQoL, measured using the QLQ-C30 and -BR23, showed significant differences across the groups. When comparing the very poor/poor group to the good/very good group, significantly lower values were found in the areas of “role functioning”, “emotional functioning”, “cognitive functioning”, “global health status”, “summary score”, “body image”, “sexual functioning”, and “systemic therapy side effects”. Conversely, higher values were observed for “breast symptoms” and all individual items, except for “diarrhea” and “financial difficulties” (U = 128.00 to 279.00; p < 0.01 to 0.03; d = 0.64 to 1.10). Furthermore, LTBCSs with very poor/poor self-perceived cardiorespiratory fitness compared to the average group also reported significantly lower levels of “emotional functioning” and “sexual enjoyment”, as well as higher levels of “nausea and vomiting” (U = 280.50 to 293.00; p = 0.04 to 0.05; d = 0.50 to 0.56). A similar pattern was observed when comparing the average group to the good/very good group, with significantly lower values in the average group for “role functioning”, “cognitive functioning”, “global health status”, “summary score”, “body image”, “sexual functioning”, and all symptom scales, except for “upset by hair loss”. Additionally, the average group had higher values for “nausea and vomiting” compared to the good/very good group (U = 144.50 to 277.00; p < 0.01 to 0.05; d = 0.29 to 1.10). Further details are available in Table 3.
Table 3.
Health-related quality of life of LTBCSs according to their cardiorespiratory fitness.
3.8. Correlation and Multiple Regressions Analysis
Spearman’s correlation analysis revealed significant positive correlations between self-perceived cardiorespiratory fitness and several variables, including QLQ-C30 items such as “role functioning”, “emotional functioning”, “cognitive functioning”, “social functioning”, and “fatigue”; QLQ-BR23 items like “sexual functioning” and “systemic therapy side effects”; and IFIS components such as “general physical fitness”, “muscular strength”, “speed/agility”, and “flexibility” (ρ = 0.233 to 0.575; p < 0.01 to 0.03). In contrast, significant negative correlations were found between self-perceived cardiorespiratory fitness and the following variables: PFS items like “behavioral/severity”, “affective”, “sensory”, “cognitive/mood”, and “total fatigue score”; QLQ-C30 items including “nausea and vomiting”, “dyspnea”, “insomnia”, “appetite loss”, and “constipation”; QLQ-BR23 items such as “breast symptoms” and “pain affected arm”; and BPI variables like “pain intensity” and “pain interference” (ρ = −0.222 to −0.446; p < 0.01 to 0.04). The results are presented in Figure 1.
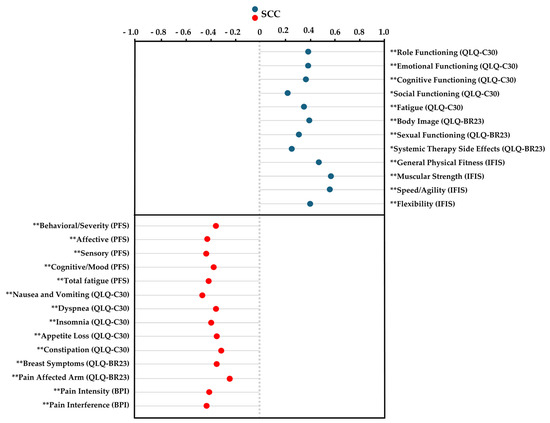
Figure 1.
Spearman’s correlation coefficient for cardiorespiratory fitness using the International Fitness Scale (IFIS). Abbreviations: IFIS, International Fitness Scale; QLQ-C30, EORTC Core Quality of Life Quality of Life Questionnaire; QLQ-BR23, the breast-cancer-specific module; PFS, Piper Fatigue Scale; BPI, Brief Pain Inventory; SCC, Spearman’s correlation coefficient. * p ˂ 0.05; ** p < 0.01.
The final regression model revealed that the variables “self-perceived muscle strength” from the IFIS and “nausea and vomiting” from the QLQ-C30 were significant predictors of higher self-perceived cardiorespiratory fitness. These factors collectively accounted for 47.2% of the variance in self-perceived cardiorespiratory fitness (adjusted r2 = 0.472; p < 0.01) in individuals who were at least 5 years post-cancer diagnosis. Additional details can be found in Table 4.
Table 4.
Summary of stepwise multiple regression analysis to determine predictors of self-perceived cardiorespiratory fitness using the International Fitness Scale (IFIS).
4. Discussion
This study aimed to explore the association between self-perceived cardiorespiratory fitness and health outcomes in LTBCSs and identify possible predictors in women at least 5 years post-breast-cancer diagnosis. The key findings indicate that five or more years after diagnosis, 35% of LTBCSs reported very poor/poor self-perceived cardiorespiratory fitness, 35% reported average levels, and 30% reported good/very good levels. Additionally, LTBCSs with lower self-perceived cardiorespiratory fitness levels demonstrated more significant declines in physical fitness, greater physical inactivity, increased CRF, higher pain levels, and poorer HRQoL. Notably, 47.2% of the variance in self-perceived cardiorespiratory fitness was explained by factors such as “self-perceived muscle strength” and “nausea and vomiting”.
Firstly, the findings from this study indicate that LTBCSs with poor self-perceived cardiorespiratory fitness exhibit significantly lower overall physical fitness than those with more favorable perceptions. Specifically, individuals in the very poor/poor category scored lower across all fitness domains than those in the good/very good and average groups. Similar trends have been observed in a study involving a mixed population of short- and long-term cancer survivors across various cancer type, where lower self-perceived fitness correlated with reduced functional performance and capacity [36]. As for the applicability to objective measures, two studies showed that higher self-reported fitness levels were associated with a higher objectively measured fitness level [5,37]. However, the lack of specificity regarding LTBCSs in these three previous studies limits direct comparison.
The PA levels also varied significantly based on self-perceived fitness, with a higher proportion of inactive LTBCSs in the very poor/poor category. This aligns with prior research showing that individuals perceiving themselves as fitter engage in more PA [38]. In BC survivors, self-efficacy and perceived physical abilities are key determinants of exercise adherence and structured program participation [39]. Given the benefits of cardiorespiratory fitness in cancer survivorship [40], interventions targeting self-perceived fitness—such as personalized programs focusing on endurance and symptom management—may enhance PA engagement and long-term health outcomes.
With respect to CRF, the analysis revealed significant differences in all PFS domains based on self-perceived cardiorespiratory fitness in LTBCSs. Specifically, those in the very poor/poor and average groups reported higher CRF levels across all domains compared to individuals in the good/very good group. This aligns with research linking lower self-perceived fitness to higher CRF levels and poorer well-being in cancer survivors [41]. However, no significant differences emerged between the very poor/poor and average groups, suggesting a stronger CRF impact in those perceiving their fitness as good/very good. While previous studies have linked objective cardiorespiratory fitness measures to CRF outcomes in BC survivors [42], evidence specifically addressing self-perceived cardiorespiratory fitness in LTBCSs remains limited. Given the clinical relevance of moderate-to-severe CRF in LTBCSs [43,44], these findings underscore the need to consider subjective fitness perceptions in CRF management strategies.
As for mood state, the analysis of the EVEA outcomes did not reveal significant differences between groups in any of the three comparisons. This suggests that self-perceived cardiorespiratory fitness did not have a significant impact on mood states among our LTBCSs. While previous studies in adolescents and short-term BC survivors have reported associations between higher self-perceived fitness and improved mood or lower levels of psychological distress [10,45,46,47,48], evidence within long-term BC survivorship remains scarce. Given these considerations, further research is needed to clarify the role of self-perceived cardiorespiratory fitness in emotional well-being among LTBCSs.
In relation to pain, LTBCSs with higher self-perceived cardiorespiratory fitness reported significantly lower pain intensity and interference, as measured by the BPI. This aligns with research showing that a home-based walking intervention improved cardiorespiratory fitness and reduced pain in patients undergoing treatment for solid tumors [49]. Although that study did not focus on self-perceived fitness, it suggested that PA may help alleviate pain. Similarly, studies in healthy adults linked better self-perceived fitness to lower pain sensitivity [50]. However, research on self-perceived cardiorespiratory fitness and pain in LTBCSs is scarce. Further studies are needed to clarify this relationship and its role in pain management.
In the case of HRQoL, LTBCSs with very poor/poor self-perceived cardiorespiratory fitness showed lower functioning, global health status, and summary scores, along with higher symptom burdens. While research on self-perceived cardiorespiratory fitness and HRQoL in LTBCSs is limited, studies in other populations suggest a strong link between perceived fitness and well-being. For instance, better self-perceived fitness in adolescents correlates with improved psychological well-being and lower distress [51]. In healthy adults, interventions targeting self-perceived fitness have been linked to physical and emotional health benefits [52]. Among survivors of BC, higher self-perceived physical fitness has been associated with better HRQoL and emotional functioning [10]. However, no studies have specifically examined self-perceived cardiorespiratory fitness and HRQoL in LTBCSs, highlighting the need for further research.
Considering the correlation and multiple regression analyses, our findings provide insights into the factors associated with self-perceived cardiorespiratory fitness in LTBCSs. Significant positive correlations were found between self-perceived cardiorespiratory fitness and various HRQoL functioning domains, as well as with overall self-perceived physical fitness. These findings align with previous research indicating that better perceptions of physical fitness are linked to enhanced HRQoL in survivors of BC [53]. Conversely, significant negative correlations were observed between self-perceived cardiorespiratory fitness and symptom-related variables, including the various dimensions of CRF, nausea and vomiting, dyspnea, insomnia, appetite loss, constipation, breast symptoms, and pain. These negative associations highlight the detrimental impact of symptom burden on perceived fitness levels, corroborating findings from prior studies that link higher symptom severity to reduced physical and emotional functioning in survivors of BC [36].
Finally, the regression analysis identified self-perceived muscle strength (IFIS) and nausea/vomiting (QLQ-C30) as significant predictors of self-perceived cardiorespiratory fitness, explaining 47.2% of the variance. Greater self-perceived muscle strength correlated with higher self-perceived cardiorespiratory fitness, while severe nausea and vomiting were linked to lower perceptions. Similar findings have been reported regarding self-perceived physical fitness and its impact on mental health in survivors of cancer [36]. However, the study [36] did not account for cancer type, treatment, or differences between short- and long-term survivors. Since symptom severity and patient needs vary by survivorship stage [54,55], further research is needed to assess the role of self-perceived cardiorespiratory fitness in LTBCSs.
Importantly, these findings suggest that interventions aimed at improving muscular strength and managing symptoms such as nausea could enhance self-perceived cardiorespiratory fitness in LTBCSs. Since higher self-perceived physical fitness has been associated with greater engagement in PA [10,56,57], strategies that target these aspects may encourage survivors to participate more actively in exercise programs. This could be particularly relevant in long-term survivorship, where maintaining PA is crucial for overall HRQoL [58].
This study has several limitations. The cut-off points used to classify participants align with previous categorizations [14,19], yet alternative values might have altered the results. Additionally, its cross-sectional design prevented establishing causal relationships between self-perceived cardiorespiratory fitness and physical, mental, and emotional variables, highlighting the need for longitudinal studies. The lack of prior research in LTBCSs using this analytical approach with the IFIS and these specific cut-off points further complicates comparisons. Future studies should build on these findings to explore self-perceived cardiorespiratory fitness in relation to health status and other fitness components, such as muscular strength, speed/agility, and flexibility. Moreover, anthropometric measurements (e.g., height, weight, and body composition) and objective cardiorespiratory fitness assessments were not included, as this study focused exclusively on self-perception. While this aligns with our primary aim, future research should consider incorporating these objective measures to better understand the relationship between self-perceived and actual fitness levels. This questions whether self-perceived results correspond to objective results or if participants under- or over-estimate their capabilities.
Despite its limitations, this study provides valuable insights into the association between self-perceived cardiorespiratory fitness and multiple health-related factors in LTBCSs. By identifying key determinants like self-perceived muscular strength and nausea/vomiting, it highlights the factors shaping the fitness perceptions in this population. The use of the IFIS, a validated tool for assessing perceived fitness across domains [13,14,15,59], enhances this study’s reliability, while the regression model explaining 47.2% of the variance strengthens clinical relevance. To the best of our knowledge, this is among the first studies to explore these relationships in LTBCSs, offering a novel perspective on the influence of self-perception on HRQoL. These findings not only advance scientific knowledge but also support the development of tailored therapeutic interventions and clinical guidelines.
5. Conclusions
In conclusion, only 30% of LTBCSs reported having good/very good levels of self-perceived cardiorespiratory fitness. Furthermore, LTBCSs with lower self-perceived cardiorespiratory fitness experienced a marked deterioration in fitness levels and increased sedentary behavior, as well as increased CRF, higher pain levels, and reduced HRQoL five or more years post-diagnosis. The combination of “self-perceived muscle strength” and “nausea and vomiting” explained 47.2% of the variance in self-perceived cardiorespiratory fitness among the LTBCSs.
These findings underscore the critical role of patients’ perceptions in the development of tailored rehabilitation strategies, emphasizing the necessity of integrating both subjective experiences and objective assessments to optimize long-term health outcomes and HRQoL in LTBCSs. From a practical standpoint, these results highlight the need for healthcare professionals to incorporate regular assessments of self-perceived fitness into survivorship care plans. Targeted interventions, such as personalized exercise programs and symptom management strategies, could help mitigate the negative effects of low self-perceived fitness and enhance overall well-being. Future research should explore the effectiveness of structured physical activity interventions in improving both perceived and objective fitness levels in this population.
Supplementary Materials
The following supporting information can be downloaded at: https://www.mdpi.com/article/10.3390/healthcare13070718/s1, Figure S1: Flow diagram for study participants.
Author Contributions
Conceptualization, F.Á.-S., J.M.-L. and M.F.-M.; methodology, F.Á.-S. and M.F.-M.; software, J.D.J.-G.; validation, F.Á.-S., J.M.-L., S.A.-A., M.F.-M. and C.P.-F.; formal analysis, F.Á.-S., M.F.-M. and J.D.J.-G.; investigation, F.Á.-S., S.A.-A., C.P.-F., C.M.-G. and R.C.-L.; resources, F.Á.-S.; data curation, F.Á.-S. and J.D.J.-G.; writing—original draft preparation, F.Á.-S., J.M.-L., C.P.-F. and M.F.-M.; writing—review and editing, F.Á.-S., J.M.-L., C.P.-F. and M.F.-M.; visualization, M.F.-M., P.G.-G. and R.C.-L.; supervision, F.Á.-S., M.F.-M., P.G.-G. and R.C.-L.; project administration, F.Á.-S. All authors have read and agreed to the published version of the manuscript.
Funding
This research received no external funding.
Institutional Review Board Statement
This study was conducted according to the guidelines of the Declaration of Helsinki and approved by the Biomedical Research Ethics Committee of Granada (CEIm) (1038-N-16 I.P/26 July 2018).
Informed Consent Statement
Informed consent was obtained from all subjects involved in this study.
Data Availability Statement
The datasets generated during and/or analyzed during the current study are available from the corresponding author upon reasonable request.
Acknowledgments
We appreciate all long-term breast cancer survivors who did not hesitate to participate and contribute to this project.
Conflicts of Interest
The authors declare no conflicts of interest.
Abbreviations
The following abbreviations are used in this manuscript:
| BPI | Brief Pain Inventory |
| BC | Breast cancer |
| CI | Confidence interval |
| CRF | Cancer-related fatigue |
| EVEA | Scale for Mood Assessment |
| HRQoL | Health-related quality of life |
| ICC | Intraclass correlation coefficient |
| IFIS | International Fitness Scale |
| LTBCSs | Long-term breast cancer survivors |
| VO₂max | Maximal oxygen uptake |
| MET | Metabolic equivalent task |
| MLTPA | Minnesota Leisure Time Physical Activity |
| PA | Physical activity |
| PFS | Piper Fatigue Scale |
| QLQ-C30 | EORTC Core Quality of Life Quality of Life Questionnaire |
| QLQ-BR23 | The breast-cancer-specific module |
| SCC | Spearman’s correlation coefficient |
| SD | Standard deviation |
| VAS | Visual Analogue Scale |
References
- Bray, F.; Laversanne, M.; Sung, H.; Ferlay, J.; Siegel, R.L.; Soerjomataram, I.; Jemal, A. Global cancer statistics 2022: GLOBOCAN estimates of incidence and mortality worldwide for 36 cancers in 185 countries. CA Cancer J. Clin. 2024, 74, 229–263. [Google Scholar] [CrossRef] [PubMed]
- Newell, A.; Malhotra, J.; Raoof, E.; Thess, M.; Grasso, P.; Power, K.; Wisotzky, E. Catalyzing Progress: A Comprehensive Review of Cancer Rehabilitation Education for Rehabilitation Specialists. Curr. Phys. Med. Rehabil. Rep. 2024, 12, 177–185. [Google Scholar] [CrossRef]
- Kochman, M.; Kielar, A.; Kasprzak, M.; Maruszczak, K.; Kasperek, W. The Relationship between Self-Rated Health and Physical Fitness in Polish Youth. Healthcare 2023, 12, 24. [Google Scholar] [CrossRef] [PubMed]
- Caspersen, C.J.; Powell, K.E.; Christenson, G.M. Physical activity, exercise, and physical fitness: Definitions and distinctions for health-related research. Public Health Rep. 1985, 100, 126–131. [Google Scholar] [PubMed]
- Aandstad, A. Self-Perceived and Self-Tested Endurance: Associations with Objective Measures. Percept. Mot. Ski. 2022, 129, 1492–1503. [Google Scholar] [CrossRef]
- Courneya, K.S.; An, K.-Y.; Arthuso, F.Z.; Bell, G.J.; Morielli, A.R.; McNeil, J.; Wang, Q.; Allen, S.J.; Ntoukas, S.M.; McNeely, M.L.; et al. Associations between Health-Related Fitness and Quality of Life in Newly Diagnosed Breast Cancer Patients. Breast Cancer Res. Treat. 2023, 199, 533–544. [Google Scholar] [CrossRef]
- Du Toit, L.; Venter, R.E.; Potgieter, J.R. The relationship between cardiorespiratory fitness, body composition and physical self-perception of adolescent girls. J. Hum. Mov. Stud. 2005, 48, 353–364. [Google Scholar]
- Lamb, K.L.; Morris, P.G. Leisure-time physical activity as a determinant of self-perceived fitness. Percept. Mot. Ski. 1993, 76, 1043–1047. [Google Scholar] [CrossRef]
- Redondo-Gutiérrez, L.; Afonso, R.C.; Molina, A.; Sanchez-Lastra, M.A.; Ayán, C. Associations between Self-Perceived and Desired Health-Related Physical Fitness in Spanish Children. Children 2022, 9, 1314. [Google Scholar] [CrossRef]
- Fresno-Alba, S.; Leyton-Román, M.; Mesquita da Silva, S.; Jiménez-Castuera, R. Predicting quality of life in women with breast cancer who engage in physical exercise: The role of psychological variables. Healthcare 2023, 11, 2088. [Google Scholar] [CrossRef]
- Campbell, K.L.; Winters-Stone, K.M.; Wiskemann, J.; May, A.M.; Schwartz, A.L.; Courneya, K.S.; Zucker, D.S.; Matthews, C.E.; Ligibel, J.A.; Gerber, L.H.; et al. Exercise Guidelines for Cancer Survivors: Consensus Statement from International Multidisciplinary Roundtable. Med. Sci. Sports Exerc. 2019, 51, 2375–2390. [Google Scholar] [CrossRef] [PubMed]
- Jurca, R.; Jackson, A.S.; LaMonte, M.J.; Morrow, J.R., Jr.; Blair, S.N.; Wareham, N.J.; Haskell, W.L.; van Mechelen, W.; Church, T.S.; Jakicic, J.M.; et al. Assessing Cardiorespiratory Fitness without Performing Exercise Testing. Am. J. Prev. Med. 2005, 29, 185–193. [Google Scholar] [CrossRef] [PubMed]
- Ortega, F.B.; Ruiz, J.R.; España-Romero, V.; Vicente-Rodriguez, G.; Martínez-Gómez, D.; Manios, Y.; Béghin, L.; Molnar, D.; Widhalm, K.; Moreno, L.A.; et al. The International Fitness Scale (IFIS): Usefulness of Self-Reported Fitness in Youth. Int. J. Epidemiol. 2011, 40, 701–711. [Google Scholar] [CrossRef] [PubMed]
- Álvarez-Gallardo, I.C.; Soriano-Maldonado, A.; Segura-Jiménez, V.; Carbonell-Baeza, A.; Estévez-López, F.; McVeigh, J.G.; Delgado-Fernández, M.; Ortega, F.B. International FItness Scale (IFIS): Construct Validity and Reliability in Women with Fibromyalgia: The al-Ándalus Project. Arch. Phys. Med. Rehabil. 2016, 97, 395–404. [Google Scholar] [CrossRef]
- Bao, R.; Chen, S.; Kastelic, K.; Drenowatz, C.; Li, M.; Zhang, J.; Wang, L. Reliability of International Fitness Scale (IFIS) in Chinese Children and Adolescents. Children 2022, 9, 531. [Google Scholar] [CrossRef]
- Cheng, L.; Tian, W.; Mu, H. Effects of aerobic combined with resistance exercise on cardiorespiratory fitness and cardiometabolic health in breast cancer survivors: A Systematic Review, meta-analysis and meta-regression. Heliyon 2024, 10, e26318. [Google Scholar] [CrossRef]
- Jiao, Q.; Xu, B.; Meng, C.; Xu, F.; Li, S.; Zhong, J.; Yang, M.; Li, J.; Li, H. Effectiveness of Aerobic Exercise Intervention on Cardiovascular Disease Risk in Female Breast Cancer: A Systematic Review with Meta-Analyses. BMC Public Health 2024, 24, 3355. [Google Scholar] [CrossRef]
- Shrestha, B.; Dunn, L. The Declaration of Helsinki on medical research involving human subjects: A review of seventh revision. J. Nepal Health Res. Counc. 2020, 17, 548–552. [Google Scholar] [CrossRef]
- Cigarroa, I.; Zapata-Lamana, R.; Márquez, C.; Sepúlveda-Guzmán, C.; Reyes-Molina, D.; Cristi-Montero, C.; Leiva-Manzor, G.; Candia, A.A.; Glenn-Thompson, J.; Monsalves-Alvarez, M.; et al. Is there a relationship between physical fitness and the way of commuting to and from school? Findings from a southern Chilean school health and performance survey 2018. Retos Digit. 2024, 61, 1510–1519. [Google Scholar] [CrossRef]
- Ruiz Comellas, A.; Pera, G.; Baena Díez, J.M.; Mundet Tudurí, X.; Alzamora Sas, T.; Elosua, R.; Torán Monserrat, P.; Heras, A.; Forés Raurell, R.; Fusté Gamisans, M.; et al. Validation of a Spanish short version of the Minnesota leisure time Physical Activity Questionnaire (VREM). Rev. Esp. Salud Publica 2012, 86, 495–508. [Google Scholar] [CrossRef]
- Ainsworth, B.E.; Haskell, W.L.; Whitt, M.C.; Irwin, M.L.; Swartz, A.M.; Strath, S.J.; O’Brien, W.L.; Bassett, D.R., Jr.; Schmitz, K.H.; Emplaincourt, P.O.; et al. Compendium of Physical Activities: An Update of Activity Codes and MET Intensities. Med. Sci. Sports Exerc. 2000, 32, S498–S504. [Google Scholar] [CrossRef] [PubMed]
- Piper, B.F.; Dibble, S.L.; Dodd, M.J.; Weiss, M.C.; Slaughter, R.E.; Paul, S.M. The Revised Piper Fatigue Scale: Psychometric Evaluation in Women with Breast Cancer. Oncol. Nurs. Forum 1998, 25, 677–684. [Google Scholar] [PubMed]
- Stover, A.M.; Reeve, B.B.; Piper, B.F.; Alfano, C.M.; Smith, A.W.; Mitchell, S.A.; Bernstein, L.; Baumgartner, K.B.; McTiernan, A.; Ballard-Barbash, R. Deriving Clinically Meaningful Cut-Scores for Fatigue in a Cohort of Breast Cancer Survivors: A Health, Eating, Activity, and Lifestyle (HEAL) Study. Qual. Life Res. 2013, 22, 2279–2292. [Google Scholar] [CrossRef] [PubMed]
- Cantarero-Villanueva, I.; Fernández-Lao, C.; Díaz-Rodríguez, L.; Cuesta-Vargas, A.I.; Fernández-de-las-Peñas, C.; Piper, B.F.; Arroyo-Morales, M. The Piper Fatigue Scale-Revised: Translation and Psychometric Evaluation in Spanish-Speaking Breast Cancer Survivors. Qual. Life Res. 2014, 23, 271–276. [Google Scholar] [CrossRef]
- Berger, A.M.; Mooney, K.; Alvarez-Perez, A.; Breitbart, W.S.; Carpenter, K.M.; Cella, D.; Cleeland, C.; Dotan, E.; Eisenberger, M.A.; Escalante, C.P.; et al. Cancer-Related Fatigue, Version 2.2015. J. Natl. Compr. Cancer Netw. 2015, 13, 1012–1039. [Google Scholar] [CrossRef]
- Fabi, A.; Bhargava, R.; Fatigoni, S.; Guglielmo, M.; Horneber, M.; Roila, F.; Weis, J.; Jordan, K.; Ripamonti, C.I. Cancer-related fatigue: ESMO Clinical Practice Guidelines for diagnosis and treatment. Ann. Oncol. 2020, 31, 713–723. [Google Scholar] [CrossRef]
- Sanz, J. Un instrumento para evaluar la eficacia de los procedimientos de inducción de estado de ánimo: “La Escala de Valoración del Estado de Ánimo” (EVEA). Análisis Modif. Conducta 2001, 27, 71–110. [Google Scholar]
- Bijur, P.E.; Silver, W.; Gallagher, E.J. Reliability of the visual analog scale for measurement of acute pain. Acad. Emerg. Med. 2001, 8, 1153–1157. [Google Scholar] [CrossRef]
- Badia, X.; Muriel, C.; Gracia, A.; Manuel Núñez-Olarte, J.; Perulero, N.; Gálvez, R.; Carulla, J.; Cleeland, C.S.; Vesbpi, G. Validación española del cuestionario Brief Pain Inventory en pacientes con dolor de causa neoplásica. Med. Clin. 2003, 120, 52–59. [Google Scholar] [CrossRef]
- Zawisza, K.; Tobiasz-Adamczyk, B.; Nowak, W.; Kulig, J.; Jedrys, J. Validity and reliability of the quality of life questionnaire (EORTC QLQ C30) and its breast cancer module (EORTC QLQ BR23). Ginekol. Pol. 2010, 81, 262–267. [Google Scholar]
- Cerezo, O.; Oñate-Ocaña, L.F.; Arrieta-Joffe, P.; González-Lara, F.; García-Pasquel, M.J.; Bargalló-Rocha, E.; Vilar-Compte, D. Validation of the Mexican-Spanish version of the EORTC QLQ-C30 and BR23 questionnaires to assess health-related quality of life in Mexican women with breast cancer. Eur. J. Cancer Care 2012, 21, 684–691. [Google Scholar] [CrossRef] [PubMed]
- Husson, O.; de Rooij, B.H.; Kieffer, J.; Oerlemans, S.; Mols, F.; Aaronson, N.K.; van der Graaf, W.T.A.; van de Poll-Franse, L.V. The EORTC QLQ-C30 summary score as prognostic factor for survival of patients with cancer in the “real-world”: Results from the population-based PROFILES registry. Oncologist 2019, 25, e722–e732. [Google Scholar] [CrossRef] [PubMed]
- Cohen, J. Statistical Power Analysis for the Behavioural Sciences; Academic: New York, NY, USA, 1977. [Google Scholar]
- Mela, C.F.; Kopalle, P.K. The impact of collinearity on regression analysis: The asymmetric effect of negative and positive correlations. Appl. Econ. 2002, 34, 667–677. [Google Scholar] [CrossRef]
- Selk, L.; Gertheiss, J. Nonparametric regression and classification with functional, categorical, and mixed covariates. arXiv 2021, arXiv:2111.03115. [Google Scholar] [CrossRef]
- Kwak, S.; Shin, J.; Kim, J.-Y. The relationship between self-perceived health and physical activity in the mental health of Korean cancer survivors. Healthcare 2023, 11, 1549. [Google Scholar] [CrossRef]
- Obling, K.H.; Hansen, A.-L.S.; Overgaard, K.; Normann, K.; Sandbaek, A.; Maindal, H.T. Association between self-reported and objectively measured physical fitness level in a middle-aged population in primary care. Prev. Med. Rep. 2015, 2, 462–466. [Google Scholar] [CrossRef]
- Rodrigues, B.; Encantado, J.; Franco, S.; Silva, M.N.; Carraça, E.V. Psychosocial correlates of physical activity in cancer survivors: A systematic review and meta-analysis. J. Cancer Surviv. 2024, 1–18. [Google Scholar] [CrossRef]
- Casuso-Holgado, M.J.; Martinez-Calderon, J.; Martínez-Miranda, P.; Muñoz-Fernández, M.J.; Bernal-Utrera, C.; García-Muñoz, C. Exercise interventions for self-perceived body image, self-esteem and self-efficacy in women diagnosed with breast cancer: A systematic review with meta-analysis and meta-regressions. Support Care Cancer 2024, 32, 665. [Google Scholar] [CrossRef]
- Coma, N.; Moral, S.; Ballesteros, E.; Eraso, A.; Ventura, M.; Pujol, E.; Brugada, R. Current evidence on the benefit of exercise in cancer patients: Effects on cardiovascular mortality, cardiotoxicity, and quality of life. Rev. Cardiovasc. Med. 2023, 24, 160. [Google Scholar] [CrossRef]
- Phillips, S.M.; McAuley, E. Physical activity and fatigue in breast cancer survivors: A panel model examining the role of self-efficacy and depression. Cancer Epidemiol. Biomark. Prev. 2013, 22, 773–781. [Google Scholar] [CrossRef]
- Leeman, J.E.; Gelb, E.; Michaliski, M.; Yu, A.; Powell, S.N.; Cahlon, O.; Braunstein, L.Z.; Jones, L.; McCormick, B. Cardiorespiratory fitness is a strong, independent predictor of radiation induced fatigue in breast cancer. Int. J. Radiat. Oncol. Biol. Phys. 2020, 108, e49. [Google Scholar] [CrossRef]
- Joly, F.; Lange, M.; Dos Santos, M.; Vaz-Luis, I.; Di Meglio, A. Long-term fatigue and cognitive disorders in breast cancer survivors. Cancers 2019, 11, 1896. [Google Scholar] [CrossRef] [PubMed]
- Reinertsen, K.V.; Cvancarova, M.; Loge, J.H.; Edvardsen, H.; Wist, E.; Fosså, S.D. Predictors and course of chronic fatigue in long-term breast cancer survivors. J. Cancer Surviv. 2010, 4, 405–414. [Google Scholar] [CrossRef] [PubMed]
- Baceviciene, M.; Jankauskiene, R.; Emeljanovas, A. Self-perception of physical activity and fitness is related to lower psychosomatic health symptoms in adolescents with unhealthy lifestyles. BMC Public Health 2019, 19, 980. [Google Scholar] [CrossRef]
- Agussalim, N.Q.; Ahmad, M.; Prihantono, P.; Usman, A.N.; Rafiah, S.; Agustin, D.I. Physical activity and quality of life in breast cancer survivors. Breast Dis. 2024, 43, 161–171. [Google Scholar] [CrossRef]
- Sun, M.; Liu, C.; Lu, Y.; Zhu, F.; Li, H.; Lu, Q. Effects of physical activity on quality of life, anxiety and depression in breast cancer survivors: A systematic review and meta-analysis. Asian Nurs. Res. (Korean Soc. Nurs. Sci.) 2023, 17, 276–285. [Google Scholar] [CrossRef]
- Patsou, E.D.; Alexias, G.D.; Anagnostopoulos, F.G.; Karamouzis, M.V. Effects of physical activity on depressive symptoms during breast cancer survivorship: A meta-analysis of randomised control trials. ESMO Open 2017, 2, e000271. [Google Scholar] [CrossRef]
- Griffith, K.; Wenzel, J.; Shang, J.; Thompson, C.; Stewart, K.; Mock, V. Impact of a walking intervention on cardiorespiratory fitness, self-reported physical function, and pain in patients undergoing treatment for solid tumors. Cancer 2009, 115, 4874–4884. [Google Scholar] [CrossRef]
- Zheng, K.; Chen, C.; Yang, S.; Wang, X. Aerobic exercise attenuates pain sensitivity: An event-related potential study. Front. Neurosci. 2021, 15, 735470. [Google Scholar] [CrossRef]
- Galán-Arroyo, C.; Mendoza-Muñoz, D.M.; Pérez-Gómez, J.; Hernández-Mosqueira, C.; Rojo-Ramos, J. Analysis of self-perceived physical fitness of physical education students in public schools in Extremadura (Spain). Children 2023, 10, 604. [Google Scholar] [CrossRef]
- del Rocio Medrano-Ureña, M.; Ortega-Ruiz, R.; de Dios Benítez-Sillero, J. Physical Fitness, Exercise Self-Efficacy, and Quality of Life in Adulthood: A Systematic Review. Int. J. Environ. Res. Public Health 2020, 17, 6343. [Google Scholar] [CrossRef] [PubMed]
- Peck, S.S.; Esmaeilzadeh, M.; Rankin, K.; Shalmon, T.; Fan, C.-P.S.; Somerset, E.; Amir, E.; Thampinathan, B.; Walker, M.; Sabiston, C.M.; et al. Self-reported physical activity, QoL, cardiac function, and cardiorespiratory fitness in women with HER2+ breast cancer. JACC Cardio Oncol. 2022, 4, 387–400. [Google Scholar] [CrossRef] [PubMed]
- Stein, K.D.; Syrjala, K.L.; Andrykowski, M.A. Physical and psychological long-term and late effects of cancer. Cancer 2008, 112, 2577–2592. [Google Scholar] [CrossRef] [PubMed]
- Delrieu, L.; Bouaoun, L.; Fatouhi, D.E.; Dumas, E.; Bouhnik, A.-D.; Noelle, H.; Jacquet, E.; Hamy, A.-S.; Coussy, F.; Reyal, F.; et al. Patterns of sequelae in women with a history of localized breast cancer: Results from the French VICAN survey. Cancers 2021, 13, 1161. [Google Scholar] [CrossRef]
- Palacios-Cartagena, R.P.; Parraca, J.A.; Mendoza-Muñoz, M.; Pastor-Cisneros, R.; Muñoz-Bermejo, L.; Adsuar, J.C. Level of physical activity and its relationship to self-perceived physical fitness in Peruvian adolescents. Int. J. Environ. Res. Public Health 2022, 19, 1182. [Google Scholar] [CrossRef]
- García-Soidán, J.L.; Pérez-Ribao, I.; Leirós-Rodríguez, R.; Soto-Rodríguez, A. Long-term influence of the practice of physical activity on the self-perceived quality of life of women with breast cancer: A randomized controlled trial. Int. J. Environ. Res. Public Health 2020, 17, 4986. [Google Scholar] [CrossRef]
- Goldschmidt, S.; Schmidt, M.E.; Steindorf, K. Long-term effects of exercise interventions on physical activity in breast cancer patients: A systematic review and meta-analysis of randomized controlled trials. Support Care Cancer 2023, 31, 130. [Google Scholar] [CrossRef]
- Pereira, D.A.; Correia, J.L.; Carvas, N.; Freitas-Dias, R. Reliability of questionnaire The International Fitness Scale: A systematic review and meta-analysis. Einstein 2020, 18, eRW5232. [Google Scholar] [CrossRef]

Disclaimer/Publisher’s Note: The statements, opinions and data contained in all publications are solely those of the individual author(s) and contributor(s) and not of MDPI and/or the editor(s). MDPI and/or the editor(s) disclaim responsibility for any injury to people or property resulting from any ideas, methods, instructions or products referred to in the content. |
© 2025 by the authors. Licensee MDPI, Basel, Switzerland. This article is an open access article distributed under the terms and conditions of the Creative Commons Attribution (CC BY) license (https://creativecommons.org/licenses/by/4.0/).