
Pain Intensity and Health Service Utilization in United States Adults with Pain: A Cross-Sectional Database Analysis


Abstract
1. Introduction
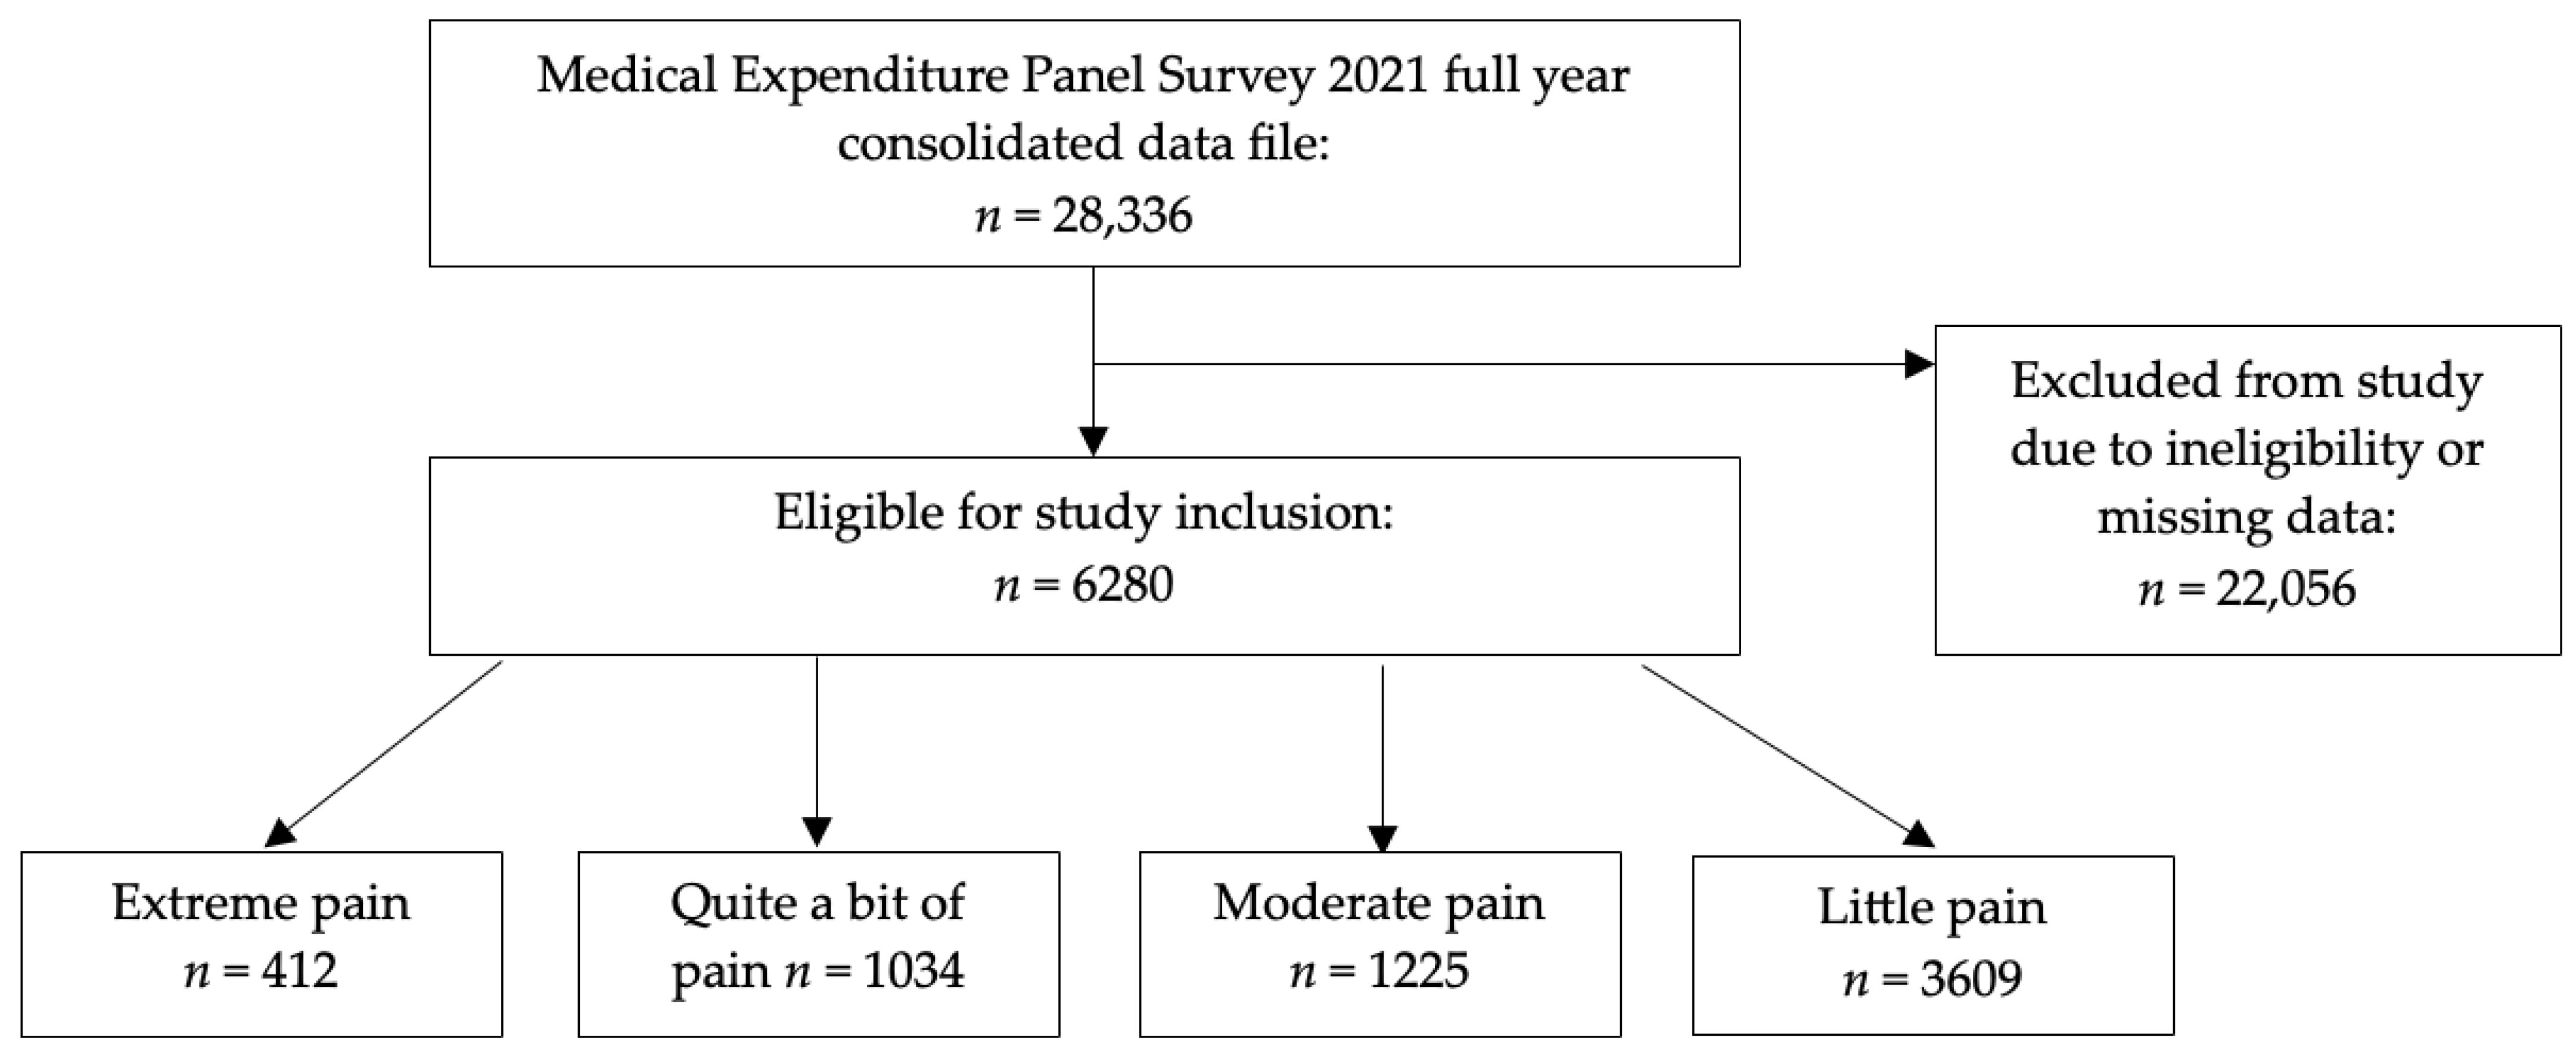
2. Materials and Methods
3. Results
4. Discussion
5. Conclusions
Author Contributions
Funding
Institutional Review Board Statement
Informed Consent Statement
Data Availability Statement
Conflicts of Interest
Appendix A

| Variable Text | Variable Response Options | Medical Expenditure Panel Survey Variable Name |
|---|---|---|
| During the past 4 weeks, how much did pain interfere with your normal work (including both work outside the home and housework)? | Cannot be computed Inapplicable Not at all A little bit Moderately Quite a bit Extremely | ADPAIN42 |
| Number of office–based provider visits 2021 | Count data | OBTOTV21 |
| Number of outpatient department provider visits 2021 | OPTOTV21 | |
| Number of emergency rooms visits 2021 | ERTOT21 | |
| Number of hospital discharges 2021 | IPDIS21 | |
| Age as of December 31 2021 | Inapplicable 0–85 (top coded as 85) | AGE21X |
| Race | White—no other race reported Black—no other race reported American Indian/Alaska Native—no other race reported Asian/Native Hawaiian/Pacific Islander—no other race reported Multiple races reported | RACEV1X |
| Hispanic | Hispanic Not Hispanic | HISPANX |
| Sex | Male Female | SEX |
| Marital status as of December 31 2021 | Don’t know Refused Married Widowed Divorced Separated Never married Under age 16—inapplicable | MARRY21X |
| Years of education when first entered MEPS | Cannot be computed Don’t know Refused Inapplicable No school/kindergarten only Elementary grades 1–8 High school grades 9–11 Grade 12 1 year college 2 years college 3 years college 4 years college 5+ years college | EDUCYR |
| Employment status | Cannot be computed Don’t know Refused Inapplicable Employed Job to return to Got a job Not employed | EMPST31/42/53 |
| Family income as percentage of poverty line | Poor/negative Near poor Low income Middle income High income | POVCAT21 |
| Health insurance coverage indicator | Any private Public only Uninsured | INSCOV21 |
| Multiple diagnoses of high blood pressure | Cannot be computed Don’t know Refused Inapplicable Yes No | BPMLDX |
| Coronary heart disease diagnosis | CHDDX | |
| Angina diagnosis | ANGIDX | |
| Heart attack (MI) diagnosis | MIDX | |
| Other heart disease diagnosis | OHRTDX | |
| Stroke diagnosis | STRKDX | |
| Emphysema diagnosis | EMPHDX | |
| Chronic bronchitis in the last 12 months | CHBRON31 | |
| High cholesterol diagnosis | CHOLDX | |
| Cancer diagnosis | CANCERDX | |
| Diabetes diagnosis | DIABDX_M18 | |
| Joint pain in the last 12 months | JTPAIN31_M18 | |
| Arthritis diagnosis | ARTHDX | |
| Asthma diagnosis | ASTHDX | |
| Any limitation in 2021 | Cannot be computed Inapplicable Yes No | ANYLMI21 |
| Moderate/vigorous exercise for at least 30 min at least five times per week | Don’t know Refused Inapplicable Yes No | PHYEXE53 |
| How often smoke cigarettes | Don’t know Refused Inapplicable Every day Some days Not at all | OFTSMK53 |
| Perceived health status | Don’t know Refused Inapplicable Excellent Very good Good Fair Poor | RTHLTH31/42/53 |
| Perceived mental health status | MNHLTH31/42/53 |
References
- Institute of Medicine (US) Committee on Advancing Pain Research, Care, and Education. Relieving Pain in America: A Blueprint for Transforming Prevention, Care, Education, and Research; National Academies Press: Washington, DC, USA, 2011. [Google Scholar]
- Glowacki, D. Effective pain management and improvements in patients’ outcomes and satisfaction. Crit. Care Nurse 2015, 35, 33–43. [Google Scholar] [CrossRef] [PubMed]
- Basbaum, A.I.; Bautista, D.M.; Scherrer, G.; Julius, D. Cellular and molecular mechanisms of pain. Cell 2009, 139, 267–284. [Google Scholar] [CrossRef] [PubMed]
- Feizerfan, A.; Sheh, G. Transition from acute to chronic pain. Contin. Educ. Anaesth. Crit. Care Pain 2015, 15, 98–102. [Google Scholar] [CrossRef]
- Fregoso, G.; Wang, A.; Tseng, K.; Wang, J. Transition from Acute to Chronic Pain: Evaluating Risk for Chronic Postsurgical Pain. Pain Physician 2019, 22, 479–488. [Google Scholar]
- Goldberg, D.S.; McGee, S.J. Pain as a global public health priority. BMC Public Health 2011, 11, 770. [Google Scholar] [CrossRef]
- Nuseir, K.; Kassab, M.; Almomani, B. Healthcare Providers’ Knowledge and Current Practice of Pain Assessment and Management: How Much Progress Have We Made? Pain Res. Manag. 2016, 2016, 8432973. [Google Scholar] [CrossRef]
- Mose, S.; Budtz, C.R.; Rønn Smidt, H.; Kent, P.; Smith, A.; Andersen, J.H.; Christiansen, D.H. How do people with chronic pain explain their use, or non-use, of pain-related healthcare services? A qualitative study of patient experiences. Disabil. Rehabil. 2023, 45, 4207–4217. [Google Scholar] [CrossRef]
- Staats, P.S.; Patel, K.; Gillen, E.M.; Bello, T.; Epple, T.; Bilder, S.M.; Wisor, D. Healthcare Utilization and Costs Associated with New-Onset Pain in a Medicare Population. Pain Physician 2022, 25, E1415–E1422. [Google Scholar]
- Axon, D.R.; Bhattacharjee, S.; Warholak, T.L.; Slack, M.K. Xm2 Scores for Estimating Total Exposure to Multimodal Strategies Identified by Pharmacists for Managing Pain: Validity Testing and Clinical Relevance. Pain Res. Manag. 2018, 2018, 2530286. [Google Scholar] [CrossRef]
- Axon, D.R.; Patel, M.J.; Martin, J.R.; Slack, M.K. Use of multidomain management strategies by community dwelling adults with chronic pain: Evidence from a systematic review. Scand. J. Pain 2019, 19, 9–23. [Google Scholar] [CrossRef]
- Chidambaram, R.; Apikotoa, S.; Hicks, R.; Theophilus, M.; Wijesuriya, R. Readmission Within the First Day of Discharge Is Painful: Experience From an Australian General Surgical Service. Cureus 2022, 14, e32209. [Google Scholar] [CrossRef] [PubMed]
- Lin, L.-Y.; Hung, T.-C.; Lai, Y.-H. Pain control and related factors in hospitalized patients. Medicine 2021, 100, e26768. [Google Scholar] [CrossRef] [PubMed]
- Neuman, M.D.; Wirtalla, C.; Werner, R.M. Association between skilled nursing facility quality indicators and hospital readmissions. JAMA 2014, 312, 1542–1551. [Google Scholar] [CrossRef] [PubMed]
- Langley, P.; Pérez Hernández, C.; Margarit Ferri, C.; Ruiz Hidalgo, D.; Lubián López, M. Pain, health related quality of life and healthcare resource utilization in Spain. J. Med. Econ. 2011, 14, 628–638. [Google Scholar] [CrossRef]
- Mai, S.; Cai, J.; Li, L. Factors associated with access to healthcare services for older adults with limited activities of daily living. Front. Public Health 2022, 10, 921980. [Google Scholar] [CrossRef]
- Kuemene, J.B.K.; Jensen, B.; Leech, M.; Mahmood, E.; Axon, D.R. Association Between Pain Intensity and Health Service Utilization (Emergency Room Visits, Inpatient Discharges, Office Visits, Outpatient Visits) Among Adults with Pain in the United States; American Society for Health-System Pharmacists Midyear Clinical Meeting: New Orleans, LA, USA, 2024. [Google Scholar]
- Agency for Healthcare Quality and Research. Medical Expenditure Panel Survey. Survey Background. Available online: https://meps.ahrq.gov/mepsweb/about_meps/survey_back.jsp (accessed on 29 May 2025).
- Agency for Healthcare Quality and Research. Medical Expenditure Panel Survey. MEPS HC-233: 2021 Full Year Consolidated Data File. Available online: https://meps.ahrq.gov/mepsweb/data_stats/download_data_files_detail.jsp?cboPufNumber=HC-233 (accessed on 29 May 2025).
- QuickStats: Emergency Department Visit Rates by Age Group—United States, 2019-2020. MMWR Morb. Mortal Wkly. Rep. 2022, 71, 1350. [CrossRef]
- Ashman, J.J.; Schappert, S.M.; Santo, L. Emergency Department Visits Among Adults Aged 60 and Over: United States, 2014-2017. NCHS Data Brief 2020, 367, 1–8. [Google Scholar]
- LaCalle, E.; Rabin, E. Frequent users of emergency departments: The myths, the data, and the policy implications. Ann. Emerg. Med. 2010, 56, 42–48. [Google Scholar] [CrossRef]
- Institute of Medicine (US) Committee on the Future Health Care Workforce for Older Americans. Retooling for an Aging America: Building the Health Care Workforce; National Academies Press: Washington, DC, USA, 2008. [Google Scholar]
- Jones, C.H.; Dolsten, M. Author Correction: Healthcare on the brink: Navigating the challenges of an aging society in the United States. NPJ Aging 2024, 10, 25. [Google Scholar] [CrossRef]
- Deng, L.X.; Patel, K.; Miaskowski, C.; Maravilla, I.; Schear, S.; Garrigues, S.; Thompson, N.; Auerbach, A.D.; Ritchie, C.S. Prevalence and Characteristics of Moderate to Severe Pain among Hospitalized Older Adults. J. Am. Geriatr. Soc. 2018, 66, 1744–1751. [Google Scholar] [CrossRef]
- Araujo de Carvalho, I.; Epping-Jordan, J.; Pot, A.M.; Kelley, E.; Toro, N.; Thiyagarajan, J.A.; Beard, J.R. Organizing integrated health-care services to meet older people’s needs. Bull. World Health Organ. 2017, 95, 756–763. [Google Scholar] [CrossRef] [PubMed]
- Institute of Medicine (US) Committee on Understanding and Eliminating Racial and Ethnic Disparities in Health Care; Smedley, B.D.; Stith, A.Y.; Nelson, A.R. (Eds.) Unequal Treatment: Confronting Racial and Ethnic Disparities in Health Care; National Academies Press: Washington, DC, USA, 2003. [Google Scholar]
- Caraballo, C.; Ndumele, C.D.; Roy, B.; Lu, Y.; Riley, C.; Herrin, J.; Krumholz, H.M. Trends in Racial and Ethnic Disparities in Barriers to Timely Medical Care Among Adults in the US, 1999 to 2018. JAMA Health Forum 2022, 3, e223856. [Google Scholar] [CrossRef] [PubMed]
- Dieleman, J.L.; Chen, C.; Crosby, S.W.; Liu, A.; McCracken, D.; Pollock, I.A.; Sahu, M.; Tsakalos, G.; Dwyer-Lindgren, L.; Haakenstad, A.; et al. US Health Care Spending by Race and Ethnicity, 2002-2016. JAMA 2021, 326, 649–659. [Google Scholar] [CrossRef] [PubMed]
- Egede, L.E. Race, ethnicity, culture, and disparities in health care. J. Gen. Intern. Med. 2006, 21, 667–669. [Google Scholar] [CrossRef]
- Green, C.A.; Pope, C.R. Gender, psychosocial factors and the use of medical services: A longitudinal analysis. Soc. Sci. Med. 1999, 48, 1363–1372. [Google Scholar] [CrossRef]
- Bertakis, K.D.; Azari, R.; Helms, L.J.; Callahan, E.J.; Robbins, J.A. Gender differences in the utilization of health care services. J. Fam. Pract. 2000, 49, 147–152. [Google Scholar]
- Owens, G.M. Gender differences in health care expenditures, resource utilization, and quality of care. J. Manag. Care Pharm. 2008, 14, 2–6. [Google Scholar] [CrossRef]
- Powell, W.; Adams, L.B.; Cole-Lewis, Y.; Agyemang, A.; Upton, R.D. Masculinity and Race-Related Factors as Barriers to Health Help-Seeking Among African American Men. Behav. Med. 2016, 42, 150–163. [Google Scholar] [CrossRef]
- Manuel, J.I. Racial/Ethnic and Gender Disparities in Health Care Use and Access. Health Serv. Res. 2018, 53, 1407–1429. [Google Scholar] [CrossRef]
- Mursa, R.; Patterson, C.; Halcomb, E. Men’s help-seeking and engagement with general practice: An integrative review. J. Adv. Nurs. 2022, 78, 1938–1953. [Google Scholar] [CrossRef]
- Novak, J.R.; Peak, T.; Gast, J.; Arnell, M. Associations Between Masculine Norms and Health-Care Utilization in Highly Religious, Heterosexual Men. Am. J. Mens Health 2019, 13, 1557988319856739. [Google Scholar] [CrossRef] [PubMed]
- Keogh, E. Sex Differences in Pain. Rev. Pain 2008, 2, 4–7. [Google Scholar] [CrossRef] [PubMed]
- Bartley, E.J.; Fillingim, R.B. Sex differences in pain: A brief review of clinical and experimental findings. Br. J. Anesth. 2013, 111, 52–58. [Google Scholar] [CrossRef]
- Zelaya, C.E.; Dahlhamer, J.M.; Lucas, J.W.; Connor, E.M. Chronic Pain and High-impact Chronic Pain Among U.S. Adults, 2019. NCHS Data Brief 2020, 390, 1–8. [Google Scholar]
- Yue, D.; Ponce, N.A.; Needleman, J.; Ettner, S.L. The relationship between educational attainment and hospitalizations among middle-aged and older adults in the United States. SSM Popul. Health 2021, 15, 100918. [Google Scholar] [CrossRef]
- Axon, D.R.; Smith, J. Relationship between pain severity and self-perceived health among United States adults: A cross-sectional, retrospective database study. Medicine 2024, 103, e40949. [Google Scholar] [CrossRef]
- Axon, D.R.; Jang, A.; Son, L.; Pham, T. Determining the association of perceived health status among United States older adults with self-reported pain. Aging Health Res. 2022, 2, 100051. [Google Scholar] [CrossRef]
- Sommers, B.D.; Gawande, A.A.; Baicker, K. Health Insurance Coverage and Health—What the Recent Evidence Tells Us. N. Engl. J. Med. 2017, 377, 586–593. [Google Scholar] [CrossRef]
- Allen, H.; Gordon, S.H.; Lee, D.; Bhanja, A.; Sommers, B.D. Comparison of Utilization, Costs, and Quality of Medicaid vs Subsidized Private Health Insurance for Low-Income Adults. JAMA Netw. Open 2021, 4, e2032669. [Google Scholar] [CrossRef]
- Wray, C.M.; Khare, M.; Keyhani, S. Access to Care, Cost of Care, and Satisfaction With Care Among Adults With Private and Public Health Insurance in the US. JAMA Netw. Open 2021, 4, e2110275. [Google Scholar] [CrossRef]
- Centers for Disease Control and Prevention. Working Together with Your Doctor to Manage Your Pain. Available online: https://www.cdc.gov/overdose-prevention/manage-treat-pain/manage-pain-with-doctor.html (accessed on 20 June 2025).
| Variable | Extreme Pain Percentage [95% Confidence Interval] | Quite a Bit of Pain Percentage [95% Confidence Interval] | Moderate Pain Percentage [95% Confidence Interval] | Little Pain Percentage [95% Confidence Interval] | p-Value |
|---|---|---|---|---|---|
| Age | <0.0001 | ||||
| ≥70 years | 24.1 [18.3–29.8] | 31.5 [27.4–35.5] | 29.0 [25.8–32.1] | 21.1 [19.5–22.8] | |
| 60–69 years | 24.4 [19.0–29.7] | 24.2 [20.9–27.4] | 21.8 [19.3–24.2] | 20.4 [18.7–22.2] | |
| 50–59 years | 23.6 [18.4–28.9] | 21.8 [17.9–25.7] | 17.1 [14.2–20.1] | 18.8 [17.0–20.5] | |
| 40–49 years | 14.9 [10.2–19.6] | 8.5 [5.9–11.1] | 14.1 [11.1–17.0] | 16.2 [14.5–17.8] | |
| 30–39 years | 6.5 [3.0–10.0] | 8.5 [5.6–11.4] | 12.4 [9.5–15.3] | 13.1 [11.4–14.8] | |
| 18–29 years | 6.5 [3.0–10.1] | 5.6 [3.5–7.6] | 5.7 [3.6–7.7] | 10.5 [9.0–11.9] | |
| Race | 0.0678 | ||||
| White | 73.8 [67.5–80.1] | 80.4 [77.3–83.6] | 77.5 [73.8–81.1] | 80.3 [78.0–82.5] | |
| Others | 26.2 [19.9–32.5] | 19.6 [16.4–22.7] | 22.5 [18.9–26.2] | 19.7 [17.5–22.0] | |
| Hispanic | 0.3057 | ||||
| Yes | 9.6 [6.4–12.7] | 10.5 [6.9–14.1] | 11.0 [8.4–13.5] | 12.5 [10.8–14.3] | |
| No | 90.4 [87.3–93.6] | 89.5 [85.9–93.1] | 89.0 [86.5–91.6] | 87.5 [85.7–89.2] | |
| Sex | 0.0227 | ||||
| Male | 40.7 [34.1–47.4] | 40.9 [37.1–44.6] | 43.4 [40.1–46.7] | 46.5 [44.8–48.3] | |
| Female | 59.3 [52.6–65.9] | 59.1 [55.4–62.9] | 56.6 [53.3–59.9] | 53.5 [51.7–55.2] | |
| Marriage | <0.0001 | ||||
| Married | 36.9 [29.6–44.3] | 47.1 [43.2–51.0] | 51.3 [47.5–55.1] | 56.5 [54.5–58.6] | |
| Not married | 63.1 [55.7–70.4] | 52.9 [49.0–56.8] | 48.7 [44.9–52.5] | 43.5 [41.4–45.5] | |
| Education | <0.0001 | ||||
| ≤High school | 56.7 [49.6–63.7] | 54.5 [50.1–58.9] | 44.9 [41.2–48.6] | 38.5 [36.2–40.8] | |
| >High school | 43.3 [36.3–50.4] | 45.5 [41.1–49.9] | 55.1 [51.4–58.8] | 61.5 [59.2–63.8] | |
| Employment | <0.0001 | ||||
| Employed | 20.6 [14.8–26.4] | 27.1 [23.1–31.0] | 48.0 [44.1–51.8] | 63.4 [61.2–65.5] | |
| Unemployed | 79.4 [73.6–85.2] | 72.9 [69.0–76.9] | 52.0 [48.2–55.9] | 36.6 [34.5–38.8] | |
| Income | <0.0001 | ||||
| Low | 57.6 [50.1–65.0] | 45.9 [41.5–50.2] | 36.1 [32.3–40.0] | 23.2 [21.2–25.3] | |
| Middle | 28.1 [21.6–34.6] | 28.0 [24.0–31.9] | 27.3 [23.8–30.7] | 28.9 [26.5–31.4] | |
| High | 14.3 [8.9–19.7] | 26.2 [22.1–30.2] | 36.6 [32.8–40.4] | 47.8 [45.0–50.7] | |
| Insurance | <0.0001 | ||||
| Private | 30.6 [24.5–36.6] | 47.2 [42.7–51.6] | 55.4 [51.5–59.3] | 66.9 [64.6–69.1] | |
| Public | 65.4 [59.0–71.8] | 50.0 [45.7–54.3] | 39.5 [36.1–43.0] | 27.3 [25.5–29.2] | |
| None | 4.0 [1.3–6.7] | 2.8 [1.0–4.6] | 5.0 [2.8–7.2] | 5.8 [4.5–7.0] | |
| Number of chronic conditions | <0.0001 | ||||
| 0–1 | 12.9 [8.5–17.3] | 17.6 [14.0–21.3] | 27.1 [23.8–30.4] | 42.2 [40.0–44.5] | |
| 2–3 | 37.6 [30.9–44.2] | 32.7 [29.2–36.1] | 38.1 [34.3–42.0] | 35.9 [34.0–37.8] | |
| 4–5 | 30.7 [25.3–36.1] | 30.3 [26.9–33.6] | 24.0 [21.1–27.0] | 16.8 [15.2–18.4] | |
| 6+ | 18.8 [13.3–24.4] | 19.5 [16.4–22.5] | 10.7 [8.8–12.7] | 5.1 [4.2–6.0] | |
| Any limitation | <0.0001 | ||||
| Yes | 84.1 [79.0–89.2] | 77.1 [73.2–80.9] | 50.8 [47.4–54.1] | 26.9 [25.0–28.8] | |
| No | 15.9 [10.8–21.0] | 22.9 [19.1–26.8] | 49.2 [45.9–52.6] | 73.1 [71.2–75.0] | |
| Exercise | <0.0001 | ||||
| Yes | 25.1 [19.4–30.7] | 33.0 [29.1–36.9] | 45.3 [41.7–48.9] | 50.2 [47.8–52.6] | |
| No | 74.9 [69.3–80.6] | 67.0 [63.1–70.9] | 54.7 [51.1–58.3] | 49.8 [47.4–52.2] | |
| Current smoker | <0.0001 | ||||
| Yes | 24.8 [18.8–30.8] | 17.9 [14.7–21.0] | 18.5 [15.3–21.6] | 11.6 [10.3–12.9] | |
| No | 75.2 [69.2–81.2] | 82.1 [79.0–85.3] | 81.5 [78.4–84.7] | 88.4 [87.1–89.7] | |
| Health | <0.0001 | ||||
| Poor/fair | 69.1 [63.0–75.3] | 53.0 [49.1–56.9] | 27.1 [23.6–30.6] | 14.2 [12.6–15.7] | |
| Good | 22.2 [16.6–27.9] | 32.0 [28.7–35.4] | 42.4 [38.3–46.5] | 37.0 [35.0–39.0] | |
| Very good/excellent | 8.7 [5.0–12.3] | 15.0 [12.3–17.6] | 30.5 [27.0–34.1] | 48.9 [46.6–51.1] | |
| Mental health | <0.0001 | ||||
| Poor/fair | 42.3 [35.4–49.2] | 28.3 [24.6–32.0] | 18.9 [16.0–21.7] | 11.8 [10.2–13.3] | |
| Good | 31.2 [25.4–37.0] | 39.2 [35.3–43.0] | 40.0 [36.1–43.8] | 34.4 [32.3–36.4] | |
| Very good/excellent | 26.5 [20.7–32.3] | 32.5 [28.3–36.7] | 41.2 [37.4–45.0] | 53.9 [51.6–56.2] |
| Pain | Emergency Room Visits Odds Ratio [95% Confidence Interval] | Inpatient Discharges Odds Ratio [95% Confidence Interval] | Office Visits Odds Ratio [95% Confidence Interval] | Outpatient Visits Odds Ratio [95% Confidence Interval] |
|---|---|---|---|---|
| Extreme | 3.34 [2.57–4.33] | 4.39 [3.24–5.94] | 1.97 [1.18–3.30] | 1.91 [1.45–2.51] |
| Quite a bit | 2.91 [2.33–3.64] | 3.28 [2.52–4.28] | 1.99 [1.39–2.85] | 1.44 [1.17–1.78] |
| Moderate | 1.61 [1.31–1.97] | 1.27 [0.97–1.66] | 1.34 [1.00–1.80] | 1.26 [1.07–1.49] |
| Little | Reference | Reference | Reference | Reference |
| Variable | Emergency Room Visits Odds Ratio [95% Confidence Interval] | Inpatient Discharges Odds Ratio [95% Confidence Interval] | Office Visits Odds Ratio [95% Confidence Interval] | Outpatient Visits Odds Ratio [95% Confidence Interval] |
|---|---|---|---|---|
| Pain | ||||
| Extreme | 1.72 [1.27–2.33] | 2.10 [1.44–3.08] | 1.65 [0.95–2.89] | 1.24 [0.91–1.69] |
| Quite a bit | 1.75 [1.37–2.24] | 1.66 [1.21–2.28] | 1.47 [1.03–2.11] | 0.89 [0.71–1.11] |
| Moderate | 1.28 [1.02–1.60] | 0.91 [0.67–1.25] | 1.17 [0.84–1.63] | 1.04 [0.87–1.24] |
| Little | Reference | Reference | Reference | Reference |
| Age | ||||
| ≥70 years | 0.59 [0.40–0.89] | 1.86 [1.04–3.32] | 3.16 [1.77–5.63] | 1.79 [1.18–2.72] |
| 60–69 years | 0.53 [0.36–0.79] | 1.40 [0.78–2.53] | 1.04 [0.60–1.80] | 1.45 [0.97–2.18] |
| 50–59 years | 0.56 [0.37–0.85] | 1.01 [0.56–1.83] | 0.88 [0.54–1.42] | 1.32 [0.90–1.95] |
| 40–49 years | 0.69 [0.45–1.06] | 1.27 [0.71–2.30] | 1.37 [0.73–2.56] | 1.29 [0.86–1.95] |
| 30–39 years | 0.66 [0.42–1.06] | 1.24 [0.67–2.33] | 0.79 [0.48–1.32] | 1.15 [0.76–1.75] |
| 18–29 years | Reference | Reference | Reference | Reference |
| Race | ||||
| White | 0.96 [0.77–1.20] | 0.98 [0.74–1.29] | 1.38 [1.03–1.86] | 1.13 [0.92–1.37] |
| Others | Reference | Reference | Reference | Reference |
| Hispanic | ||||
| Yes | 1.06 [0.79–1.43] | 0.92 [0.64–1.31] | 0.61 [0.45–0.83] | 0.75 [0.58–0.98] |
| No | Reference | Reference | Reference | Reference |
| Sex | ||||
| Male | 0.90 [0.73–1.09] | 0.81 [0.64–1.01] | 0.56 [0.43–0.73] | 0.69 [0.59–0.80] |
| Female | Reference | Reference | Reference | Reference |
| Marriage | ||||
| Married | 0.89 [0.74–1.08] | 1.14 [0.93–1.40] | 1.29 [0.94–1.76] | 0.99 [0.85–1.16] |
| Not married | Reference | Reference | Reference | Reference |
| Education | ||||
| ≤High school | 1.09 [0.91–1.30] | 1.24 [1.00–1.54] | 0.48 [0.37–0.64] | 0.78 [0.67–0.91] |
| >High school | Reference | Reference | Reference | Reference |
| Employment | ||||
| Employed | 1.26 [1.00–1.58] | 1.13 [0.87–1.48] | 1.52 [1.13–2.05] | 1.02 [0.83–1.24] |
| Unemployed | Reference | Reference | Reference | Reference |
| Income | ||||
| Low | 1.21 [0.91–1.60] | 1.27 [0.90–1.78] | 0.55 [0.38–0.81] | 0.69 [0.55–0.86] |
| Middle | 1.01 [0.81–1.26] | 1.14 [0.87–1.50] | 0.79 [0.54–1.15] | 0.77 [0.64–0.93] |
| High | Reference | Reference | Reference | Reference |
| Insurance | ||||
| Private | 1.80 [1.08–3.00] | 3.80 [1.71–8.47] | 3.47 [2.30–5.22] | 3.64 [2.15–6.17] |
| Public | 1.96 [1.16–3.31] | 3.83 [1.67–8.78] | 3.36 [2.08–5.44] | 3.46 [2.04–5.88] |
| None | Reference | Reference | Reference | Reference |
| Number of chronic conditions | ||||
| 0–1 | 0.48 [0.36–0.65] | 0.48 [0.33–0.70] | 0.42 [0.19–0.93] | 0.47 [0.35–0.63] |
| 2–3 | 0.57 [0.45–0.73] | 0.51 [0.39–0.68] | 0.90 [0.43–1.91] | 0.67 [0.53–0.84] |
| 4–5 | 0.73 [0.57–0.93] | 0.64 [0.49–0.84] | 2.03 [0.96–4.29] | 0.76 [0.59–0.96] |
| 6+ | Reference | Reference | Reference | Reference |
| Any limitation | ||||
| Yes | 1.40 [1.15–1.71] | 1.45 [1.11–1.90] | 1.83 [1.32–2.54] | 1.57 [1.32–1.88] |
| No | Reference | Reference | Reference | Reference |
| Exercise | ||||
| Yes | 0.86 [0.71–1.04] | 0.89 [0.72–1.10] | 1.00 [0.76–1.32] | 0.93 [0.81–1.07] |
| No | Reference | Reference | Reference | Reference |
| Current smoker | ||||
| Yes | 1.31 [1.04–1.65] | 0.86 [0.64–1.14] | 0.64 [0.47–0.87] | 0.71 [0.57–0.89] |
| No | Reference | Reference | Reference | Reference |
| Health | ||||
| Poor/fair | 1.92 [1.45–2.53] | 2.41 [1.72–3.38] | 1.32 [0.90–1.95] | 1.53 [1.22–1.92] |
| Good | 1.32 [1.03–1.70] | 1.02 [0.77–1.35] | 1.73 [1.23–2.45] | 1.23 [1.01–1.49] |
| Very good/excellent | Reference | Reference | Reference | Reference |
| Mental health | ||||
| Poor/fair | 0.84 [0.66–1.08] | 0.67 [0.48–0.94] | 1.08 [0.74–1.59] | 1.01 [0.81–1.27] |
| Good | 0.98 [0.79–1.20] | 0.87 [0.68–1.12] | 0.91 [0.66–1.24] | 0.94 [0.79–1.12] |
| Very good/excellent | Reference | Reference | Reference | Reference |
Disclaimer/Publisher’s Note: The statements, opinions and data contained in all publications are solely those of the individual author(s) and contributor(s) and not of MDPI and/or the editor(s). MDPI and/or the editor(s) disclaim responsibility for any injury to people or property resulting from any ideas, methods, instructions or products referred to in the content. |
© 2025 by the authors. Licensee MDPI, Basel, Switzerland. This article is an open access article distributed under the terms and conditions of the Creative Commons Attribution (CC BY) license (https://creativecommons.org/licenses/by/4.0/).
Share and Cite
Axon, D.R.; Jensen, B.; Kuemene, J.K.; Leech, M.; Mahmood, E. Pain Intensity and Health Service Utilization in United States Adults with Pain: A Cross-Sectional Database Analysis. Healthcare 2025, 13, 1678. https://doi.org/10.3390/healthcare13141678
Axon DR, Jensen B, Kuemene JK, Leech M, Mahmood E. Pain Intensity and Health Service Utilization in United States Adults with Pain: A Cross-Sectional Database Analysis. Healthcare. 2025; 13(14):1678. https://doi.org/10.3390/healthcare13141678
Chicago/Turabian StyleAxon, David R., Blair Jensen, Jordanne Koulong Kuemene, Mason Leech, and Estabraq Mahmood. 2025. "Pain Intensity and Health Service Utilization in United States Adults with Pain: A Cross-Sectional Database Analysis" Healthcare 13, no. 14: 1678. https://doi.org/10.3390/healthcare13141678
APA StyleAxon, D. R., Jensen, B., Kuemene, J. K., Leech, M., & Mahmood, E. (2025). Pain Intensity and Health Service Utilization in United States Adults with Pain: A Cross-Sectional Database Analysis. Healthcare, 13(14), 1678. https://doi.org/10.3390/healthcare13141678