
Associations of Lower Limb Muscle–Tendon Properties with Dual-Task Gait Variability: A Cross-Age Study

 , ,
, ,
Abstract
1. Introduction
2. Materials and Methods
2.1. Participants
2.2. Sample Size and Power Analysis
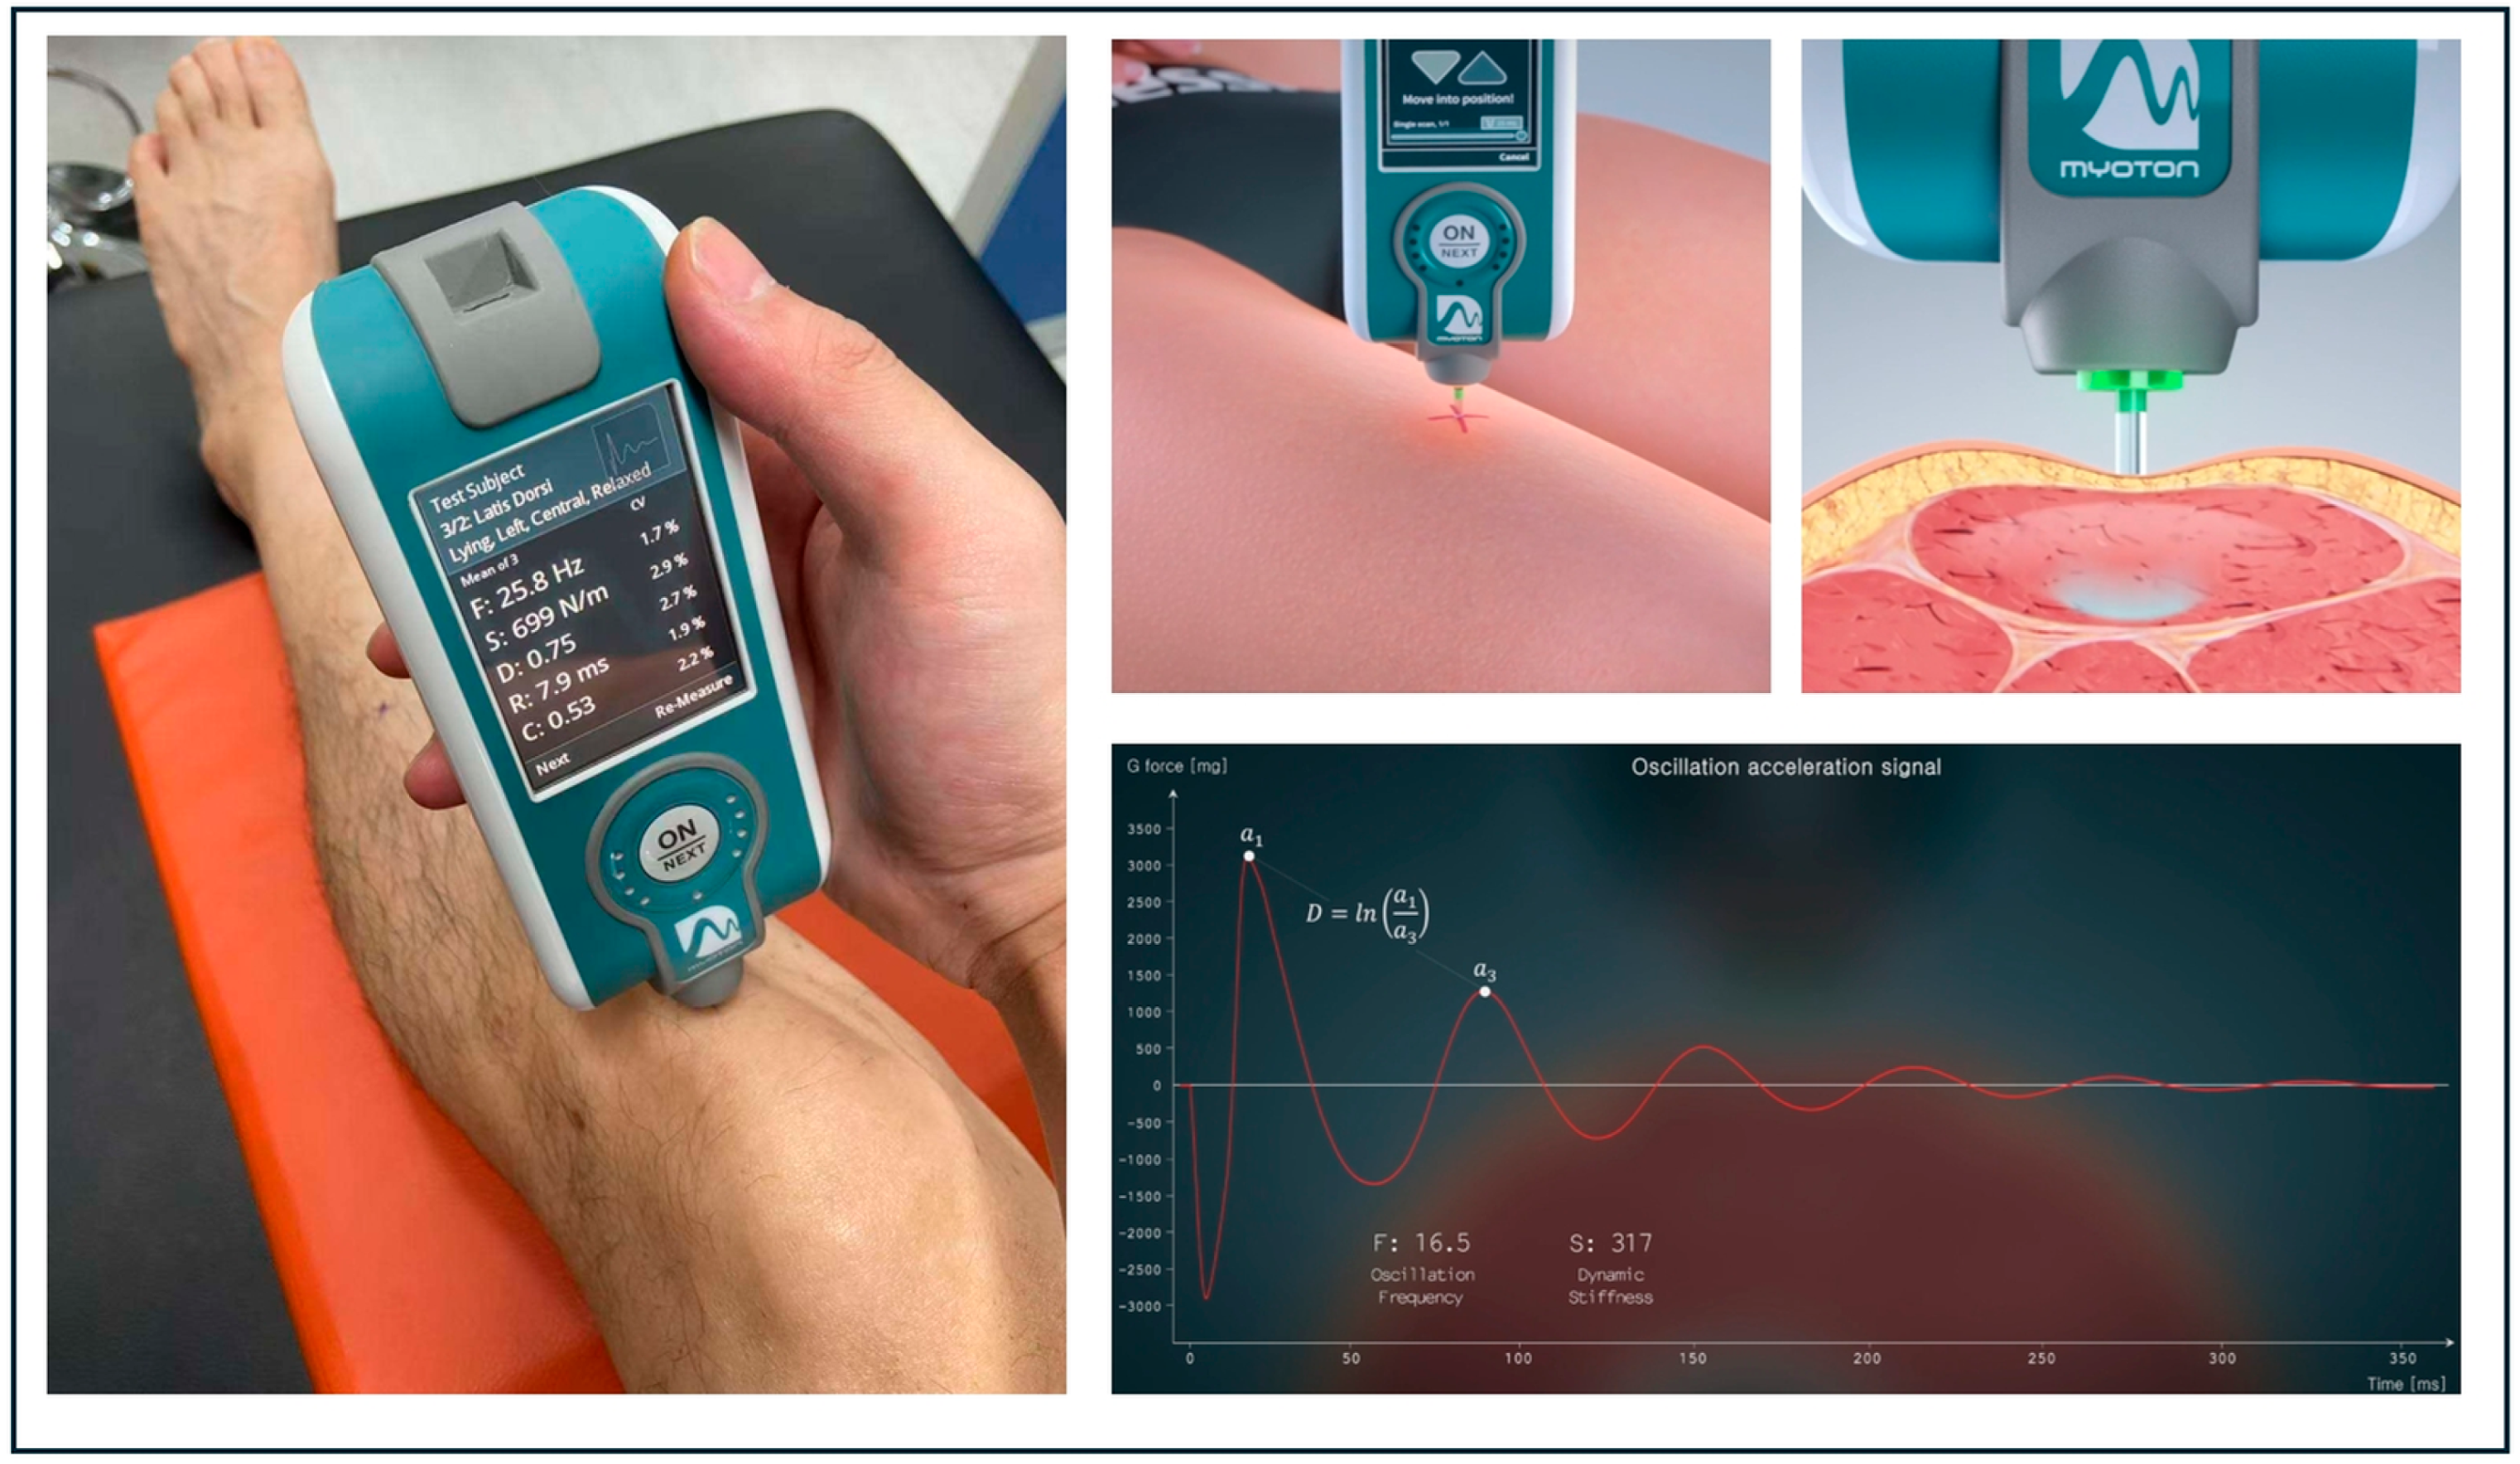
2.3. Stiffness and Elasticity Measurements
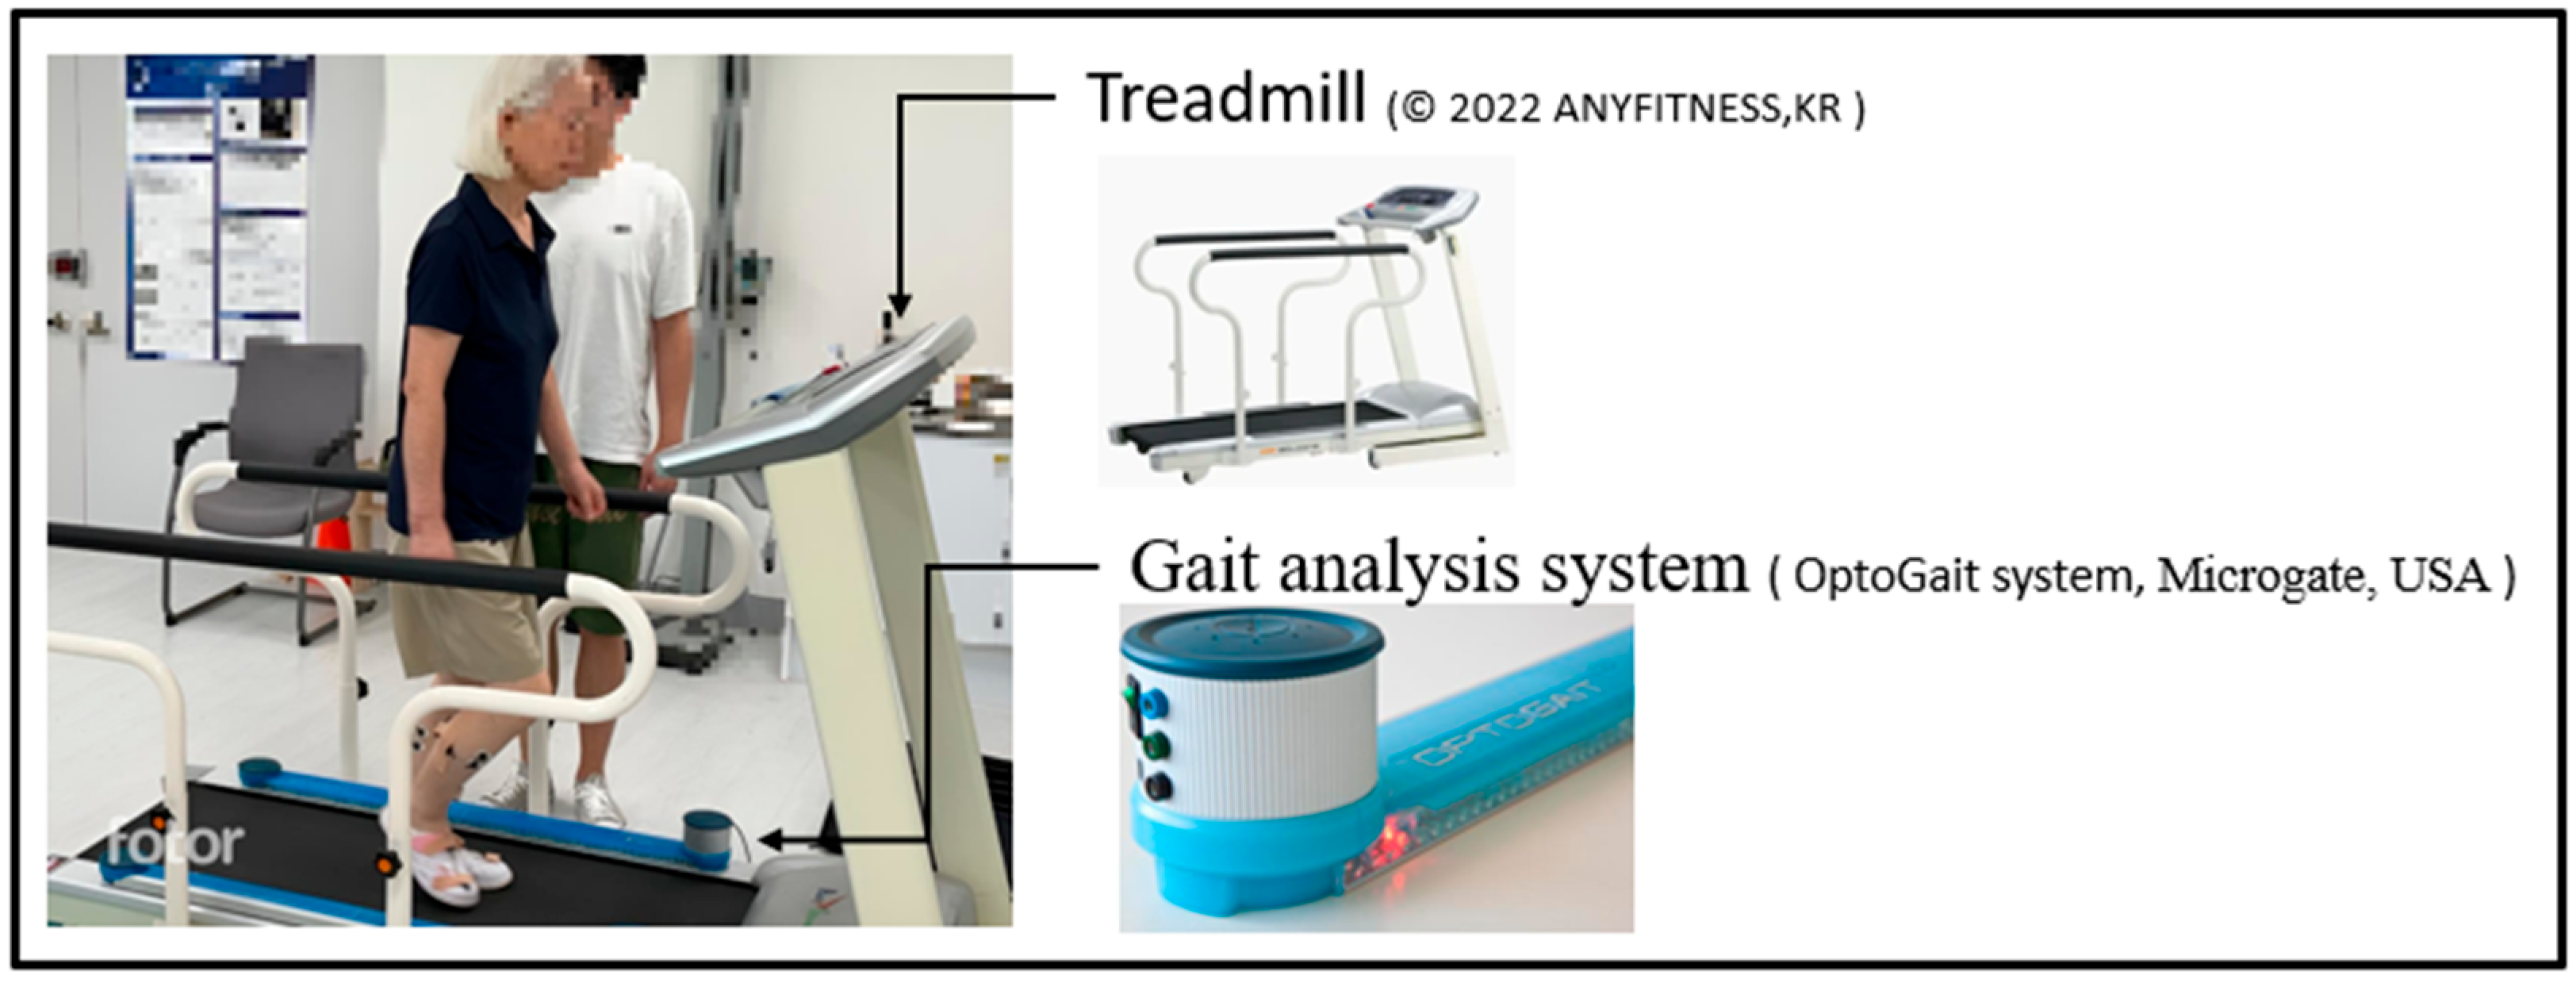
2.4. Gait Measurement
2.5. Statistical Analysis
3. Results
3.1. Subject Characteristics
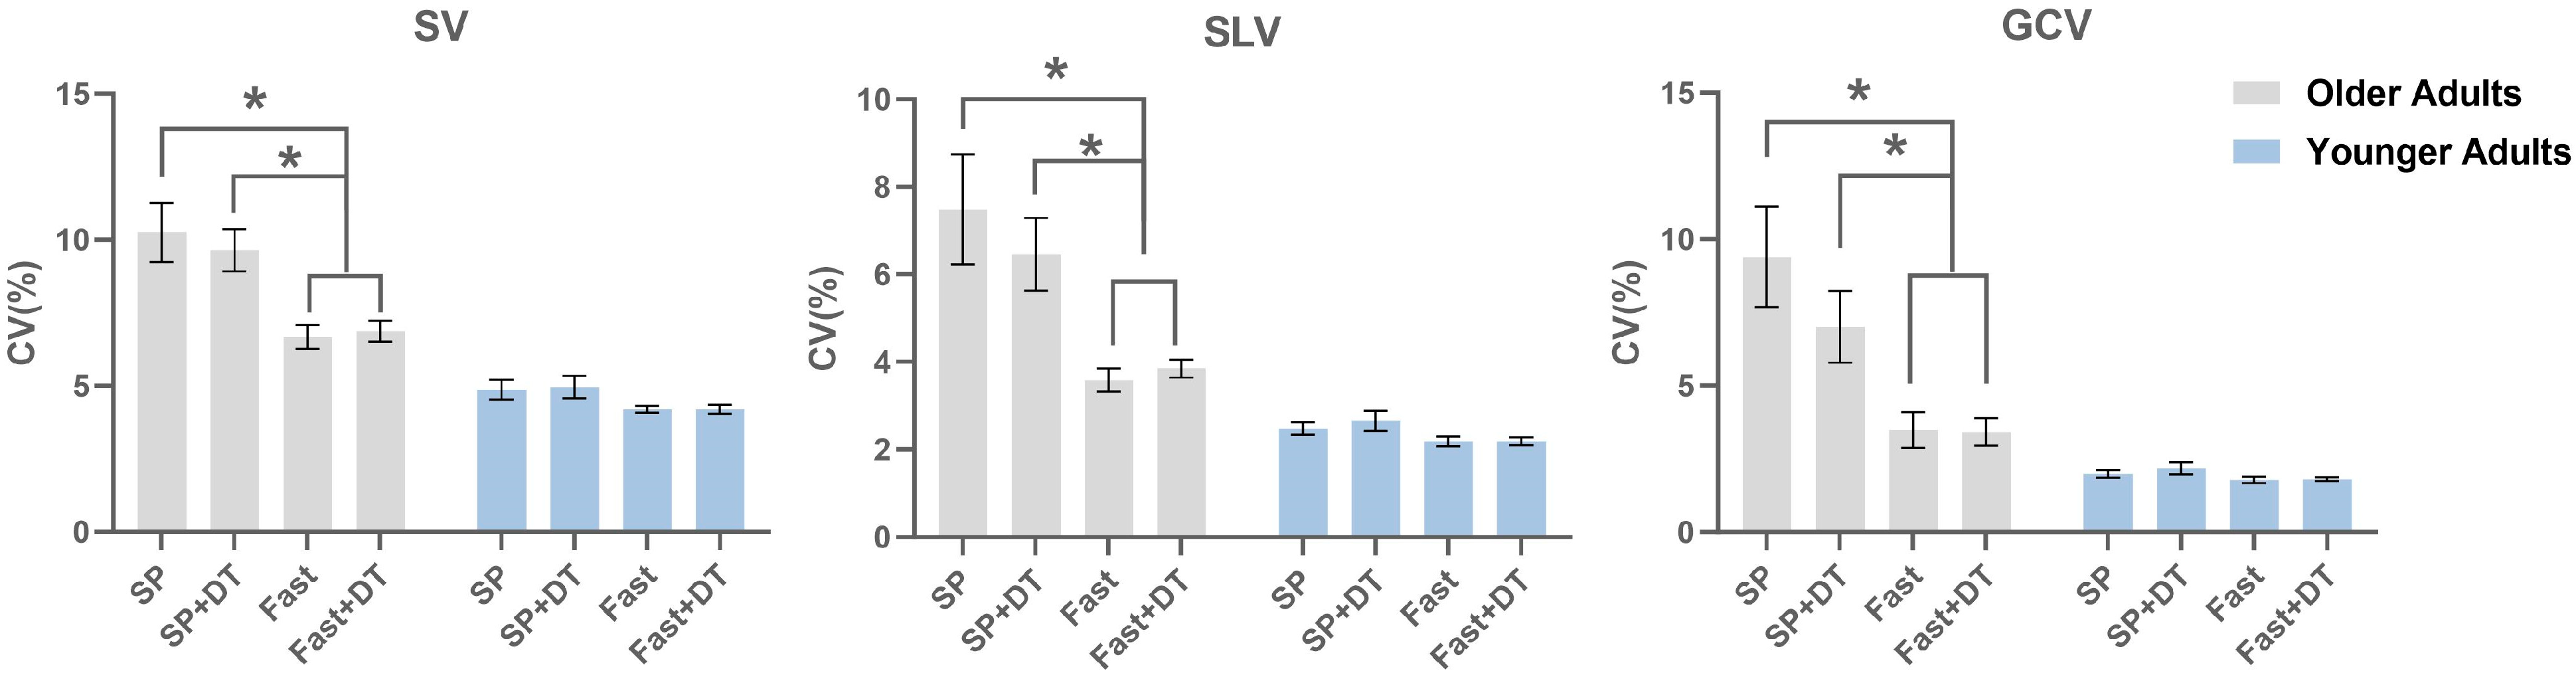
3.2. Gait Variability
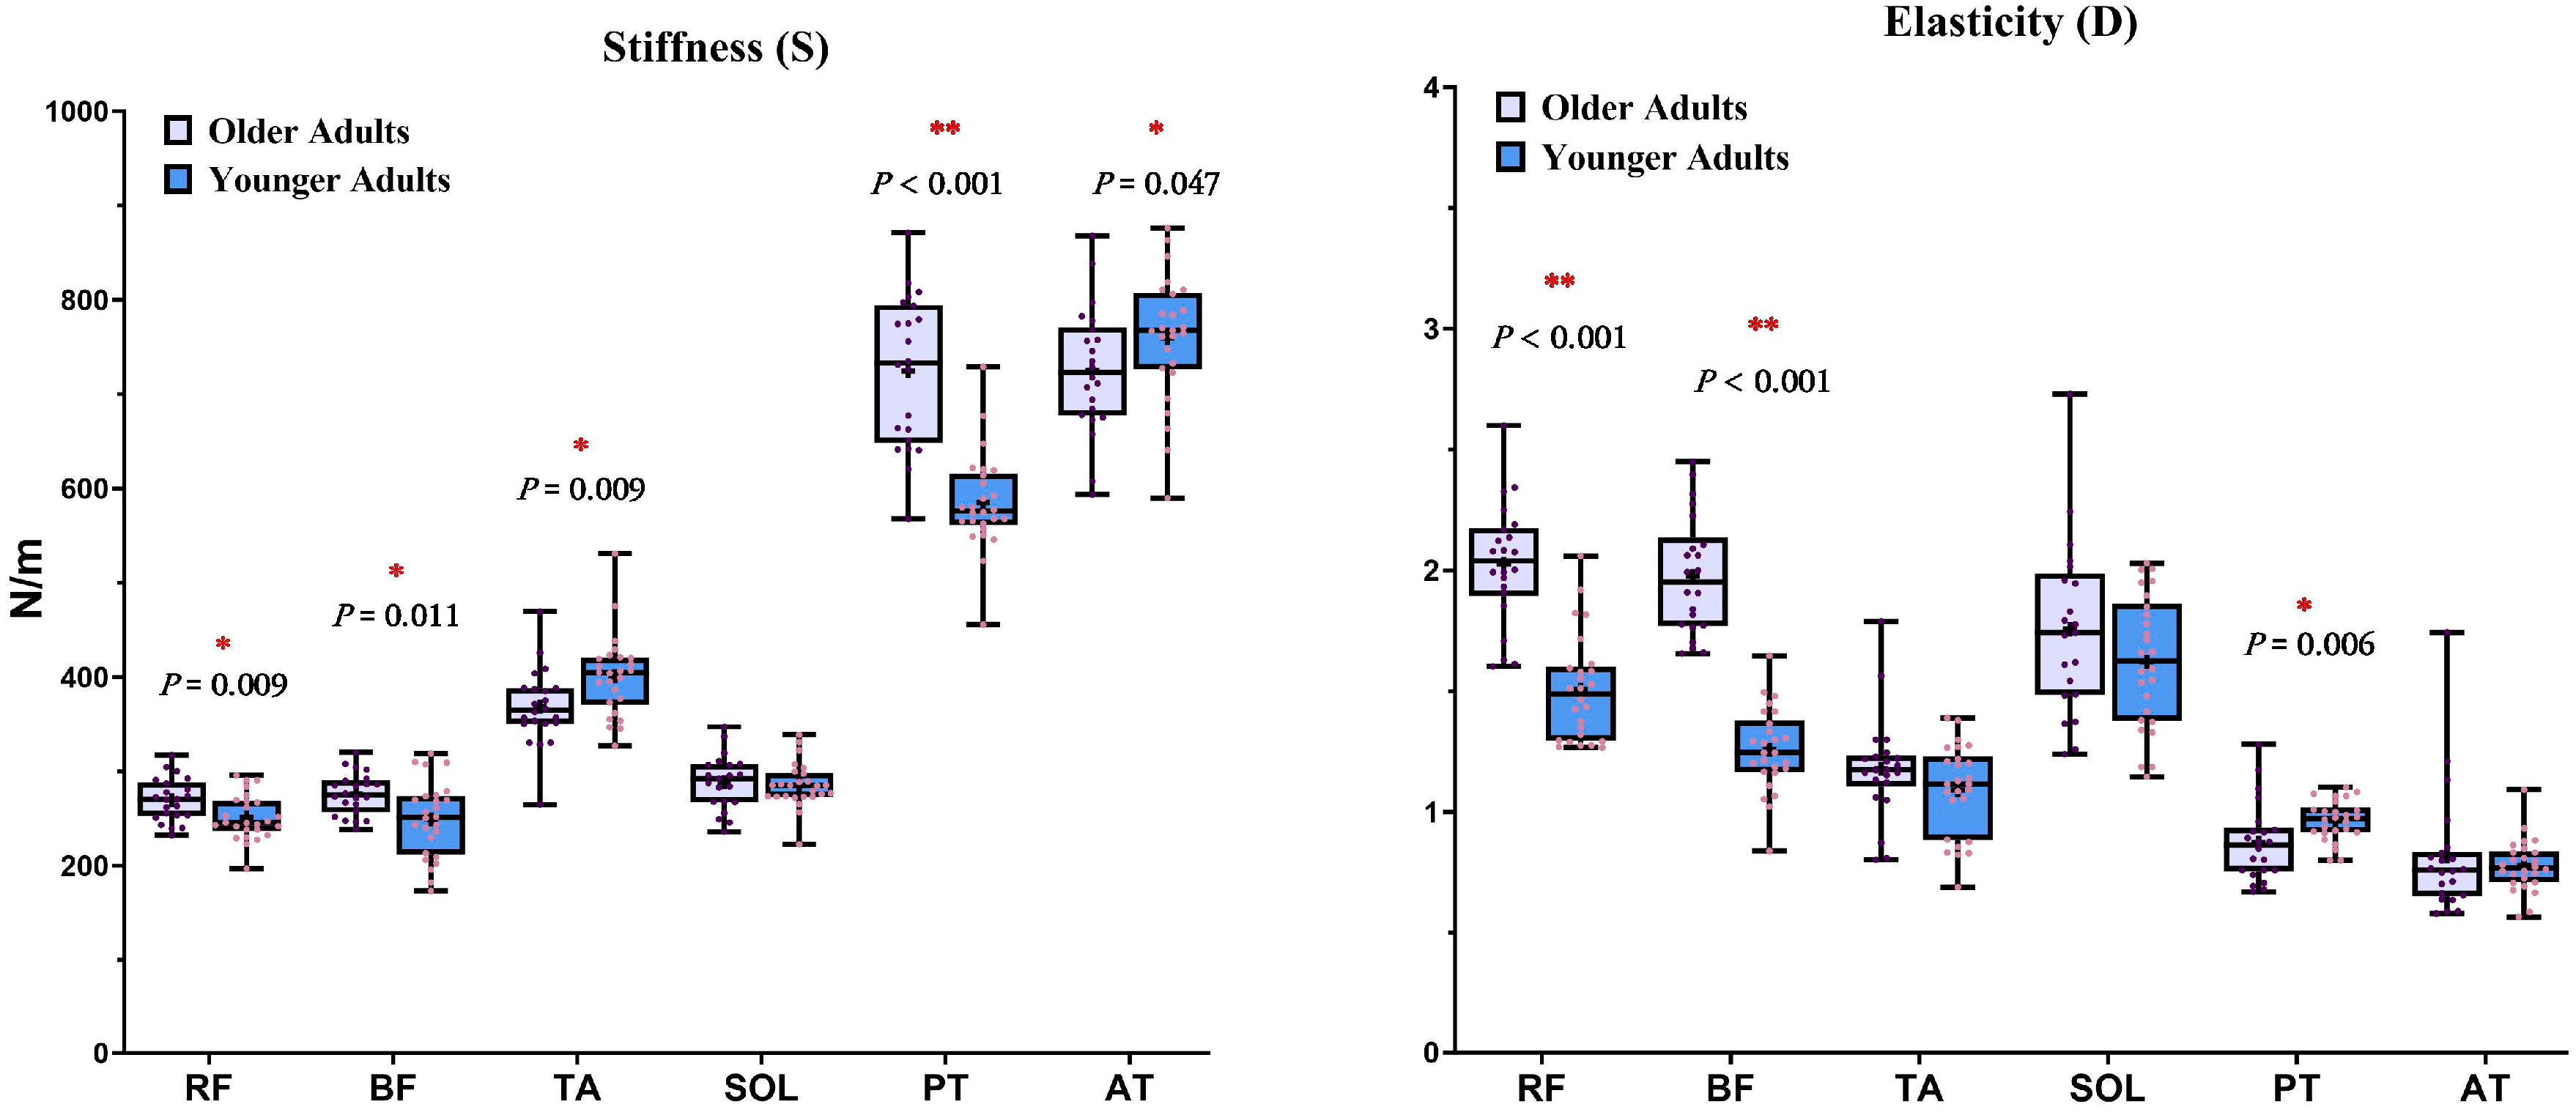
3.3. Mechanical Properties of Muscles and Tendons
4. Discussion
5. Conclusions
Author Contributions
Funding
Institutional Review Board Statement
Informed Consent Statement
Data Availability Statement
Conflicts of Interest
Appendix A

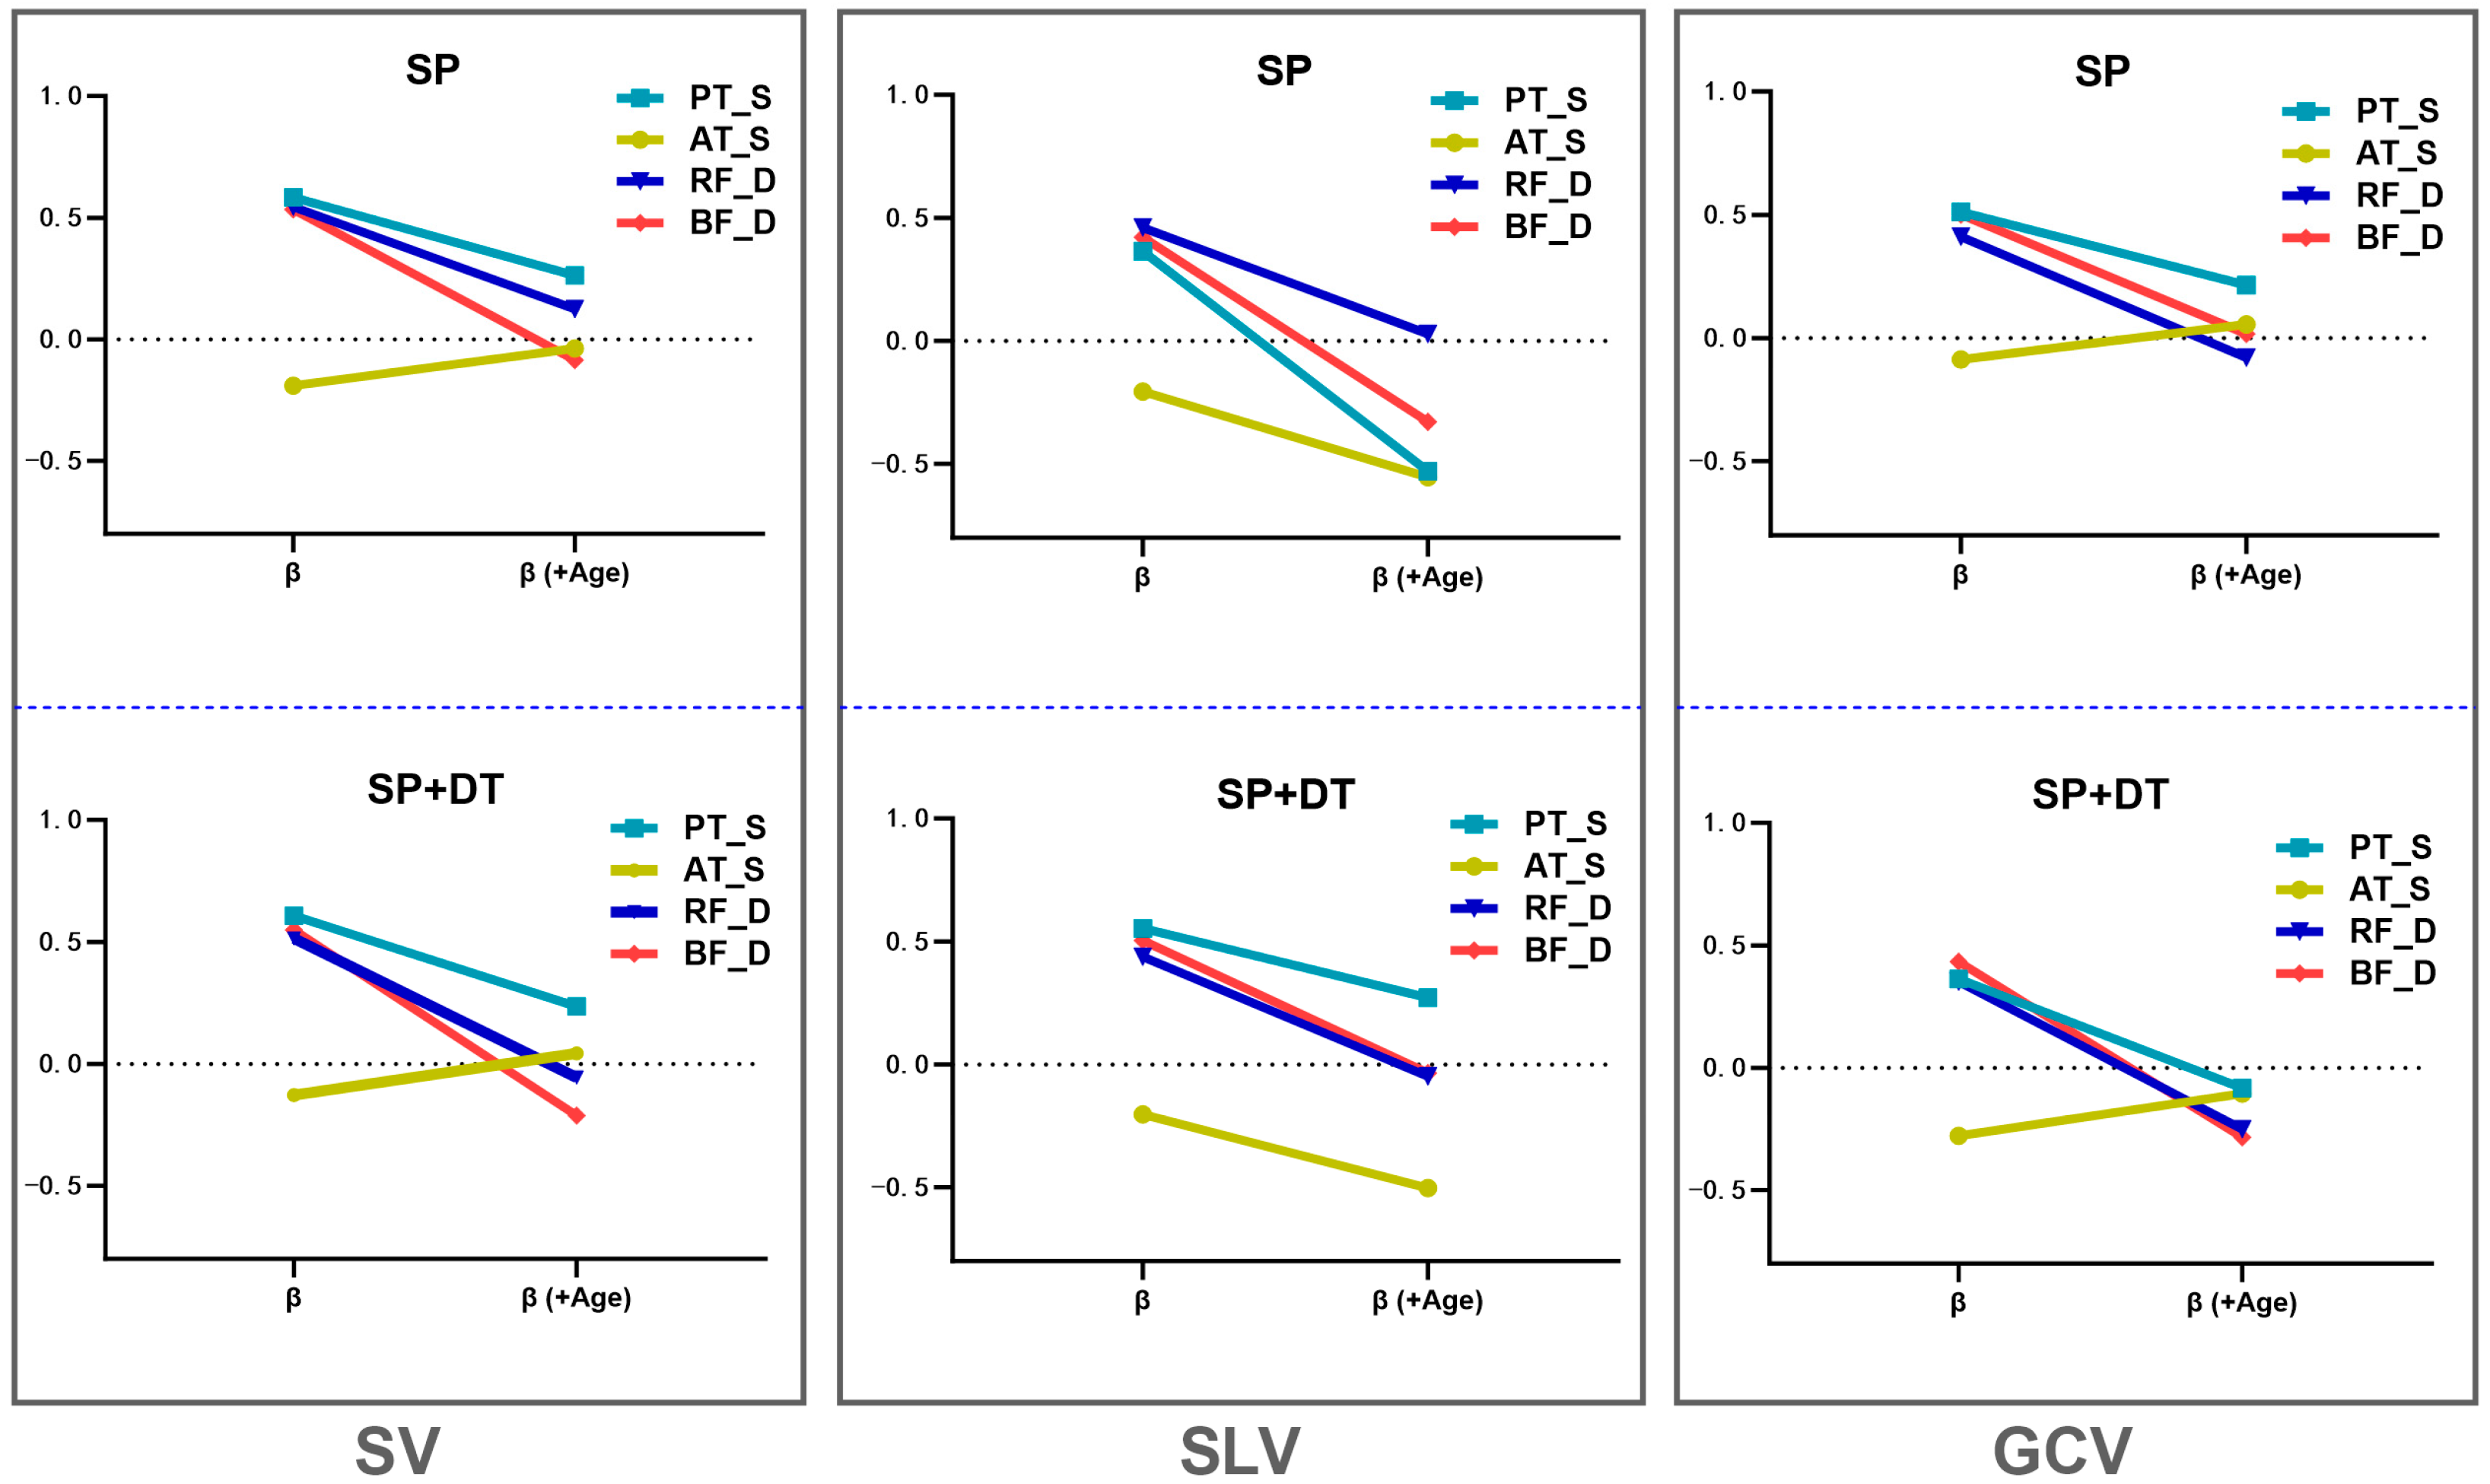
| Condition | Predictor | β | p-Value | β (+Age) | p-Value (+Age) | Δβ | Age p-Value | Adjusted R2 | Adjusted R2 (+Age) | ΔF | ΔF (+Age) | |
|---|---|---|---|---|---|---|---|---|---|---|---|---|
| SV | SP | PT_S | 0.583 | <0.001 | 0.262 | 0.102 | 0.321 | 0.006 | 0.326 | 0.419 | 23.706 (<0.001) | 8.394 (0.006) |
| SP + DT | PT_S | 0.607 | <0.001 | 0.235 | 0.119 | 0.372 | <0.001 | 0.355 | 0.487 | 26.883 (<0.001) | 12.831 (<0.001) | |
| SP | AT_S | −0.191 | 0.385 | −0.037 | 0.193 | 0.154 | 0.753 | 0.016 | 0.384 | 1.746 (0.193) | 28.558 (<0.001) | |
| SP + DT | AT_S | −0.128 | 0.385 | 0.044 | 0.695 | 0.172 | 0.695 | −0.005 | 0.46 | 0.77 (0.385) | 40.62 (<0.001) | |
| SP | RF_D | 0.545 | <0.001 | 0.125 | 0.491 | 0.42 | 0.004 | 0.282 | 0.39 | 19.440 (<0.001) | 9.125 (0.004) | |
| SP + DT | RF_D | 0.514 | <0.001 | −0.056 | 0.741 | 0.57 | <0.001 | 0.248 | 0.46 | 16.514 (<0.001) | 18.993 (<0.001) | |
| SP | BF_D | 0.534 | <0.001 | −0.086 | 0.711 | 0.62 | 0.003 | 0.269 | 0.385 | 18.308 (<0.001) | 9.661 (0.003) | |
| SP + DT | BF_D | 0.549 | <0.001 | −0.212 | 0.325 | 0.761 | <0.001 | 0.286 | 0.47 | 19.843 (<0.001) | 16.941 (<0.001) | |
| SLV | SP | PT_S | 0.364 | 0.011 | −0.529 | 0.599 | 0.893 | <0.001 | 0.114 | 0.311 | 7.019 (0.011) | 14.189 (<0.001) |
| SP + DT | PT_S | 0.553 | <0.001 | 0.271 | 0.108 | 0.282 | 0.019 | 0.291 | 0.359 | 20.277 (<0.001) | 5.889 (0.019) | |
| SP | AT_S | −0.206 | 0.159 | −0.553 | 0.583 | 0.347 | <0.001 | 0.022 | 0.311 | 2.048 (0.159) | 20.349 (<0.001) | |
| SP + DT | AT_S | −0.203 | 0.167 | −0.503 | 0.618 | 0.3 | <0.001 | 0.02 | 0.325 | 1.972 (0.167) | 21.719 (<0.001) | |
| SP | RF_D | 0.46 | 0.001 | 0.029 | 0.881 | 0.431 | 0.006 | 0.195 | 0.307 | 12.354 (0.001) | 8.472 (0.006) | |
| SP + DT | RF_D | 0.438 | 0.002 | −0.048 | 0.802 | 0.486 | 0.002 | 0.175 | 0.322 | 10.93 (0.002) | 10.987 (0.002) | |
| SP | BF_D | 0.421 | 0.003 | −0.329 | 0.175 | 0.75 | <0.001 | 0.16 | 0.335 | 9.924 (0.003) | 13.118 (<0.001) | |
| SP + DT | BF_D | 0.504 | <0.001 | −0.034 | 0.89 | 0.538 | 0.014 | 0.238 | 0.321 | 15.7 (<0.001) | 6.607 (0.014) | |
| GCV | SP | PT_S | 0.512 | <0.001 | 0.214 | 0.213 | 0.298 | 0.017 | 0.246 | 0.322 | 16.321 (<0.001) | 6.183 (0.017) |
| SP + DT | PT_S | 0.363 | 0.012 | −0.082 | 0.63 | 0.445 | <0.001 | 0.113 | 0.318 | 6.842 (0.012) | 14.521 (<0.001) | |
| SP | AT_S | −0.087 | 0.558 | 0.056 | 0.656 | 0.143 | <0.001 | −0.014 | 0.301 | 0.349 (0.558) | 21.758 (<0.001) | |
| SP + DT | AT_S | −0.278 | 0.058 | −0.105 | 0.413 | 0.173 | <0.001 | 0.057 | 0.325 | 3.782 (0.058) | 18.820 (<0.001) | |
| SP | RF_D | 0.411 | 0.004 | −0.079 | 0.685 | 0.49 | 0.002 | 0.151 | 0.301 | 9.375 (0.004) | 10.834 (0.002) | |
| SP + DT | RF_D | 0.352 | 0.015 | −0.25 | 0.191 | 0.602 | <0.001 | 0.104 | 0.34 | 6.348 (0.015) | 17.126 (<0.001) | |
| SP | BF_D | 0.501 | <0.001 | 0.017 | 0.946 | 0.484 | 0.028 | 0.235 | 0.298 | 15.399 (<0.001) | 5.175 (<0.001) | |
| SP + DT | BF_D | 0.434 | 0.002 | −0.284 | 0.24 | 0.718 | <0.001 | 0.17 | 0.336 | 10.423 (0.002) | 12.206 (0.001) | |
| SV | Fast | PT_S | 0.582 | <0.001 | 0.155 | 0.292 | 0.427 | <0.001 | 0.324 | 0.501 | 23.535 (<0.001) | 17.266 (<0.001) |
| Fast + DT | PT_S | 0.589 | <0.001 | 0.145 | 0.312 | 0.444 | <0.001 | 0.333 | 0.525 | 24.444 (<0.001) | 19.664 (<0.001) | |
| Fast | AT_S | −0.267 | 0.067 | −0.098 | 0.362 | −0.169 | <0.001 | 0.051 | 0.498 | 3.519 (0.067) | 41.886 (<0.001) | |
| Fast + DT | AT_S | −0.136 | 0.356 | 0.045 | 0.43 | −0.181 | <0.001 | −0.003 | 0.516 | 0.868 (0.356) | 50.375 (<0.001) | |
| Fast | RF_D | 0.624 | <0.001 | 0.179 | 0.277 | 0.445 | <0.001 | 0.376 | 0.501 | 29.363 (<0.001) | 12.546 (<0.001) | |
| Fast + DT | RF_D | 0.555 | <0.001 | −0.026 | 0.872 | 0.581 | <0.001 | 0.293 | 0.515 | 20.511 (<0.001) | 21.970 (<0.001) | |
| Fast | BF_D | 0.67 | <0.001 | 0.204 | 0.33 | 0.466 | 0.013 | 0.437 | 0.499 | 37.427 (<0.001) | 6.709 (0.013) | |
| Fast + DT | BF_D | 0.617 | <0.001 | −0.068 | 0.741 | 0.685 | <0.001 | 0.368 | 0.516 | 28.346 (<0.001) | 15.025 (<0.001) | |
| SLV | Fast | PT_S | 0.5 | <0.001 | 0.101 | 0.535 | 0.399 | <0.001 | 0.234 | 0.384 | 15.321 (<0.001) | 12.228 (<0.001) |
| Fast + DT | PT_S | 0.576 | <0.001 | 0.069 | 0.609 | 0.507 | <0.001 | 0.317 | 0.572 | 22.828 (<0.001) | 28.376 (<0.001) | |
| Fast | AT_S | −0.252 | 0.084 | −0.102 | 0.388 | −0.15 | <0.001 | 0.043 | 0.389 | 3.111 (<0.001) | 27.037 (<0.001) | |
| Fast + DT | AT_S | −0.224 | 0.126 | −0.039 | 0.693 | −0.185 | <0.001 | 0.03 | 0.571 | 2.429 (0.126) | 59.035 (<0.001) | |
| Fast | RF_D | 0.526 | <0.001 | 0.084 | 0.647 | 0.442 | 0.003 | 0.261 | 0.382 | 17.578 (<0.001) | 9.981 (<0.001) | |
| Fast + DT | RF_D | 0.515 | <0.001 | −0.194 | 0.198 | 0.709 | <0.001 | 0.25 | 0.585 | 16.625 (<0.001) | 38.208 (<0.001) | |
| Fast | BF_D | 0.6 | <0.001 | 0.195 | 0.399 | 0.405 | 0.047 | 0.346 | 0.388 | 25.907 (<0.001) | 4.163 (0.047) | |
| Fast + DT | BF_D | 0.595 | <0.001 | −0.283 | 0.138 | 0.878 | <0.001 | 0.339 | 0.59 | 25.155 (<0.001) | 29.134 (<0.001) | |
| GCV | Fast | PT_S | 0.412 | 0.004 | 0.211 | 0.265 | 0.201 | 0.134 | 0.152 | 0.176 | 9.422 (0.004) | 2.332 (0.134) |
| Fast + DT | PT_S | 0.531 | <0.001 | 0.354 | 0.049 | 0.177 | 0.157 | 0.266 | 0.283 | 18.027 (<0.001) | 2.067 (<0.001) | |
| Fast | AT_S | −0.003 | 0.985 | 0.11 | 0.429 | −0.113 | 0.002 | −0.022 | 0.164 | 0.0004 (0.985) | 11.241 (0.002) | |
| Fast + DT | AT_S | 0.025 | 0.863 | 0.157 | 0.237 | −0.132 | <0.001 | −0.021 | 0.241 | 0.03 (0.863) | 16.901 (<0.001) | |
| Fast | RF_D | 0.315 | 0.029 | −0.052 | 0.806 | 0.367 | 0.03 | 0.08 | 0.154 | 5.064 (0.029) | 5.026 (0.030) | |
| Fast + DT | RF_D | 0.299 | 0.039 | −0.219 | 0.281 | 0.518 | 0.002 | 0.07 | 0.237 | 4.511 (0.039) | 11.114 (0.002) | |
| Fast | BF_D | 0.446 | 0.002 | 0.278 | 0.302 | 0.168 | 0.473 | 0.181 | 0.173 | 11.398 (0.002) | 0.524 (0.473) | |
| Fast + DT | BF_D | 0.435 | 0.002 | 0.003 | 0.99 | 0.432 | 0.061 | 0.171 | 0.217 | 10.716 (0.002) | 3.685 (0.061) |
References
- Fuller, G.F. Falls in the elderly. Am. Fam. Physician 2000, 61, 2159–2168. [Google Scholar]
- Kim, U.; Lim, J.; Park, Y.; Bae, Y. Predicting fall risk through step width variability at increased gait speed in community dwelling older adults. Sci. Rep. 2025, 15, 16915. [Google Scholar] [CrossRef]
- Hollman, J.H.; McDade, E.M.; Petersen, R.C. Normative spatiotemporal gait parameters in older adults. Gait Posture 2011, 34, 111–118. [Google Scholar] [CrossRef]
- Lamoth, C.J.; van Deudekom, F.J.; van Campen, J.P.; Appels, B.A.; de Vries, O.J.; Pijnappels, M. Gait stability and variability measures show effects of impaired cognition and dual tasking in frail people. J. Neuroeng. Rehabil. 2011, 8, 2. [Google Scholar] [CrossRef]
- Hausdorff, J.M.; Rios, D.A.; Edelberg, H.K. Gait variability and fall risk in community-living older adults: A 1-year prospective study. Arch. Phys. Med. Rehabil. 2001, 82, 1050–1056. [Google Scholar] [CrossRef]
- Brach, J.S.; Berlin, J.E.; VanSwearingen, J.M.; Newman, A.B.; Studenski, S.A. Too much or too little step width variability is associated with a fall history in older persons who walk at or near normal gait speed. J. Neuroeng. Rehabil. 2005, 2, 21. [Google Scholar] [CrossRef]
- Montero-Odasso, M.; Muir, S.W.; Hall, M.; Doherty, T.J.; Kloseck, M.; Beauchet, O.; Speechley, M. Gait variability is associated with frailty in community-dwelling older adults. J. Gerontol. Ser. A Biomed. Sci. Med. Sci. 2011, 66, 568–576. [Google Scholar] [CrossRef]
- Callisaya, M.L.; Blizzard, L.; McGinley, J.L.; Schmidt, M.D.; Srikanth, V.K. Sensorimotor factors affecting gait variability in older people—A population-based study. J. Gerontol. Ser. A Biomed. Sci. Med. Sci. 2010, 65, 386–392. [Google Scholar] [CrossRef]
- Thaler-Kall, K.; Peters, A.; Thorand, B.; Grill, E.; Autenrieth, C.S.; Horsch, A.; Meisinger, C. Description of spatio-temporal gait parameters in elderly people and their association with history of falls: Results of the population-based cross-sectional KORA-Age study. BMC Geriatr. 2015, 15, 32. [Google Scholar] [CrossRef] [PubMed]
- Beauchet, O.; Kressig, R.W.; Najafi, B.; Aminian, K.; Dubost, V.; Mourey, F. Age-related decline of gait control under a dual-task condition. J. Am. Geriatr. Soc. 2003, 51, 1187–1188. [Google Scholar] [CrossRef] [PubMed]
- Silva, J.; Atalaia, T.; Abrantes, J.; Aleixo, P. Gait biomechanical parameters related to falls in the elderly: A systematic review. Biomechanics 2024, 4, 165–218. [Google Scholar] [CrossRef]
- Maki, B.E. Gait changes in older adults: Predictors of falls or indicators of fear? J. Am. Geriatr. Soc. 1997, 45, 313–320. [Google Scholar] [CrossRef]
- Amboni, M.; Barone, P.; Hausdorff, J.M. Cognitive contributions to gait and falls: Evidence and implications. Mov. Disord. 2013, 28, 1520–1533. [Google Scholar] [CrossRef]
- Kressig, R.W.; Herrmann, F.R.; Grandjean, R.; Michel, J.P.; Beauchet, O. Gait variability while dual-tasking: Fall predictor in older inpatients? Aging Clin. Exp. Res. 2008, 20, 123–130. [Google Scholar] [CrossRef]
- Yogev-Seligmann, G.; Hausdorff, J.M.; Giladi, N. The role of executive function and attention in gait. Mov. Disord. Off. J. Mov. Disord. Soc. 2008, 23, 329–342. [Google Scholar] [CrossRef]
- McGibbon, C.A. Toward a better understanding of gait changes with age and disablement: Neuromuscular adaptation. Exerc. Sport Sci. Rev. 2003, 31, 102. [Google Scholar] [CrossRef]
- Bojsen-Møller, J.; Magnusson, S.P.; Rasmussen, L.R.; Kjaer, M.; Aagaard, P. Muscle performance during maximal isometric and dynamic contractions is influenced by the stiffness of the tendinous structures. J. Appl. Physiol. 2005, 99, 986–994. [Google Scholar] [CrossRef]
- Salsich, G.B.; Mueller, M.J. Effect of plantar flexor muscle stiffness on selected gait characteristics. Gait Posture 2000, 11, 207–216. [Google Scholar] [CrossRef]
- Kragstrup, T.W.; Kjaer, M.; Mackey, A.L. Structural, biochemical, cellular, and functional changes in skeletal muscle extracellular matrix with aging. Scand. J. Med. Sci. Sports 2011, 21, 749–757. [Google Scholar] [CrossRef] [PubMed]
- Vandervoort, A.A. Aging of the human neuromuscular system. Muscle Nerve 2002, 25, 17–25. [Google Scholar] [CrossRef]
- Ochala, J.; Frontera, W.R.; Dorer, D.J.; Van Hoecke, J.; Krivickas, L.S. Single skeletal muscle fiber elastic and contractile characteristics in young and older men. J. Gerontol. Biol. Sci. 2007, 62, 375–381. [Google Scholar] [CrossRef] [PubMed]
- Lee, M.T.; Wu, C.Y.; Chen, C.W.; Cheng, H.L.; Chen, C.C.; Hsieh, Y.W. Age and sex differences in the biomechanical and viscoelastic properties of upper limb muscles in middle-aged and older adults: A pilot study. J. Biomech. 2022, 134, 111002. [Google Scholar] [CrossRef]
- Ceker, E.; Fadiloglu, A.; Cataltepe, E.; Sendur, H.N.; Allahverdiyeva, S.; Varan, H.D. Predictive ability of Achilles tendon elastography for frailty in older adults. Eur. Geriatr. Med. 2024, 15, 1461–1468. [Google Scholar] [CrossRef] [PubMed]
- Alfuraih, A.M.; Tan, A.L.; O’Connor, P.; Emery, P.; Wakefield, R.J. The effect of ageing on shear wave elastography muscle stiffness in adults. Aging Clin. Exp. Res. 2019, 31, 1755–1763. [Google Scholar] [CrossRef]
- Cacko, D.; Lewandowski, M. Shear wave elastography implementation on a portable research ultrasound system: Initial results. Appl. Sci. 2022, 12, 6210. [Google Scholar] [CrossRef]
- McGowen, J.M.; Hoppes, C.W.; Forsse, J.S.; Albin, S.R.; Abt, J.; Koppenhaver, S.L. The utility of myotonometry in musculoskeletal rehabilitation and human performance programming. J. Athl. Train. 2023, 58, 305–318. [Google Scholar] [CrossRef]
- Do, Y.; Lall, P.S.; Lee, H. Assessing the effects of aging on muscle stiffness using shear wave elastography and myotonometer. Healthcare 2021, 9, 1733. [Google Scholar] [CrossRef] [PubMed]
- Çekok, F.K.; Taş, S.; Aktaş, A. Muscle and tendon stiffness of lower extremity in older adults with fall history: Stiffness effect on physical performance and fall risk. Geriatr. Nurs. 2024, 59, 228–233. [Google Scholar] [CrossRef]
- van Iersel, M.B.; Ribbers, H.; Munneke, M.; Borm, G.F.; Rikkert, M.G.O. The effect of cognitive dual tasks on balance during walking in physically fit elderly people. Arch. Phys. Med. Rehabil. 2007, 88, 187–191. [Google Scholar] [CrossRef] [PubMed]
- DeVita, P.; Hortobagyi, T. Age causes a redistribution of joint torques and powers during gait. J. Appl. Physiol. 2000, 88, 1804–1811. [Google Scholar] [CrossRef]
- Hansen, M.; Kongsgaard, M.; Holm, L.; Skovgaard, D.; Magnusson, S.P.; Qvortrup, K.; Larsen, J.O.; Aagaard, P.; Dahl, M.; Serup, A.; et al. Effect of estrogen on tendon collagen synthesis, tendon structural characteristics, and biomechanical properties in postmenopausal women. J. Appl. Physiol. 2009, 106, 1385–1393. [Google Scholar] [CrossRef] [PubMed]
- Dubost, V.; Kressig, R.W.; Gonthier, R.; Herrmann, F.R.; Aminian, K.; Najafi, B.; Beauchet, O. Relationships between dual-task related changes in stride velocity and stride time variability in healthy older adults. Hum. Mov. Sci. 2006, 25, 372–382. [Google Scholar] [CrossRef] [PubMed]
- Bloem, B.R.; Valkenburg, V.V.; Slabbekoorn, M.; Willemsen, M.D. The Multiple Tasks Test: Development and normal strategies. Gait Posture 2001, 14, 191–202. [Google Scholar] [CrossRef]
- Callisaya, M.L.; Blizzard, L.; Schmidt, M.D.; McGinley, J.L.; Srikanth, V.K. Ageing and gait variability—A population-based study of older people. Age Ageing 2010, 39, 191–197. [Google Scholar] [CrossRef] [PubMed]
- Frenkel-Toledo, S.; Giladi, N.; Peretz, C.; Herman, T.; Gruendlinger, L.; Hausdorff, J.M. Treadmill walking as an external pacemaker to improve gait rhythm and stability in Parkinson’s disease. Mov. Disord. Off. J. Mov. Disord. Soc. 2005, 20, 1109–1114. [Google Scholar] [CrossRef]
- Kang, H.G.; Dingwell, J.B. Separating the effects of age and walking speed on gait variability. Gait Posture 2008, 27, 572–577. [Google Scholar] [CrossRef] [PubMed]
- Beurskens, R.; Bock, O. Age-related deficits of dual-task walking: A review. Neural Plast. 2012, 2012, 131608. [Google Scholar] [CrossRef]
- Jing, H.; Chen, Y.; Liang, B.; Tian, Z.; Song, F.; Chen, M.; Kong, W.; Duan, Y. Risk factors for falls in older people with pre-frailty: A systematic review and meta-analysis. Geriatr. Nurs. 2025, 62, 272–279. [Google Scholar] [CrossRef]
- Saito, A.; Wakasa, M.; Kimoto, M.; Ishikawa, T.; Tsugaruya, M.; Kume, Y.; Okada, K. Age-related changes in muscle elasticity and thickness of the lower extremities are associated with physical functions among community-dwelling older women. Geriatr. Gerontol. Int. 2019, 19, 61–65. [Google Scholar] [CrossRef]
- Ochala, J.; Lambertz, D.; Pousson, M.; Goubel, F.; Van Hoecke, J. Changes in mechanical properties of human plantar flexor muscles in ageing. Exp. Gerontol. 2004, 39, 349–358. [Google Scholar] [CrossRef]
- Valour, D.; Pousson, M. Compliance changes of the series elastic component of elbow flexor muscles with age in humans. Pflügers Arch.-Eur. J. Physiol. 2003, 445, 721–727. [Google Scholar] [CrossRef] [PubMed]
- Couppé, C.; Hansen, P.; Kongsgaard, M.; Kovanen, V.; Suetta, C.; Aagaard, P.; Kjaer, M.; Magnusson, S.P. Mechanical properties and collagen cross-linking of the patellar tendon in old and young men. J. Appl. Physiol. 2009, 107, 880–886. [Google Scholar] [CrossRef] [PubMed]
- Avery, N.C.; Bailey, A.J. Enzymic and non-enzymic cross-linking mechanisms in relation to turnover of collagen: Relevance to aging and exercise. Scand. J. Med. Sci. Sports 2005, 15, 231–240. [Google Scholar] [CrossRef]
- Fukunaga, T.; Kubo, K.; Kawakami, Y.; Fukashiro, S.; Kanehisa, H.; Maganaris, C.N. In vivo behaviour of human muscle tendon during walking. Proc. R. Soc. B Biol. Sci. 2001, 268, 229–233. [Google Scholar] [CrossRef]
- Epro, G.; McCrum, C.; Mierau, A.; Leyendecker, M.; Brüggemann, G.P.; Karamanidis, K. Effects of triceps surae muscle strength and tendon stiffness on the reactive dynamic stability and adaptability of older female adults during perturbed walking. J. Appl. Physiol. 2018, 124, 1541–1549. [Google Scholar] [CrossRef] [PubMed]
- Delabastita, T.; Bogaerts, S.; Vanwanseele, B. Age-related changes in Achilles tendon stiffness and impact on functional activities: A systematic review and meta-analysis. J. Aging Phys. Act. 2018, 27, 116–127. [Google Scholar] [CrossRef]
- Boyer, K.A.; Hayes, K.L.; Umberger, B.R.; Adamczyk, P.G.; Bean, J.F.; Brach, J.S.; Clark, B.C.; Clark, D.J.; Ferrucci, L.; Finley, J.; et al. Age-related changes in gait biomechanics and their impact on the metabolic cost of walking: Report from a National Institute on Aging workshop. Exp. Gerontol. 2023, 173, 112102. [Google Scholar] [CrossRef]
- Krupenevich, R.L.; Beck, O.N.; Sawicki, G.S.; Franz, J.R. Reduced Achilles tendon stiffness disrupts calf muscle neuromechanics in elderly gait. Gerontology 2022, 68, 241–251. [Google Scholar] [CrossRef]
- Taş, S.; Yüzbaşıoğlu, Ü.; Ekici, E.; Katmerlikaya, A. Sex-related differences in human tendon stiffness: A systematic review and meta-analysis. Indian J. Orthop. 2025, 1–12. [Google Scholar] [CrossRef]
- Hollman, J.H.; Watkins, M.K.; Imhoff, A.C.; Braun, C.E.; Akervik, K.A.; Ness, D.K. A comparison of variability in spatiotemporal gait parameters between treadmill and overground walking conditions. Gait Posture 2016, 43, 204–209. [Google Scholar] [CrossRef]
- Warren, W.H.; Kay, B.A.; Zosh, W.D.; Duchon, A.P.; Sahuc, S. Optic flow is used to control human walking. Nat. Neurosci. 2001, 4, 213–216. [Google Scholar] [CrossRef] [PubMed]
| Parameters | Older Adults | Younger Adults | |
|---|---|---|---|
| Age (years) | 72.05 ± 3.52 | 24.8 ± 2.36 ** | |
| Sex | Male | 8 (36%) | 13 (50%) |
| Female | 14 (64%) | 13 (50%) | |
| Height (cm) | 159.95 ± 6.55 | 168.47 ± 8.89 ** | |
| Weight (kg) | 63.48 ± 10.67 | 61.70 ± 11.81 | |
| BMI (kg/m2) | 24.47 ± 2.86 | 21.38 ± 2.50 ** | |
| SP speed (m/s) | 0.822 ± 0.16 | 1.178± 0.16 ** | |
| Fast speed (m/s) | 1.025 ± 0.16 | 1.44 ± 0.15 ** | |
| SP Step (cm) | 47.06 ± 1.60 | 63.35 ± 1.47 ** | |
| SP + DT Step (cm) | 46.61 ± 1.39 | 63.44 ± 1.28 ** | |
| Fast Step (cm) | 53.00 ± 1.44 | 71.67 ± 1.32 ** | |
| Fast + DT Step (cm) | 53.12 ± 1.36 | 71.74 ± 1.25 ** | |
| Group | Step Length Variability (%) | |||
|---|---|---|---|---|
| SP Speed | SP Speed DT | Fast Speed | Fast Speed | |
| Older | 10.26 ± 4.77 | 9.64 ± 3.40 | 6.67 ± 1.88 | 6.87 ± 1.70 |
| Younger | 4.87 ± 1.72 | 4.96 ± 1.97 | 4.19 ± 0.58 | 4.19 ± 0.77 |
| Between group comparisons | 0.001 | 0.001 | 0.001 | 0.001 |
| Group | Stride Length Variability (%) | |||
| SP Speed | SP Speed DT | Fast Speed | Fast Speed | |
| Older | 7.48 ± 5.89 | 6.46 ± 3.88 | 3.58 ± 1.22 | 3.85 ± 0.97 |
| Younger | 2.48 ± 0.72 | 2.65 ± 1.17 | 2.19 ± 0.59 | 2.19 ± 0.47 |
| Between group comparisons | 0.001 | 0.001 | 0.001 | 0.001 |
| Group | Gait Cycle Time Variability (%) | |||
| SP Speed | SP Speed DT | Fast Speed | Fast Speed | |
| Older | 8.42 ± 6.76 | 7.00 ± 5.62 | 3.09 ± 2.30 | 3.02 ± 1.25 |
| Younger | 1.98 ± 0.64 | 2.18 ± 1.04 | 1.78 ± 0.57 | 1.81 ± 0.34 |
| Between group comparisons | 0.001 | 0.001 | 0.005 | 0.001 |
| Parameters | Right Lower Limb | |||
|---|---|---|---|---|
| Older Adults | Younger Adults | p-Value | ||
| Stiffness (S) | Rectus femoris | 270 (232–317) | 251 (197–296) | 0.009 * |
| Biceps femoris | 276 (238–320) | 249 (173–319) | 0.011 * | |
| Tibialis anterior | 368 (264–469) | 400 (327–531) | 0.009 * | |
| Soleus | 288 (236–347) | 285 (222–339) | 0.653 | |
| Patellar tendon | 724 (568–871) | 585 (456–729) | <0.001 * | |
| Achilles tendon | 725 (593–867) | 759 (590–876) | 0.047 * | |
| Elasticity (D) | Rectus femoris | 2.02 (1.6–2.6) | 1.5 (1.3–2.1) | <0.001 * |
| Biceps femoris | 1.97 (1.7–2.5) | 1.3 (0.8–1.7) | <0.001 * | |
| Tibialis anterior | 1.18 (0.8–1.8) | 1.1 (0.7–1.4) | 0.218 | |
| Soleus | 1.76 (1.2–2.7) | 1.6 (1.2–2.0) | 0.219 | |
| Patellar tendon | 0.87 (0.7–1.3) | 1.0 (0.8–1.1) | 0.006 * | |
| Achilles tendon | 0.82 (0.6–1.7) | 0.8 (0.6–1.1) | 0.656 | |
| Parameters (n = 48) | Stiffness (S) | Elasticity (D) | |||||||||||
|---|---|---|---|---|---|---|---|---|---|---|---|---|---|
| RF | BF | TA | SOL | PT | AT | RF | BF | TA | SOL | PT | AT | ||
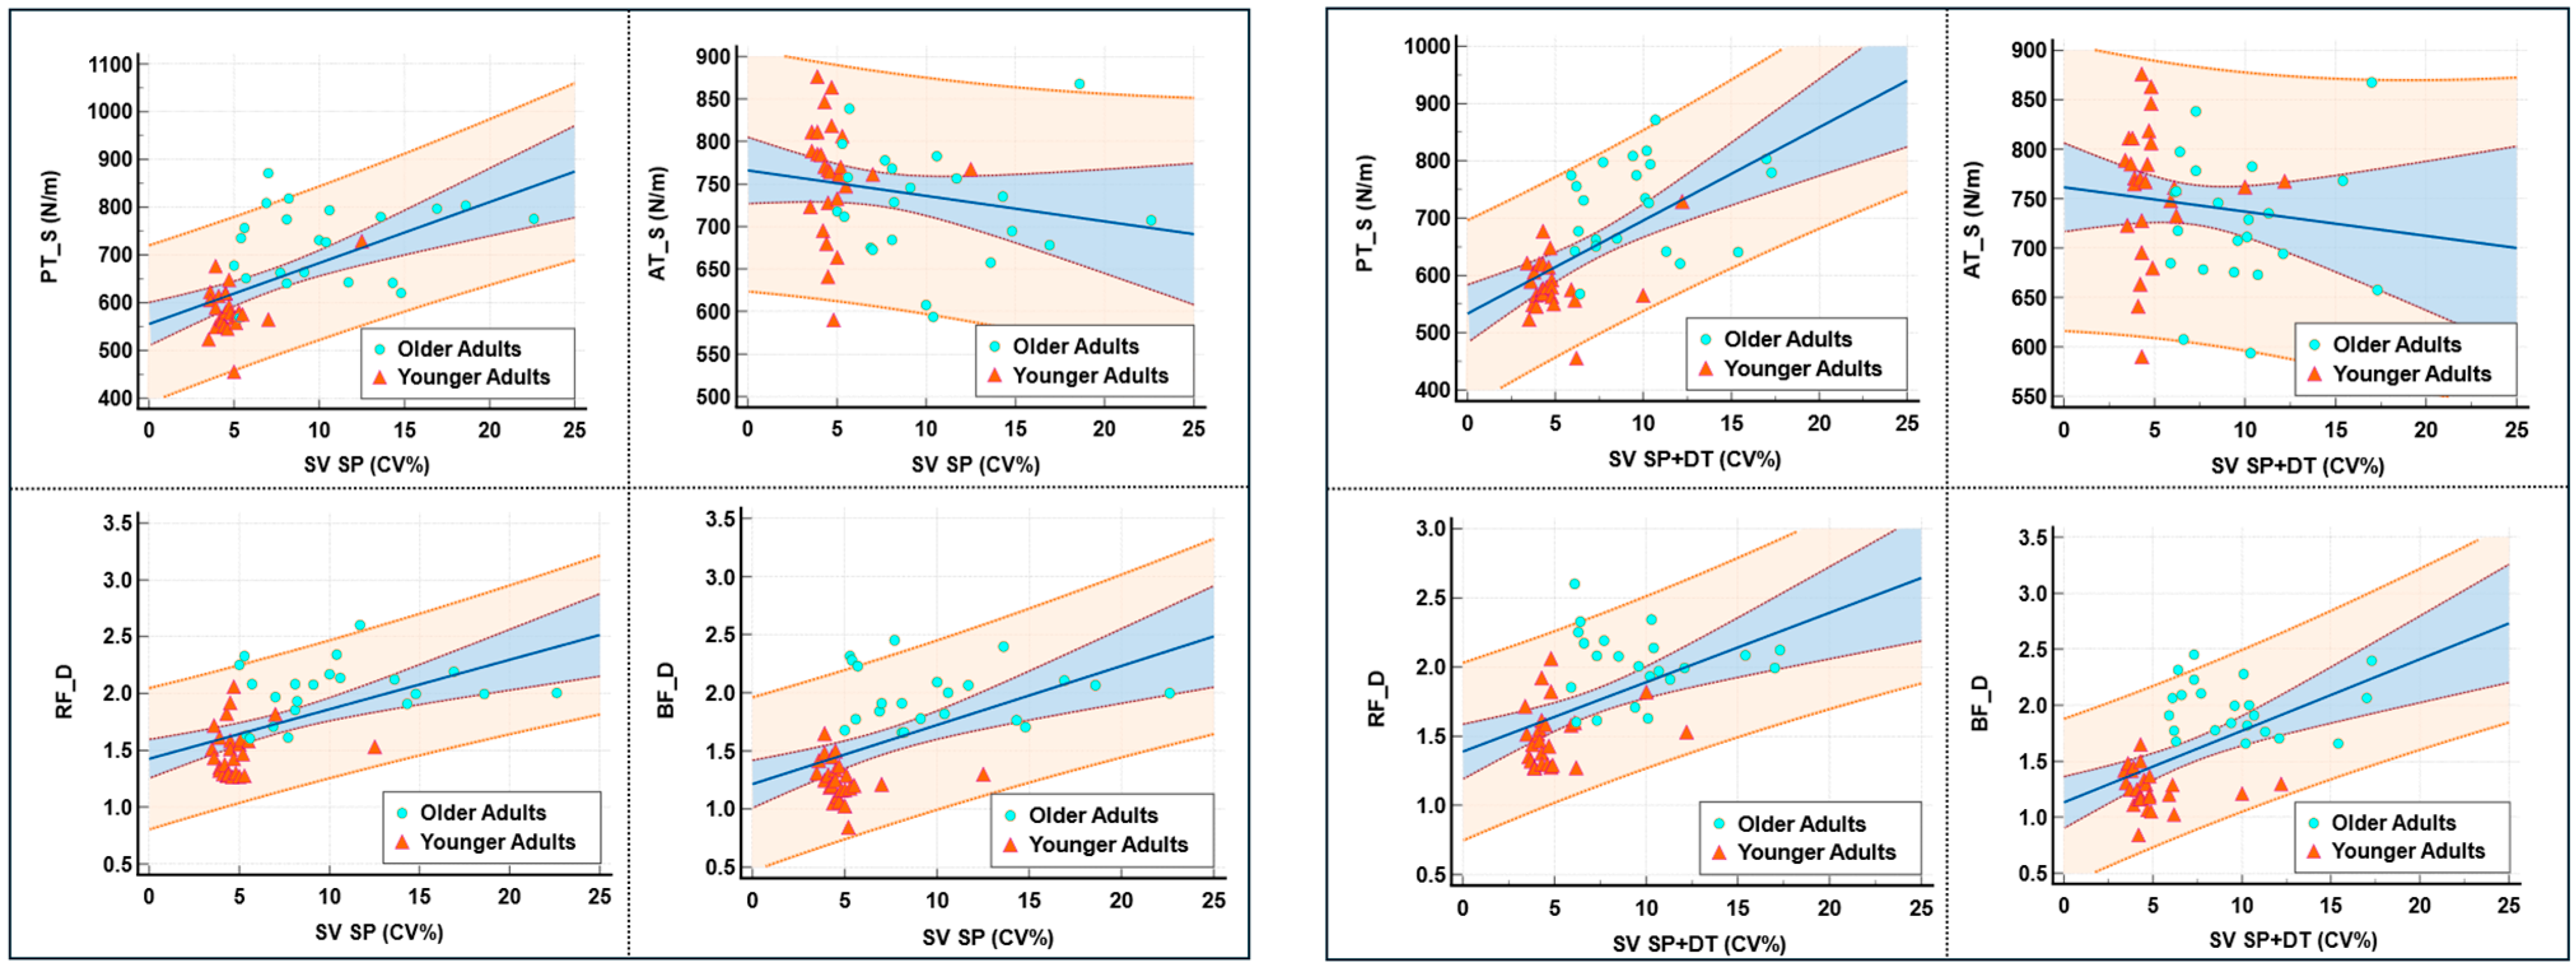
| SV | SP | 0.23 | 0.20 | −0.23 | 0.12 | 0.64 ** | −0.32 * | 0.64 ** | 0.59 ** | 0.05 | 0.30 * | −0.31 * | 0.03 |
| SP + DT | 0.31 * | 0.25 | −0.15 | 0.16 | 0.63 ** | −0.23 | 0.63 ** | 0.60 ** | 0.06 | 0.27 | −0.34 * | −0.01 | |
| Fast | 0.37 ** | 0.28 | −0.24 | 0.09 | 0.66 ** | −0.24 | 0.67 ** | 0.67 ** | 0.05 | 0.20 | −0.38 ** | 0.03 | |
| Fast + DT | 0.33 * | 0.25 | −0.24 | 0.13 | 0.58 ** | −0.22 | 0.61 ** | 0.65 ** | 0.17 | 0.19 | −0.23 | −0.02 | |
| SLV | SP | 0.23 | 0.19 | −0.26 | 0.08 | 0.66 ** | −0.36 * | 0.64 ** | 0.62 ** | 0.07 | 0.21 | −0.38 ** | 0.06 |
| SP + DT | 0.11 | 0.14 | −0.12 | 0.09 | 0.63 ** | −0.34 * | 0.55 ** | 0.58 ** | 0.04 | 0.29 * | −0.39 ** | 0.13 | |
| Fast | 0.28 | 0.28 | −0.21 | 0.04 | 0.66 ** | −0.22 | 0.62 ** | 0.66 ** | 0.07 | 0.15 | −0.33 * | 0.11 | |
| Fast + DT | 0.19 | 0.20 | −0.25 | 0.07 | 0.63 ** | −0.26 | 0.60 ** | 0.66 ** | 0.16 | 0.28 | −0.30 * | 0.12 | |
| GCV | SP | 0.23 | 0.27 | −0.18 | 0.16 | 0.68 ** | −0.32 * | 0.60 ** | 0.69 ** | 0.10 | 0.25 | −0.37 ** | −0.02 |
| SP + DT | 0.15 | 0.20 | −0.19 | 0.08 | 0.62 ** | −0.40 ** | 0.56 ** | 0.62 ** | 0.22 | 0.33 * | −0.24 | 0.19 | |
| Fast | 0.30 * | 0.24 | −0.06 | 0.01 | 0.55 ** | −0.18 | 0.51 ** | 0.56 ** | 0.17 | 0.16 | −0.30 * | 0.02 | |
| Fast + DT | 0.17 | 0.12 | −0.03 | 0.01 | 0.59 ** | −0.37 * | 0.49 ** | 0.58 ** | 0.19 | 0.22 | −0.21 | 0.09 | |
Disclaimer/Publisher’s Note: The statements, opinions and data contained in all publications are solely those of the individual author(s) and contributor(s) and not of MDPI and/or the editor(s). MDPI and/or the editor(s) disclaim responsibility for any injury to people or property resulting from any ideas, methods, instructions or products referred to in the content. |
© 2025 by the authors. Licensee MDPI, Basel, Switzerland. This article is an open access article distributed under the terms and conditions of the Creative Commons Attribution (CC BY) license (https://creativecommons.org/licenses/by/4.0/).
Share and Cite
Dong, Z.; Moon, Y.; Lee, S.K.; Yun, H.-y.; Song, J.; Xu, J.; Shin, M.J.; Im, D.; Wang, X. Associations of Lower Limb Muscle–Tendon Properties with Dual-Task Gait Variability: A Cross-Age Study. Healthcare 2025, 13, 1375. https://doi.org/10.3390/healthcare13121375
Dong Z, Moon Y, Lee SK, Yun H-y, Song J, Xu J, Shin MJ, Im D, Wang X. Associations of Lower Limb Muscle–Tendon Properties with Dual-Task Gait Variability: A Cross-Age Study. Healthcare. 2025; 13(12):1375. https://doi.org/10.3390/healthcare13121375
Chicago/Turabian StyleDong, Zheng, YoungJin Moon, Sang Ki Lee, Hwi-yeol Yun, JuWon Song, JiaHao Xu, Min Ju Shin, DuBin Im, and XuanRu Wang. 2025. "Associations of Lower Limb Muscle–Tendon Properties with Dual-Task Gait Variability: A Cross-Age Study" Healthcare 13, no. 12: 1375. https://doi.org/10.3390/healthcare13121375
APA StyleDong, Z., Moon, Y., Lee, S. K., Yun, H.-y., Song, J., Xu, J., Shin, M. J., Im, D., & Wang, X. (2025). Associations of Lower Limb Muscle–Tendon Properties with Dual-Task Gait Variability: A Cross-Age Study. Healthcare, 13(12), 1375. https://doi.org/10.3390/healthcare13121375