
Using Potential Years of Life Lost (PYLL) to Compare Premature Mortality between Romanian Counties to Confirmed COVID-19 Cases in 2020 and 2021

 ,
,
Abstract
1. Introduction
2. Materials and Methods
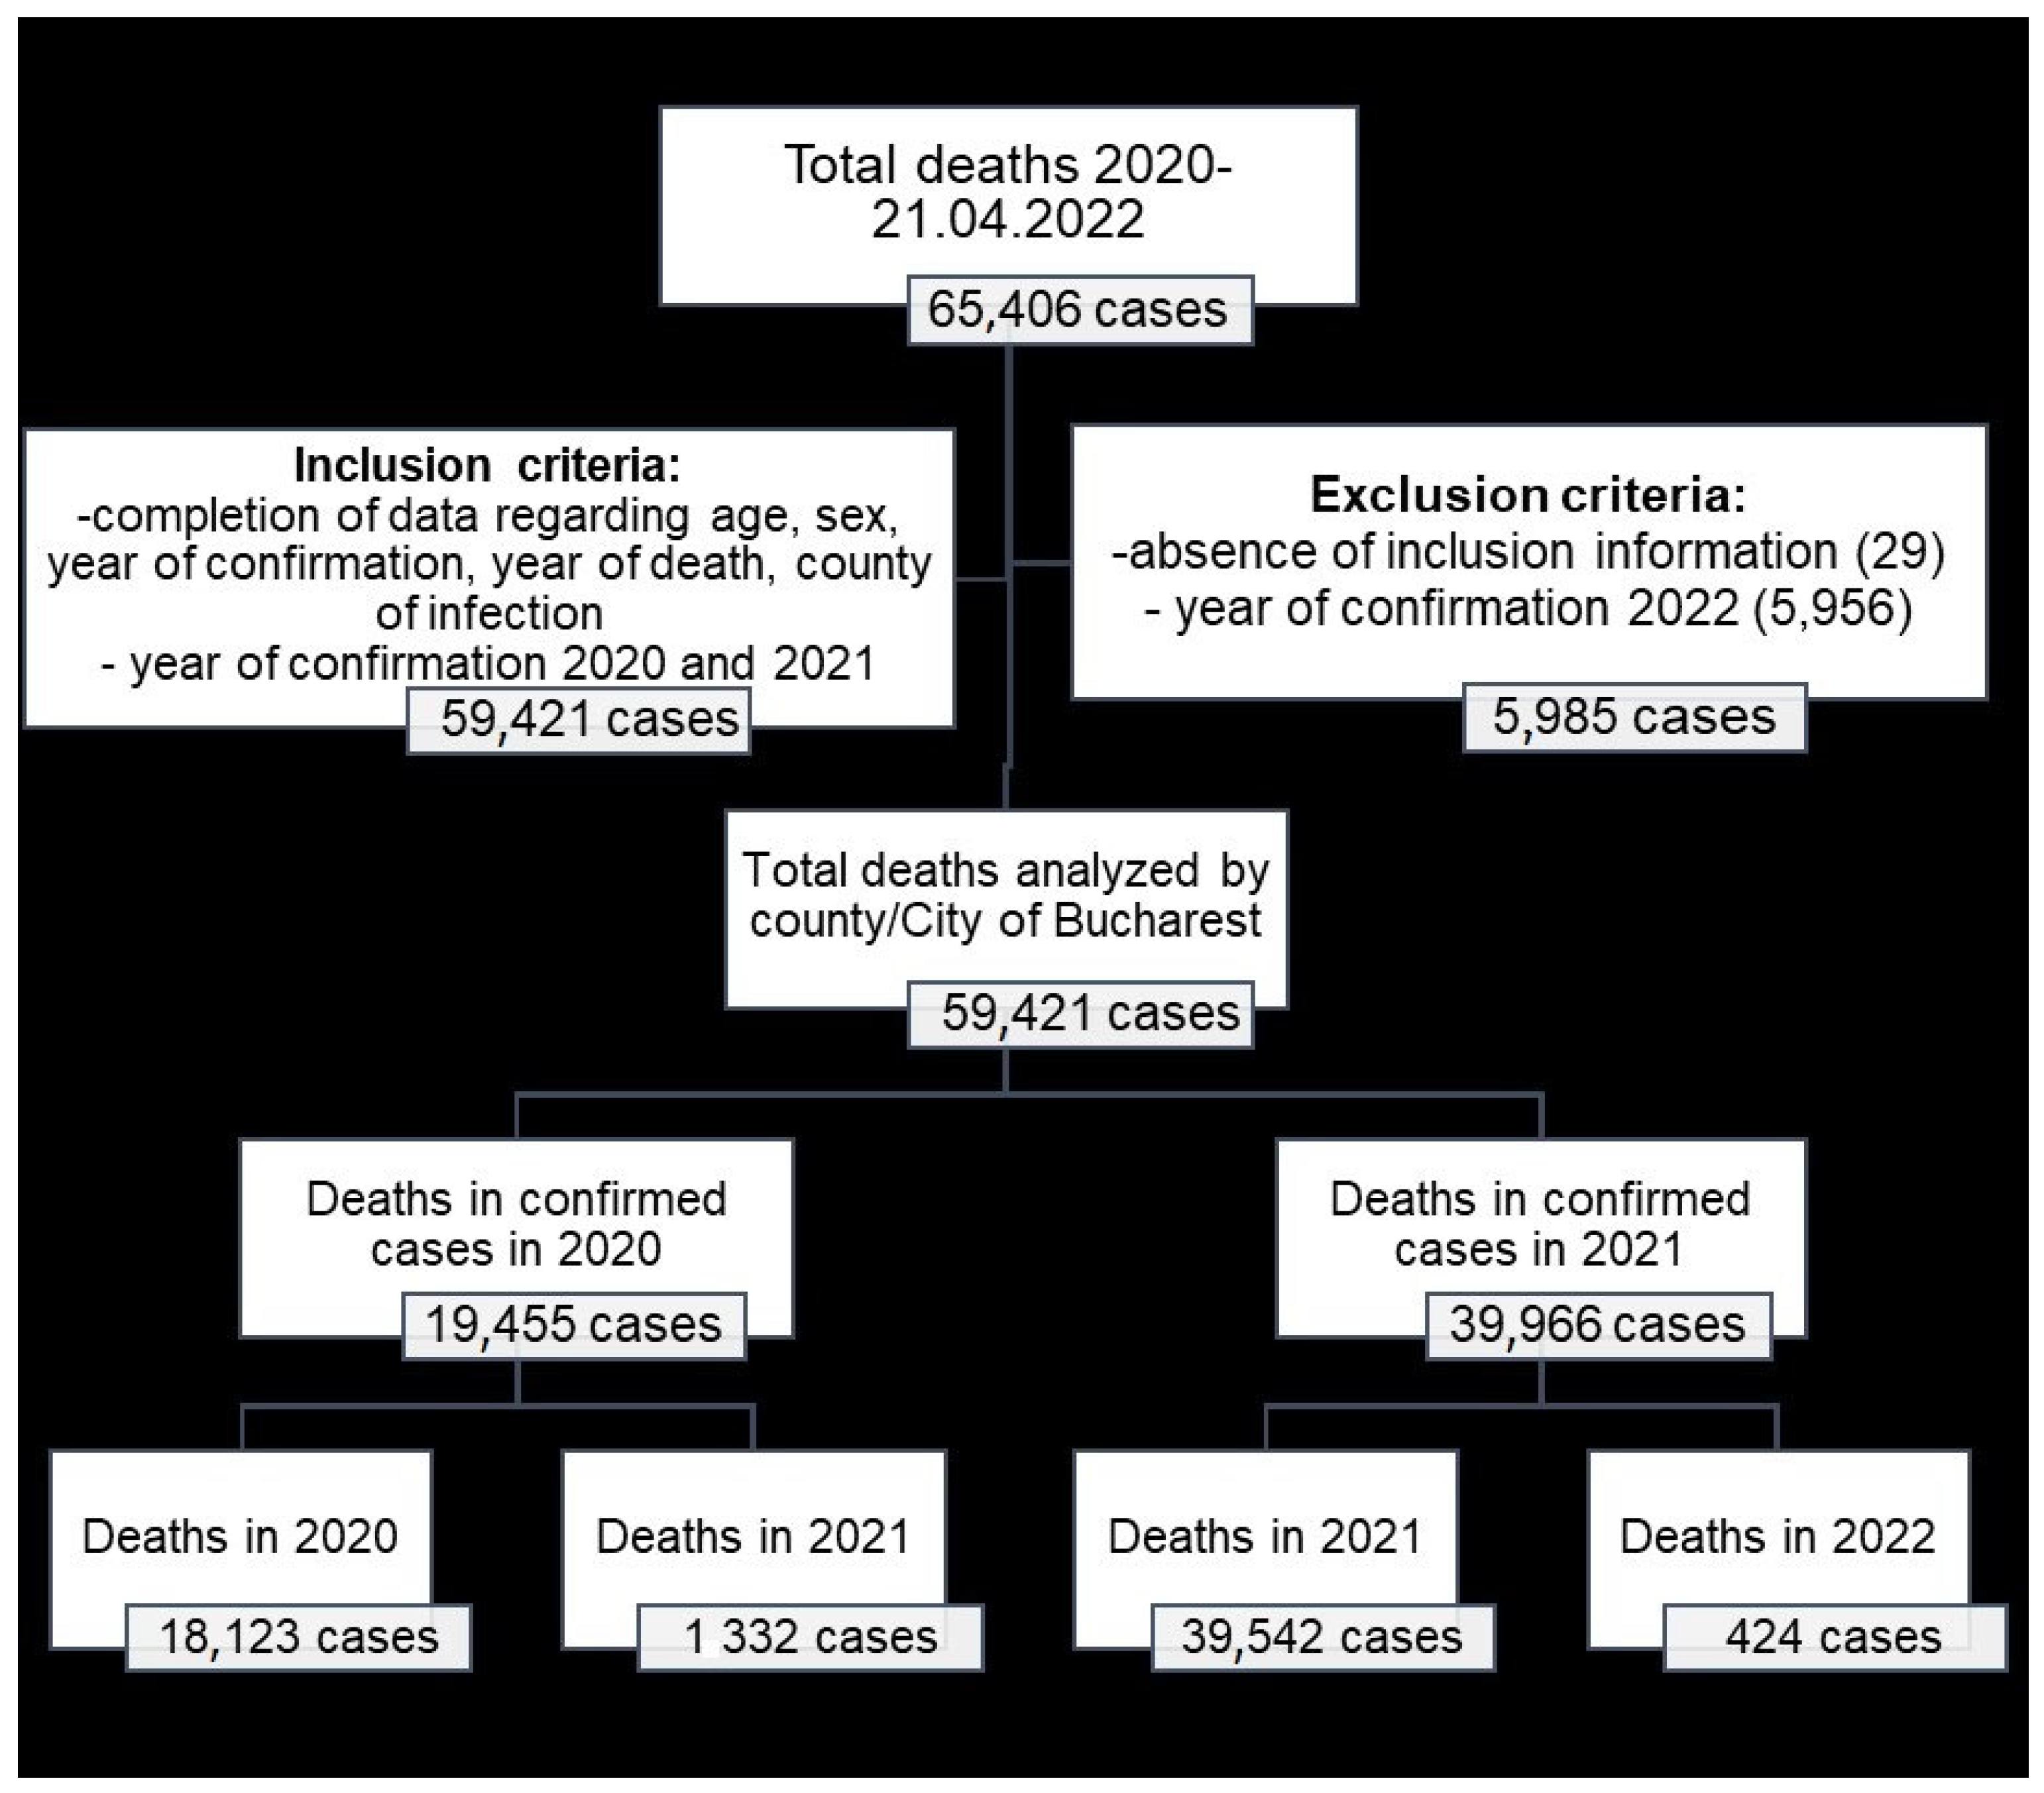
2.1. Study Design
2.2. Data Sources
2.3. Calculation of Indicators
3. Results
4. Discussion
Study Limitations
5. Conclusions
Author Contributions
Funding
Institutional Review Board Statement
Informed Consent Statement
Data Availability Statement
Conflicts of Interest
References
- Rosenberg, M.; Ranapurwala, S.; Townes, A.; Bengtson, A. Do black lives matter in public health research and training? PLoS ONE 2017, 12, e0185957. [Google Scholar] [CrossRef] [PubMed]
- Csata, A. Analysis of Accessing Rural Development Funds. Acta Univ. Sapientiae Econ. Bus. 2018, 6, 113–134. [Google Scholar] [CrossRef]
- Kalmár, Z.; Dumitrache, M.O.; D’Amico, G.; Matei, I.A.; Ionică, A.M.; Gherman, C.M.; Lupșe, M.; Mihalca, A.D. Multiple Tick-Borne Pathogens in Ixodes ricinus Ticks Collected from Humans in Romania. Pathogens 2020, 9, 390. [Google Scholar] [CrossRef] [PubMed]
- Giubega, S.; Ilie, M.S.; Luca, I.; Florea, T.; Dreghiciu, C.; Oprescu, I.; Morariu, S.; Dărăbuș, G. Seroprevalence of Anti-Theileria equi Antibodies in Horses from Three Geographically Distinct Areas of Romania. Pathogens 2022, 11, 669. [Google Scholar] [CrossRef] [PubMed]
- Borṣan, S.; Ionică, A.; Galon, C.; Toma-Naic, A.; Pestean, C.; Sándor, A.; Mihalca, A. High diversity, prevalence, and co-infection rates of tick-borne pathogens in ticks and wildlife hosts in an urban area in Romania. Front. Microbiol. 2021, 12, 645002. [Google Scholar] [CrossRef] [PubMed]
- Mihai, F.C. Spatio-Temporal Analysis of Romania’s Rural Population Access to Sanitation Services in the Context of EU Accession, [Internet]. SocArXiv. 2016. Available online: https://osf.io/preprints/socarxiv/bm9g7 (accessed on 30 January 2024).
- Iurcov, R.; Pop, L.M.; Ciavoi, G.; Iorga, M. Evaluating the Practice of Preventive Behaviors and the Fear of COVID-19 among Dentists in Oradea Metropolitan Area after the First Wave of Pandemic; a Cross-Sectional Study. Healthcare 2021, 9, 443. [Google Scholar] [CrossRef] [PubMed]
- Kalmár, Z.; Briciu, V.; Coroian, M.; Flonta, M.; Rădulescu, A.-L.; Topan, A.; Mihalca, A.D.; Lupșe, M. Seroprevalence of antibodies against Borrelia burgdorferi sensu lato in healthy blood donors in Romania: An update. Parasites Vectors 2021, 14, 596. [Google Scholar] [CrossRef] [PubMed]
- Codreanu, C.; Popescu, C.; Mogoșan, C. Area of Residence and Socioeconomic Factors Reduce Access to Biologics for Rheumatoid Arthritis Patients in Romania. BioMed Res. Int. 2018, 2018, 7458361. [Google Scholar] [CrossRef] [PubMed]
- Ilea, C.D.N.; Daina, M.D.; Venter, A.C.; Șuteu, C.L.; Sabău, M.; Badau, D.; Daina, L.G. The Motivation of Medical Staff and the Work Interestedness in the Context of the COVID-19 Pandemic, in a Tertiary Hospital in Romania. Healthcare 2023, 11, 813. [Google Scholar] [CrossRef] [PubMed]
- Lazar, R.; Oprean, C.; Badau, L.; Miron, G.; Draganescu, L.; Torok-Vistai, T.; Coroian, I.; Sabau, D.; Iliescu, A.; Tamas, L.A.; et al. Attitudes towards COVID-19 vaccination in patients with cancer: A cross-sectional study of 12 oncology centers. Mol. Clin. Oncol. 2022, 17, 162. [Google Scholar] [CrossRef] [PubMed]
- Mărcău, F.C.; Purec, S.; Niculescu, G. Study on the Refusal of Vaccination against COVID-19 in Romania. Vaccines 2022, 10, 261. [Google Scholar] [CrossRef] [PubMed]
- Mitrea, G. Resilience and Mentalities of Teachers from Romania Regarding the Usage and Efficiency of the E-Learning. Logos Universality Ment. Educ. Nov. Soc. Sci. 2022, 11, 21–31. [Google Scholar] [CrossRef] [PubMed]
- Popa, C.E. The impact of the first year of covid-19 pandemic on Romania’s economic growth. Rev. Econ. J. 2021, 73, 65–75. [Google Scholar] [CrossRef]
- Lucaciu, O.; Boca, A.; Mesaros, A.S.; Petrescu, N.; Aghiorghiesei, O.; Mirica, I.C.; Hosu, I.; Armencea, G.; Bran, S.; Dinu, C.M. Assessing SARS-CoV-2 Infection Rate among Romanian Dental Practitioners. Int. J. Environ. Res. Public Health 2021, 18, 4897. [Google Scholar] [CrossRef] [PubMed]
- Ugarte, M.P.; Achilleos, S.; Quattrocchi, A.; Gabel, J.; Kolokotroni, O.; Constantinou, C.; Nicolaou, N.; Rodriguez-Llanes, J.M.; Huang, Q.; Verstiuk, O.; et al. Premature Mortality Attributable to COVID-19: Potential Years of Life Lost in 17 Countries around the World, January-August 2020. BMC Public Health 2022, 22, 54. [Google Scholar] [CrossRef] [PubMed]
- Hâncean, M.-G.; Perc, M.; Lerner, J. Early Spread of COVID-19 in Romania: Imported Cases from Italy and Human-to-Human Transmission Networks. R. Soc. Open Sci. 2020, 7, 200780. [Google Scholar] [CrossRef] [PubMed]
- Lobiuc, A.; Dimian, M.; Gheorghita, R.; Sturdza, O.A.C.; Covasa, M. Introduction and Characteristics of SARS-CoV-2 in North-East of Romania during the First COVID-19 Outbreak. Front. Microbiol. 2021, 12, 654417. [Google Scholar] [CrossRef] [PubMed]
- Buletin de Presă 1 Ianuarie 2021, ora 13.00. Available online: https://covid19.stirioficiale.ro/informatii/buletin-de-presa-1-ianuarie-2021-ora-13-00 (accessed on 12 October 2023).
- Buletin de Presă 1 Ianuarie 2022, ora 13.00. COVID-19 Știri Oficiale n.d. Available online: https://covid19.stirioficiale.ro/informatii/buletin-de-presa-1-ianuarie-2022-ora-13-00 (accessed on 12 October 2023).
- Decret 195 16/03/2020—Portal Legislativ. n.d. Available online: https://legislatie.just.ro/Public/DetaliiDocumentAfis/223831 (accessed on 12 October 2023).
- Mathieu, E.; Ritchie, H.; Rodés-Guirao, L.; Appel, C.; Giattino, C.; Hasell, J.; Macdonald, B.; Dattani, S.; Beltekian, D.; Ortiz-Ospina, E.; et al. Coronavirus Pandemic (COVID-19). Published online at OurWorldInData.org. 2020. Available online: https://ourworldindata.org/coronavirus (accessed on 21 February 2024).
- Wyper, G.M.A.; Devleesschauwer, B.; Mathers, C.D.; McDonald, S.A.; Speybroeck, N. Years of Life Lost Methods Must Remain Fully Equitable and Accountable. Eur. J. Epidemiol. 2022, 37, 215–216. [Google Scholar] [CrossRef] [PubMed]
- Devleesschauwer, B.; McDonald, S.A.; Speybroeck, N.; Wyper, G.M.A. Valuing the Years of Life Lost Due to COVID-19: The Differences and Pitfalls. Int. J. Public Health 2020, 65, 719–720. [Google Scholar] [CrossRef] [PubMed]
- Ferenci, T. Different Approaches to Quantify Years of Life Lost from COVID-19. Eur. J. Epidemiol. 2021, 36, 589–597. [Google Scholar] [CrossRef] [PubMed]
- Kirigia, J.M.; Muthuri, R.N.D.K. The Fiscal Value of Human Lives Lost from Coronavirus Disease (COVID-19) in China. BMC Res. Notes 2020, 13, 198. [Google Scholar] [CrossRef] [PubMed]
- Hanlon, P.; Chadwick, F.; Shah, A.; Wood, R.; Minton, J.; McCartney, G.; Fischbacher, C.; Mair, F.S.; Husmeier, D.; Matthiopoulos, J.; et al. COVID-19—Exploring the Implications of Long-Term Condition Type and Extent of Multimorbidity on Years of Life Lost: A Modelling Study. Wellcome Open Res. 2020, 5, 75. [Google Scholar] [CrossRef] [PubMed]
- Romania: Country Health Profile 2021. Available online: https://read.oecd-ilibrary.org/social-issues-migration-health/romania-country-health-profile-2021_74ad9999-en (accessed on 12 October 2023).
- Core Health Indicators in the WHO European Region Special Focus: 2030 Sustainable Development Agenda. 2020, p. 4. Available online: https://apps.who.int/iris/bitstream/handle/10665/338902/WHO-EURO-2020-1887-41638-56893-eng.pdf (accessed on 5 May 2023).
- Mitra, A.K.; Payton, M.; Kabir, N.; Whitehead, A.; Ragland, K.N.; Brown, A. Potential Years of Life Lost Due to COVID-19 in the United States, Italy, and Germany: An Old Formula with Newer Ideas. Int. J. Environ. Res. Public Health 2020, 17, 4392. [Google Scholar] [CrossRef] [PubMed]
- Ordin 1829 27/10/2020—Portal Legislativ. n.d. Available online: https://legislatie.just.ro/Public/DetaliiDocument/231825 (accessed on 15 December 2023).
- Tempo Online. n.d. Available online: http://statistici.insse.ro:8077/tempo-online/ (accessed on 12 October 2023).
- Revision of the European Standard Population Report of Eurostat’s task force. Luxembourg: Publications Office of the European Union. 2013. Available online: https://ec.europa.eu/eurostat/documents/3859598/5926869/KS-RA-13-028-EN.PDF/e713fa79-1add-44e8-b23d-5e8fa09b3f8f (accessed on 7 January 2024).
- QGIS.org, %Y. QGIS Geographic Information System. QGIS Association. Available online: https://www.qgis.org/en/site/ (accessed on 7 January 2024).
- The R Project for Statistical Computing. Available online: https://www.r-project.org/ (accessed on 30 January 2024).
- Vieira, A.; Ricoca, V.P.; Aguiar, P.; Sousa, P.; Nunes, C.; Abrantes, A. Years of Life Lost by COVID-19 in Portugal and Comparison with Other European Countries in 2020. BMC Public Health 2021, 21, 1054. [Google Scholar] [CrossRef] [PubMed]
- Hulíková Tesárková, K.; Dzúrová, D. COVID-19: Years of Life Lost (YLL) and Saved (YLS) as an Expression of the Role of Vaccination. Sci. Rep. 2022, 12, 18129. [Google Scholar] [CrossRef] [PubMed]
- Jiang, S.; Cai, D.; Chen, D.; Jiang, Y. An Analysis of Life-Year Lost Due to COVID-19—34 Countries, December 2019–March 2021. China CDC Wkly. 2022, 4, 494–498. [Google Scholar] [CrossRef] [PubMed]
- Gökler, M.E.; Metintaş, S. Years of Potential Life Lost and Productivity Costs Due to COVID-19 in Turkey: One Yearly Evaluation. Public Health 2022, 203, 91–96. [Google Scholar] [CrossRef] [PubMed]
- Williams, G.; Spencer, A.; Farragher, T.; Gittins, M.; Verma, A. Years of Life Lost to COVID-19 in 20 Countries. J. Glob. Health 2022, 12, 05007. [Google Scholar] [CrossRef] [PubMed]
- Pifarré i Arolas, H.; Acosta, E.; López-Casasnovas, G.; Lo, A.; Nicodemo, C.; Riffe, T.; Myrskylä, M. Years of Life Lost to COVID-19 in 81 Countries. Sci. Rep. 2021, 11, 3504. [Google Scholar] [CrossRef] [PubMed]
- Túri, G.; Kassay, J.; Virág, A.; Dózsa, C.; Horváth, K.; Lorenzovici, L. Riding the Pandemic Waves—Lessons to Be Learned from the COVID-19 Crisis Management in Romania. Trop. Med. Infect. Dis. 2022, 7, 122. [Google Scholar] [CrossRef]
- Oprita, B.; Davidoiu, A.; Dinu, A.B.; Oprita, R. The Rescue of the Romanian Health System by the Emergency Departments during the Fourth Wave of COVID-19 Pandemic. Life 2022, 12, 1547. [Google Scholar] [CrossRef] [PubMed]


| Administrative-Territorial Unit | Deaths—All Ages | Premature Deaths | PYLL | PYLL/ Death | |||
|---|---|---|---|---|---|---|---|
| Number | Crude Rate * | Number | Crude Rate * | Number | Crude Rate * | ||
| ALBA | 340 | 105.35 | 257 | 84.05 | 3418 | 1117.85 | 13.30 |
| ARAD | 607 | 146.42 | 458 | 115.64 | 6395 | 1614.68 | 13.96 |
| ARGEŞ | 768 | 134.35 | 570 | 104.93 | 7966 | 1466.50 | 13.98 |
| BACĂU | 562 | 96.95 | 408 | 74.07 | 5502 | 998.83 | 13.49 |
| BIHOR | 811 | 144.99 | 618 | 115.06 | 9123 | 1698.49 | 14.76 |
| BISTRIŢA-NĂSĂUD | 366 | 131.95 | 259 | 97.34 | 3286 | 1234.94 | 12.69 |
| BOTOŞANI | 355 | 94.53 | 263 | 74.32 | 3701 | 1045.86 | 14.07 |
| BRAŞOV | 688 | 124.19 | 476 | 89.79 | 6489 | 1224.07 | 13.63 |
| BRĂILA | 311 | 109.70 | 216 | 81.20 | 2779 | 1044.71 | 12.87 |
| BUZĂU | 260 | 63.92 | 183 | 48.04 | 2835 | 744.18 | 15.49 |
| CARAŞ-SEVERIN | 370 | 137.91 | 285 | 111.56 | 3770 | 1475.78 | 13.23 |
| CĂLĂRAŞI | 264 | 94.49 | 204 | 77.44 | 2929 | 1111.93 | 14.36 |
| CLUJ | 645 | 90.80 | 395 | 58.23 | 4514 | 665.42 | 11.43 |
| CONSTANŢA | 688 | 102.61 | 497 | 77.14 | 6332 | 982.82 | 12.74 |
| COVASNA | 173 | 86.12 | 118 | 61.24 | 1213 | 629.51 | 10.28 |
| DÂMBOVIŢA | 483 | 99.49 | 382 | 82.70 | 5631 | 1219.11 | 14.74 |
| DOLJ | 297 | 47.94 | 227 | 38.57 | 3141 | 533.63 | 13.84 |
| GALAŢI | 539 | 107.47 | 366 | 76.58 | 4580 | 958.29 | 12.51 |
| GIURGIU | 71 | 27.07 | 48 | 19.46 | 761 | 308.50 | 15.85 |
| GORJ | 273 | 88.04 | 216 | 73.12 | 2915 | 986.77 | 13.50 |
| HARGHITA | 279 | 92.87 | 195 | 67.84 | 2364 | 822.37 | 12.12 |
| HUNEDOARA | 454 | 120.26 | 337 | 93.99 | 4253 | 1186.17 | 12.62 |
| IALOMIŢA | 253 | 99.61 | 188 | 78.19 | 2712 | 1127.86 | 14.43 |
| IAŞI | 721 | 90.56 | 512 | 67.05 | 6797 | 890.15 | 13.28 |
| ILFOV | 283 | 57.13 | 192 | 40.08 | 3088 | 644.66 | 16.08 |
| MARAMUREŞ | 566 | 123.81 | 440 | 100.04 | 5834 | 1326.40 | 13.26 |
| MEHEDINŢI | 210 | 88.35 | 167 | 74.14 | 2460 | 1092.12 | 14.73 |
| BUCHAREST | 1774 | 96.68 | 1208 | 68.75 | 16,189 | 921.30 | 13.40 |
| MUREŞ | 658 | 123.78 | 472 | 93.11 | 6685 | 1318.75 | 14.16 |
| NEAMŢ | 384 | 87.95 | 261 | 63.60 | 3725 | 907.72 | 14.27 |
| OLT | 283 | 72.93 | 239 | 65.35 | 3673 | 1004.35 | 15.37 |
| PRAHOVA | 898 | 126.79 | 691 | 103.35 | 9354 | 1399.05 | 13.54 |
| SATU MARE | 132 | 39.93 | 100 | 31.26 | 1317 | 411.69 | 13.17 |
| SĂLAJ | 181 | 86.34 | 130 | 65.20 | 1843 | 924.31 | 14.18 |
| SIBIU | 628 | 156.64 | 440 | 114.24 | 6227 | 1616.77 | 14.15 |
| SUCEAVA | 869 | 139.23 | 622 | 104.87 | 8539 | 1439.75 | 13.73 |
| TELEORMAN | 179 | 54.77 | 142 | 47.11 | 2174 | 721.18 | 15.31 |
| TIMIŞ | 648 | 91.70 | 509 | 74.72 | 7004 | 1028.18 | 13.76 |
| TULCEA | 187 | 97.87 | 145 | 79.38 | 1908 | 1044.55 | 13.16 |
| VASLUI | 389 | 104.76 | 276 | 78.34 | 3962 | 1124.60 | 14.36 |
| VÂLCEA | 306 | 88.09 | 218 | 68.20 | 2894 | 905.31 | 13.28 |
| VRANCEA | 302 | 95.50 | 222 | 74.60 | 3207 | 1077.66 | 14.45 |
| Total—Romania | 19,455 | 100.82 | 14,152 | 77.04 | 193,489 | 1053.28 | 13.67 |
| Administrative-Territorial Unit | Deaths—All Ages | Premature Deaths | PYLL | PYLL/ Death | |||
|---|---|---|---|---|---|---|---|
| Number | Crude Rate * | Number | Crude Rate * | Number | Crude Rate * | ||
| ALBA | 815 | 252.00 | 587 | 191.00 | 7749 | 2521.40 | 13.20 |
| ARAD | 1104 | 268.13 | 799 | 202.70 | 10,590 | 2686.58 | 13.25 |
| ARGEŞ | 1065 | 187.70 | 760 | 140.68 | 9697 | 1794.93 | 12.76 |
| BACĂU | 1253 | 213.24 | 878 | 156.82 | 11,906 | 2126.58 | 13.56 |
| BIHOR | 1581 | 284.99 | 1241 | 232.63 | 17,262 | 3235.83 | 13.91 |
| BISTRIŢA-NĂSĂUD | 670 | 234.35 | 512 | 186.18 | 6707 | 2438.90 | 13.10 |
| BOTOŞANI | 856 | 224.34 | 614 | 170.16 | 8318 | 2305.20 | 13.55 |
| BRAŞOV | 1196 | 217.12 | 807 | 152.98 | 10,488 | 1988.23 | 13.00 |
| BRĂILA | 716 | 255.23 | 529 | 200.56 | 6906 | 2618.22 | 13.05 |
| BUZĂU | 619 | 153.27 | 430 | 113.35 | 5833 | 1537.65 | 13.57 |
| CARAŞ-SEVERIN | 794 | 309.67 | 624 | 255.47 | 8680 | 3553.65 | 13.91 |
| CĂLĂRAŞI | 621 | 221.83 | 468 | 176.60 | 6659 | 2512.76 | 14.23 |
| CLUJ | 1321 | 189.59 | 868 | 130.49 | 10,271 | 1544.09 | 11.83 |
| CONSTANŢA | 1580 | 238.63 | 1153 | 181.19 | 15,063 | 2367.06 | 13.06 |
| COVASNA | 416 | 207.91 | 296 | 154.13 | 4181 | 2177.11 | 14.13 |
| DÂMBOVIŢA | 881 | 183.18 | 656 | 143.02 | 9137 | 1992.06 | 13.93 |
| DOLJ | 1066 | 175.37 | 802 | 138.72 | 11,058 | 1912.72 | 13.79 |
| GALAŢI | 1141 | 230.42 | 821 | 173.81 | 11,506 | 2435.92 | 14.01 |
| GIURGIU | 421 | 161.47 | 322 | 130.77 | 4556 | 1850.33 | 14.15 |
| GORJ | 594 | 191.25 | 446 | 150.39 | 6515 | 2196.86 | 14.61 |
| HARGHITA | 601 | 203.42 | 426 | 150.54 | 5412 | 1912.46 | 12.70 |
| HUNEDOARA | 795 | 216.43 | 546 | 156.47 | 6515 | 1867.08 | 11.93 |
| IALOMIŢA | 667 | 265.45 | 467 | 195.92 | 6891 | 2891.04 | 14.76 |
| IAŞI | 1375 | 176.21 | 961 | 128.33 | 12,717 | 1698.21 | 13.23 |
| ILFOV | 634 | 120.86 | 462 | 90.80 | 6946 | 1365.12 | 15.03 |
| MARAMUREŞ | 1050 | 231.65 | 836 | 191.57 | 11,640 | 2667.34 | 13.92 |
| MEHEDINŢI | 658 | 279.83 | 500 | 223.79 | 7015 | 3139.81 | 14.03 |
| BUCHAREST | 3378 | 190.50 | 2246 | 132.35 | 29,250 | 1723.65 | 13.02 |
| MUREŞ | 1045 | 199.33 | 730 | 145.90 | 10,114 | 2021.43 | 13.85 |
| NEAMŢ | 1070 | 241.75 | 740 | 177.40 | 9991 | 2395.12 | 13.50 |
| OLT | 554 | 144.32 | 429 | 118.17 | 6106 | 1681.92 | 14.23 |
| PRAHOVA | 1802 | 257.78 | 1297 | 196.20 | 16,840 | 2547.43 | 12.98 |
| SATU MARE | 606 | 183.68 | 448 | 140.19 | 5941 | 1859.13 | 13.26 |
| SĂLAJ | 507 | 241.10 | 353 | 176.05 | 4231 | 2110.06 | 11.99 |
| SIBIU | 1036 | 262.51 | 752 | 198.26 | 9751 | 2570.77 | 12.97 |
| SUCEAVA | 1295 | 205.38 | 908 | 151.13 | 12,228 | 2035.31 | 13.47 |
| TELEORMAN | 587 | 181.56 | 435 | 145.08 | 5759 | 1920.74 | 13.24 |
| TIMIŞ | 1243 | 183.07 | 944 | 144.30 | 13,236 | 2023.26 | 14.02 |
| TULCEA | 318 | 166.29 | 243 | 132.56 | 3138 | 1711.81 | 12.91 |
| VASLUI | 877 | 236.62 | 619 | 175.61 | 8315 | 2358.94 | 13.43 |
| VÂLCEA | 571 | 166.05 | 414 | 129.32 | 5385 | 1682.05 | 13.01 |
| VRANCEA | 587 | 181.00 | 408 | 133.08 | 5558 | 1812.83 | 13.62 |
| Total—Romania | 39,966 | 208.96 | 28,777 | 157.77 | 386,061 | 2116.63 | 13.42 |
| Administrative-Territorial Unit | Premature Deaths—Number | PYLL | Crude Rate of PYLL per 100,000 Inhabitants | PYLL/Death | t-Test | ||||
|---|---|---|---|---|---|---|---|---|---|
| Female | Male | Female | Male | Female | Male | Female | Male | p Value | |
| ALBA | 101 | 156 | 1227 | 2191 | 804.38 | 1429.92 | 12.15 | 14.04 | 0.1 |
| ARAD | 175 | 283 | 2600 | 3795 | 1.300.01 | 1935.69 | 14.86 | 13.41 | 0.1 |
| ARGEŞ | 184 | 386 | 2579 | 5387 | 942.54 | 1998.31 | 14.02 | 13.96 | 0.9 |
| BACĂU | 145 | 263 | 1838 | 3664 | 669.32 | 1326.39 | 12.68 | 13.93 | 0.2 |
| BIHOR | 253 | 365 | 3591 | 5532 | 1.325.16 | 2078.61 | 14.19 | 15.16 | 0.3 |
| BISTRIŢA-NĂSĂUD | 106 | 153 | 1292 | 1994 | 977.56 | 1488.95 | 12.19 | 13.03 | 0.5 |
| BOTOŞANI | 113 | 150 | 1485 | 2216 | 853.02 | 1232.60 | 13.14 | 14.77 | 0.2 |
| BRAŞOV | 172 | 304 | 2189 | 4300 | 814.89 | 1644.40 | 12.73 | 14.14 | 0.1 |
| BRĂILA | 82 | 134 | 1017 | 1762 | 766.54 | 1321.50 | 12.40 | 13.15 | 0.5 |
| BUZĂU | 78 | 105 | 1147 | 1688 | 605.10 | 881.94 | 14.71 | 16.08 | 0.4 |
| CARAŞ-SEVERIN | 106 | 179 | 1328 | 2442 | 1.032.28 | 1925.70 | 12.53 | 13.64 | 0.4 |
| CĂLĂRAŞI | 84 | 120 | 1062 | 1867 | 810.87 | 1409.65 | 12.64 | 15.56 | 0.03 |
| CLUJ | 165 | 230 | 1797 | 2717 | 517.54 | 820.49 | 10.89 | 11.81 | 0.3 |
| CONSTANŢA | 183 | 314 | 2069 | 4263 | 630.85 | 1347.78 | 11.31 | 13.58 | 0.007 |
| COVASNA | 43 | 75 | 393 | 820 | 409.17 | 848.49 | 9.14 | 10.93 | 0.3 |
| DÂMBOVIŢA | 145 | 237 | 1972 | 3659 | 862.08 | 1569.40 | 13.60 | 15.44 | 0.08 |
| DOLJ | 91 | 136 | 1133 | 2008 | 382.61 | 686.53 | 12.45 | 14.76 | 0.1 |
| GALAŢI | 125 | 241 | 1400 | 3180 | 584.58 | 1333.63 | 11.20 | 13.20 | 0.06 |
| GIURGIU | 18 | 30 | 277 | 484 | 228.90 | 385.15 | 15.39 | 16.13 | 0.8 |
| GORJ | 79 | 137 | 1059 | 1856 | 719.76 | 1251.72 | 13.41 | 13.55 | 0.9 |
| HARGHITA | 69 | 126 | 904 | 1460 | 629.91 | 1014.25 | 13.10 | 11.59 | 0.3 |
| HUNEDOARA | 137 | 200 | 1666 | 2587 | 924.37 | 1450.78 | 12.16 | 12.94 | 0.4 |
| IALOMIŢA | 70 | 118 | 897 | 1815 | 751.00 | 1499.83 | 12.81 | 15.38 | 0.09 |
| IAŞI | 173 | 339 | 2003 | 4794 | 528.77 | 1245.92 | 11.58 | 14.14 | 0.006 |
| ILFOV | 64 | 128 | 765 | 2323 | 317.04 | 977.22 | 11.95 | 18.15 | <0.00001 |
| MARAMUREŞ | 162 | 278 | 2149 | 3685 | 970.44 | 1687.33 | 13.27 | 13.26 | 1 |
| MEHEDINŢI | 54 | 113 | 700 | 1760 | 623.55 | 1557.66 | 12.96 | 15.58 | 0.1 |
| BUCHAREST | 441 | 767 | 5513 | 10,676 | 594.19 | 1287.23 | 12.50 | 13.92 | 0.01 |
| MUREŞ | 182 | 290 | 2590 | 4095 | 1019.11 | 1620.02 | 14.23 | 14.12 | 0.9 |
| NEAMŢ | 107 | 154 | 1591 | 2134 | 776.87 | 1038.09 | 14.87 | 13.86 | 0.4 |
| OLT | 78 | 161 | 1243 | 2430 | 684.25 | 1320.29 | 15.94 | 15.09 | 0.5 |
| PRAHOVA | 270 | 421 | 3627 | 5727 | 1078.51 | 1723.44 | 13.43 | 13.60 | 0.8 |
| SATU MARE | 36 | 64 | 494 | 823 | 304.10 | 522.70 | 13.72 | 12.86 | 0.7 |
| SĂLAJ | 61 | 69 | 797 | 1046 | 798.31 | 1050.65 | 13.07 | 15.16 | 0.3 |
| SIBIU | 162 | 278 | 2022 | 4205 | 1035.23 | 2215.13 | 12.48 | 15.13 | 0.01 |
| SUCEAVA | 225 | 397 | 2985 | 5554 | 1014.27 | 1858.84 | 13.27 | 13.99 | 0.4 |
| TELEORMAN | 43 | 99 | 518 | 1656 | 348.77 | 1082.88 | 12.05 | 16.73 | 0.01 |
| TIMIŞ | 202 | 307 | 2691 | 4313 | 777.34 | 1287.37 | 13.32 | 14.05 | 0.4 |
| TULCEA | 57 | 88 | 678 | 1230 | 751.19 | 1331.08 | 11.89 | 13.98 | 0.1 |
| VASLUI | 104 | 172 | 1483 | 2479 | 862.53 | 1374.42 | 14.26 | 14.41 | 0.9 |
| VÂLCEA | 76 | 142 | 965 | 1929 | 605.06 | 1204.28 | 12.70 | 13.58 | 0.5 |
| VRANCEA | 87 | 135 | 1220 | 1987 | 817.84 | 1338.80 | 14.02 | 14.72 | 0.6 |
| Total—Romania | 5308 | 8844 | 68,956 | 124,533 | 745.36 | 1365.69 | 12.99 | 14.08 | <0.00001 |
| Administrative-Territorial Unit | Premature Deaths—Number | PYLL | Crude Rate of PYLL per 100,000 Inhabitants | PYLL/Death | t-Test | ||||
|---|---|---|---|---|---|---|---|---|---|
| Female | Male | Female | Male | Female | Male | Female | Male | p Value | |
| ALBA | 295 | 292 | 4001 | 3748 | 2603.14 | 2439.63 | 13.56 | 12.84 | 0.3 |
| ARAD | 397 | 402 | 4955 | 5635 | 2483.16 | 2895.13 | 12.48 | 14.02 | 0.02 |
| ARGEŞ | 331 | 429 | 4049 | 5648 | 1480.90 | 2116.70 | 12.23 | 13.17 | 0.2 |
| BACĂU | 403 | 475 | 5265 | 6641 | 1878.89 | 2374.76 | 13.06 | 13.98 | 0.2 |
| BIHOR | 618 | 623 | 8424 | 8838 | 3119.13 | 3355.48 | 13.63 | 14.19 | 0.3 |
| BISTRIŢA-NĂSĂUD | 241 | 271 | 3166 | 3541 | 2312.21 | 2564.53 | 13.14 | 13.07 | 0.9 |
| BOTOŞANI | 286 | 328 | 3753 | 4565 | 2110.50 | 2494.37 | 13.12 | 13.92 | 0.3 |
| BRAŞOV | 374 | 433 | 4612 | 5876 | 1717.62 | 2268.78 | 12.33 | 13.57 | 0.055 |
| BRĂILA | 263 | 266 | 3412 | 3494 | 2572.88 | 2664.06 | 12.97 | 13.14 | 0.8 |
| BUZĂU | 187 | 243 | 2316 | 3517 | 1219.14 | 1857.15 | 12.39 | 14.47 | 0.04 |
| CARAŞ-SEVERIN | 302 | 322 | 4138 | 4542 | 3350.20 | 3761.77 | 13.70 | 14.11 | 0.6 |
| CĂLĂRAŞI | 238 | 230 | 3234 | 3425 | 2445.76 | 2579.49 | 13.59 | 14.89 | 0.2 |
| CLUJ | 420 | 448 | 4578 | 5693 | 1344.42 | 1753.51 | 10.90 | 12.71 | 0.004 |
| CONSTANŢA | 502 | 651 | 6294 | 8769 | 1937.71 | 2814.72 | 12.54 | 13.47 | 0.1 |
| COVASNA | 125 | 171 | 1651 | 2530 | 1716.48 | 2639.29 | 13.21 | 14.80 | 0.2 |
| DÂMBOVIŢA | 286 | 370 | 3710 | 5427 | 1622.35 | 2359.66 | 12.97 | 14.67 | 0.02 |
| DOLJ | 332 | 470 | 4312 | 6746 | 1473.54 | 2362.86 | 12.99 | 14.35 | 0.055 |
| GALAŢI | 365 | 456 | 4941 | 6565 | 2077.92 | 2798.85 | 13.54 | 14.40 | 0.2 |
| GIURGIU | 154 | 168 | 2208 | 2348 | 1813.95 | 1885.88 | 14.34 | 13.98 | 0.8 |
| GORJ | 179 | 267 | 2608 | 3907 | 1760.97 | 2631.70 | 14.57 | 14.63 | 0.9 |
| HARGHITA | 187 | 239 | 2118 | 3294 | 1494.78 | 2331.33 | 11.33 | 13.78 | 0.01 |
| HUNEDOARA | 263 | 283 | 3068 | 3447 | 1733.91 | 2004.07 | 11.67 | 12.18 | 0.5 |
| IALOMIŢA | 219 | 248 | 2937 | 3954 | 2472.39 | 3306.99 | 13.41 | 15.94 | 0.008 |
| IAŞI | 440 | 521 | 5520 | 7197 | 1477.14 | 1918.43 | 12.55 | 13.81 | 0.04 |
| ILFOV | 210 | 252 | 2920 | 4026 | 1130.94 | 1606.38 | 13.90 | 15.98 | 0.04 |
| MARAMUREŞ | 411 | 425 | 5434 | 6206 | 2466.64 | 2871.96 | 13.22 | 14.60 | 0.054 |
| MEHEDINŢI | 226 | 274 | 3124 | 3891 | 2791.28 | 3489.65 | 13.82 | 14.20 | 0.7 |
| BUCHAREST | 994 | 1252 | 12,112 | 17,138 | 1345.56 | 2150.74 | 12.19 | 13.69 | <0.00001 |
| MUREŞ | 329 | 401 | 4247 | 5867 | 1687.08 | 2359.98 | 12.91 | 14.63 | 0.04 |
| NEAMŢ | 328 | 412 | 4141 | 5850 | 1975.26 | 2819.32 | 12.63 | 14.20 | 0.02 |
| OLT | 181 | 248 | 2533 | 3573 | 1402.00 | 1959.25 | 13.99 | 14.41 | 0.7 |
| PRAHOVA | 617 | 680 | 7455 | 9385 | 2228.32 | 2874.41 | 12.08 | 13.80 | 0.001 |
| SATU MARE | 230 | 218 | 2793 | 3148 | 1718.35 | 2004.87 | 12.14 | 14.44 | 0.01 |
| SĂLAJ | 180 | 173 | 2033 | 2198 | 2017.61 | 2203.44 | 11.29 | 12.71 | 0.1 |
| SIBIU | 359 | 393 | 4589 | 5162 | 2380.21 | 2767.77 | 12.78 | 13.13 | 0.6 |
| SUCEAVA | 421 | 487 | 5380 | 6848 | 1795.85 | 2273.47 | 12.78 | 14.06 | 0.054 |
| TELEORMAN | 206 | 229 | 2467 | 3292 | 1658.50 | 2178.92 | 11.98 | 14.38 | 0.006 |
| TIMIŞ | 448 | 496 | 5941 | 7295 | 1780.51 | 2275.96 | 13.26 | 14.71 | 0.02 |
| TULCEA | 96 | 147 | 1333 | 1805 | 1461.54 | 1959.61 | 13.89 | 12.28 | 0.2 |
| VASLUI | 280 | 339 | 3665 | 4650 | 2125.03 | 2583.03 | 13.09 | 13.72 | 0.4 |
| VÂLCEA | 192 | 222 | 2511 | 2874 | 1741.22 | 1508.33 | 13.08 | 12.95 | 0.9 |
| VRANCEA | 193 | 215 | 2534 | 3024 | 1927.73 | 1580.05 | 13.13 | 14.07 | 0.3 |
| Total—Romania | 13,308 | 15,469 | 170,482 | 215,579 | 2320.00 | 1787.99 | 12.81 | 13.94 | <0.00001 |
Disclaimer/Publisher’s Note: The statements, opinions and data contained in all publications are solely those of the individual author(s) and contributor(s) and not of MDPI and/or the editor(s). MDPI and/or the editor(s) disclaim responsibility for any injury to people or property resulting from any ideas, methods, instructions or products referred to in the content. |
© 2024 by the authors. Licensee MDPI, Basel, Switzerland. This article is an open access article distributed under the terms and conditions of the Creative Commons Attribution (CC BY) license (https://creativecommons.org/licenses/by/4.0/).
Share and Cite
Rahotă, D.M.; Țîrț, D.P.; Daina, L.G.; Daina, C.M.; Ilea, C.D.N. Using Potential Years of Life Lost (PYLL) to Compare Premature Mortality between Romanian Counties to Confirmed COVID-19 Cases in 2020 and 2021. Healthcare 2024, 12, 1189. https://doi.org/10.3390/healthcare12121189
Rahotă DM, Țîrț DP, Daina LG, Daina CM, Ilea CDN. Using Potential Years of Life Lost (PYLL) to Compare Premature Mortality between Romanian Counties to Confirmed COVID-19 Cases in 2020 and 2021. Healthcare. 2024; 12(12):1189. https://doi.org/10.3390/healthcare12121189
Chicago/Turabian StyleRahotă, Diana Maria, Dorel Petru Țîrț, Lucia Georgeta Daina, Cristian Marius Daina, and Codrin Dan Nicolae Ilea. 2024. "Using Potential Years of Life Lost (PYLL) to Compare Premature Mortality between Romanian Counties to Confirmed COVID-19 Cases in 2020 and 2021" Healthcare 12, no. 12: 1189. https://doi.org/10.3390/healthcare12121189
APA StyleRahotă, D. M., Țîrț, D. P., Daina, L. G., Daina, C. M., & Ilea, C. D. N. (2024). Using Potential Years of Life Lost (PYLL) to Compare Premature Mortality between Romanian Counties to Confirmed COVID-19 Cases in 2020 and 2021. Healthcare, 12(12), 1189. https://doi.org/10.3390/healthcare12121189