Abstract
Background: The rapidly aging global population has increased the demand for caregivers. Many caregivers simultaneously engage in paid employment, and the dual role makes the needs of caregiver employees conceivably more remarkable. However, there is a gap in the literature about the specific needs of caregiver employees. Method: Caregiver employees (n = 1205) across Hong Kong caring for those ≥65 years were recruited for a cross-sectional face-to-face survey from December 2021 to January 2022, to evaluate mental well-being measured by the Short Warwick –Edinburgh Mental Well-being Scale. Univariate and multivariate analyses were conducted; significant variables (p < 0.05) were included in multiple linear regression, along with caregiver-friendly workplace policies’ availability, to understand their association with their mental well-being. Findings: The mean score of the Short Warwick–Edinburgh Mental Well-being Scale among caregiver employees in this study was 24.9, with 7.2% indicative of probable clinical depression and 10.0% possible mild depression. In addition, the current study showed that 30.2% of the caregiver employees felt distressed about the caregiving role. Among external factors, family support (measured by the Lubben Social Network Scale) and workplace culture (measured by the Marshall Supervision Subscale) positively correlated with mental well-being with regression coefficients of 0.252 (p < 0.001) and 0.482 (p < 0.001), respectively. In the fully adjusted model, a negative regression coefficient was observed for overall spillover (−0.050, p < 0.001) and Short Warwick–Edinburgh Mental Well-being Scale scores, while positive regression coefficients were observed for overall self-rate (0.041, p < 0.001), Lubben (0.124, p < 0.001), and corporate culture (0.365, p < 0.001). Better Short Warwick–Edinburgh Mental Well-being Scale scores were observed when caregiver-friendly workplace policies were clearly stated than when they were made on a case-by-case discretionary basis. Conclusions: Caregiver-friendly workplace policies may be critical to Hong Kong’s sustainable future, both economically and socially, as they ensure a healthy and productive workforce to support an aging population.
1. Introduction
The rapidly aging global population has increased the demand for caregivers [1,2]. Family caregivers meet most caregiving needs, many simultaneously engaging in paid employment [1,3,4]. For instance, of the 43.5 million caregivers in the United States, 60% are caregiver employees (CE) [5]. Similarly, CEs comprise 67%, 75%, and 51.8% of the total caregiver population in the United Kingdom [6], Canada [7], and Japan [8], respectively.
In addition to the needs of the care recipient, there has been growing interest in the needs of caregivers [9,10], which may include psychological, informational, patient care, personal, spiritual, and household needs [11]. Unmet needs can significantly increase caregivers’ burden [12], strain, and the risk of poor mental health outcomes such as burnout, anxiety, and depression [13,14,15]. Although there is a gap in the literature about the specific needs of CEs, taking on an additional role as an employee makes the needs of CEs conceivably more remarkable. A national study in the US showed that most CEs are prone to being late, leaving early, taking time off, reducing work hours, or taking less demanding jobs [5].
Xiang et al. [16] suggest that the needs of CEs can be viewed from the perspective of disease progression of the care recipient, that is, at diagnosis, during treatment, terminal phase, and post-treatment survivorship. The high caregiver burden of CEs with sudden and unexpected changes relative to the care recipient’s condition could have a tremendously detrimental impact on their mental well-being, workplace productivity, and the net productivity of their employers.
Caregiver-friendly workplace policies (CFWPs) can reduce occupational and overall stress [17], moderate spillover effect (behaviors, emotions, and moods transferred between work and family roles) [15], promote health protective effects [7], and improve work motivations and productivity [18], thereby providing net economic benefits for both the CEs and the employers [19]. CFWPs could include appropriate workplace culture, targeted programs, and resources such as support services, paid leave, backup adult care, flexible work arrangements, and unpaid leave [7,20], providing greater flexibility and opportunities for CEs. For example, Fujihara et al. [21] showed that co-worker support lowers CEs’ burden, presenteeism, and overall work impairment among CEs for people with dementia.
Given the net positive impact of CFWPs, both governmental and private sectors are provisioning for such policies. For instance, in the United States, the Family and Medical Leave Act gives 12 weeks of unpaid leave over a 12-month period, albeit the eligibility criteria restricts this provision to private sector employers with at least 50 employees and requires that an employee work for at least 1250 h over the 12-month period [22]. However, 80% of the US employers surveyed provide CFWPs [23]. Similarly, Canada provides 28 weeks of Compassionate Care leave benefits with CFWP guidelines from the National Institute on Ageing [24,25]. Japan allows 93 days of caregiver leave per eligible family member [24].
Hong Kong ranks second in Asia after Japan in terms of population aging [26], with 18% of its population ≥65 years in 2019, which is projected to increase to 31% by 2044 [27]. Although the number and burden of caregivers in Hong Kong are set to rise, there are no reliable statistics on the overall caregiver population, let alone on the CEs, which is particularly concerning given that Hong Kong has a highly engaged workforce with 50.87% of its population engaging in paid employment [28]. In the one study we could identify in this domain, Ho Chan et al. [29] estimated that 7% of households had a caregiver in 2004. Moreover, earlier research from Hong Kong has explored gendered perspectives [30,31], age-based [32] and disease-specific [33,34,35] caregiving burdens, self-efficacy, or coping strategies, but not carers’ mental well-being or needs.
Therefore, this study aimed to assess the mental well-being of the CEs and the associated factors in Hong Kong to identify the needs and opportunities for future implementation of CFWPs. This study was guided by three research questions (RQs): (1) What is the mental well-being of the CEs? (2) Do CEs disclose their caregiver role in the workplace? (3) Which internal and external factors affect CE’s mental well-being?
2. Methodology
2.1. Ethics
The Chinese University of Hong Kong Survey and Behavioral Research Ethics Committee granted research ethics’ approval for this study (Reference No. SBRE(R)-21-011) on 8 December 2021.
2.2. Study Setting
Several contextual factors related to care recipients in Hong Kong make understanding CEs’ mental well-being imperative. Overall, one-third of the households studied have at least one elderly member [36], and only 2.3% of the elderly population is entitled to full subsidization [37]. In total, 65% of the elderly population has at least one, and one-third have ≥2 chronic conditions [38], which could require more extensive support [39]. While 64% of the households are nuclear families [36], the burdens shouldered by the CEs (key income earners) as the sole children of elderly parents are considerably intense. In addition, given that the population of children with special educational needs soared from 21,720 to 33,830 in the last half-decade [40], support for the “Sandwich generation” who are both caring for their young children and old parents becomes important [41]. In the cultural context, people of Hong Kong have generally inherited a strong sense of filial piety, demanding more from their supporting children [42]. Moreover, parental expectations have shifted from tangible support to emotional support [43], which could potentially challenge the mental health of the CE even further when self-efficacy and mental health are perpetual in nature.
Although some private companies provide generic support for general staff in Hong Kong, official caregiver support has not yet been observed [44]. The situation is particularly challenging when CEs’ protection is not discussed in law, public policy, or within organizations. Therefore, it is urgent to assess the needs of the CEs and explore the possibility of implementing CFWPs in Hong Kong’s specific context.
2.3. Study Design and Participants
CEs in Hong Kong were recruited for a cross-sectional face-to-face survey from December 2021 to January 2022, to evaluate mental well-being measured by the Short Warwick–Edinburgh Mental Well-being Scale (SWEMWBS). The inclusion criteria comprised any type of paid employment (full-time employment, part-time employment, or both), providing care to at least one recipient ≥65 years of age with a self-defined chronic condition, literate in English or Chinese, and able to provide consent to participate in the study. Verbal consent was obtained from all survey respondents, and participants were assured of their rights and freedom to withdraw from the study at any time. The information and responses of the participants were treated confidentially. All project data were anonymized and kept in password-protected folders only accessible to the lead author and the study supervisors.
Participants were recruited through the convenient quota sampling technique across the sixteen major industries in Hong Kong based on Census Quarter One employment distribution [45]. The sampling of participants according to the industry quota is described in detail in Supplementary Table S1. Street-level data collection was conducted by trained investigators from MOV Data Collection Limited throughout 18 districts of Hong Kong.
The sample size estimation was based on a mean SWEMWBS score of 21.78 with a standard deviation of 5.44 based on the study by McMahon and Cassidy [46] that recruited 326 family caregivers for a person with dementia, and the calculation method (estimation of confidence interval of one mean) was as described by Meeker et al. [47]. Given a standard deviation of 5.44 of target measurement and a two-sided confidence level of 95%, a sample size of 1000 produced a confidence interval with a width of ±0.337. The target sample size was increased by 100 to 1100 in a buffer for invalid responses.
2.4. Theoretical Framework
This study relies on three theories (spillover theory, Lazarus and Folkman’s stress and coping theory, and intersectionality) to explain the CE’s needs and behaviors. Spillover theory postulates the crossover impact between the work–family microsystems [48]. Spillover regarding time, energy, and behavior is generally negative if work–family interactions are rigidly constructed [48]. Stephens et al. [49] reported that stress in both employment and caregiving roles is significantly related to negative spillover, and negative spillover between the two roles is significantly related to depression.
Lazarus and Folkman’s stress and coping theory (for brevity, hereafter referred to as Stress Theory) postulates stress as a relational concept between individuals and their environment [50]. The stress model was first developed by Pearlin et al. [51] to examine the predictors of the caregiving burden, which has been positively associated with old age [52] and the female gender [53,54], and negatively with the size of the social support network [55,56,57].
Intersectionality is an analytical framework attempting to explain how the co-occurrence of disadvantaged identities can impact the individuals involved [58]. This framework has been frequently used to explain the difficulties experienced by caregivers when a caregiving role intersects with other identity factors like gender [59] and race [60].
These three theories have a commonality in their structure, which is the consideration of the CE’s social characteristics (i.e., roles and conditions of caregivers and employment, gender, and age) and/or external factors (i.e., environment) laterally to understand the experience of the CEs through the interactivity of the variable factors (Figure 1).
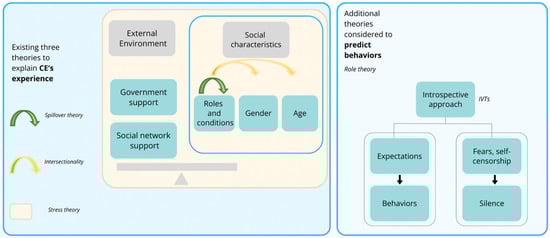
Figure 1.
Illustrative diagram of the theoretical framework [48,49,51,52,53,54,55,56,57,58,59,60,61,62,63].
2.5. Survey Instrument
The study questionnaire was developed based on a secondary data analysis of our previous qualitative study [44], in which in-depth semi-structured face-to-face interviews were conducted with nine CEs, three healthcare professionals, and three company management personnel about CFWPs in the context of Hong Kong. Our results indicated that the spillover effects and implicit voice theories (IVTs) were applicable in the context of Hong Kong [61,62]. The spillover effect can be positive and negative depending on the circumstances, but the “inseparable” nature of the dual roles contributes to the spillover effects. The mechanism of the spillover effect is conceptualized as one of the findings of “role struggle” underlined by role theory, which postulates interactions between individuals in organizations by focusing on their roles—that individual expectations underlie how he or she should perform appropriately in the roles [63]. Such role expectations for CEs, as caregivers and workers, influence their behavior and experiences at work and home, leading to spillover effects. IVTs can be applied to CEs to explain their silence at work regarding their caregiving role for fear of censorship or criticism.
In addition, our case study identified three dimensions affecting the experience of CEs: (1) external factors (workplace culture, social welfare, healthcare, and family and friends support), (2) internal factors (role balancing with the use of spillover theory and their perception of being in the role of CE in a corporate hierarchy), and (3) the sociodemographic background of the CEs and care recipients (Supplementary Table S2). Guided by these findings, a questionnaire was developed for the current study comprising five parts as follows:
Part 1 of the questionnaire (12 items) included questions related to screening for eligibility criteria, caregiving history, and average caregiving frequency.
Part 2 involved sociodemographic characteristics of the care recipients (12 items) and CEs (14 items).
Part 3 comprised seven SWEMWBS questions about mental well-being rated on a 5-point Likert scale [64]. An additional item was included to assess caregiving burnout [65]. SWEMWBS has been previously translated into Traditional Chinese and validated in the context of Hong Kong [64]. The SWEMWBS has also been tested in the Chinese population for validity, internal consistency, and psychometric properties [66], and for the measurement of the mental well-being of caregivers [67,68]. Permission was obtained to use the SWEMWBS for this study.
Part 4 included 50 framework questions based on three theoretical frameworks and our previous case study. Four validated tools were incorporated in this part: (1) Marshall Supervision Subscale of the Job Role Quality Questionnaire (external factors) [69]; (2) LEAP Leadership Behaviors and Organizational Climate Survey under work culture (external factors) [70]; (3) Lubben Social Network Scale (LSNS-6) under family and friend support (external factors) [71]; and (4) Inter-role conflict scales under the spillover effect (internal factors) [72]. While questions about social welfare and healthcare support availability had binary responses, subjective perceptions/experiences were measured on a 4-point Likert scale (1—most negative and 4—most positive).
Part 5 included four questions about the currently available CFWPs, a preference for the specific type of CFWP implementation in future policy recommendations, and a discussion of whether a suitable company policy can help CEs balance the roles of employees and caregivers more effectively. For the preference for the specific type of CFWP implementation in the future (questionnaire item E2), participants were asked to rate the importance of specific CFWPs on a scale of 1 (least important) to 10 (most important).
The complete questionnaire is presented in the Supplementary Materials.
2.6. Pilot Test
Before launching the primary survey, 10 participants (Supplementary Table S3) were invited to test the survey questionnaire’s comprehensiveness, relevance, understandability, and feasibility. The following questions were asked at the end of the interview to refine the questionnaire: (1) Do you think the questions covered all your concerns? (2) Any more questions to be added? The results indicate that the questionnaire covered all concerns and fit the local context, so no questions were deleted. However, sentences were rephrased with elaboration according to local wording and understanding. The response rate in the pilot test was 100%, with no rejection or missing data. Each questionnaire was completed in 20–40 min.
2.7. Statistical Analysis
CE characteristics were expressed as means ± standard deviations (SD), median (interquartile range; IQR), and frequency (%) as appropriate. Univariate and multivariate analyses were conducted (Mann–Whitney U Test and Kruskal–Wallis H Test by ranks for categorical variables and Spearman’s correlations for continuous variables) between independent and dependent variables (SWEMWBS score). Independent variables included (1) sociodemographic of the CE, (2) external and (3) internal factors, and (4) policy availability that would impact mental well-being (Supplementary Table S4). Controlled variables included demographic and health information of the care recipients. Cronbach’s alpha was used to test the internal consistency and reliability of the scores of individual instruments [73]. Cronbach’s alpha above 0.7 was considered good, and ≥0.8 very good [74].
Statistically significant variables (p-values < 0.05) were then included in the following regression analyses. Multiple linear regression was adopted to analyze how the internal/external factors and policy availability are associated with the SWEMWBS score [75]. Policy availability was recorded for each policy option clearly stated with code 0, option available at discretion with code 1, option not at all, and unknown with code 2 for regression. The original 16 categories of industries in which the CE was involved were regrouped into 8 categories based on census grouping for the regression analysis (See Supplementary Table S1). Since Kolmogorov–Smirnov [0.136 (p < 0.001)] and Shapiro–Wilk [0.962 (p < 0.001)] tests indicated that the SWEMWBS scores were not normally distributed (Supplementary Figure S1), a linear stepwise backward regression was used.
The regressions were conducted using two models. Model 1 (M1) considered the internal and external factors by subscales (dimensional), while Model 2 (M2) considered them in their entirety (summative). The complete results of the regressions are available in Supplementary Tables S5 and S6. Histograms of the residuals for Models 1 and 2 are presented in Supplementary Figures S2 and S3, which are both normally distributed. Multicollinearity was tested prior to multiple regressions using the variance inflation factor (VIF), and the variables with VIFs > 5 were excluded (Supplementary Table S7).
STATA statistical software version 15 (StataCorp LLC, College Station, TX, USA) and Statistical Package for Social Sciences (SPSS) Software (Version 17.0, SPSS, Inc., Chicago, IL, USA) were used for the analysis.
3. Results
The detailed sociodemographic characteristics of the interviewed CEs (n = 1205) are presented in Table 1. Briefly, 55.2% of the participants were females, over half of the respondents were in the 40–49 (27.4%) and 50–59 (23.9%) age groups, 69.8% had tertiary education, 78.6% held full-time employment, and 41.7% provided three to five hours of care per day. The median caregiving experience of the participants was ten years. The most common caregiving dimensions were decision-making involvement (81.1%) and financial support (80.7%). The proportion of respondents who reported household income above HKD 50,000 was 22.9%, while 22.8% reported HKD 30,000–39,999.

Table 1.
Sociodemographic characteristics of the caregiver employees (n = 1205).
3.1. CEs’ Mental Well-Being
The median SWEMWBS score of our study population was 24 (IQR 21–28) (Table 2). According to the Warwick Medical School [77] cutoff, 7.2% of the CEs indicated signs of probable clinical depression, and another 10.0% indicated signs of possible mild depression. Within the sex dimensions of SWEMWBS scores, the highest mean score was feeling useful (3.7), with a standard deviation of 0.9 (Table 2).
Table 2.
Well-being measurements of the caregiver employees.
3.2. Univariate Analysis between Demographic Factors and SWEMWBS
Educational attainment (p = 0.001), average caregiving hours per day (p = 0.001), household income (p < 0.001), employing industry (p < 0.001), work mode (p = 0.019), disclosure of CE status (p < 0.001), and care recipient’s utilization of public healthcare services (p < 0.001) were significantly associated with mean SWEMWBS scores, with the lowest scores observed for those who provided three to five hours of care per day, earned less than HKD 25,000, engaged in the accommodation and food services, had a part-time work status, did not disclose CE status, and non-utilization of public healthcare services (Table 3).
Table 3.
Mean SWEMWBS scores by demographic factors.
Spearman’s correlation was used for continuous independent variables, such as the age of the CE and the care recipient, total caregiving experiences, CE’s involvement in caregiving dimensions, care recipient’s number of social welfare items, number of comorbidities, and number of supports received in caregiving dimensions (Table 4). Total caregiving experience (ρ = 0.088, p = 0.002) and care recipient’s number of comorbidities (ρ = 0.091, p = 0.002) positively correlated with SWEMWBS scores. Care recipients’ number of social welfare items negatively correlated with SWEMWBS scores (ρ = −0.115; p < 0.001). The more the care recipients received in caregiving dimensions support, the better the SWEMWBS score: for physical care at the co-efficient 0.192 (p < 0.001); emotional care at 0.282 (p < 0.001); financial support at 0.185 (p < 0.001); and decision-making involvement at 0.145 (p < 0.001).
Table 4.
Spearman’s correlation for demographic factors and SWEMWBS scores.
3.3. Reliability Analysis of Scores of Internal and External Factors and SWEMWBS
The Cronbach’s alpha coefficient of reliability for the scores of inter-role conflict (questionnaire items: D28a, D28b, D28c, D28d, D28e, D29a, D29b, D29c, D29d, and D29e), self-rating (questionnaire items: D32a and D32b), Lubben Social Network (questionnaire items: D21a, D21b, D21c, D22a, D22b, and D22c), the composite of the Marshall Supervision Subscale of the Job Role Quality (questionnaire items: D2-reversed for analysis, D3a, and D3b), and the LEAP Leadership Behaviors and Organizational Climate scales for corporate culture, was 0.958, 0.755, 0.916, and 0.814, respectively.
The composite score of self-rating was composed of only two items, which explained the relatively low but still very acceptable Cronbach’s alpha of 0.755. Cronbach’s alpha of 0.935 (seven items) for mental well-being indicated very good internal consistency of score data, and item redundancy was unlikely.
3.4. Univariate Analysis between the Internal and External Factors and SWEMWBS Scores
After ensuring the internal consistency of the internal and external factors and well-being measurements, a univariate analysis was conducted to map out the direct association. Spearman’s correlation showed significant associations between the internal/external factors and the well-being measurements, all with p < 0.001 (Table 5). Except for the spillover effect, which negatively correlated with SWEMWBS, positive correlations were observed with all other factors.
Table 5.
Spearman’s correlation between internal and external factors.
3.5. Univariate Regression Analysis between Policy Availability and SWEMWBS Scores
Univariate regression analyses were performed between the current policy availability and the well-being measurements (Table 6). Caregiver-inclusive corporate culture (p < 0.001), paid caregiver leave (p < 0.001), unpaid caregiver leave (p < 0.001), flexible working hours (p < 0.001), flexible work locations (p < 0.001), switch to part-time mode (p < 0.001), unpaid leave (p < 0.001), medical needs aid/insurance for employees’ parents (p < 0.001), and caregiving information, carer skills and guide to community care resources (p < 0.001) were significantly associated with mean SWEMWBS scores. SWEMWBS scores were lower when CFWPs related to caregiver-inclusive corporate culture, paid caregiver leave, unpaid caregiver leave, flexible working hours, flexible work locations, and medical needs aid/insurance for employees’ parents were discretionary versus if clearly stated. However, for CFWPs related to the switch to part-time mode, unpaid leave, caregiving information, carer skills, and guide to community care resources, higher SWEMWBS scores were noted if the policy was discretionary. There was no association between SWEMWSB scores and bereavement leave.
Table 6.
Univariate analysis—Descriptive result of the policy availability and SWEMWBS scores.
3.6. Multivariate Regression Analysis for the SWEMWBS Scores
Table 7 shows the regression results for internal and external factors for both Model 1 and Model 2 concerning SWEMWBS. Positive regression coefficients were observed for self-rating for family (0.039, p < 0.001) and work roles (0.044, p < 0.001), family support (0.252, p < 0.001), and corporate culture according to the Marshall Supervision Subscale (0.482, p < 0.001) in Model 1. In Model 2, a negative regression coefficient was observed for overall spillover (−0.050, p < 0.001), while positive regression coefficients were observed for overall self-rate (0.041, p < 0.001), Lubben (0.124, p < 0.001), and corporate culture (0.365, p < 0.001). Since this study aims to assess the effect of specific predictors or explanatory variables (namely, spillover effects, self-rating, family and friends support, and corporate culture) on the dependent variable (i.e., mental well-being), adjusted R2 values of 0.4038 and 0.3979 are considered acceptable on the condition that some of the variables are statistically significant [78].
Table 7.
Multivariate analysis—SWEMWBS (Linear Regression analysis).
We considered Model 1 for understanding the relationship between policy availability and mental well-being since the subscale analysis rendered a more precise view of the covariate’s correlation with the well-being measurements (Supplementary Table S5). For SWEMWBS scores, the care recipient’s items of social welfare had a negative coefficient of −1.117 (p < 0.001). At the same time, there was a positive correlation between the number of comorbidities of the care recipient at 0.308 (p = 0.015) and the support of decision-making participation received by the care recipient at 0.476 (p = 0.009). Those with a household income of HKD 50,000 or more were better off than those who earned less than HKD 25,000 by 1.115 (p = 0.012). Regarding the availability of policies, caregiver-inclusive corporate culture (variable name “E1a”) and flexible work locations (variable name “E1f”) had a positive impact on mental well-being when they were clearly stated, rather than discretionary, by 1.050 (p = 0.027) and 0.941 (p = 0.038), respectively.
Model 2 showed that all internal and external total scores significantly correlated with SWEMWBS scores, all with p-values < 0.001 (spillover at −0.050, self-rating at 0.041, Lubben at 0.124, and corporate culture at 0.356).
3.7. CE Status Disclosure
Around 76% of the survey respondents chose not to disclose their CE status. The most common reason for non-disclosure was that they seldom shared private matters at work (n = 476, 52.8%), followed by “Not necessary to disclose because I need no help” (n = 309, 34.3%), “Not necessary to disclose because I can handle it well” (n = 227, 25.2%), “Not necessary to disclose because the unsympathetic environment” (n = 175, 19.4%), “Afraid of being misunderstood” (n = 55, 6.1%), and “Afraid of unfair treatment” (n = 38, 4.2%).
3.8. CE’s Sense of Distress, Services Adoption, and Policy Preference
In total, 30.1% of the survey respondents reported distress while delivering caregiving duties. Additionally, 12.2% had used home care/homemaking/meals services/home volunteer services, 10.8% used home-based nursing services, 89.1% used either public or private healthcare services, and 20.2% used allied health services, including physical therapy services, occupational therapy services, and speech therapy services.
In terms of the perceived importance of specific CFWPs, participants most highly rated bereavement leave (mean ± SD: 8.3 ± 0.05) followed by flexible working hours (8.0 ± 0.05), aiding medical needs/insurance of employees’ parents (7.9 ± 0.05), caregiver-inclusive corporate culture (7.9 ± 0.05), paid caregiver leave (not counting paternity/maternity leave) (7.7 ± 0.05), flexible work locations (7.7 ± 0.05), unpaid caregiver leave (7.6 ± 0.05), information/carer skills/guide to community care resources (7.4 ± 0.05), switch to a part-time mode (7.3 ± 0.05), and unpaid leave (7.3 ± 0.05).
4. Discussion
The mean score of the SWEMWBS among CEs in this study was 24.91, indicative of better mental well-being, for instance, compared to 23.5 in the UK’s national general population (aged 16 and above) [79]. Overall, caregiving experience positively correlated with CE’s mental well-being. Nevertheless, 7.2% of CEs in this study demonstrated probable clinical depression and 9.96% possible mild depression, which is lower than that reported among Hong Kong’s CEs for Alzheimer’s disease patients (46.2%) [80]. Around one-third of the Alzheimer’s study sample gave care for more than 20 h per week [80], while 59% of the participants in the current study provided more than 20 h of care per week. The difference could be attributed to the type of care provided by the two groups: CEs in the current studies focus on decision-making and financial support, while Alzheimer’s patients require relatively more physical care [81], which could be a more significant risk factor for depression.
Care recipients’ support in decision making was more likely to contribute to the mental state of CEs than physical care, emotional care, or financial support. Fittingly, the most common dimensions of care provided by CEs were involvement in decision making, followed by financial support, physical care, and emotional care. Although the exact mechanism of the association between CE’s involvement in decision making and better mental health outcomes is unclear, involving themselves in decision making likely makes CEs feel part of the team as they can exchange opinions and share responsibility when deciding what is best for the care recipients.
Similarly, a lower proportion of CEs in this study reported feeling distressed about the caregiving role than general caregivers for dementia patients in Hong Kong (30.2% vs. 40.2%) [65]. Although the same set of questions on service utilization had been asked, care recipients under the care of the CEs had used more formal care services than the general caregivers, 12.2% in home care services compared to 1.7% of the general caregivers, 10.8% in home-based nursing services compared to 6.1%, and 20.2% in allied health services compared to 4.2% [65]. The higher use of services could contribute to lower levels of burnout among CEs.
Further, CE’s mental well-being was positively related to the number of comorbidities of the care recipients and negatively related to the number of social welfare items. The association with the number of comorbidities could have arisen because the absolute sum of the items did not consider the severity, stage, or type of comorbidities. It is suggested that intersectionality between patient and caregiver factors, e.g., shift workers caring for end-stage cancer patients, should be examined to clarify which CEs are at increased risk for poor outcomes [16]. In the current context of Hong Kong, a disease-oriented study intersecting with the CE factor is essential for formulating future policies to prioritize resource allocation. For the association with the number of social welfare items used, the more social services the care recipients use might imply higher functional and emotional needs. We postulate that the care recipients might need more support from the CEs, negatively impacting CEs’ mental well-being.
Internal and external factors were highly predictive of CEs’ mental well-being. The spillover effect showed how work–family conflict negatively affected CEs’ mental well-being. It is consistent with the earlier study that there are negative spillover effects for employed adult caregiver daughters who must care for elderly parents while engaging in paid employment [49]. Others have shown that negative spillover conflict is positively associated with caregiving responsibilities and can lead to time theft [82,83].
Earlier studies have indicated that supportive managers, bank of trust [84], role balancing [44,61], and role empowerment by preparation and education [44] may act as enablers for CEs to balance the dual roles and live up to their duties effectively and efficiently. Consistent with these observations, the Marshall Supervision Subscale was positively related to the SWEMWBS scores, indicating the importance of corporate culture for CEs to balance the dual roles and improve CEs’ mental well-being. Moreover, the better CEs rated their performance in the roles (as a family and as an employee), the better their mental well-being. The relationship between self-rating and SWEMWBS scores is probably not causal but predictive. Family and friend support, as measured by the Lubben Social Network Scale, was also positively related to CEs’ mental well-being. This is consistent with a previous study from Hong Kong, which showed that social support acts as a moderator of stress coping in depression among older people facing stressful life events [85].
Regarding the availability of CFWPs and mental well-being, explicit caregiver-inclusive corporate culture had a more positive effect on mental well-being than discretionary culture. This is consistent with the previous finding that corporate culture, as one of the external factors, is of great importance to CEs’ mental well-being [44]. Clearly stating flexible work location arrangements rather than a discretionary decision on a case-by-case basis is also crucial for the mental well-being of CEs. It could be because, during COVID-19, flexible work location arrangements became more common, so uncertainty about the policy could cause confusion and worry.
Furthermore, most participants (74.4%) in this study had not disclosed their CE status, primarily due to an unsympathetic environment. This finding indicated that CEs in Hong Kong perceive risks in disclosing their CE status in the company hierarchy. Discrimination and stigmatization [44,84], apathy [44], fears, and self-scrutiny/judgment [44,61,62] are barriers to achieving a healthy work–life balance. Moreover, in the local context of Hong Kong, the prevalent concept of “work–life separation”—that personal matters should not be imposed on the workplace—hinders a healthy work–life balance [86]. While more flexible and permeable boundaries are associated with work–life enhancement [87], Hong Kong’s prevailing corporate culture generally appears quite the opposite.
The situation is further compounded by a system not geared to support CEs. Family caregivers are rarely identified in the care recipients’ health records [44]. Support for carers is available at community centers open from 9 am to 5 pm, but accessing such services may not be feasible for CEs [44]. Inadequate social welfare support or difficulties accessing healthcare support can significantly hinder CEs’ well-being [44]. Amidst the overwork culture [88], employees in Hong Kong are left with little space to process the possible fears or prejudices they face in coping with their new status as a CE.
Our findings strongly suggest that CFWPs can directly improve the mental well-being and organizational performance of CEs in Hong Kong. When improving mental well-being leads to a direct improvement in productivity [18,89], the benefits of CFWPs may be more direct than ever anticipated. Not only does this remove the stigma that a CE is only associated with productivity losses and workflow disruptions, but these studies also open opportunities for companies to invest in CFWPs.
Thus, our findings warrant exploring policies where CEs feel welcomed at their workplace and comfortable disclosing their status. In addition, governmental, healthcare, community, and private stakeholders should consider implementing support systems to relieve some of the burden. For instance, a meta-analytic study by Sörensen et al. [90] demonstrated that psychoeducational interventions such as verbal or written information about the care recipient’s likely clinical course or caregiver-specific resources, services, and training; supportive interventions like support groups, availability of care professions to give the primary career some time off; and psychotherapy are effective in reducing caregiver’s perceived burden and depression. More recently, e-health modalities, which may be particularly attractive considering the time constraints of CEs, have been shown to improve caregivers’ depression and quality of life but not their burden [91]. Moreover, the positive effects of e-health interventions may not last beyond the duration of the treatment [92]. During the COVID-19 pandemic, educational workplace interventions to increase awareness and organizational support to CEs have been shown to favorably impact CEs’ morale, job satisfaction, depression, psychosocial status, and self-reported health, with potential economic benefits for employers [93,94]. However, such interventions are yet to be tested in the context of Hong Kong and given the broad implications on the health of the working-age carers, older care recipients, and incentive for business to improve employee productivity and welfare, future research should actively investigate and identify effective interventions for CEs in Hong Kong.
5. Limitations
All data were collected on the street for 20–45 min, which could result in a fatigue response. In addition, we hypothesized the spillover effect between dual roles for CEs without a control group with only a single role. Furthermore, the survey was conducted as Hong Kong was recovering from the impact of the COVID-19 pandemic [95]. The well-being of the CEs could be heavily impacted due to city-wide restrictions to social life and mobility, emergency measures of the hospitals and the ancillary community health services, poor economic prospects, and fears of COVID-19.
6. Conclusions
CFWPs may be critical to Hong Kong’s sustainable future, both economically and socially, as it ensures a healthy and productive workforce to support an aging population. Institutional changes are essential, such as providing caregiver support services at worker-friendly hours, registering informal caregivers in the trust system for stakeholders’ use, and promoting awareness of CEs in the workplace. Governmental, healthcare, community, and private stakeholders can all play important roles in implementing CFWPs. Future research on CFWPs in the context of Hong Kong should consider their unique corporate culture and industrial dynamics.
Supplementary Materials
The following supporting information can be downloaded at: https://www.mdpi.com/article/10.3390/healthcare12101013/s1, File S1: Survey Questions; Figure S1: Histogram of SWEMWBS score distribution; Figure S2: Histogram of the residual of the multivariable regression SWEMWBS (Model 1); Figure S3: Histogram of the residual of the multivariable regression SWEMWBS (Model 3); Table S1: Participant Recruitment based on major industries in Hong Kong (Census 2020 Quarter One); Table S2: Theoretical framework in details; Table S3: Demographic of the first layman interviewed for pilot study; Table S4: List of independent variables; Table S5: Linear Regression for SEWMWBS-Model 1; Table S6: Linear Regression for SEWMWBS-Model 2; Table S7: SWEMWBS Variance Inflation Factor (VIF).
Author Contributions
The authors confirm contribution to the paper as follows: study conception and design: M.M.-S.L. (80%), E.L.-Y.W. (10%) and E.-K.Y. (10%); data collection: M.M.-S.L. (100%); analysis and interpretation of results: M.M.-S.L. (60%), K.W. (20%), E.L.-Y.W. (10%) and E.-K.Y. (10%); draft manuscript preparation: M.M.-S.L. (90%), E.L.-Y.W. (5%) and E.-K.Y. (5%). All authors have read and agreed to the published version of the manuscript.
Funding
This research was funded by Carers Hong Kong grant number 0001 and the APC was funded by The Chinese University of Hong Kong.
Institutional Review Board Statement
The Chinese University of Hong Kong Survey and Behavioral Research Ethics Committee granted research ethics’ approval for this study (Reference No. SBRE(R)-21-011) on 8 December 2021.
Informed Consent Statement
Verbal consent was obtained from all survey respondents, and participants were assured of their rights and freedom to withdraw from the study at any time.
Data Availability Statement
Data is unavailable due to privacy or ethical restrictions.
Conflicts of Interest
The authors declare no conflicts of interest.
References
- Bauer, J.M.; Sousa-Poza, A. Impacts of informal caregiving on caregiver employment, health, and family. J. Popul. Ageing 2015, 8, 113–145. [Google Scholar] [CrossRef]
- Martinez-Lacoba, R.; Pardo-Garcia, I.; Escribano-Sotos, F. Aging, dependence, and long-term care: A systematic review of employment creation. Inquiry 2021, 58, 469580211062426. [Google Scholar] [CrossRef]
- Ramesh, S.; Ireson, R.; Williams, A. International synthesis and case study examination of promising caregiver-friendly workplaces. Soc. Sci. Med. 2017, 177, 52–60. [Google Scholar] [CrossRef]
- Schulz, R.; Czaja, S.J. Family caregiving: A vision for the future. Am. J. Geriatr. Psychiatry 2018, 26, 358–363. [Google Scholar] [CrossRef]
- National Alliance for Caregiving (NAC); AARP Public Policy Institute. Executive Summary-Caregiving in the U.S.; National Alliance for Caregiving (NAC): Washington, DC, USA, 2015. [Google Scholar]
- Carers UK. Facts & Figures; Carers UK: London, UK, 2022. [Google Scholar]
- Ireson, R.; Sethi, B.; Williams, A. Availability of caregiver-friendly workplace policies (CFWPs): An international scoping review. Health Soc. Care Community 2018, 26, e1–e14. [Google Scholar] [CrossRef]
- Statistics Japan. 2012 Employment Structure Basic Survey; Statistics Japan: Tokyo, Japan, 2012.
- Denham, A.M.J.; Wynne, O.; Baker, A.L.; Spratt, N.J.; Loh, M.; Turner, A.; Magin, P.; Bonevski, B. The long-term unmet needs of informal carers of stroke survivors at home: A systematic review of qualitative and quantitative studies. Disabil. Rehabil. 2022, 44, 1–12. [Google Scholar] [CrossRef]
- Mansfield, E.; Boyes, A.W.; Bryant, J.; Sanson-Fisher, R. Quantifying the unmet needs of caregivers of people with dementia: A critical review of the quality of measures. Int. J. Geriatr. Psychiatry 2017, 32, 274–287. [Google Scholar] [CrossRef]
- Hileman, J.W.; Lackey, N.R.; Hassanein, R.S. Identifying the needs of home caregivers of patients with cancer. Oncol. Nurs. Forum 1992, 19, 771–777. [Google Scholar]
- Liu, Z.; Heffernan, C.; Tan, J. Caregiver burden: A concept analysis. Int. J. Nurs. Sci. 2020, 7, 438–445. [Google Scholar] [CrossRef]
- Jennings, L.A.; Reuben, D.B.; Evertson, L.C.; Serrano, K.S.; Ercoli, L.; Grill, J.; Chodosh, J.; Tan, Z.; Wenger, N.S. Unmet needs of caregivers of individuals referred to a dementia care program. J. Am. Geriatr. Soc. 2015, 63, 282–289. [Google Scholar] [CrossRef]
- Del-Pino-Casado, R.; Priego-Cubero, E.; Lopez-Martinez, C.; Orgeta, V. Subjective caregiver burden and anxiety in informal caregivers: A systematic review and meta-analysis. PLoS ONE 2021, 16, e0247143. [Google Scholar] [CrossRef] [PubMed]
- Dich, N.; Lange, T.; Head, J.; Rod, N.H. Work stress, caregiving, and allostatic load: Prospective results from the Whitehall II cohort study. Psychosom. Med. 2015, 77, 539–547. [Google Scholar] [CrossRef] [PubMed]
- Xiang, E.; Guzman, P.; Mims, M.; Badr, H. Balancing work and cancer care: Challenges faced by employed informal caregivers. Cancers 2022, 14, 4146. [Google Scholar] [CrossRef] [PubMed]
- Kim, J.; Ingersoll-Dayton, B.; Kwak, M. Balancing eldercare and employment: The role of work interruptions and supportive employers. J. Appl. Gerontol. 2013, 32, 347–369. [Google Scholar] [CrossRef] [PubMed]
- Barroso, M. Case Study: Work Adjustments–Axa, Portugal; Eurofound EurWORK: Dublin, Ireland, 2011. [Google Scholar]
- Mofidi, A.; Tompa, E.; Williams, A.; Yazdani, A.; Lero, D.; Mortazavi, S.B. Impact of a caregiver-friendly workplace policies intervention: A prospective economic evaluation. J. Occup. Environ. Med. 2019, 61, 461–468. [Google Scholar] [CrossRef] [PubMed]
- Lorenz, F.; Whittaker, L.; Tazzeo, J.; Williams, A. Availability of caregiver-friendly workplace policies: An international scoping review follow-up study. Int. J. Workplace Health Manag. 2021, 14, 459–476. [Google Scholar] [CrossRef]
- Fujihara, S.; Inoue, A.; Kubota, K.; Yong, K.F.R.; Kondo, K. Caregiver burden and work productivity among japanese working family caregivers of people with dementia. Int. J. Behav. Med. 2019, 26, 125–135. [Google Scholar] [CrossRef] [PubMed]
- Gimm, G.; Yang, Y.T. The effect of paid leave laws on family caregivers for the elderly. Ageing Int. 2016, 41, 214–226. [Google Scholar] [CrossRef]
- Matos, K.; Galinsky, E.; Bond, J.T. National Study of Employers; Society for Human Resource Management: Alexandria, VA, USA, 2017. [Google Scholar]
- Japan National Diet. Act on Childcare Leave, Caregiver Leave, and Other Measures for the Welfare of Workers Caring for Children or Other Family Members (Act No.61 of 2010); Japan National Diet: Tokyo, Japan, 2010. [Google Scholar]
- Ministry of Labour, Immigration, Training and Skills Development. Family Medical Leave; Ministry of Labour, Immigration, Training and Skills Development: Toronto, ON, Canada, 2023. [Google Scholar]
- Working Group on Elderly Services Programme Plan. Elderly Services Programme Plan; Working Group on Elderly Services Programme Plan-Elderly Commission: Hong Kong, China, 2014. [Google Scholar]
- Census and Statistics Department-Hong Kong Special Administrative Region. Hong Kong Population Projections 2015–2064; Census and Statistics Department-Hong Kong Special Administrative Region: Hong Kong, China, 2015.
- Census and Statistics Department-Hong Kong Special Administrative Region. Labour Force, Employment and Unemployment; Census and Statistics Department-Hong Kong Special Administrative Region: Hong Kong, China, 2022.
- Ho Chan, S.; Chan, C.M.A.; Lau, T.F.J.; Woo, J. A study of informal caregivers and the association of caregiving status with health and quality of life. Hong Kong Med. J. 2007, 13, S4–S7. [Google Scholar]
- Bai, X.; Liu, C.; Baladon, L.; Rubio-Valera, M. Multidimensional determinants of the caregiving burden among Chinese male caregivers of older family members in Hong Kong. Aging Ment. Health 2018, 22, 980–989. [Google Scholar] [CrossRef]
- Wong, D.F.K.; Ng, T.K.; Zhuang, X.Y. Caregiving burden and psychological distress in Chinese spousal caregivers: Gender difference in the moderating role of positive aspects of caregiving. Aging Ment. Health 2019, 23, 976–983. [Google Scholar] [CrossRef] [PubMed]
- Chow, E.O.-W.; Ho, H.C.Y. Caregiver strain, age, and psychological well-being of older spousal caregivers in Hong Kong. J. Soc. Work. 2014, 15, 479–497. [Google Scholar] [CrossRef]
- Siu, J.Y. Coping with patients suffering from overactive bladder: Experiences of family caregivers in Hong Kong. Health Soc. Care Community 2017, 25, 83–91. [Google Scholar] [CrossRef] [PubMed]
- Tang, W.K.; Lau, C.G.; Mok, V.; Ungvari, G.S.; Wong, K.S. Burden of Chinese stroke family caregivers: The Hong Kong experience. Arch. Phys. Med. Rehabil. 2011, 92, 1462–1467. [Google Scholar] [CrossRef] [PubMed]
- Cheng, S.T.; Lam, L.C.; Kwok, T.; Ng, N.S.; Fung, A.W. Self-efficacy is associated with less burden and more gains from behavioral problems of Alzheimer’s disease in Hong Kong Chinese caregivers. Gerontologist 2013, 53, 71–80. [Google Scholar] [CrossRef] [PubMed]
- Census and Statistics Department-Hong Kong Special Administrative Region. 2016 Population By-Census: Summary Results; Census and Statistics Department-Hong Kong Special Administrative Region: Hong Kong, China, 2017.
- Resarch Office-Legislative Council Secretariat. Welfare Services: Statistical Highlights; Resarch Office-Legislative Council Secretariat: Hong Kong, China, 2017.
- Wong, S.Y.; Zou, D.; Chung, R.Y.; Sit, R.W.; Zhang, D.; Chan, D.; Yeoh, E.K.; Woo, J.W. Regular source of care for the elderly: A cross-national comparative study of hong kong with 11 developed countries. J. Am. Med. Dir. Assoc. 2017, 18, 807.e1–807.e8. [Google Scholar] [CrossRef] [PubMed]
- World Health Organization. Good Health Adds Life to Years. Global Brief for World Health Day 2012, 1st ed.; World Health Organization: Geneva, Switzerland, 2012; p. 44.
- Legislative Council of the Hong Kong Special Administrative Region. Panel on Education Subcommittee on Integrated Education Report; Legislative Council: Hong Kong, China, 2014.
- Bevis, J. Caring for the "Sandwich Generation"; Forbes: Jersey City, NJ, USA, 2019. [Google Scholar]
- Wong, O.; Chau, B. The evolving role of filial piety in eldercare in Hong Kong. Asian J. Soc. Sci. 2006, 34, 600–617. [Google Scholar] [CrossRef]
- Leung, V.W.Y.; Lam, C.M.; Liang, Y. Parents’ expectations of familial elder care under the neoliberal Hong Kong society. J. Fam. Issues 2019, 41, 437–459. [Google Scholar] [CrossRef]
- Lee, M.S.M.; Yeoh, E.K.; Wong, L.Y.E.; French, C.; Yeung, C.Y.N.; Taddese, H. A Case Study of Caregiver-Friendly Workplace Policy in Hong Kong. SSRN. 2022. Available online: https://papers.ssrn.com/sol3/papers.cfm?abstract_id=4224177 (accessed on 2 February 2022).
- Census and Statistics Department-Hong Kong Special Administrative Region. Number of Employed Persons by Industry and Occupation; Census and Statistics Department-Hong Kong Special Administrative Region: Hong Kong, China, 2022.
- McMahon, A.M.; Cassidy, T. Informal caregiving for a person with dementia: The role of social and psychological capital. JOJ Nurs. Health Care 2019, 10, 555776. [Google Scholar] [CrossRef]
- Meeker, W.Q.; Hahn, G.J.; Escobar, L.A. Statistical Intervals: A Guide for Practitioners; Wiley-Interscience: Hoboken, NJ, USA, 2017. [Google Scholar]
- Hill, E.J.; Ferris, M.; Märtinson, V. Does it matter where you work? A comparison of how three work venues (traditional office, virtual office, and home office) influence aspects of work and personal/family life. J. Vocat. Behav. 2003, 63, 220–241. [Google Scholar] [CrossRef]
- Stephens, M.A.; Franks, M.M.; Atienza, A.A. Where two roles intersect: Spillover between parent care and employment. Psychol. Aging 1997, 12, 30–37. [Google Scholar] [CrossRef] [PubMed]
- Lazarus, R.S.; Folkman, S. Cognitive theories of stress and the issue of circularity. In Dynamics of Stress; Appley, M.H., Trumbull, R., Eds.; Springer: Boston, MA, USA, 1986; Chapter 4; pp. 63–80. [Google Scholar]
- Pearlin, L.I.; Mullan, J.T.; Semple, S.J.; Skaff, M.M. Caregiving and the stress process: An overview of concepts and their measures. Gerontologist 1990, 30, 583–594. [Google Scholar] [CrossRef]
- Rinaldi, P.; Spazzafumo, L.; Mastriforti, R.; Mattioli, P.; Marvardi, M.; Polidori, M.C.; Cherubini, A.; Abate, G.; Bartorelli, L.; Bonaiuto, S.; et al. Predictors of high level of burden and distress in caregivers of demented patients: Results of an Italian multicenter study. Int. J. Geriatr. Psychiatry 2005, 20, 168–174. [Google Scholar] [CrossRef] [PubMed]
- Campbell, P.; Wright, J.; Oyebode, J.; Job, D.; Crome, P.; Bentham, P.; Jones, L.; Lendon, C. Determinants of burden in those who care for someone with dementia. Int. J. Geriatr. Psychiatry 2008, 23, 1078–1085. [Google Scholar] [CrossRef] [PubMed]
- Chan, C.L.; Chui, E.W. Association between cultural factors and the caregiving burden for Chinese spousal caregivers of frail elderly in Hong Kong. Aging Ment. Health 2011, 15, 500–509. [Google Scholar] [CrossRef] [PubMed]
- Chiou, C.J.; Chang, H.Y.; Chen, I.P.; Wang, H.H. Social support and caregiving circumstances as predictors of caregiver burden in Taiwan. Arch. Gerontol. Geriatr. 2009, 48, 419–424. [Google Scholar] [CrossRef] [PubMed]
- Hsiao, C.Y. Family demands, social support and caregiver burden in Taiwanese family caregivers living with mental illness: The role of family caregiver gender. J. Clin. Nurs. 2010, 19, 3494–3503. [Google Scholar] [CrossRef] [PubMed]
- Kim, H.; Chang, M.; Rose, K.; Kim, S. Predictors of caregiver burden in caregivers of individuals with dementia. J. Adv. Nurs. 2012, 68, 846–855. [Google Scholar] [CrossRef]
- Cooper, B. Intersectionality. In The Oxford Handbook of Feminist Theory; Disch, L., Hawkesworth, M., Eds.; Oxford University Press: New York, NY, USA, 2015; pp. 385–406. [Google Scholar]
- Chappell, N.L.; Dujela, C.; Smith, A. Caregiver well-being: Intersections of relationship and gender. Res. Aging 2015, 37, 623–645. [Google Scholar] [CrossRef]
- Flagler-George, J. Squeezed in: The Intersecting Paradoxes of Care for Immigrant Informal Caregivers. Ph.D. Thesis, The University of Waterloo, Waterloo, ON, Canada, 2014. [Google Scholar]
- Milliken, F.J.; Morrison, E.W.; Hewlin, P.F. An Exploratory study of employee silence: Issues that employees don’t communicate upward and why. J. Manag. Stud. 2003, 40, 1453–1476. [Google Scholar] [CrossRef]
- Detert, J.R.; Edmondson, A.C. Implicit voice theories: Taken-for-granted rules of self-censorship at work. Acad. Manag. J. 2011, 54, 461–488. [Google Scholar] [CrossRef]
- Barker, R.L. The Social Work Dictionary, 6th ed.; NASW Press: Washington, DC, USA, 2014. [Google Scholar]
- Ng, S.S.; Lo, A.W.; Leung, T.K.; Chan, F.S.; Wong, A.T.; Lam, R.W.; Tsang, D.K. Translation and validation of the Chinese version of the short Warwick-Edinburgh Mental Well-being Scale for patients with mental illness in Hong Kong. East Asian Arch. Psychiatry 2014, 24, 3–9. [Google Scholar] [PubMed]
- Chan, C.Y.; Cheung, G.; Martinez-Ruiz, A.; Chau, P.Y.K.; Wang, K.; Yeoh, E.K.; Wong, E.L.Y. Caregiving burnout of community-dwelling people with dementia in Hong Kong and New Zealand: A cross-sectional study. BMC Geriatr. 2021, 21, 261. [Google Scholar] [CrossRef] [PubMed]
- Fung, S.F. Psychometric evaluation of the Warwick-Edinburgh Mental Well-being Scale (WEMWBS) with Chinese University Students. Health Qual. Life Outcomes 2019, 17, 46. [Google Scholar] [CrossRef] [PubMed]
- Hodiamont, F.; Allgar, V.; Currow, D.C.; Johnson, M.J. Mental wellbeing in bereaved carers: A Health Survey for England population study. BMJ Support. Palliat. Care 2022, 12, e592–e598. [Google Scholar] [CrossRef] [PubMed]
- Orgeta, V.; Lo Sterzo, E.; Orrell, M. Assessing mental well-being in family carers of people with dementia using the Warwick-Edinburgh Mental Well-Being Scale. Int. Psychogeriatr. 2013, 25, 1443–1451. [Google Scholar] [CrossRef] [PubMed]
- Marshall, N.L.; Barnett, R.C. Work-related support among women in caregiving occupations. J. Community Psychol. 1992, 20, 36–42. [Google Scholar] [CrossRef]
- Litwin, G.H.; Stringer, R.A., Jr. Motivation and Organizational Climate; Harvard University Press: Cambridge, MA, USA, 1968. [Google Scholar]
- Lubben, J.; Blozik, E.; Gillmann, G.; Iliffe, S.; von Renteln Kruse, W.; Beck, J.C.; Stuck, A.E. Performance of an abbreviated version of the Lubben Social Network Scale among three European community-dwelling older adult populations. Gerontologist 2006, 46, 503–513. [Google Scholar] [CrossRef]
- Netemeyer, R.G.; Boles, J.S.; McMurrian, R. Development and validation of work–family conflict and family–work conflict scales. J. Appl. Psychol. 1996, 81, 400–410. [Google Scholar] [CrossRef]
- Cronbach, L.J. Coefficient alpha and the internal structure of tests. Psychometrika 1951, 16, 297–334. [Google Scholar] [CrossRef]
- Tavakol, M.; Dennick, R. Making sense of Cronbach’s alpha. Int. J. Med. Educ. 2011, 2, 53–55. [Google Scholar] [CrossRef] [PubMed]
- Thygesen, L.C.; Moller, S.P.; Ersboll, A.K.; Santini, Z.I.; Nielsen, M.B.D.; Gronbaek, M.K.; Ekholm, O. Decreasing mental well-being during the COVID-19 pandemic: A longitudinal study among Danes before and during the pandemic. J. Psychiatr. Res. 2021, 144, 151–157. [Google Scholar] [CrossRef] [PubMed]
- Census and Statistics Department-Hong Kong Special Administrative Region. Thematic Report: Youths. Available online: https://www.census2021.gov.hk/doc/pub/21c-Youths.pdf (accessed on 29 April 2024).
- Warwick Medical School. Collect, Score, Analyse and Interpret WEMWBS; Warwick Medical School: Coventry, UK, 2021. [Google Scholar]
- Ozili, P.K. The acceptable R-square in empirical modelling for social science research (MPRA Paper No. 115769). In Social Research Methodology and Publishing Results: A Guide to Non-Native English Speakers; eBook Version; IGI Global: Hershey, PA, USA, 2023; pp. 134–143. [Google Scholar]
- Ng Fat, L.; Scholes, S.; Boniface, S.; Mindell, J.; Stewart-Brown, S. Evaluating and establishing national norms for mental wellbeing using the short Warwick-Edinburgh Mental Well-being Scale (SWEMWBS): Findings from the Health Survey for England. Qual. Life Res. 2017, 26, 1129–1144. [Google Scholar] [CrossRef]
- The Women’s Foundation. Working Dementia Caregivers: Challenges and Needs; Sau Po Centre on Ageing, The University of Hong Kong: Hong Kong, China, 2020. [Google Scholar]
- Souren, L.E.; Franssen, E.H.; Reisberg, B. Neuromotor changes in Alzheimer’s disease: Implications for patient care. J. Geriatr. Psychiatry Neurol. 1997, 10, 93–98. [Google Scholar] [CrossRef] [PubMed]
- Henle, C.A.; Reeve, C.L.; Pitts, V.E. Stealing time at work: Attitudes, social pressure, and perceived control as predictors of time theft. J. Bus. Ethics 2009, 94, 53–67. [Google Scholar] [CrossRef]
- Peng, Y.; Jex, S.; Zhang, W.; Ma, J.; Matthews, R.A. Eldercare demands and time theft: Integrating family-to-work conflict and spillover–crossover perspectives. J. Bus. Psychol. 2019, 35, 45–58. [Google Scholar] [CrossRef]
- Bernard, M.; Phillips, J.E. Working carers of older adults. Community Work. Fam. 2007, 10, 139–160. [Google Scholar] [CrossRef]
- Chou, K.L.; Chi, I. Stressful life events and depressive symptoms: Social support and sense of control as mediators or moderators? Int. J. Aging Hum. Dev. 2001, 52, 155–171. [Google Scholar] [CrossRef]
- Wong, K.P.; Chan, A.H.S. Exploration of the socioecological determinants of Hong Kong workers’ work-life balance: A grounded theory model. Int. J. Environ. Res. Public Health 2021, 18, 10732. [Google Scholar] [CrossRef]
- Bulger, C.A.; Matthews, R.A.; Hoffman, M.E. Work and personal life boundary management: Boundary strength, work/personal life balance, and the segmentation-integration continuum. J. Occup. Health Psychol. 2007, 12, 365–375. [Google Scholar] [CrossRef]
- Chou, K.L.; Cheung, K.C.K. Family-friendly policies in the workplace and their effect on work–life conflicts in Hong Kong. Int. J. Hum. Resour. Manag. 2013, 24, 3872–3885. [Google Scholar] [CrossRef]
- Bondar, J.; Babich Morrow, C.; Gueorguieva, R.; Brown, M.; Hawrilenko, M.; Krystal, J.H.; Corlett, P.R.; Chekroud, A.M. Clinical and financial outcomes associated with a workplace mental health program before and during the COVID-19 pandemic. JAMA Netw. Open 2022, 5, e2216349. [Google Scholar] [CrossRef] [PubMed]
- Sörensen, S.; Pinquart, M.; Duberstein, P. How effective are interventions with caregivers? an updated meta-analysis. Gerontologist 2002, 42, 356–372. [Google Scholar] [CrossRef] [PubMed]
- Li, Y.; Li, J.; Zhang, Y.; Ding, Y.; Hu, X. The effectiveness of e-Health interventions on caregiver burden, depression, and quality of life in informal caregivers of patients with cancer: A systematic review and meta-analysis of randomized controlled trials. Int. J. Nurs. Stud. 2022, 127, 104179. [Google Scholar] [CrossRef] [PubMed]
- Donath, C.; Luttenberger, K.; Graessel, E.; Scheel, J.; Pendergrass, A.; Behrndt, E.-M. Can brief telephone interventions reduce caregiver burden and depression in caregivers of people with cognitive impairment?-long-term results of the German day-care study (RCT). BMC Geriatr. 2019, 19, 196. [Google Scholar] [CrossRef] [PubMed]
- Ding, R.; Gafni, A.; Williams, A. Cost implications from an employer perspective of a workplace intervention for carer-employees during the COVID-19 pandemic. Int. J. Environ. Res. Public Health 2022, 19, 2194. [Google Scholar] [CrossRef] [PubMed]
- Ding, R.; Dardas, A.; Wang, L.; Williams, A. Evaluation of a caregiver-friendly workplace program intervention on the health of full-time caregiver employees: A time series analysis of intervention effects. J. Occup. Environ. Med. 2020, 62, e548–e558. [Google Scholar] [CrossRef]
- Ma, A.; Parry, J. When Hong Kong’s “dynamic zero” COVID-19 strategy met omicron, low vaccination rates sent deaths soaring. BMJ 2022, 377, o980. [Google Scholar] [CrossRef]
Disclaimer/Publisher’s Note: The statements, opinions and data contained in all publications are solely those of the individual author(s) and contributor(s) and not of MDPI and/or the editor(s). MDPI and/or the editor(s) disclaim responsibility for any injury to people or property resulting from any ideas, methods, instructions or products referred to in the content. |
© 2024 by the authors. Licensee MDPI, Basel, Switzerland. This article is an open access article distributed under the terms and conditions of the Creative Commons Attribution (CC BY) license (https://creativecommons.org/licenses/by/4.0/).