
Leveraging Technology to Diagnose Alzheimer’s Disease: A Systematic Review and Meta-Analysis

 ,
, 
Abstract
1. Introduction
1.1. Rationale
1.2. Objectives
2. Methods
2.1. Eligibility Criteria
2.2. Information Sources
2.3. Search Strategy
2.4. Selection Process
2.5. Data Collection Process
2.6. Data Items
2.7. Study Risk of Bias Assessment
2.8. Effect Measures
2.9. Synthesis Methods
2.10. Reporting Bias Assessment
2.11. Additional Analyses and Certainty Assessment
3. Results
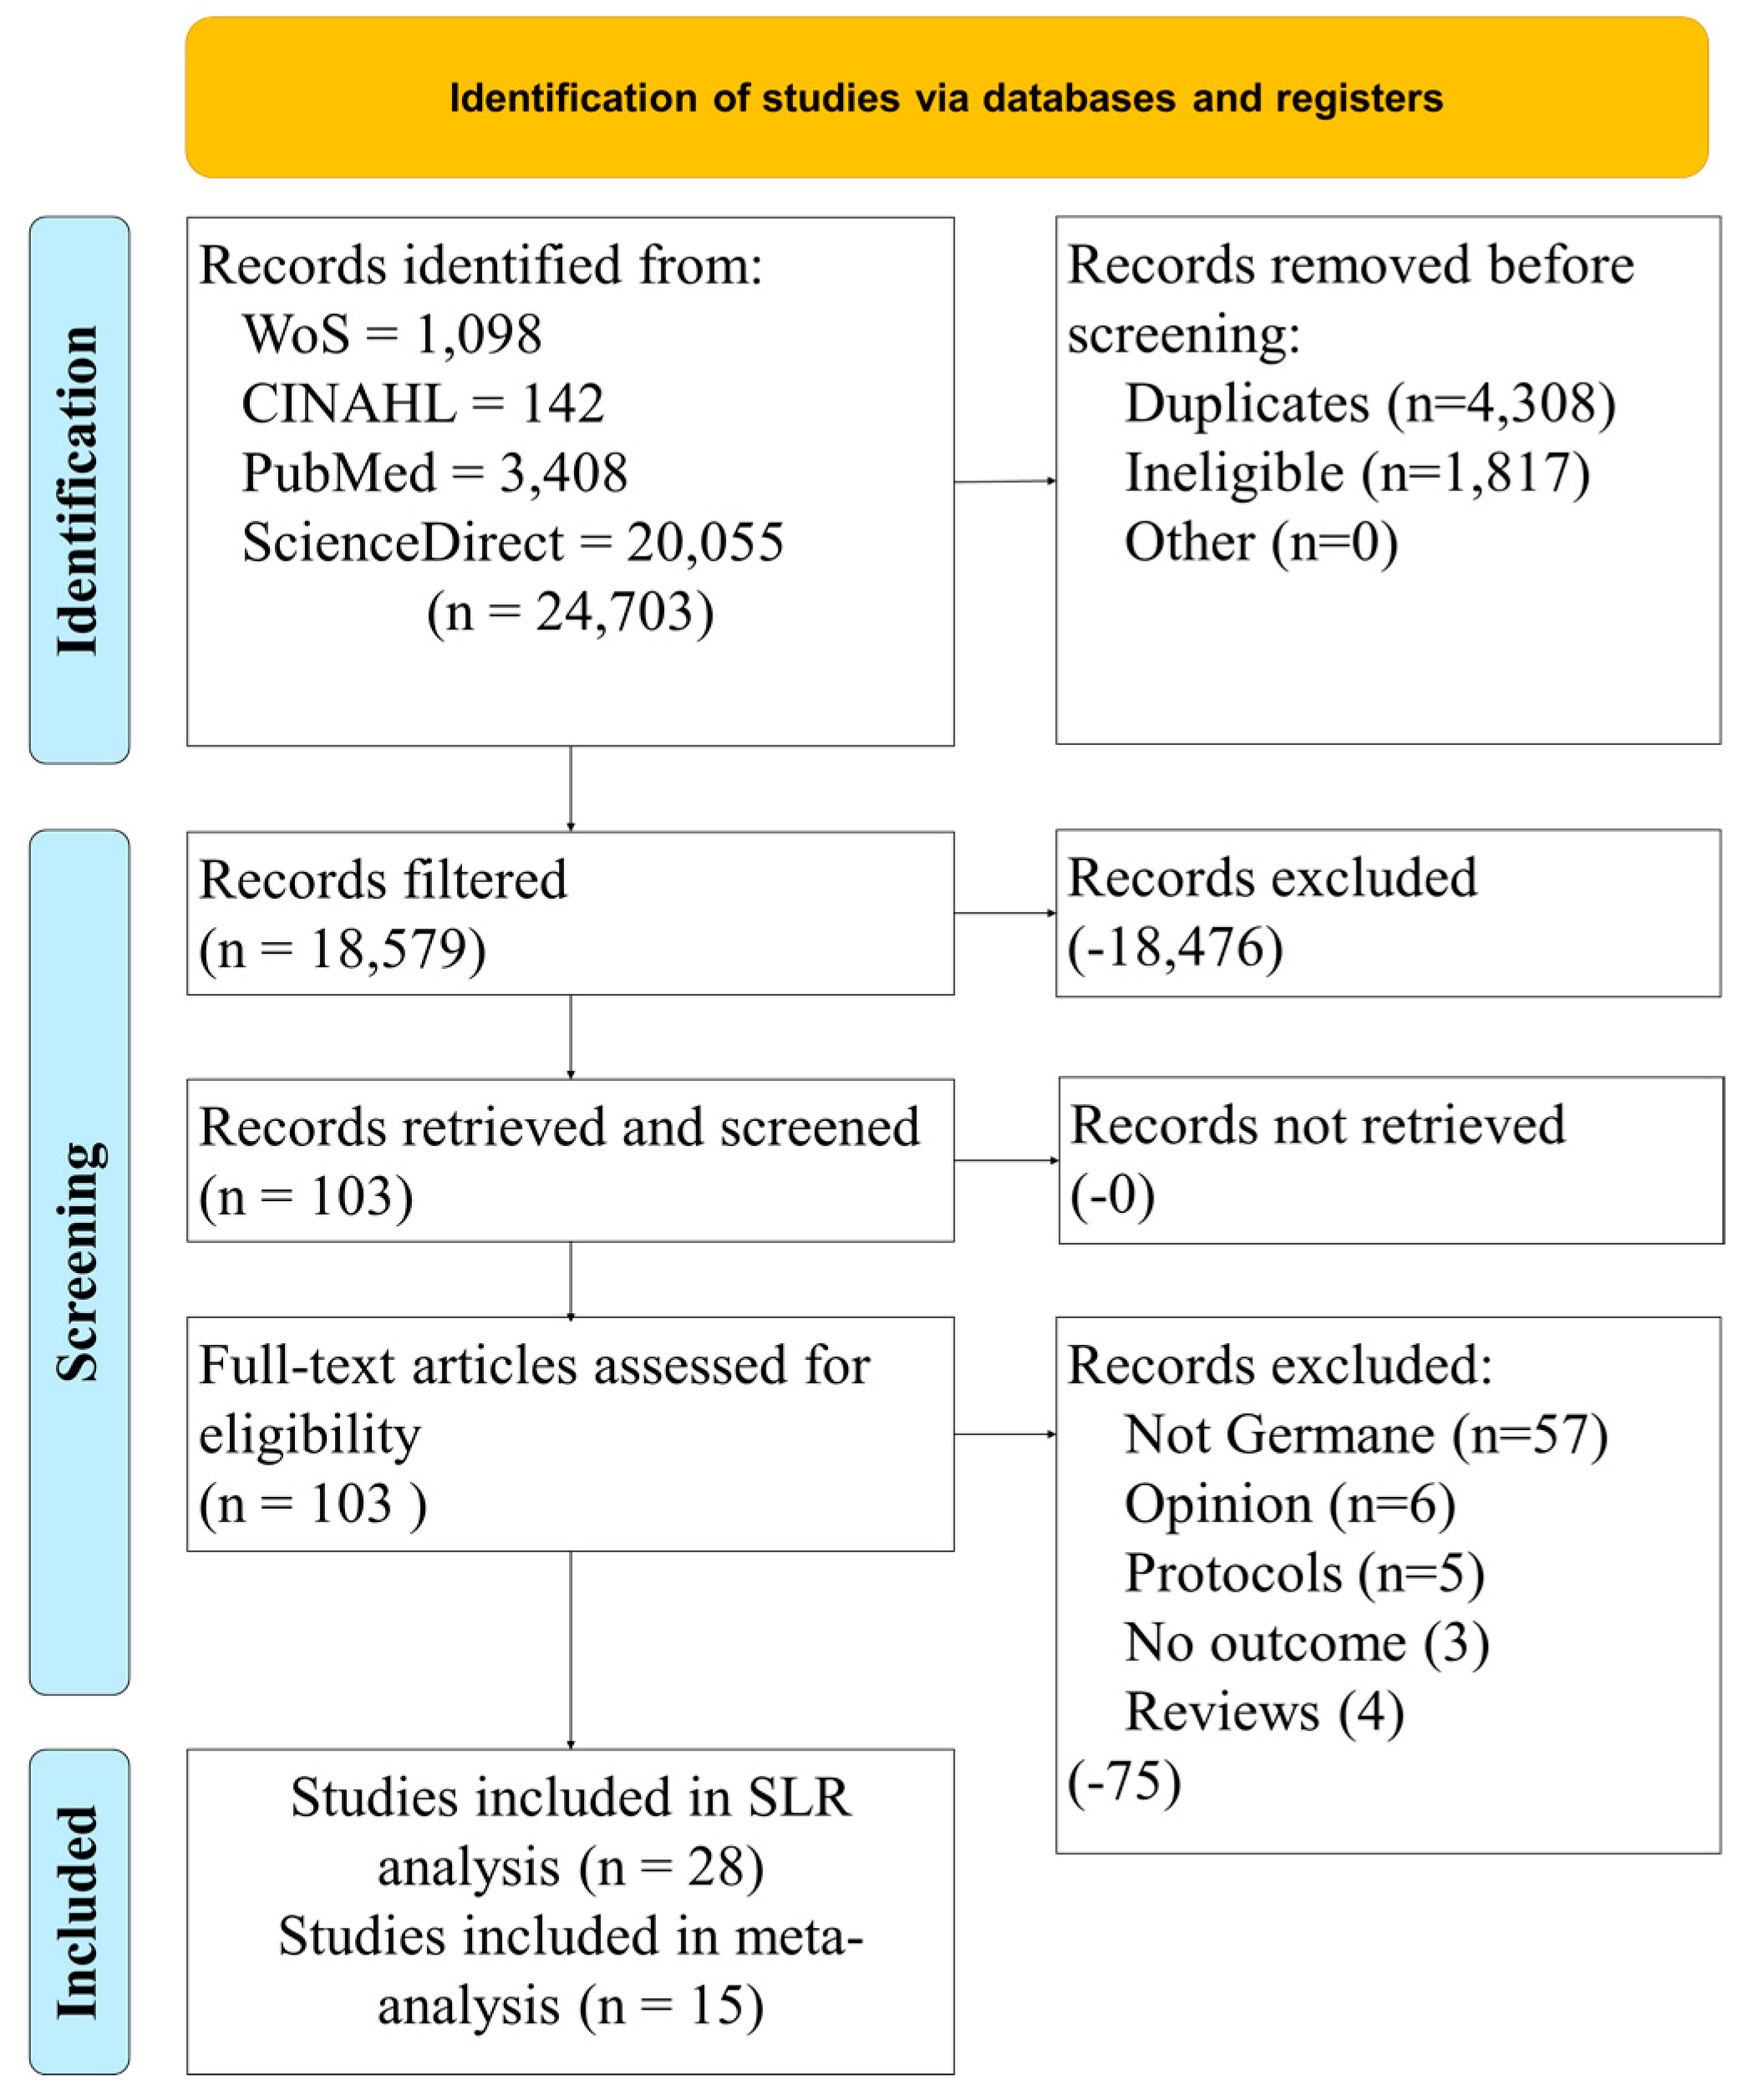
3.1. Study Selection
3.2. Study Characteristics
3.3. Risk of Bias within and across Studies
3.4. Results of Individual Studies
3.5. Results of Syntheses
3.6. Additional Analysis and Certainty of Evidence
3.7. Interventions of HIT to Diagnose AD
4. Discussion
Limitations
5. Conclusions
Author Contributions
Funding
Institutional Review Board Statement
Informed Consent Statement
Data Availability Statement
Acknowledgments
Conflicts of Interest
Appendix A. Observation-to-Theme Conversion
| Authors | Experimental Intervention | Intervention Theme | Effectiveness Indicators | Effectiveness Themes | Barriers to Adoption | Barrier Themes |
| Guo et al. [17] | Biomarkers (proteomics) in blood plasma to distinguish early AD from physiological aging and diagnose AD | Biomarkers | Accurate at detection of AD | Accurate at detecting AD | Taking blood plasma is invasive; processing the sample can be expensive; requires physical presence in medical facility with travel and expenses | Taking blood is invasive |
| Cost of intervention | ||||||
| Must train users | ||||||
| Requires physical presence of patient | ||||||
| Expense of travel involved | ||||||
| Kirbas et al. [18] | Spectral domain optical coherence tomography (SD-OCT) to measure retinal nerve fiber layer (RNFL) thickness to diagnose AD | Spectral domain optical coherence tomography | Accurate at detection of AD | Accurate at detecting AD | Expensive intervention; requires physical presence of patient with travel and expenses | Cost of intervention |
| Must train users | ||||||
| Requires physical presence of patient | ||||||
| Expense of travel involved | ||||||
| Wang et al. [19] | Bayesian network (BN) analysis based on regional gray matter volumes to identify differences in structural interactions among core default mode network (DMN) regions in structural MRI data to diagnose AD | AI/machine learning | Accurate at detection of AD | Accurate at detecting AD | Cost of MRI images and computers to run BN analysis on images | Cost of intervention |
| Must train users | ||||||
| Munro et al. [20] | Telepsychiatry and telepsychology through video teleconferencing (VTC) to diagnose AD | Telehealth/VTC/VR | Non-invasive, convenient, accurate, inexpensive | Non-invasive | Cost to acquire equipment, staff training | Cost of intervention |
| Accurate at detecting AD | Must train users | |||||
| Inexpensive | ||||||
| Zou et al. [21] | MRI biomarkers and MR spectroscopy (MRS) to detect changes in arterial blood flow to diagnose AD | MRI | Non-invasive, early detection of AD | Non-invasive | Cost to acquire equipment, staff training, requires physical presence of patient with travel and expenses | Cost of intervention |
| Accurate at detecting AD | Must train users | |||||
| Requires physical presence of patient | ||||||
| Expense of travel involved | ||||||
| Collij et al. [22] | Machine learning (AI) to arterial spin labeling to diagnose AD | AI/machine learning | Effective way to diagnose early stages of AD | Accurate at detecting AD | Invasive to draw blood or plasma, cost to acquire equipment, cost to train staff | Taking blood is invasive |
| Cost of intervention | ||||||
| Must train users | ||||||
| Hornberger et al. [23] | Positron emission tomography (PET) biomarkers to estimate AB neurotic plaque density to diagnose AD | PET | Effective way to diagnose early stages of AD | Accurate at detecting AD | Cost, physical presence of patient, train staff | Cost of intervention |
| Requires physical presence of patient | ||||||
| Expense of travel involved | ||||||
| Must train users | ||||||
| Zhou et al. [24] | Instrument trail-making task (iTMT) using a wearable sensor to identify motor-cognitive impairment and diagnose AD | Telehealth/VTC/VR | Effective way to diagnose early stages of AD | Accurate at detecting AD | Training of staff | Must train users |
| Inexpensive | ||||||
| Ashton et al. [25] | Biomarkers through saliva, including tau, to diagnose AD | Biomarkers | Non-invasive, non-stressful | Non-invasive | Not reported | Not reported |
| Non-stressful | ||||||
| Babiloni et al. [26] | Resting state electroencephalographic (rsEEG) rhythms to diagnose AD | EEG | Cost-effective, non-invasive, non-stressful, can be repeated without repetition effects, accurate method to diagnose AD | Inexpensive | Training of staff | Must train users |
| Non-invasive | ||||||
| Non-stressful | ||||||
| Repeatable without degradation of results | ||||||
| Accurate at detecting AD | ||||||
| Jones et al. [27] | PET biomarkers in microtubule-associated protein tau (MAPT) to diagnose AD | PET | Non-invasive, non-stressful | Non-invasive | Cost to acquire equipment, staff training, requires physical presence of patient with travel and expenses | Cost of intervention |
| Non-stressful | Must train users | |||||
| Requires physical presence of patient | ||||||
| Expense of travel involved | ||||||
| Lee et al. [28] | Machine learning (AI) of MRI scans to assess cortical atrophy and diagnose AD | AI/machine learning | The AI model is inexpensive. Good predictive validity. Non-invasive and non-stressful | Inexpensive | Cost of MRI images, must train people on the AI procedure | Cost of intervention |
| Accurate at detecting AD | Must train users | |||||
| Non-invasive | Requires physical presence of patient | |||||
| Non-stressful | Expense of travel involved | |||||
| Lowe et al. [29] | Tau-PET biomarkers to understand neurofibrillary tangle development to diagnose AD | PET | A method to assess neurofibrillary tangle on the living is necessary to use the results of this study | Ineffective | This procedure was performed at autopsy | Need a procedure for the living |
| Fotuhi et al. [30] | Using RNA as blood-based biomarker to diagnose AD | RNA | Inexpensive | Inexpensive | Invasive to draw blood or plasma, cost to acquire equipment, cost to train staff, requires physical presence of patient, travel expenses | Taking blood is invasive |
| Cost of intervention | ||||||
| Must train users | ||||||
| Requires physical presence of patient | ||||||
| Expense of travel involved | ||||||
| Pase et al. [31] | Plasma total tau as a blood biomarker to diagnose AD | Biomarkers | Convenient, inexpensive | Convenient | Invasive to draw blood or plasma, cost to acquire equipment, cost to train staff, requires physical presence of patient, travel expenses | Taking blood is invasive |
| Inexpensive | Cost of intervention | |||||
| Must train users | ||||||
| Requires physical presence of patient | ||||||
| Expense of travel involved | ||||||
| Tahmi et al. [32] | PET biomarkers for quantifying amyloid-B plaques on the brain to diagnose AD | PET | Effective way to diagnose early stages of AD | Accurate at detecting AD | Cost of PET, training of staff | Cost of intervention |
| Must train users | ||||||
| Requires physical presence of patient | ||||||
| Expense of travel involved | ||||||
| Cabinio et al. [33] | Virtual reality to assess memory decline to diagnose AD | Telehealth/VTC/VR | Non-invasive, non-stressful | Non-invasive | Cost to acquire equipment, staff training | Cost of intervention |
| Non-stressful | Must train users | |||||
| Rajan et al. [34] | Blood biomarkers total tau (t-tau), neurofilament light (Nf-L), and glial fibrillary acidic protein (GFAP) to diagnose AD | biomarkers | Accurate at detection of AD | Accurate at detecting AD | Taking blood plasma is invasive, processing the sample can be expensive, must train users, requires physical presence in medical facility with travel and expenses | Taking blood is invasive |
| Cost of intervention | ||||||
| Must train users | ||||||
| Requires physical presence of patient | ||||||
| Expense of travel involved | ||||||
| Thientunyakit et al. [35] | MRI and PET biomarkers used to assess amyloid levels, glucose metabolism, morphologic change in brain to diagnose AD | MRI and PET | Non-invasive, non-stressful, accurate diagnosis tool | Non-invasive | MRI and PET are expensive interventions | Cost of intervention |
| Non-stressful | Requires physical presence of patient | |||||
| Accurate at detecting AD | Expense of travel involved | |||||
| Altomare et al. [36] | Using amyloid-PET and tau-PET biomarkers to diagnose AD | PET | Non-invasive, non-stressful, accurate diagnosis tool | Accurate at detecting AD | MRI and PET are expensive interventions | Cost of intervention |
| Non-invasive | Requires physical presence of patient | |||||
| Non-stressful | Expense of travel involved | |||||
| Desai et al. [37] | Tau concentration biomarkers based on activity levels to treat AD | PET | Effective way to slow cognitive decline | Accurate at detecting AD | Blood draw is invasive, cost of analysis expensive, must train staff on procedure, patient must be present at the hospital, travel expenses | Taking blood is invasive |
| Must train users | ||||||
| Cost of intervention | ||||||
| Requires physical presence of patient | ||||||
| Expense of travel involved | ||||||
| Lin et al. [38] | Arterial pulse spectrum and multilayer-perception analysis to diagnose classification of AD | Arterial pulse | Non-invasive, rapid, inexpensive, and objective method for detecting and monitoring the AD status | Non-invasive | Training of staff | Must train users |
| Rapid | ||||||
| Inexpensive | ||||||
| Accurate at detecting AD | ||||||
| Liu et al. [39] | Serum miR-24-3P to diagnose AD | Biomarkers | Biomarker can help diagnose AD | Accurate at detecting AD | Blood draw is invasive, cost of analysis expensive, must train staff on procedure, patient must be present at the hospital, travel expenses | Taking blood is invasive |
| Must train users | ||||||
| Cost of intervention | ||||||
| Requires physical presence of patient | ||||||
| Expense of travel involved | ||||||
| Mila-Aloma et al. [40] | Using amyloid-B pathology to classify cognitively unimpaired individuals and diagnose AD | PET | Biomarker can help diagnose AD | Accurate at detecting AD | Blood draw is invasive, cost of analysis expensive, must train staff on procedure, patient must be present at the hospital, travel expenses | Taking blood is invasive |
| Must train users | ||||||
| Cost of intervention | ||||||
| Requires physical presence of patient | ||||||
| Expense of travel involved | ||||||
| Sajjad et al. [41] | Using PET biomarkers and synthetic data augmentation (DCGAN model) to diagnose AD | PET | Non-invasive, non-stressful, repeatable | Non-invasive | PET images are expensive, requires physical presence of pt, incurring expenses for travel | Cost of intervention |
| Non-stressful | Requires physical presence of patient | |||||
| Repeatable without degradation of results | Expense of travel involved | |||||
| Wu et al. [42] | Plasma biomarker (p-tau and t-tau) to diagnose AD | Biomarkers | Biomarker can help diagnose AD | Accurate at detecting AD | Blood draw is invasive, cost of analysis expensive, must train staff on procedure, patient must be present at the hospital, travel expenses | Taking blood is invasive |
| Must train users | ||||||
| Cost of intervention | ||||||
| Requires physical presence of patient | ||||||
| Expense of travel involved | ||||||
| Chun et al. [43] | 18F-THK5351 PET to diagnose AD | PET | Effective diagnostic tool | Accurate at detecting AD | PET images are expensive, requires physical presence of patient, incurring expenses for travel | Cost of intervention |
| Requires physical presence of patient | ||||||
| Expense of travel involved | ||||||
| Kim et al. [44] | Telemonitoring to diagnose AD | Telehealth/VTC/VR | Non-invasive, cost-effective | Accurate at detecting AD | Cost of sensors | Cost of intervention |
| Inexpensive |
Appendix B. Other Observations Incident to Review
| Authors | Sample Size | Bias within Study | Effect Size, Sensitivity, Specificity, and F1 | Country of Origin (Where Was the Study Conducted?) | Statistics Used |
| Guo et al. [17] | 165 | Germany only (selection bias) | sensitivity of 89.36% and a specificity of 79.17% | Germany | Independent Student’s t-test or Mann–Whitney U-test |
| Kirbas et al. [18] | 80 | Turkey only (selection bias) | not reported | Turkey | The normality of the distribution for all variables was assessed by the Kolmogorov–Smirnov test. Student t test was used for normally distributed variables and the Mann–Whitney U test was used for nonparametric variables |
| Wang et al. [19] | 181 | China only (selection bias) | 87.12% specificity and 81.25% sensitivity | China | BN analysis |
| Munro et al. [20] | 202 | US only (selection bias) | significant intraclass correlations(mean = 0.74; range: 0.55–0.91) | US | Bradley–Blackwood (BB) Procedure used to examine the bias between the testing formats by simultaneously testing the equality of means and equality of variances; if the BB procedure resulted in a significant result, both the paired t test (significant result indicating that means are biased) and the Pitman Test (significant results indicating that variances are biased) were examined to determine the source of bias. Bland–Altman plots used to explore magnitude of mean differences |
| Zou et al. [21] | 40 | China only (selection bias), 58% female (sample bias) | not reported | China | Independent sample t-test |
| Collij et al. [22] | 260 | Netherlands only (selection bias) | not reported | Netherlands | Not reported |
| Hornberger et al. [23] | 42 | US only (selection bias) | not reported | US | |
| Zhou et al. [24] | 30 | US only (selection bias) | strong effect size | US | Analysis of variance, Mann–Whitney U tests, and χ2 tests were used for between-group comparison according to the scale of the investigated variable and the distribution of the data. Analysis of covariance was employed to compare difference between groups for iTMT tests with and without adjustment for age, BMI, and education level. Sidak adjustment for pairwise comparison used for post-hoc analysis. Test-reliability was assessed using interclass correlation |
| Ashton et al. [25] | 160 | Sweden only (selection bias) | not reported | Sweden | Not reported |
| Babiloni et al. [26] | 83 | Italy only (selection bias), older patients only (sample bias), 82% male (sample bias) | a sensitivity of 90%, a specificity of 73.3%, an accuracy of 81.7%, and 0.86 of the AUROC curve | Italy | ANOVA. The degrees of freedom were corrected by using the Greenhouse–Geisser procedure when appropriate.Duncan test was used for post-hoc comparisons |
| Jones et al. [27] | 284 | US only (selection bias) | not reported | US | t-test used to compare least-squares means of log tau PET standardized uptake value ratios (SUVRs) |
| Lee et al. [28] | 1342 | Korea only (selection bias) | sensitivity of 87.1% and specificity of 93.3% | Korea | Chi-square, Fisher’s exact, or Student’s t-tests |
| Lowe et al. [29] | 687 | US only (selection bias) | not reported | US | Hierarchical clustering |
| Fotuhi et al. [30] | 81 | Iran only (selection bias) | 75% sensitivity and 100% specificity and 0.89 (p < 0.0001, 95% CI 0.8109–0.9669) with 68% sensitivity and 100% specificity, respectively | Iran | t-test and one-way ANOVA |
| Pase et al. [31] | 1453 | US only (selection bias), 55% female (sample bias) | not reported | US | t-test and Spearman’s correlation coefficient |
| Tahmi et al. [32] | 52 | US only (selection bias) | not reported | US | 2-way ANOVA and t-tests |
| Cabinio et al. [33] | 139 | Italy only (selection bias) | sensitivity 84.4%, specificity 75.5% for SASG-total | Italy | Linear regression, one-way ANOVA, or Mann–Whitney; data were corrected for multiple comparison using the Bonferroni correction |
| Rajan et al. [34] | 1327 | US only (selection bias), 60% female, 60% African American (sample bias) | in a sensitivity analysis for the association of blood biomarkers with clinical AD adjusting for storage time, we found that the association of blood biomarkers was slightly higher for t-tau with an OR for clinical AD of 1.71 (95% CI = 1.42–2.03); lower for Nf-L, with an OR of 3.58 (95% CI = 2.68–4.93); and higher for GFAP, with an OR of 3.32 (95% CI = 2.34–4.55). | US | Mutlivariate logistic regression model with time-dependent log10-transformed t-tau, Nf-L, and GFAP |
| Thientunyakit et al. [35] | 51 | Thailand only (selection bias) | high | Thailand | One-way ANOVA, Chi-Square, Student t-test |
| Altomare et al. [36] | 136 | Switzerland only (selection bias) | not reported | Switzerland | Mann–Whitney to compare arms. Cohen’s k to calculate agreement. Chi-Square to assess changes in diagnosis. Proportional test used to assess difference in diagnostic changes between pathways |
| Desai et al. [37] | 1159 | US only (selection bias), 63% female (sample bias) | not reported | US | Mixed-effects regression |
| Lin et al. [38] | 161 | Taiwan only (selection bias) | accuracy of 82.86%, a specificity of 92.31%, and a 0.83 AUC of ROC curve | Taiwan | Machine learning (SEM)—Python, AD pts randomly split into training and validation sets. Cross-validation used with 80:20 training and validation |
| Liu et al. [39] | 198 | China only (selection bias) | China | t-test | |
| Mila-Aloma et al. [40] | 318 | Spain only (selection bias) | not reported | Spain | ANCOVA |
| Sajjad et al. [41] | 136 | Saudi Arabia only (selection bias) | Weighted average F1 = 0.83 | Saudi Arabia | Machine learning (SEM) |
| Wu et al. [42] | 159 | China only (selection bias), 58% female (sample bias) | 78.6% sensitivity and 94.2% specificity | China | Student t-test and Mann–Whitney U-test, Chi-Square used for categorical variables |
| Chun et al. [43] | 25 | Korea only (selection bias) | not reported | Korea | Student’s t-test and chi-square test for continuous and categorical variables |
| Kim et al. [44] | 18 | Korea only (selection bias) | not reported | Korea | Machine learning, 66% training, 34% testing |
Appendix C. Statistical Analysis
| 1st Author | N | Number Not Hlthy | Number Hlthy | True Positives | False Negatives | True Negatives | False Positives | Sensitivity (Recall) | Specificity | PPV (Precision) | Accuracy | F1 Score | OR | Notes |
| Guo [17] | 165 | 58 | 109 | 52 | 6 | 86 | 23 | 0.894 | 0.792 | 0.70 | 0.84 | 0.78 | 31.92 | |
| Wang [19] | 181 | 80 | 101 | 70 | 10 | 82 | 19 | 0.871 | 0.813 | 0.79 | 0.84 | 0.83 | 29.31 | |
| Munro [20] | 202 | 83 | 119 | 72 | 11 | 96 | 23 | 0.870 | 0.810 | 0.76 | 0.83 | 0.81 | 28.53 | |
| Babiloni [26] | 83 | 53 | 30 | 48 | 5 | 22 | 8 | 0.900 | 0.733 | 0.86 | 0.84 | 0.88 | 24.71 | |
| Lee [28] | 1342 | 473 | 869 | 412 | 61 | 811 | 58 | 0.871 | 0.933 | 0.88 | 0.91 | 0.87 | 94.02 | |
| Fotuhi [30] | 81 | 45 | 36 | 31 | 14 | 36 | 0 | 0.680 | 1.000 | 1.00 | 0.82 | 0.81 | 152.37 | Full AD vs. Healthy Controls only, Haldane–Anscombe correction for OR) |
| Cabinio [33] | 139 | 32 | 107 | 27 | 5 | 81 | 26 | 0.844 | 0.755 | 0.51 | 0.78 | 0.63 | 16.67 | |
| Lin [38] | 161 | 87 | 74 | 72 | 15 | 68 | 6 | 0.829 | 0.923 | 0.93 | 0.87 | 0.87 | 58.03 | |
| Liu [39] | 198 | 104 | 94 | 91 | 13 | 73 | 21 | 0.875 | 0.777 | 0.81 | 0.83 | 0.84 | 24.39 | |
| Wu [42] | 159 | 148 | 121 | 116 | 32 | 114 | 7 | 0.786 | 0.942 | 0.94 | 1.45 | 0.86 | 59.65 | |
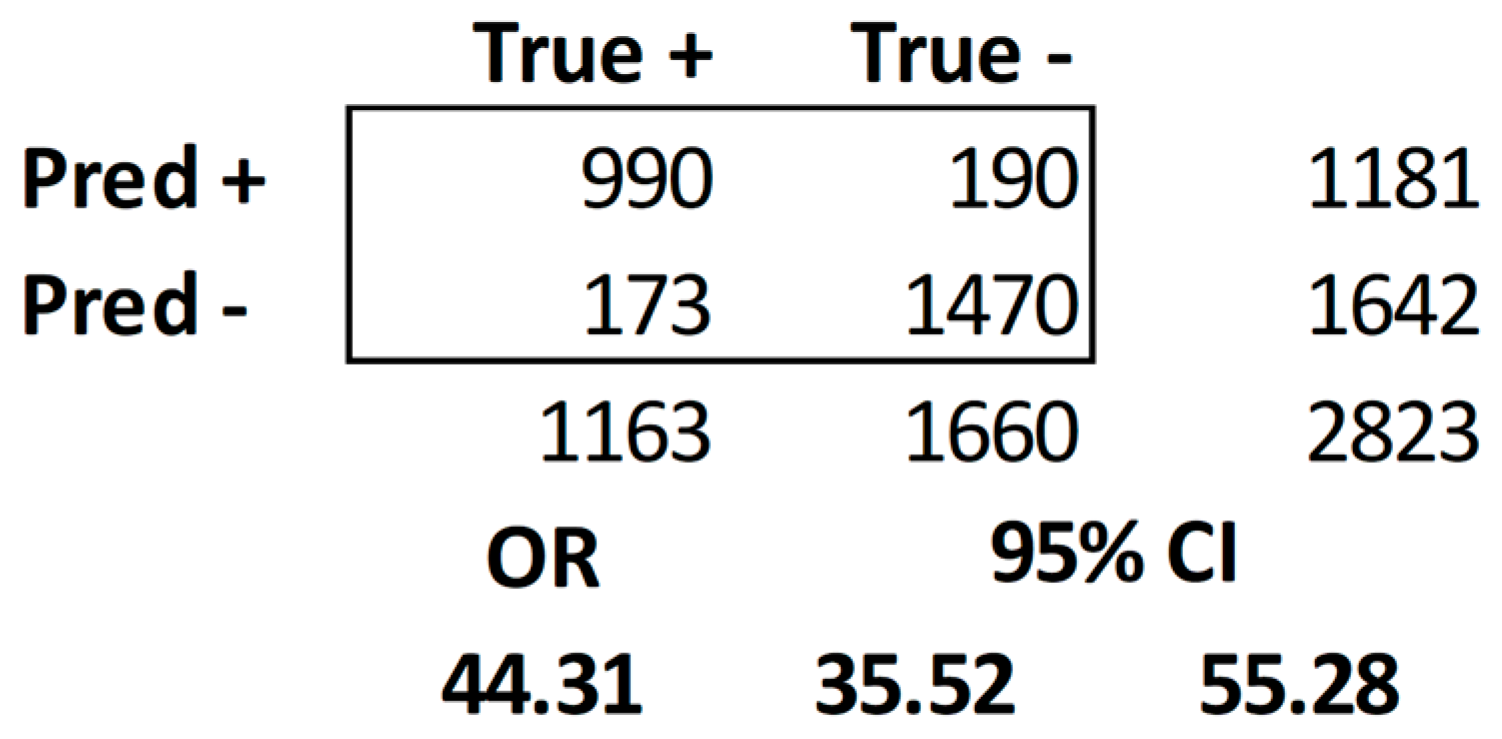
| Totals | 2711 | 1163 | 1660 | 990 | 173 | 1470 | 190 | |||||||
| Overall Sensitivity | 0.8516 | |||||||||||||
| Overall Specificity | 0.8853 | |||||||||||||
| Overall PPV | 0.8388 | |||||||||||||
| Overall Accuracy | 0.9074 | |||||||||||||
| Overall F1 Score | 0.8452 |
References
- Patterson, C. World Alzheimer Report 2018. 2018. Available online: https://apo.org.au/node/260056 (accessed on 2 June 2023).
- Association, A.S. 2012 Alzheimer’s disease facts and figures. Alzheimer’s Dement. 2012, 8, 131–168. [Google Scholar]
- Meng, L.; He, M.; Xiong, M.; Zhang, X.; Nie, S.; Xiong, J.; Hu, D.; Zhang, Z.; Mao, L.; Zhang, Z. 2′, 3′-Dideoxycytidine, a DNA polymerase-β inhibitor, reverses memory deficits in a mouse model of Alzheimer’s disease. J. Alzheimer’s Dis. 2019, 67, 515–525. [Google Scholar] [CrossRef]
- Marcello, E.; Gardoni, F.; Di Luca, M. Alzheimer’s Disease and Modern Lifestyle: What is the Role of Stress; Wiley Online Library: Hoboken, NJ, USA, 2015; pp. 795–798. [Google Scholar]
- Wright, J.W.; Harding, J.W. The brain renin–angiotensin system: A diversity of functions and implications for CNS diseases. Pflügers Arch.-Eur. J. Physiol. 2013, 465, 133–151. [Google Scholar] [CrossRef]
- Talebi, M.; Esmaeeli, H.; Talebi, M.; Farkhondeh, T.; Samarghandian, S. A Concise Overview of Biosensing Technologies for the Detection of Alzheimer’s Disease Biomarkers. Curr. Pharm. Biotechnol. 2022, 23, 634–644. [Google Scholar] [CrossRef]
- Wells, C.; Horton, J. An Overview of New and Emerging Technologies for Early Diagnosis of Alzheimer Disease. Can. J. Health Technol. 2022, 2. [Google Scholar] [CrossRef]
- Chitsaz, A.; Ajami, S. Novel technologies impact on parkinson’s & alzheimer’s patient during the COVID-19 pandemic. Int. J. Prev. Med. 2022, 13, 18. [Google Scholar]
- Cammisuli, D.M.; Cipriani, G.; Castelnuovo, G. Technological Solutions for Diagnosis, Management and Treatment of Alzheimer’s Disease-Related Symptoms: A Structured Review of the Recent Scientific Literature. Int. J. Environ. Res. Public Health 2022, 19, 3122. [Google Scholar] [CrossRef]
- Sujith, A.; Sajja, G.S.; Mahalakshmi, V.; Nuhmani, S.; Prasanalakshmi, B. Systematic review of smart health monitoring using deep learning and Artificial intelligence. Neurosci. Inform. 2022, 2, 100028. [Google Scholar] [CrossRef]
- Kruse, C.S. Writing a Systematic Review for Publication in a Health-Related Degree Program. JMIR Res. Protoc. 2019, 8, e15490. [Google Scholar] [CrossRef]
- Page, M.J.; McKenzie, J.E.; Bossuyt, P.M.; Boutron, I.; Hoffmann, T.C.; Mulrow, C.D.; Shamseer, L.; Tetzlaff, J.M.; Akl, E.A.; Brennan, S.E.; et al. The PRISMA 2020 statement: An updated guideline for reporting systematic reviews. BMJ 2021, 372, 105906. [Google Scholar]
- Braun, V.; Clarke, V. Using thematic analysis in psychology. Qual. Res. Psychol. 2006, 3, 77–101. [Google Scholar] [CrossRef]
- Newhouse, R.; Dearholt, S.; Poe, S.; Pugh, L.; White, K. The Johns Hopkins Nursing Evidence-Based Practice Rating Scale; The Johns Hopkins Hospital: Baltimore, MD, USA, 2005. [Google Scholar]
- Hand, D.J.; Christen, P.; Kirielle, N. F*: An interpretable transformation of the F-measure. Mach. Learn. 2021, 110, 451–456. [Google Scholar] [CrossRef]
- Salgado, J.F. Transforming the area under the normal curve (AUC) into Cohen’sd, Pearson’s rpb, odds-ratio, and natural log odds-ratio: Two conversion tables. Eur. J. Psychol. Appl. Leg. Context 2018, 10, 35–47. [Google Scholar] [CrossRef]
- Guo, L.H.; Alexopoulos, P.; Wagenpfeil, S.; Kurz, A.; Perneczky, R. Plasma proteomics for the identification of Alzheimer disease. Alzheimer Dis. Assoc. Disord. 2013, 27, 337–342. [Google Scholar] [CrossRef]
- Kirbas, S.; Turkyilmaz, K.; Anlar, O.; Tufekci, A.; Durmus, M. Retinal Nerve Fiber Layer Thickness in Patients With Alzheimer Disease. J. Neuro-Ophthalmol. 2013, 33, 58–61. [Google Scholar] [CrossRef]
- Wang, Y.; Chen, K.; Yao, L.; Jin, Z.; Guo, X. Structural interactions within the default mode network identified by Bayesian network analysis in Alzheimer’s disease. PLoS ONE 2013, 8, e74070. [Google Scholar] [CrossRef]
- Munro Cullum, C.; Hynan, L.S.; Grosch, M.; Parikh, M.; Weiner, M.F. Teleneuropsychology: Evidence for video teleconference-based neuropsychological assessment. J. Int. Neuropsychol. Soc. 2014, 20, 1028–1033. [Google Scholar] [CrossRef]
- Zou, J.X.; Wang, M.J.; Lei, X.J.; Chen, X.G. 3.0 T MRI arterial spin labeling and magnetic resonance spectroscopy technology in the application of Alzheimer’s disease. Exp. Gerontol. 2014, 60, 31–36. [Google Scholar] [CrossRef]
- Collij, L.E.; Heeman, F.; Kuijer, J.P.; Ossenkoppele, R.; Benedictus, M.R.; Möller, C.; Verfaillie, S.C.; Sanz-Arigita, E.J.; van Berckel, B.N.; van der Flier, W.M.; et al. Application of Machine Learning to Arterial Spin Labeling in Mild Cognitive Impairment and Alzheimer Disease. Radiology 2016, 281, 865–875. [Google Scholar] [CrossRef]
- Hornberger, J.; Bae, J.; Watson, I.; Johnston, J.; Happich, M. Clinical and cost implications of amyloid beta detection with amyloid beta positron emission tomography imaging in early Alzheimer’s disease—The case of florbetapir. Curr. Med. Res. Opin. 2017, 33, 675–685. [Google Scholar] [CrossRef]
- Zhou, H.; Sabbagh, M.; Wyman, R.; Liebsack, C.; Kunik, M.E.; Najafi, B. Instrumented Trail-Making Task to Differentiate Persons with No Cognitive Impairment, Amnestic Mild Cognitive Impairment, and Alzheimer Disease: A Proof of Concept Study. Gerontology 2017, 63, 189–200. [Google Scholar] [CrossRef]
- Ashton, N.J.; Ide, M.; Schöll, M.; Blennow, K.; Lovestone, S.; Hye, A.; Zetterberg, H. No association of salivary total tau concentration with Alzheimer’s disease. Neurobiol. Aging 2018, 70, 125–127. [Google Scholar] [CrossRef]
- Babiloni, C.; Del Percio, C.; Lizio, R.; Noce, G.; Lopez, S.; Soricelli, A.; Ferri, R.; Pascarelli, M.T.; Catania, V.; Nobili, F.; et al. Abnormalities of Resting State Cortical EEG Rhythms in Subjects with Mild Cognitive Impairment Due to Alzheimer’s and Lewy Body Diseases. J. Alzheimers Dis. 2018, 62, 247–268. [Google Scholar] [CrossRef]
- Jones, D.T.; Knopman, D.S.; Graff-Radford, J.; Syrjanen, J.A.; Senjem, M.L.; Schwarz, C.G.; Dheel, C.; Wszolek, Z.; Rademakers, R.; Kantarci, K.; et al. In vivo (18)F-AV-1451 tau PET signal in MAPT mutation carriers varies by expected tau isoforms. Neurology 2018, 90, e947–e954. [Google Scholar] [CrossRef]
- Lee, J.S.; Kim, C.; Shin, J.H.; Cho, H.; Shin, D.S.; Kim, N.; Kim, H.J.; Kim, Y.; Lockhart, S.N.; Na, D.L.; et al. Machine Learning-based Individual Assessment of Cortical Atrophy Pattern in Alzheimer’s Disease Spectrum: Development of the Classifier and Longitudinal Evaluation. Sci. Rep. 2018, 8, 4161. [Google Scholar] [CrossRef]
- Lowe, V.J.; Wiste, H.J.; Senjem, M.L.; Weigand, S.D.; Therneau, T.M.; Boeve, B.F.; Josephs, K.A.; Fang, P.; Pandey, M.K.; Murray, M.E.; et al. Widespread brain tau and its association with ageing, Braak stage and Alzheimer’s dementia. Brain 2018, 141, 271–287. [Google Scholar] [CrossRef]
- Fotuhi, S.N.; Khalaj-Kondori, M.; Hoseinpour Feizi, M.A.; Talebi, M. Long Non-coding RNA BACE1-AS May Serve as an Alzheimer’s Disease Blood-Based Biomarker. J. Mol. Neurosci. 2019, 69, 351–359. [Google Scholar] [CrossRef]
- Pase, M.P.; Beiser, A.S.; Himali, J.J.; Satizabal, C.L.; Aparicio, H.J.; DeCarli, C.; Chêne, G.; Dufouil, C.; Seshadri, S. Assessment of Plasma Total Tau Level as a Predictive Biomarker for Dementia and Related Endophenotypes. JAMA Neurol. 2019, 76, 598–606. [Google Scholar] [CrossRef]
- Tahmi, M.; Bou-Zeid, W.; Razlighi, Q.R. A Fully Automatic Technique for Precise Localization and Quantification of Amyloid-β PET Scans. J. Nucl. Med. 2019, 60, 1771–1779. [Google Scholar] [CrossRef]
- Cabinio, M.; Rossetto, F.; Isernia, S.; Saibene, F.L.; Di Cesare, M.; Borgnis, F.; Pazzi, S.; Migliazza, T.; Alberoni, M.; Blasi, V.; et al. The Use of a Virtual Reality Platform for the Assessment of the Memory Decline and the Hippocampal Neural Injury in Subjects with Mild Cognitive Impairment: The Validity of Smart Aging Serious Game (SASG). J. Clin. Med. 2020, 9, 1355. [Google Scholar] [CrossRef]
- Rajan, K.B.; Aggarwal, N.T.; McAninch, E.A.; Weuve, J.; Barnes, L.L.; Wilson, R.S.; DeCarli, C.; Evans, D.A. Remote Blood Biomarkers of Longitudinal Cognitive Outcomes in a Population Study. Ann. Neurol. 2020, 88, 1065–1076. [Google Scholar] [CrossRef]
- Thientunyakit, T.; Sethanandha, C.; Muangpaisan, W.; Chawalparit, O.; Arunrungvichian, K.; Siriprapa, T.; Vichianin, Y.; Kamal, S.; Suppasilp, C.; Thongpraparn, T.; et al. Relationships between amyloid levels, glucose metabolism, morphologic changes in the brain and clinical status of patients with Alzheimer’s disease. Ann. Nucl. Med. 2020, 34, 337–348. [Google Scholar] [CrossRef]
- Altomare, D.; Caprioglio, C.; Assal, F.; Allali, G.; Mendes, A.; Ribaldi, F.; Ceyzeriat, K.; Martins, M.; Tomczyk, S.; Stampacchia, S.; et al. Diagnostic value of amyloid-PET and tau-PET: A head-to-head comparison. Eur. J. Nucl. Med. Mol. Imaging 2021, 48, 2200–2211. [Google Scholar] [CrossRef]
- Desai, P.; Evans, D.; Dhana, K.; Aggarwal, N.T.; Wilson, R.S.; McAninch, E.; Rajan, K.B. Longitudinal Association of Total Tau Concentrations and Physical Activity With Cognitive Decline in a Population Sample. JAMA Netw. Open 2021, 4, e2120398. [Google Scholar] [CrossRef]
- Lin, S.K.; Hsiu, H.; Chen, H.S.; Yang, C.J. Classification of patients with Alzheimer’s disease using the arterial pulse spectrum and a multilayer-perceptron analysis. Sci. Rep. 2021, 11, 8882. [Google Scholar] [CrossRef]
- Liu, L.; Liu, L.; Lu, Y.; Zhang, T.; Zhao, W. Serum aberrant expression of miR-24-3p and its diagnostic value in Alzheimer’s disease. Biomark Med. 2021, 15, 1499–1507. [Google Scholar] [CrossRef]
- Milà-Alomà, M.; Shekari, M.; Salvadó, G.; Gispert, J.D.; Arenaza-Urquijo, E.M.; Operto, G.; Falcon, C.; Vilor-Tejedor, N.; Grau-Rivera, O.; Sala-Vila, A.; et al. Cognitively unimpaired individuals with a low burden of Aβ pathology have a distinct CSF biomarker profile. Alzheimers Res. Ther. 2021, 13, 134. [Google Scholar] [CrossRef]
- Sajjad, M.; Ramzan, F.; Khan, M.U.G.; Rehman, A.; Kolivand, M.; Fati, S.M.; Bahaj, S.A. Deep convolutional generative adversarial network for Alzheimer’s disease classification using positron emission tomography (PET) and synthetic data augmentation. Microsc. Res. Tech. 2021, 84, 3023–3034. [Google Scholar] [CrossRef]
- Wu, X.; Xiao, Z.; Yi, J.; Ding, S.; Gu, H.; Wu, W.; Luo, J.; Liang, X.; Zheng, L.; Xu, H.; et al. Development of a Plasma Biomarker Diagnostic Model Incorporating Ultrasensitive Digital Immunoassay as a Screening Strategy for Alzheimer Disease in a Chinese Population. Clin. Chem. 2021, 67, 1628–1639. [Google Scholar] [CrossRef]
- Chun, M.Y.; Lee, J.; Jeong, J.H.; Roh, J.H.; Oh, S.J.; Oh, M.; Oh, J.S.; Kim, J.S.; Moon, S.H.; Woo, S.Y.; et al. (18)F-THK5351 PET Positivity and Longitudinal Changes in Cognitive Function in β-Amyloid-Negative Amnestic Mild Cognitive Impairment. Yonsei Med. J. 2022, 63, 259–264. [Google Scholar] [CrossRef]
- Kim, J.; Cheon, S.; Lim, J. IoT-Based Unobtrusive Physical Activity Monitoring System for Predicting Dementia. IEEE Access 2022, 10, 26078–26089. [Google Scholar] [CrossRef]
- Nangare, S.; Patil, P. Prevalence, distribution, treatment, and modern methods for in vitro diagnosis of Alzheimer’s disease in India: Challenges and future prospective. Article. Thai J. Pharm. Sci. 2022, 46, 149–160. [Google Scholar]


| Authors | Participants | Experimental Intervention | Results | Medical Outcomes Reported | Study Design |
|---|---|---|---|---|---|
| Guo et al. [17] | 165 older adults with AD | Blood biomarkers (proteomics) in blood plasma to distinguish early AD from physiological aging and diagnose AD | A set of 5 plasma proteins was identified, which differentiated between the CON group and the AD dementia group | Positive predictability. A biological pathway analysis showed that 4 of 5 proteins belonged to a common network with amyloid precursor protein and tau | Quasi-experimental |
| Kirbas et al. [18] | 80 older adults with AD, mean age 68.9 | Spectral domain optical coherence tomography (SD-OCT) to measure retinal nerve fiber layer (RNFL) thickness to diagnose AD | The average RNFL thickness was significantly less in the AD patients than in controls (65 ± 6.2 mm vs. 75 ± 3.8 mm; p = 0.001) | Positive predictability. AD degrades the thickness of the retinal nerve. SD-OCT can be used to positively diagnose AD in early stages of disease | Quasi-experimental |
| Wang et al. [19] | 181 older adult AD patients | Bayesian network (BN) analysis based on regional gray matter volumes to identify differences in structural interactions among core default mode network (DMN) regions in structural MRI data to diagnose AD | The structural interactions between the medial prefrontal cortex (mPFC) and other brain regions, including the left inferior parietal cortex (IPC), the left inferior temporal cortex (ITC), and the right hippocampus (HP), were significantly reduced in the AD group | The BN models significantly distinguished AD patients from normal controls | Quasi-experimental |
| Munro et al. [20] | 202 older adults | Telepsychiatry and telepsychology through video teleconferencing (VTC) to diagnose AD | Highly similar results across VTC and in-person conditions | VTC is a valid method to diagnose AD | True experiment |
| Zou et al. [21] | 40 older adults, average age 64.8, 58% female | MRI and MR spectroscopy (MRS) biomarkers to detect changes in arterial blood flow to diagnose AD | Significant difference in the mean MMSE scores between the AD group and the healthy control group | Accurate predictor of AD; CBF in the bilateral frontal region showed a significant decrease in the AD group | Quasi-experimental |
| Collij et al. [22] | 260 older adults | Machine learning (AI) to arterial spin labeling to diagnose AD | Single-subject diagnosis in the prediction set by using the discrimination maps yielded excellent performance for AD versus SCD (AUC, 0.96; p < 0.01), good performance for AD versus MCI (AUC, 0.89; p < 0.01), and poor performance for MCI versus SCD (AUC, 0.63; p = 0.06). Application of the AD versus SCD discrimination map for prediction of MCI subgroups resulted in good performance for patients with MCI diagnosis converted to AD versus subjects with SCD (AUC, 0.84; p < 0.01) and fair performance for patients with MCI diagnosis converted to AD versus those with stable MCI (AUC, 0.71; p > 0.05) | With automated methods, age- and sex-adjusted ASL perfusion maps can be used to classify and predict diagnosis of AD, conversion of MCI to AD, stable MCI, and SCD with good to excellent accuracy and AUC values | Quasi-experimental |
| Hornberger et al. [23] | 42 older adults | Positron emission tomography (PET) biomarkers to estimate AB neurotic plaque density to diagnose AD | Aβ-PET used as an adjunct to standard diagnostic assessment increased QALYs by 0.021 years and 10-year costs by EUR 470 per patient. The ICER was EUR 21,888 per QALY gained compared to standard diagnostic assessment alone. When compared with CSF, Aβ-PET costs EUR 24,084 per QALY gained | Aβ-PET was consistently cost-effective relative to the commonly used affordability threshold (EUR 40,000 per QALY). | |
| Zhou et al. [24] | 30 older adults, average age 82.2, 43.3% female | Instrument trail-making task (iTMT) using a wearable sensor to identify motor-cognitive impairment and diagnose AD | Good-to-excellent reliability was achieved for all iTMT tests. Between-group difference was more pronounced when using iTMT. Pairwise comparison suggested strong effect sizes | Simple, safe, and practical iTMT system with promising results to identify cognitive and dual-task ability impairment among older adults | True experiment |
| Ashton et al. [25] | 160 older adults | Saliva biomarkers, including tau, to diagnose AD | No median difference in salivary t-tau concentration was found between AD and mild cognitive impairment or healthy elderly control | Not a viable method to diagnose AD | Quasi-experimental |
| Babiloni et al. [26] | 83 older adults, average at 74.7, 82% male | Resting state electroencephalographic (rsEEG) rhythms to diagnose AD | ADMCI and DLBMCI patients showed different features of cortical neural synchronization at delta and alpha frequencies underpinning brain arousal and vigilance in quiet wakefulness | Viable testing method with low level of invasiveness | Quasi-experimental |
| Jones et al. [27] | 284 older adults, >50 | PET biomarkers in microtubule-associated protein tau (MAPT) to diagnose AD | Tau PET signal was qualitatively and quantitatively different between participants with AD, clinically normal (CN) participants, and MAPT mutation carriers, with the greatest signal intensity in those with AD and minimal regional signal in MAPT mutation carriers with mutations in exon 10 | Viable testing method with low level of invasiveness. Tau PET shows higher magnitude of binding in MAPT mutation carriers who harbor mutations that are more likely to produce AD-like tau pathology | Quasi-experimental |
| Lee et al. [28] | 1342 older adults | Machine learning (AI) of MRI scans to assess cortical atrophy and diagnose AD | aMCI-converts had higher atrophy similarity at both baselines. Similarly, AD patients with faster decline had higher atrophy similarity than slower decliners at baseline | The AD-specific atrophy similarity measure is a novel approach for the prediction of dementia risk and for the evaluation of AD trajectories on an individual subject level | Quasi-experimental |
| Lowe et al. [29] | 687 older adults > 50 | Tau-PET biomarkers to understand neurofibrillary tangle development to diagnose AD | Age-related elevated tau signal was seen among those with normal or abnormal amyloid status as compared to younger cognitively unimpaired individuals. Tau-PET signal increases modestly with age throughout the brain in cognitively unimpaired individuals, and elevated tau is seen more often when amyloid brain accumulation is present | Distinct patterns of neurofibrillary tangle deposition in younger-onset Alzheimer’s disease dementia versus older-onset Alzheimer’s disease dementia provide evidence for variability in regional tangle deposition patterns and demonstrate that different disease phenotypes have different patterns of tauopathy | Quasi-experimental |
| Fotuhi et al. [30] | 81 older adults | Using RNA as blood-based biomarker to diagnose AD | Significant differences between AD subgroups and control in the whole plasma samples | Plasma BACE1-AS level may serve as a potent blood-based biomarker for Alzheimer’s disease | Quasi-experimental |
| Pase et al. [31] | 1453 older adults > 65, average age 75, 54.5% female | Plasma total tau as a blood biomarker to diagnose AD | Higher plasma total tau level was associated with poorer cognition across 7 cognitive tasks and smaller hippocampi as well as neurofibrillary tangles and microinfarcts. Plasma t-tau shows early promise as a predictive biomarker for dementia | The findings suggest that plasma total tau levels may improve the prediction of future dementia, are associated with dementia endophenotypes, and may be used as a biomarker for risk stratification in dementia prevention trials | Observational |
| Tahmi et al. [32] | 52 older adults | PET biomarkers for quantifying amyloid-B plaques on the brain to diagnose AD | No control group. Consistently and significantly higher SUVRs in comparison to the conventional method in almost all regions of interest | Processing the amyloid-β PET data in subjects’ native space can improve the accuracy of the computed SUVRs | Observational |
| Cabinio et al. [33] | 139 older adults > 65 | Virtual reality to assess memory decline to diagnose AD | SASG outperformed the Montreal cognitive assessment test (MoCA) in the ability to detect neuronal degeneration in the hippocampus on the right side | SASG is an ecological task, which can be considered a digital biomarker providing objective and clinically meaningful data about the cognitive profile of aMCI subjects | Quasi-experimental |
| Rajan et al. [34] | 1327 older adults, 60% female, 60% African American | Blood biomarkers total tau (t-tau), neurofilament light (Nf-L), and glial fibrillary acidic protein (GFAP) to diagnose AD | Higher concentrations of serum biomarkers were associated with the development of clinical AD. Serum biomarkers were associated with faster cognitive decline over 16 years. Additionally, higher baseline t-tau was associated with faster increase in 3rd ventricular volume, and baseline Nf-L and GFAP were associated with faster decline in cortical thickness | Serum t-tau, Nf-L, and GFAP predict the development of sporadic AD and cognitive decline and changes in structural brain characteristics, suggesting their usefulness not only as screening and predictive biomarkers but also in capturing the pathogenesis of Alzheimer’s dementia. | Observational |
| Thientunyakit et al. [35] | 51 older adults | MRI and PET biomarkers used to assess amyloid levels, glucose metabolism, and morphologic change in brain to diagnose AD | A significant direct linear correlation was observed between the AV45/FDG/NVol index and ADAS-Cog test score and an inverse correlation with TMSE score at baseline and with the degree of changes in ADAS and TMSE scores assessed one year later (disease progression) | V45/FDG/NVol index mapping of the brain is a novel quantitative molecular imaging biomarker that correlates with clinical neurocognitive status and may facilitate more accurate diagnosis, staging, and prognosis of AD | Quasi-experimental |
| Altomare et al. [36] | 136 older adults | Using amyloid-PET and tau-PET biomarkers to diagnose AD | Amyloid-PET and tau-PET, when presented as the first exam, resulted in a change in etiological diagnosis in 28% and 28% of cases, and diagnostic confidence increased by 18% and 19%, respectively. When added as the second exam, amyloid-PET and tau-PET resulted in a further change in etiological diagnosis in 6% and 9% of cases, and diagnostic confidence increased by 4% and 5%, respectively | Amyloid-PET and tau-PET significantly impacted diagnosis and diagnostic confidence in a similar way, although a negative amyloid-PET has a stronger impact on diagnosis than a negative tau-PET. Adding either of the two as second exam further improved diagnostic confidence | True experiment |
| Desai et al. [37] | 1159 older adults, 63% female | Tau concentration biomarkers based on activity levels to treat AD | No control. Participants with high total tau concentrations with medium physical activity had a 58% slower rate of cognitive decline, and those with high physical activity had a 41% slower rate of cognitive decline. Among participants with low total tau concentrations, medium physical activity was associated with a 2% slower rate of cognitive decline, and high physical activity was associated with a 27% slower rate of cognitive decline, compared with little physical activity | Those with high physical activity had a slower rate of cognitive decline | Observational |
| Lin et al. [38] | 161 older adults | Arterial pulse spectrum and multilayer-perception analysis to diagnose classification of AD | Radial blood pressure waveform (BPW) indices differed significantly between the AD patients (6247 pulses) and control subjects (6626 pulses). Significant intergroup differences were found between mild, moderate, and severe AD | BPW can help classify extent of AD | Quasi-experimental |
| Liu et al. [39] | 1989 older adults | Serum miR-24-3P biomarkers to diagnose AD | Expression of miR-24-3p showed 1.6-fold increase in AD group compared with healthy controls, and a negative correlation of miR-24-3p with mini-mental state examination score was obtained | MiR-24-3p has a certain value in the diagnosis of AD and may be a potential biomarker | Quasi-experimental |
| Mila-Aloma et al. [40] | 318 older cognitively unimpaired adults, average age 60.5 | Using amyloid-B biomarker pathology to classify cognitively unimpaired individuals and diagnose AD | There are biologically meaningful Aβ-downstream effects in individuals with a low burden of Aβ pathology, while structural and functional changes are still subtle or absent | These findings support considering individuals with a low burden of Aβ pathology for clinical trials | Observational |
| Sajjad et al. [41] | 136 older adults | Using PET biomarkers and synthetic data augmentation (DCGAN model) to diagnose AD | With a 72% accuracy, the computer was able to identify normal, MCI, and AD images | AI can help diagnose AD from PET scans | True experiment |
| Wu et al. [42] | 159 older adults, average age 68.5, 58% female | Plasma biomarker (p-tau and t-tau) to diagnose AD | p-tau181 had the greatest potential for identifying patients with cognitive impairment | Simplified diagnostic model provides an accessible and practical way for large-scale screening in the clinic and community, especially in developing countries | Quasi-experimental |
| Chun et al. [43] | 25 older adults | 18F-THK5351 PET biomarkers to diagnose AD | The patients in the 18F-THK5351-positive group were older than those in the 18F-THK5351-negative group | The results of the present study suggest that increased 18F-THK5351 uptake might be a useful predictor of poor prognosis among Aβ–aMCI patients, which might be associated with increased neuroinflammation | Observational |
| Kim et al. [44] | 18 older adults | Telemonitoring to diagnose AD | It was effective in predicting dementia risk, with up to an 0.99 area under the curve (AUC) using DNN with principal component analysis (PCA) and a quantile transformer scaler | Can be used for a variety of long-term monitoring and early symptom detection systems, helping caregivers provide optimal interventions to elderly individuals at risk for dementia | Quasi-experimental |
| Authors | Intervention Theme | Effectiveness Themes | Barrier Themes | Strength of Evidence | Quality of Evidence |
|---|---|---|---|---|---|
| Guo et al. [17] | Blood biomarkers | Accurate at detecting AD | Taking blood is invasive | II | A |
| Cost of intervention | |||||
| Must train users | |||||
| Requires physical presence of patient | |||||
| Expense of travel involved | |||||
| Kirbas et al. [18] | Spectral domain optical coherence tomography | Accurate at detecting AD | Cost of intervention | II | A |
| Must train users | |||||
| Requires physical presence of patient | |||||
| Expense of travel involved | |||||
| Wang et al. [19] | AI/machine learning | Accurate at detecting AD | Cost of intervention | II | A |
| Must train users | |||||
| Munro et al. [20] | Telehealth/VTC/VR | Non-invasive | Cost of intervention | I | A |
| Accurate at detecting AD | Must train users | ||||
| Inexpensive | |||||
| Zou et al. [21] | MRI biomarkers | Non-invasive | Cost of intervention | II | A |
| Accurate at detecting AD | Must train users | ||||
| Requires physical presence of patient | |||||
| Expense of travel involved | |||||
| Collij et al. [22] | AI/machine learning | Accurate at detecting AD | Taking blood is invasive | II | A |
| Cost of intervention | |||||
| Must train users | |||||
| Hornberger et al. [23] | PET biomarkers | Accurate at detecting AD | Cost of intervention | II | A |
| Requires physical presence of patient | |||||
| Expense of travel involved | |||||
| Must train users | |||||
| Zhou et al. [24] | Telehealth/VTC/VR | Accurate at detecting AD | Must train users | I | A |
| Inexpensive | |||||
| Ashton et al. [25] | biomarkers | Non-invasive | Not reported | II | A |
| Non-stressful | |||||
| Babiloni et al. [26] | EEG | Inexpensive | Must train users | II | A |
| Non-invasive | |||||
| Non-stressful | |||||
| Repeatable without degradation of results | |||||
| Accurate at detecting AD | |||||
| Jones et al. [27] | PET biomarkers | Non-invasive | Cost of intervention | II | A |
| Non-stressful | Must train users | ||||
| Requires physical presence of patient | |||||
| Expense of travel involved | |||||
| Lee et al. [28] | AI/machine learning | Inexpensive | Cost of intervention | II | A |
| Accurate at detecting AD | Must train users | ||||
| Non-invasive | Requires physical presence of patient | ||||
| Non-stressful | Expense of travel involved | ||||
| Lowe et al. [29] | PET biomarkers | Ineffective | Need a procedure for the living | II | A |
| Fotuhi et al. [30] | RNA | Inexpensive | Taking blood is invasive | II | A |
| Cost of intervention | |||||
| Must train users | |||||
| Requires physical presence of patient | |||||
| Expense of travel involved | |||||
| Pase et al. [31] | Blood biomarkers | Convenient | Taking blood is invasive | III | A |
| Inexpensive | Cost of intervention | ||||
| Must train users | |||||
| Requires physical presence of patient | |||||
| Expense of travel involved | |||||
| Tahmi et al. [32] | PET biomarkers | Accurate at detecting AD | Cost of intervention | III | A |
| Must train users | |||||
| Requires physical presence of patient | |||||
| Expense of travel involved | |||||
| Cabinio et al. [33] | Telehealth/VTC/VR | Non-invasive | Cost of intervention | II | A |
| Non-stressful | Must train users | ||||
| Rajan et al. [34] | Blood biomarkers | Accurate at detecting AD | Taking blood is invasive | III | A |
| Cost of intervention | |||||
| Must train users | |||||
| Requires physical presence of patient | |||||
| Expense of travel involved | |||||
| Thientunyakit et al. [35] | MRI and PET biomarkers | Non-invasive | Cost of intervention | II | A |
| Non-stressful | Requires physical presence of patient | ||||
| Accurate at detecting AD | Expense of travel involved | ||||
| Altomare et al. [36] | PET biomarkers | Accurate at detecting AD | Cost of intervention | I | A |
| Non-invasive | Requires physical presence of patient | ||||
| Non-stressful | Expense of travel involved | ||||
| Desai et al. [37] | PET biomarkers | Accurate at detecting AD | Taking blood is invasive | III | A |
| Must train users | |||||
| Cost of intervention | |||||
| Requires physical presence of patient | |||||
| Expense of travel involved | |||||
| Lin et al. [38] | Arterial pulse | Non-invasive | Must train users | II | A |
| Rapid | |||||
| Inexpensive | |||||
| Accurate at detecting AD | |||||
| Liu et al. [39] | Blood biomarkers | Accurate at detecting AD | Taking blood is invasive | II | A |
| Must train users | |||||
| Cost of intervention | |||||
| Requires physical presence of patient | |||||
| Expense of travel involved | |||||
| Mila-Aloma et al. [40] | PET biomarkers | Accurate at detecting AD | Taking blood is invasive | III | A |
| Must train users | |||||
| Cost of intervention | |||||
| Requires physical presence of patient | |||||
| Expense of travel involved | |||||
| Sajjad et al. [41] | PET biomarkers | Non-invasive | Cost of intervention | I | A |
| Non-stressful | Requires physical presence of patient | ||||
| Repeatable without degradation of results | Expense of travel involved | ||||
| Wu et al. [42] | Blood biomarkers | Accurate at detecting AD | Taking blood is invasive | II | A |
| Must train users | |||||
| Cost of intervention | |||||
| Requires physical presence of patient | |||||
| Expense of travel involved | |||||
| Chun et al. [43] | PET biomarkers | Accurate at detecting AD | Cost of intervention | III | B |
| Requires physical presence of patient | |||||
| Expense of travel involved | |||||
| Kim et al. [44] | Telehealth/VTC/VR | Accurate at detecting AD | Cost of intervention | II | B |
| Inexpensive |
| Intervention Themes and Observations | Frequency |
|---|---|
| PET biomarkers [23,27,29,32,36,37,40,41,43] | 9 |
| Blood biomarkers [17,25,31,34,39,42] | 6 |
| Telehealth/VTC/VR [20,24,33,44] | 4 |
| AI/machine learning [19,22,28] | 3 |
| MRI biomarkers [21] | 1 |
| MRI and PET biomarkers [35] | 1 |
| Arterial pulse [38] | 1 |
| RNA [30] | 1 |
| EEG [26] | 1 |
| Spectral domain optical coherence tomography [18] | 1 |
| 28 |
| Effectiveness Themes and Observations | Frequency |
|---|---|
| Accurate at detecting AD [17,18,19,20,21,22,23,24,26,28,32,34,35,36,37,38,39,40,42,43,44] | 21 |
| Non-invasive [20,21,25,26,27,28,33,35,36,38,41] | 11 |
| Non-stressful [25,26,27,28,33,35,36,41] | 8 |
| Inexpensive [20,24,26,28,30,31,38,44] | 8 |
| Repeatable without degradation of results [26,41] | 2 |
| Convenient [31] | 1 |
| Rapid [38] | 1 |
| Ineffective [29] | 1 |
| 53 |
| Barrier Themes and Observations | Frequency |
|---|---|
| Cost of intervention [17,18,19,20,21,22,23,27,28,30,31,32,33,34,35,36,37,39,40,42,43,44] | 23 |
| Must train users [17,18,19,20,21,22,23,24,26,27,28,30,31,32,33,34,37,38,39,40,42] | 21 |
| Requires physical presence of patient [17,18,21,23,27,28,30,31,32,34,35,36,37,39,40,41,42,43] | 18 |
| Expense of travel involved [17,18,21,23,27,28,30,31,32,34,35,36,37,39,40,41,42,43] | 18 |
| Taking blood is invasive [17,22,30,31,34,37,39,40,42] | 9 |
| Not reported [25] | 1 |
| Need a procedure for the living [29] | 1 |
| 91 |
Disclaimer/Publisher’s Note: The statements, opinions and data contained in all publications are solely those of the individual author(s) and contributor(s) and not of MDPI and/or the editor(s). MDPI and/or the editor(s) disclaim responsibility for any injury to people or property resulting from any ideas, methods, instructions or products referred to in the content. |
© 2023 by the authors. Licensee MDPI, Basel, Switzerland. This article is an open access article distributed under the terms and conditions of the Creative Commons Attribution (CC BY) license (https://creativecommons.org/licenses/by/4.0/).
Share and Cite
Kruse, C.S.; Mileski, M.E.; Wilkinson, R.; Hock, B.; Samson, R.; Castillo, T. Leveraging Technology to Diagnose Alzheimer’s Disease: A Systematic Review and Meta-Analysis. Healthcare 2023, 11, 3013. https://doi.org/10.3390/healthcare11233013
Kruse CS, Mileski ME, Wilkinson R, Hock B, Samson R, Castillo T. Leveraging Technology to Diagnose Alzheimer’s Disease: A Systematic Review and Meta-Analysis. Healthcare. 2023; 11(23):3013. https://doi.org/10.3390/healthcare11233013
Chicago/Turabian StyleKruse, Clemens Scott, Michael E. Mileski, Reagan Wilkinson, Britney Hock, Roger Samson, and Taylor Castillo. 2023. "Leveraging Technology to Diagnose Alzheimer’s Disease: A Systematic Review and Meta-Analysis" Healthcare 11, no. 23: 3013. https://doi.org/10.3390/healthcare11233013
APA StyleKruse, C. S., Mileski, M. E., Wilkinson, R., Hock, B., Samson, R., & Castillo, T. (2023). Leveraging Technology to Diagnose Alzheimer’s Disease: A Systematic Review and Meta-Analysis. Healthcare, 11(23), 3013. https://doi.org/10.3390/healthcare11233013