
Association between Chronic Kidney Disease and Dynapenia in Elderly Koreans


Abstract
:1. Introduction
2. Materials and Methods
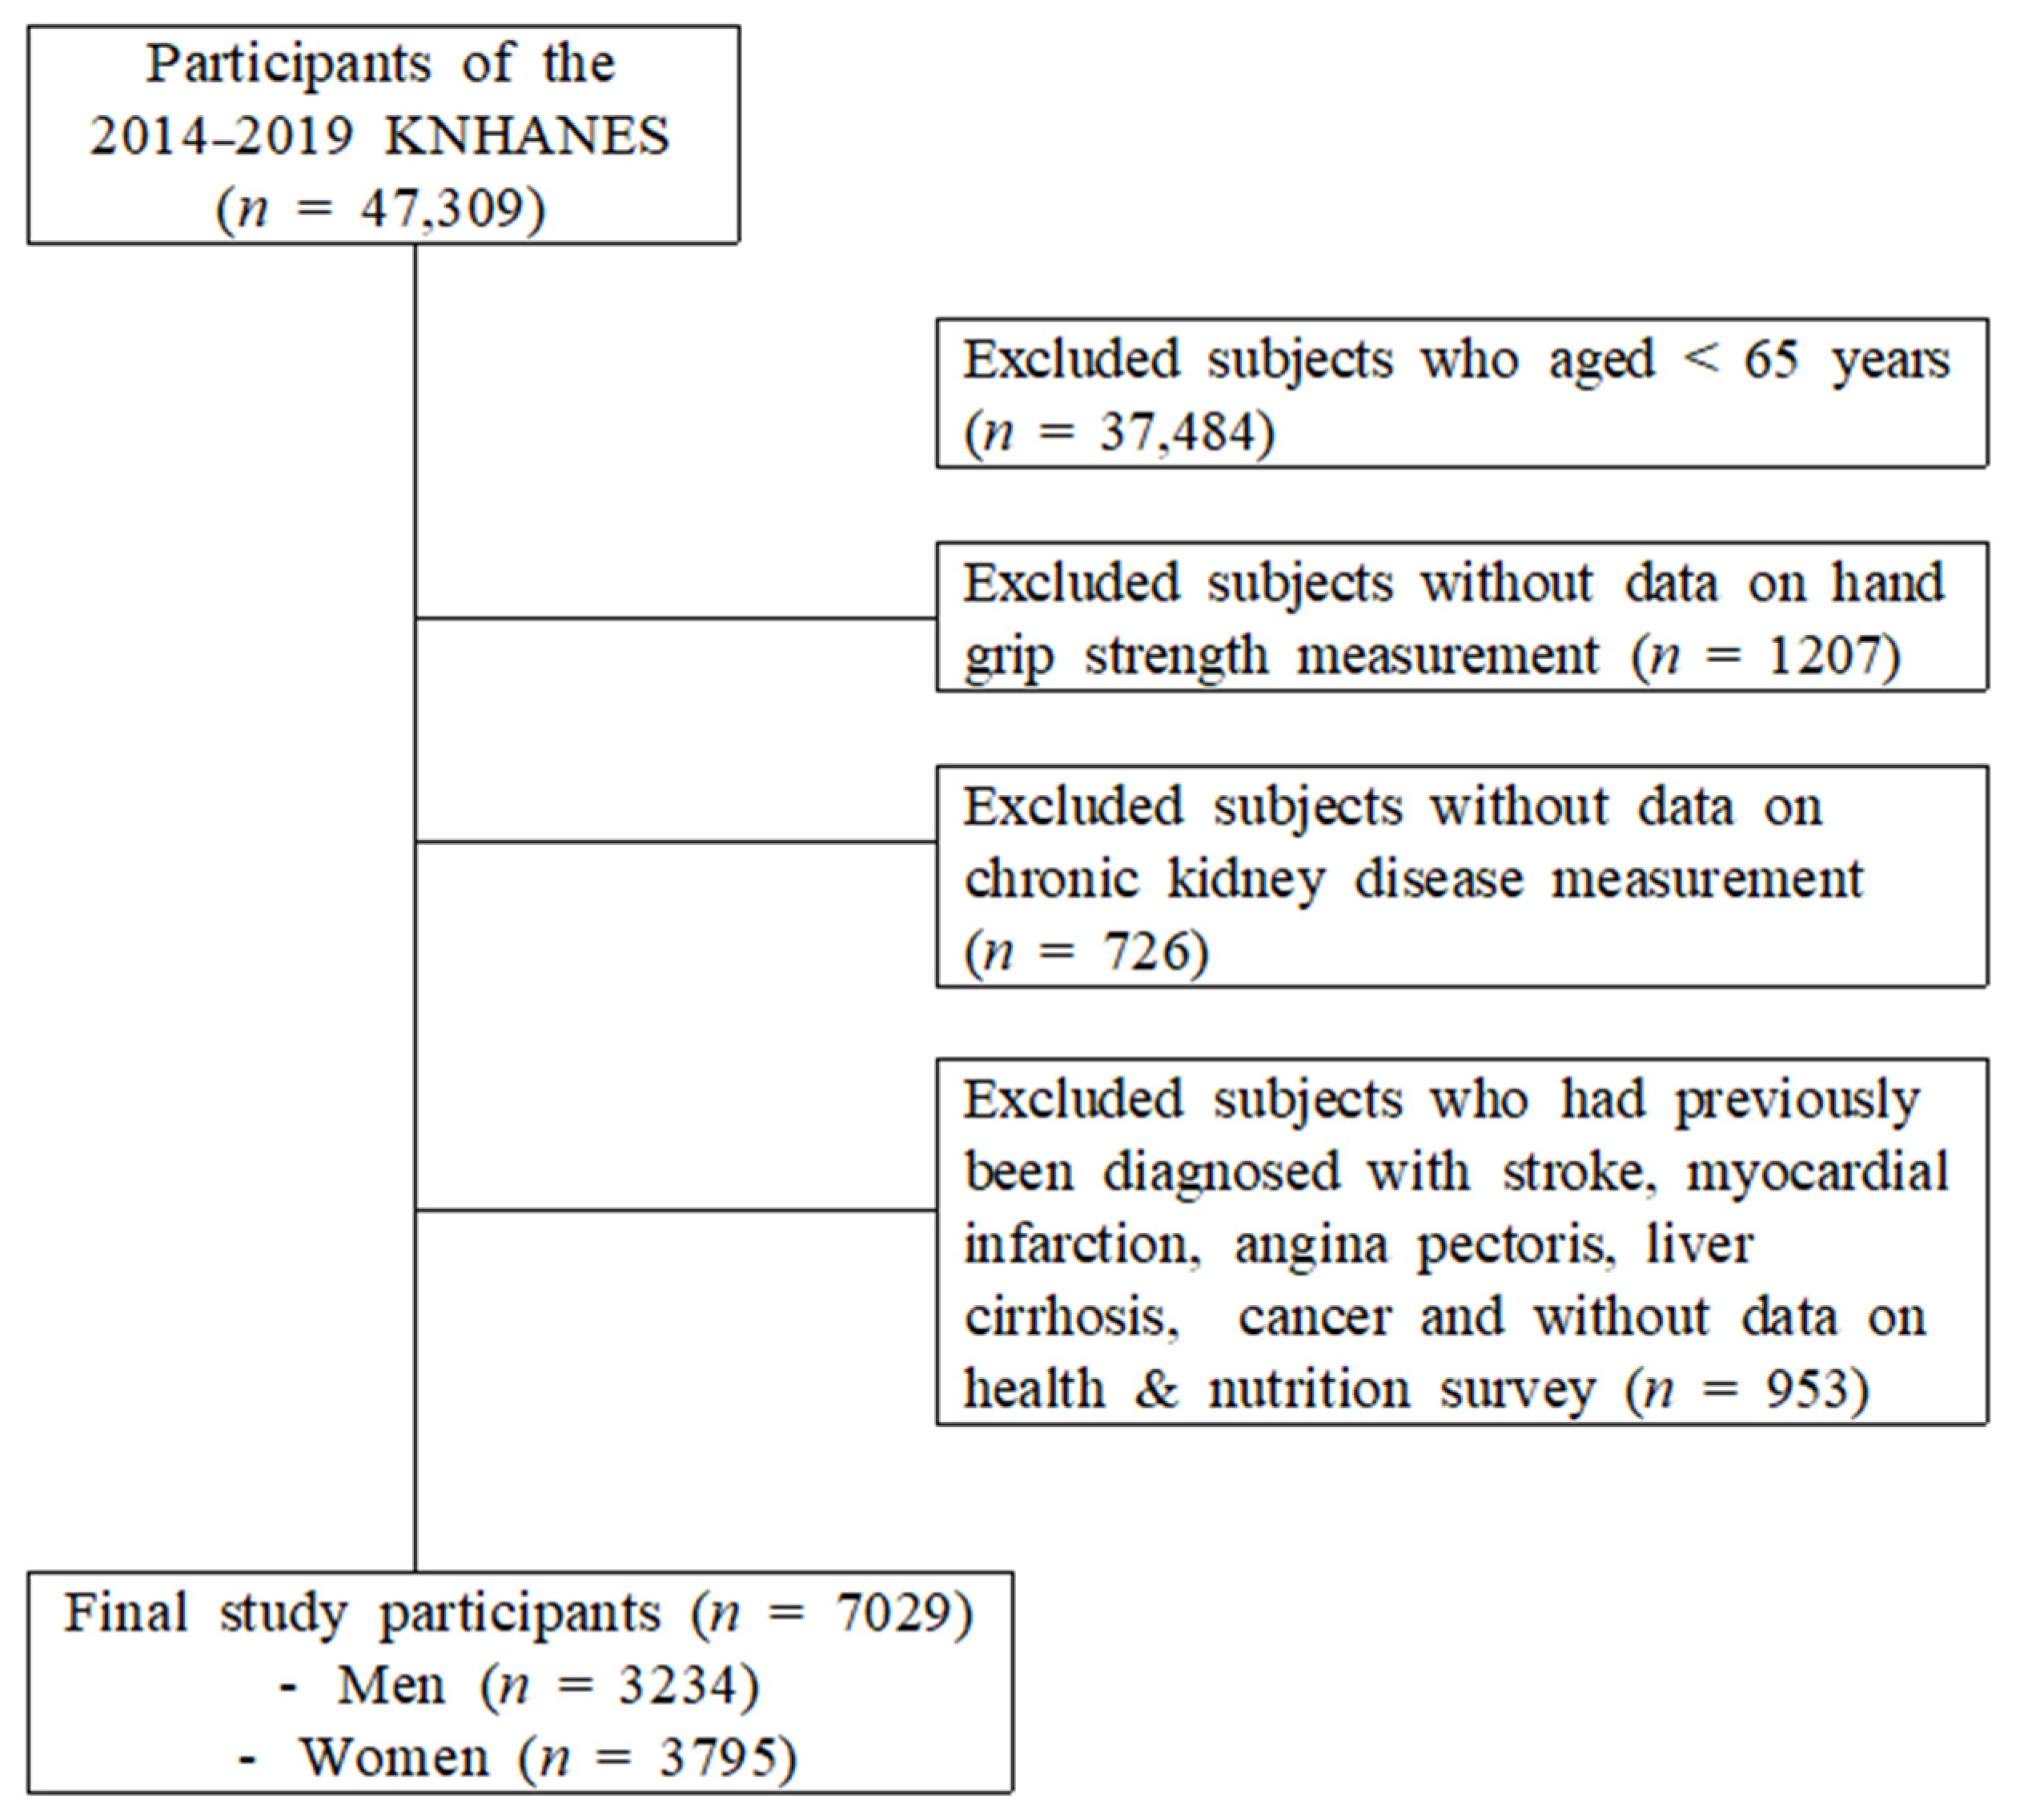
2.1. Data Source and Sampling
2.2. Measurements of Variables
2.2.1. Covariates
2.2.2. CKD Definitions
2.2.3. Dynapenia Definitions
2.3. Data Analysis
3. Results
4. Discussion
5. Conclusions
Author Contributions
Funding
Institutional Review Board Statement
Informed Consent Statement
Data Availability Statement
Conflicts of Interest
References
- Kalantar-Zadeh, K.; Jafar, T.H.; Nitsch, D.; Neuen, B.L.; Perkovic, V. Chronic kidney disease. Lancet 2021, 398, 786–802. [Google Scholar] [CrossRef] [PubMed]
- Levey, A.S.; Coresh, J. Chronic kidney disease. Lancet 2012, 379, 165–180. [Google Scholar] [CrossRef]
- Daenen, K.; Andries, A.; Mekahli, D.; Van Schepdael, A.; Jouret, F.; Bammens, B. Oxidative stress in chronic kidney disease. Pediatr. Nephrol. 2019, 34, 975–991. [Google Scholar] [CrossRef]
- Hall, M.E.; do Carmo, J.M.; da Silva, A.A.; Juncos, L.A.; Wang, Z.; Hall, J.E. Obesity, hypertension, and chronic kidney disease. Int. J. Nephrol. Renov. Dis. 2014, 7, 75–88. [Google Scholar] [CrossRef] [PubMed]
- Schardong, J.; Marcolino, M.A.Z.; Plentz, R.D.M. Muscle Atrophy in Chronic Kidney Disease. Adv. Exp. Med. Biol. 2018, 1088, 393–412. [Google Scholar] [CrossRef]
- Souza, V.A.; Oliveira, D.; Mansur, H.N.; Fernandes, N.M.; Bastos, M.G. Sarcopenia in chronic kidney disease. J. Bras. Nefrol. 2015, 37, 98–105. [Google Scholar] [CrossRef] [PubMed]
- Kim, J.K.; Kim, S.G.; Oh, J.E.; Lee, Y.K.; Noh, J.W.; Kim, H.J.; Song, Y.R. Impact of sarcopenia on long-term mortality and cardiovascular events in patients undergoing hemodialysis. Korean J. Intern. Med. 2019, 34, 599–607. [Google Scholar] [CrossRef] [PubMed]
- Souza, V.A.; Oliveira, D.; Barbosa, S.R.; Corrêa, J.; Colugnati, F.A.B.; Mansur, H.N.; Fernandes, N.; Bastos, M.G. Sarcopenia in patients with chronic kidney disease not yet on dialysis: Analysis of the prevalence and associated factors. PLoS ONE 2017, 12, e0176230. [Google Scholar] [CrossRef] [PubMed]
- Chang, Y.T.; Wu, H.L.; Guo, H.R.; Cheng, Y.Y.; Tseng, C.C.; Wang, M.C.; Lin, C.Y.; Sung, J.M. Handgrip strength is an independent predictor of renal outcomes in patients with chronic kidney diseases. Nephrol. Dial. Transplant. Off. Publ. Eur. Dial. Transpl. Assoc.-Eur. Ren. Assoc. 2011, 26, 3588–3595. [Google Scholar] [CrossRef]
- Ida, S.; Kaneko, R.; Imataka, K.; Murata, K. Association between Sarcopenia and Renal Function in Patients with Diabetes: A Systematic Review and Meta-Analysis. J. Diabetes Res. 2019, 2019, 1365189. [Google Scholar] [CrossRef]
- Isoyama, N.; Qureshi, A.R.; Avesani, C.M.; Lindholm, B.; Bàràny, P.; Heimbürger, O.; Cederholm, T.; Stenvinkel, P.; Carrero, J.J. Comparative associations of muscle mass and muscle strength with mortality in dialysis patients. Clin. J. Am. Soc. Nephrol. CJASN 2014, 9, 1720–1728. [Google Scholar] [CrossRef] [PubMed]
- Domański, M.; Ciechanowski, K. Sarcopenia: A major challenge in elderly patients with end-stage renal disease. J. Aging Res. 2012, 2012, 754739. [Google Scholar] [CrossRef]
- Clark, B.C.; Manini, T.M. Sarcopenia =/= dynapenia. J. Gerontol. Ser. A Biol. Sci. Med. Sci. 2008, 63, 829–834. [Google Scholar] [CrossRef] [PubMed]
- Clark, B.C.; Manini, T.M. What is dynapenia? Nutrition 2012, 28, 495–503. [Google Scholar] [CrossRef]
- Guida, B.; Maro, M.D.; Lauro, M.D.; Lauro, T.D.; Trio, R.; Santillo, M.; Belfiore, A.; Memoli, A.; Cataldi, M. Identification of sarcopenia and dynapenia in CKD predialysis patients with EGWSOP2 criteria: An observational, cross-sectional study. Nutrition 2020, 78, 110815. [Google Scholar] [CrossRef] [PubMed]
- Cruz-Jentoft, A.J.; Bahat, G.; Bauer, J.; Boirie, Y.; Bruyère, O.; Cederholm, T.; Cooper, C.; Landi, F.; Rolland, Y.; Sayer, A.A. Writing Group for the European Working Group on Sarcopenia in Older People 2 (EWGSOP2), and the Extended Group for EWGSOP2. Sarcopenia: Revised European consensus on definition and diagnosis. Age Ageing 2019, 48, 16–31. [Google Scholar] [CrossRef]
- Mitchell, W.K.; Williams, J.; Atherton, P.; Larvin, M.; Lund, J.; Narici, M. Sarcopenia, dynapenia, and the impact of advancing age on human skeletal muscle size and strength; a quantitative review. Front. Physiol. 2012, 3, 260. [Google Scholar] [CrossRef]
- Foley, R.N.; Wang, C.; Ishani, A.; Collins, A.J.; Murray, A.M. Kidney function and sarcopenia in the United States general population: NHANES III. Am. J. Nephrol. 2007, 27, 279–286. [Google Scholar] [CrossRef]
- Moorthi, R.N.; Avin, K.G. Clinical relevance of sarcopenia in chronic kidney disease. Curr. Opin. Nephrol. Hypertens. 2017, 26, 219–228. [Google Scholar] [CrossRef]
- Sharma, D.; Hawkins, M.; Abramowitz, M.K. Association of sarcopenia with eGFR and misclassification of obesity in adults with CKD in the United States. Clin. J. Am. Soc. Nephrol. CJASN 2014, 9, 2079–2088. [Google Scholar] [CrossRef]
- Lee, D.-Y. The association between sarcopenia and pulmonary function in Koreans: A cross-sectional study. Int. J. Gerontol. 2021, 15, 319–323. [Google Scholar]
- Oh, J.Y.; Yang, Y.J.; Kim, B.S.; Kang, J.H. Validity and reliability of Korean version of International Physical Activity Questionnaire (IPAQ) short form. J. Korean Acad. Fam. Med. 2007, 28, 532–541. [Google Scholar]
- Eguiguren-Jiménez, L.; Miles, J.; Ocampo, J.; Andrade, J.M. Prevalence and associated risk factors of chronic kidney disease: A case study within SIME clinics in Quito, Ecuador 2019–2021. Front. Med. 2022, 9, 908551. [Google Scholar] [CrossRef] [PubMed]
- Chen, L.K.; Liu, L.K.; Woo, J.; Assantachai, P.; Auyeung, T.W.; Bahyah, K.S.; Chou, M.Y.; Chen, L.Y.; Hsu, P.S.; Krairit, O.; et al. Sarcopenia in Asia: Consensus report of the Asian Working Group for Sarcopenia. J. Am. Med. Dir. Assoc. 2014, 15, 95–101. [Google Scholar] [CrossRef] [PubMed]
- Chen, L.K.; Woo, J.; Assantachai, P.; Auyeung, T.W.; Chou, M.Y.; Iijima, K.; Jang, H.C.; Kang, L.; Kim, M.; Kim, S.; et al. Asian Working Group for Sarcopenia: 2019 Consensus Update on Sarcopenia Diagnosis and Treatment. J. Am. Med. Dir. Assoc. 2020, 21, 300–307.e302. [Google Scholar] [CrossRef] [PubMed]
- Abbatecola, A.M.; Ferrucci, L.; Ceda, G.; Russo, C.R.; Lauretani, F.; Bandinelli, S.; Barbieri, M.; Valenti, G.; Paolisso, G. Insulin resistance and muscle strength in older persons. J. Gerontol. Ser. A Biol. Sci. Med. Sci. 2005, 60, 1278–1282. [Google Scholar] [CrossRef]
- Barzilay, J.I.; Cotsonis, G.A.; Walston, J.; Schwartz, A.V.; Satterfield, S.; Miljkovic, I.; Harris, T.B. Insulin resistance is associated with decreased quadriceps muscle strength in nondiabetic adults aged > or =70 years. Diabetes Care 2009, 32, 736–738. [Google Scholar] [CrossRef]
- Guillet, C.; Boirie, Y. Insulin resistance: A contributing factor to age-related muscle mass loss? Diabetes Metab. 2005, 31, 5S20–25S26. [Google Scholar] [CrossRef]
- Garibotto, G.; Sofia, A.; Russo, R.; Paoletti, E.; Bonanni, A.; Parodi, E.L.; Viazzi, F.; Verzola, D. Insulin sensitivity of muscle protein metabolism is altered in patients with chronic kidney disease and metabolic acidosis. Kidney Int. 2015, 88, 1419–1426. [Google Scholar] [CrossRef]
- Guttridge, D.C.; Mayo, M.W.; Madrid, L.V.; Wang, C.Y.; Baldwin, A.S., Jr. NF-kappaB-induced loss of MyoD messenger RNA: Possible role in muscle decay and cachexia. Science 2000, 289, 2363–2366. [Google Scholar] [CrossRef]
- Su, H.; Lei, C.T.; Zhang, C. Interleukin-6 Signaling Pathway and Its Role in Kidney Disease: An Update. Front. Immunol. 2017, 8, 405. [Google Scholar] [CrossRef] [PubMed]
- Wang, X.H.; Mitch, W.E.; Price, S.R. Pathophysiological mechanisms leading to muscle loss in chronic kidney disease. Nat. Rev. Nephrol. 2022, 18, 138–152. [Google Scholar] [CrossRef] [PubMed]
- Song, Y.H.; Li, Y.; Du, J.; Mitch, W.E.; Rosenthal, N.; Delafontaine, P. Muscle-specific expression of IGF-1 blocks angiotensin II-induced skeletal muscle wasting. J. Clin. Investig. 2005, 115, 451–458. [Google Scholar] [CrossRef] [PubMed]
- Verzola, D.; Procopio, V.; Sofia, A.; Villaggio, B.; Tarroni, A.; Bonanni, A.; Mannucci, I.; De Cian, F.; Gianetta, E.; Saffioti, S.; et al. Apoptosis and myostatin mRNA are upregulated in the skeletal muscle of patients with chronic kidney disease. Kidney Int. 2011, 79, 773–782. [Google Scholar] [CrossRef]
- Brink, M.; Wellen, J.; Delafontaine, P. Angiotensin II causes weight loss and decreases circulating insulin-like growth factor I in rats through a pressor-independent mechanism. J. Clin. Investig. 1996, 97, 2509–2516. [Google Scholar] [CrossRef]
- Cohn, R.D.; van Erp, C.; Habashi, J.P.; Soleimani, A.A.; Klein, E.C.; Lisi, M.T.; Gamradt, M.; ap Rhys, C.M.; Holm, T.M.; Loeys, B.L.; et al. Angiotensin II type 1 receptor blockade attenuates TGF-beta-induced failure of muscle regeneration in multiple myopathic states. Nat. Med. 2007, 13, 204–210. [Google Scholar] [CrossRef]
- Souza, M.K.; Neves, R.V.P.; Rosa, T.S.; Cenedeze, M.A.; Arias, S.C.A.; Fujihara, C.K.; Bacurau, R.F.P.; Câmara, N.O.S.; Moraes, M.R.; Pacheco, E.S.F.A. Resistance training attenuates inflammation and the progression of renal fibrosis in chronic renal disease. Life Sci. 2018, 206, 93–97. [Google Scholar] [CrossRef]
- Wang, X.H.; Du, J.; Klein, J.D.; Bailey, J.L.; Mitch, W.E. Exercise ameliorates chronic kidney disease-induced defects in muscle protein metabolism and progenitor cell function. Kidney Int. 2009, 76, 751–759. [Google Scholar] [CrossRef]
- Yu, M.D.; Zhang, H.Z.; Zhang, Y.; Yang, S.P.; Lin, M.; Zhang, Y.M.; Wu, J.B.; Hong, F.Y.; Chen, W.X. Relationship between chronic kidney disease and sarcopenia. Sci. Rep. 2021, 11, 20523. [Google Scholar] [CrossRef]
- Choi, Y.; Cho, J.; Kim, J.; Bae, J.H.; Cho, E.J.; Chang, E.; Joa, K.L.; Kim, J.; Park, D.H.; Kang, J.H.; et al. Dynapenic-abdominal obesity as an independent risk factor for chronic kidney disease in postmenopausal women: A population-based cohort study. Menopause 2022, 29, 1040–1046. [Google Scholar] [CrossRef]
- Zhou, Y.; Hellberg, M.; Svensson, P.; Höglund, P.; Clyne, N. Sarcopenia and relationships between muscle mass, measured glomerular filtration rate and physical function in patients with chronic kidney disease stages 3–5. Nephrol. Dial. Transplant. Off. Publ. Eur. Dial. Transpl. Assoc.-Eur. Ren. Assoc. 2018, 33, 342–348. [Google Scholar] [CrossRef] [PubMed]

| Men | Women | |||||||
|---|---|---|---|---|---|---|---|---|
| Normal (n = 1108) | Stage 2 (n = 1807) | Stage 3–5 (n = 319) | p | Normal (n = 1736) | Stage 2 (n = 1772) | Stage 3–5 (n = 287) | p | |
| Age(y) | 70.03 ± 0.15 | 72.82 ± 0.14 | 74.44 ± 0.34 | <0.001 | 70.57 ± 0.12 | 74.29 ± 0.14 | 75.89 ± 0.32 | <0.001 |
| Height (cm) | 165.67 ± 0.19 | 165.80 ± 0.16 | 165.67 ± 0.33 | 1.000 | 152.39 ± 0.17 | 151.77 ± 0.17 | 151.25 ± 0.37 | 0.010 |
| Weight (kg) | 64.47 ± 0.31 | 65.87 ± 0.25 | 66.74 ± 0.55 | 0.001 | 56.24 ± 0.24 | 56.75 ± 0.23 | 57.37 ± 0.57 | 0.114 |
| BMI (kg/m2) | 23.46 ± 0.11 | 23.93 ± 0.076 | 24.28 ± 0.17 | 0.006 | 24.19 ± 0.09 | 24.61 ± 0.086 | 25.05 ± 0.23 | 0.006 |
| <18.5 (underweight), n (%) | 4.0 | 2.7 | 1.7 | 2.0 | 2.0 | 0.5 | ||
| <25 (normal weight), n (%) | 67.2 | 62.7 | 61.0 | 60.5 | 55.5 | 52.0 | ||
| ≥25 (overweight), n (%) | 28.7 | 34.7 | 37.3 | 47.5 | 42.5 | 37.5 | ||
| Smoking status, (%) (current/ex-/non-smoker) | 22.2/56.9/20.9 | 16.7/62.6/20.8 | 19.3/60.6/20.1 | 0.029 | 2.3/2.7/95.0 | 2.6/3.2/94.1 | 2.1/5.2/92.7 | 0.280 |
| Drinking status (%) (current/non-drinking) | 73.6/26.4 | 69.7/30.3 | 55.3/44.7 | <0.001 | 44.4/55.6 | 34.9/65.1 | 28.3/71.7 | <0.001 |
| Marital status (%) (living with spouse) | 90.3 | 88.3 | 84.8 | 0.051 | 57.0 | 44.0 | 38.7 | <0.001 |
| Individual income | 0.130 | 0.898 | ||||||
| Q1 (lowest) | 24.8 | 22.7 | 25.7 | 24.7 | 24.2 | 24.0 | ||
| Q2 | 26.2 | 22.3 | 24.7 | 24.2 | 24.8 | 28.7 | ||
| Q3 | 24.8 | 26.5 | 22.4 | 24.5 | 23.7 | 20.6 | ||
| Q4 (highest) | 24.2 | 28.6 | 27.3 | 26.6 | 27.4 | 26.7 | ||
| SBP (mmHg) | 125.53 ± 0.57 | 127.31 ± 0.46 | 128.37 ± 1.18 | 0.022 | 129.62 ± 0.48 | 131.45 ± 0.51 | 130.28 ± 1.26 | 0.01 |
| DBP (mmHg) | 73.08 ± 0.33 | 72.64 ± 0.28 | 68.55 ± 0.76 | <0.001 | 73.81 ± 0.27 | 72.56 ± 0.27 | 69.30 ± 0.86 | <0.001 |
| WC (cm) | 85.85 ± 0.30 | 87.67 ± 0.24 | 89.63 ± 0.53 | <0.001 | 83.64 ± 0.26 | 85.09 ± 0.24 | 87.08 ± 0.66 | <0.001 |
| Fasting glucose (mg/dL) | 108.95 ± 1.04 | 109.19±0.69 | 113.47 ± 2.07 | 0.111 | 105.43 ± 0.68 | 106.73 ± 0.66 | 113.31 ± 1.87 | <0.001 |
| Total cholesterol | 178.73 ± 1.20 | 180.18 ± 1.10 | 170.6 ± 0.33 | 0.004 | 191.96 ± 1.08 | 190.50 ± 1.11 | 175.58 ± 2.45 | <0.001 |
| HDL-cholesterol | 47.73 ± 0.36 | 46.3 ± 0.31 | 41.66 ± 0.63 | <0.001 | 50.82 ± 0.33 | 49.56 ± 0.33 | 45.5 ± 0.70 | <0.001 |
| Triglyceride | 131.07 ± 3.06 | 138.27 ± 2.51 | 152.67 ± 7.08 | 0.010 | 127.82 ± 2.17 | 135.13 ± 2.33 | 151.02 ± 7.97 | 0.010 |
| Aerobic exercise (TWT) | 66.82 ± 3.13 | 63.58 ± 2.42 | 63.21 ± 5.19 | 0.816 | 68.81 ± 2.45 | 56.98 ± 2.45 | 48.26 ± 4.77 | <0.001 |
| Resistance exercise | 0.009 | 0.393 | ||||||
| Never | 67.8 | 67.0 | 75.0 | 89.1 | 88.9 | 93.6 | ||
| 1–3 days/wk | 12.9 | 9.8 | 8.5 | 4.9 | 5.0 | 2.6 | ||
| ≥4 days/wk | 19.4 | 23.3 | 16.6 | 6.0 | 6.1 | 3.8 | ||
| HbA1c | 5.99 ± 0.03 | 6.03 ± 0.02 | 6.28 ± 0.06 | <0.001 | 6.01 ± 0.03 | 6.07 ± 0.02 | 6.44 ± 0.07 | <0.001 |
| BUN (mg/dL) | 15.84 ± 0.14 | 17.54 ± 0.12 | 23.63 ± 0.53 | <0.001 | 15.58 ± 0.12 | 17.11 ± 0.13 | 23.66 ± 0.62 | <0.001 |
| Creatine (mg/dL) | 0.81 ± 0.00 | 1.03 ± 0.003 | 1.52 ± 0.02 | <0.001 | 0.63 ± 0.00 | 0.80 ± 0.00 | 1.26 ± 0.04 | <0.001 |
| eGFR (mL/min/1.73 m2) | 94.89 ± 0.12 | 77.69 ± 0.22 | 49.84 ± 0.56 | <0.001 | 95.17 ± 0.09 | 78.30 ± 0.23 | 48.67 ± 0.72 | <0.001 |
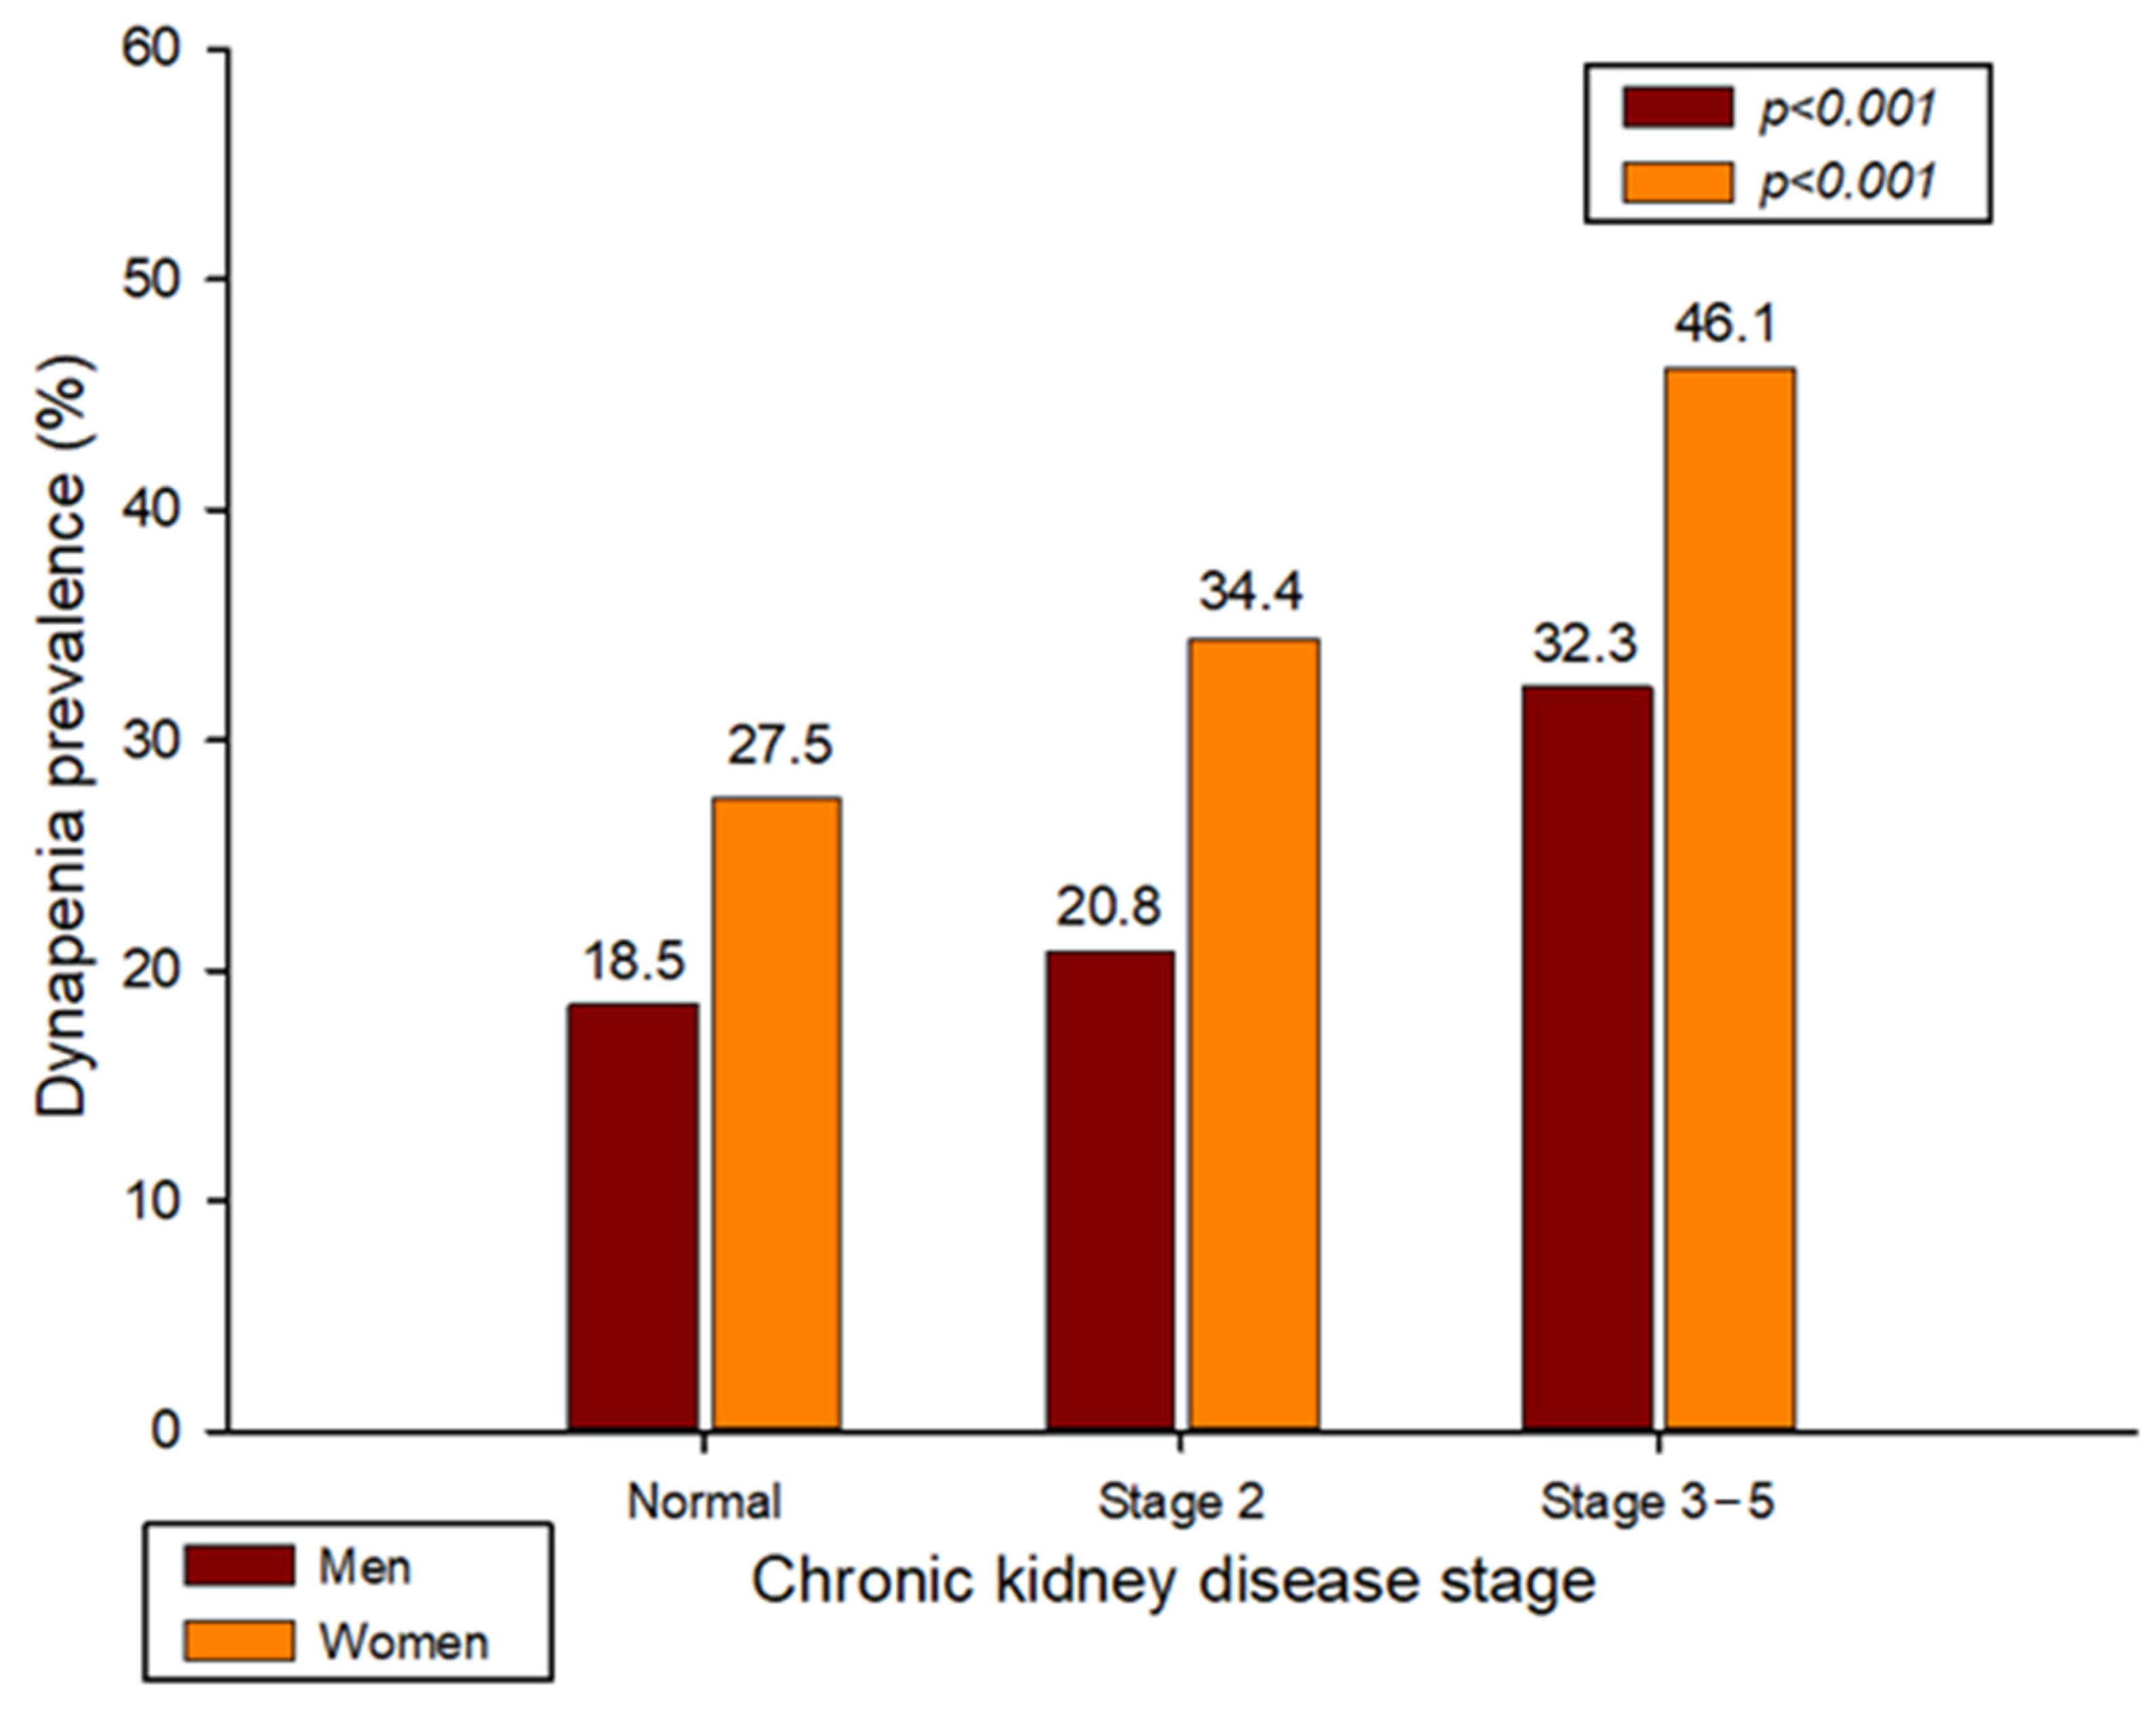
| Dynapenia (%) | 18.5 | 20.8 | 32.3 | <0.001 | 27.5 | 34.4 | 46.1 | <0.001 |
| Relative HGS (kg) | 1.45 ± 0.011 | 1.41 ± 0.00 | 1.30 ± 0.018 | <0.001 | 0.86 ± 0.01 | 0.82 ± 0.01 | 0.74 ± 0.02 | <0.001 |
| Dominant HGS (kg) | 33.78 ± 0.24 | 33.31 ± 0.19 | 31.32 ± 0.44 | <0.001 | 20.55 ± 0.14 | 19.81 ± 0.14 | 18.31 ± 0.34 | <0.001 |
| Men | Women | |||||
|---|---|---|---|---|---|---|
| Normal (n = 2526) | Dynapenia (n = 708) | p | Normal (n = 2613) | Dynapenia (n = 1182) | p | |
| Age(y) | 71.16 ± 0.11 | 75.14 ± 0.2 | <0.001 | 71.55 ± 0.11 | 75.29 ± 0.15 | <0.001 |
| Height (cm) | 166.43 ± 0.13 | 163.18 ± 0.22 | <0.001 | 153.08 ± 0.13 | 149.75 ± 0.18 | <0.001 |
| Weight (kg) | 66.55 ± 0.2 | 61.42 ± 0.39 | <0.001 | 57.7 ± 0.19 | 54.18 ± 0.29 | <0.001 |
| BMI (kg/m2), mean (SD) | 24 ± 0.06 | 23.05 ± 0.14 | <0.001 | 24.61 ± 0.07 | 24.12 ± 0.12 | <0.001 |
| <18.5 (underweight), n (%) | 2.1 | 6.4 | 0.9 | 3.9 | ||
| <25 (normal weight), n (%) | 62.9 | 68.7 | 57.0 | 58.4 | ||
| ≥25 (overweight), n (%) | 35.0 | 24.9 | 42.1 | 37.7 | ||
| Smoking status, (%) (current/ex-/non-smoker) | 18.5/61.1/20.5 | 20.2/58.0/21.8 | 0.450 | 2.5/2.9/94.6 | 2.5/3.6/94.0 | 0.657 |
| Drinking status (%) (current/non-drinking) | 73.9/26.1 | 54.0/46.0 | <0.001 | 42.7/57.3 | 30.0/70.0 | <0.001 |
| Marital status (%) (living with spouse) | 90.3 | 82.6 | <0.001 | 53.5 | 40.8 | <0.001 |
| Individual income | <0.001 | 0.001 | ||||
| Q1 (lowest) | 21.5 | 32.0 | 22.6 | 28.1 | ||
| Q2 | 23.4 | 25.6 | 24.1 | 26.2 | ||
| Q3 | 26.8 | 20.8 | 24.5 | 22.4 | ||
| Q4 (highest) | 28.3 | 21.6 | 28.8 | 23.2 | ||
| SBP (mmHg) | 126.95 ± 0.38 | 126.2 ± 0.78 | 0.381 | 130.19 ± 0.44 | 131.29 ± 0.6 | 0.126 |
| DP (mmHg) | 73.16 ± 0.22 | 69.56 ± 0.48 | <0.001 | 73.43 ± 0.23 | 71.68 ± 0.34 | <0.001 |
| WC (cm) | 87.62 ± 0.19 | 85.72 ± 0.41 | <0.001 | 84.9 ± 0.22 | 83.97 ± 0.31 | 0.012 |
| Fasting glucose (mg/dL) | 109.83 ± 0.63 | 108.33 ± 1.23 | 0.272 | 106.01 ± 0.54 | 108.04 ± 0.89 | 0.049 |
| Total cholesterol | 179.64 ± 0.89 | 175.45 ± 1.61 | 0.019 | 191.25 ± 0.92 | 187.3 ± 1.29 | 0.012 |
| HDL-cholesterol | 46.75 ± 0.26 | 44.88 ± 0.47 | <0.001 | 50.47 ± 0.27 | 48.42 ± 0.4 | <0.001 |
| Triglyceride | 137.95 ± 2.06 | 134.08 ± 3.81 | 0.361 | 132.2 ± 2.08 | 135.06 ± 2.74 | 0.395 |
| Aerobic exercise (TWT) | 65.77 ± 2.12 | 60.58 ± 3.61 | 0.218 | 67.33 ± 2.01 | 49.45 ± 2.86 | <0.001 |
| Resistance exercise | <0.001 | <0.001 | ||||
| Never | 64.0 | 83.1 | 87.2 | 94.0 | ||
| 1–3 days/wk | 12.2 | 5.0 | 6.0 | 2.3 | ||
| ≥4 days/wk | 23.8 | 11.9 | 6.9 | 3.7 | ||
| HbA1c | 6.05 ± 0.02 | 6.02 ± 0.04 | 0.564 | 6.05 ± 0.02 | 6.12 ± 0.03 | 0.065 |
| BUN (mg/dL) | 17.34 ± 0.1 | 18.22 ± 0.29 | 0.005 | 16.84 ± 0.12 | 17.18 ± 0.19 | 0.124 |
| Creatine (mg/dL) | 0.99 ± 0.01 | 1.02 ± 0.01 | 0.072 | 0.75 ± 0.01 | 0.77 ± 0.01 | 0.052 |
| eGFR (mL/min/1.73 m2) | 81.65 ± 0.33 | 78.72 ± 0.72 | <0.001 | 84.57 ± 0.32 | 81.2 ± 0.5 | <0.001 |
| CKD stage (2/3a-5, %) | 55.8/8.2 | 54.8/14.6 | <0.001 | 50.8/6.3 | 46.1/11.2 | <0.001 |
| Relative HGS (kg) | 1.51 ± 0.01 | 1.03 ± 0.01 | <0.001 | 0.93 ± 0.01 | 0.61 ± 0.01 | <0.001 |
| Dominant HGS (kg) | 35.91 ± 0.11 | 23.46 ± 0.2 | <0.001 | 22.68 ± 0.07 | 14.43 ± 0.09 | <0.001 |
| Crude | p | Model 1 | p | Model 2 | p | Model 3 | p | |
|---|---|---|---|---|---|---|---|---|
| Total | ||||||||
| CKD stage 2 | 1.212 (1.135–1.295) | 0.002 | 1.280 (1.122–1.460) | <0.0001 | 1.215 (1.063–1.389) | 0.004 | 1.207 (1.056–1.379) | 0.006 |
| CKD stage 3–5 | 2.043 (1.672–2.496) | <0.0001 | 2.125 (1.716–2.632) | <0.0001 | 1.864 (1.490–2.330) | <0.0001 | 1.790 (1.427–2.246) | <0.0001 |
| Men | ||||||||
| CKD stage 2 | 1.157 (0.932–1.436) | 0.187 | 1.183 (0.950–1.473) | 0.132 | 1.190 (0.951–1.490) | 0.128 | 1.188 (0.950–1.486) | 0.132 |
| CKD stage 3–5 | 2.099 (1.521–2.895) | <0.0001 | 1.985 (1.418–2.780) | <0.0001 | 1.861 (1.317–2.631) | <0.0001 | 1.791 (1.257–2.550) | 0.001 |
| Women | ||||||||
| CKD stage 2 | 1.381 (1.170–1.631) | < 0.0001 | 1.338 (1.132–1.582) | 0.001 | 1.225 (1.031–1.455) | 0.021 | 1.216 (1.024–1.444) | 0.026 |
| CKD stage 3–5 | 2.255 (1.697–2.997) | <0.0001 | 2.189 (1.630–2.941) | <0.0001 | 1.817 (1.338–2.467) | <0.0001 | 1.749 (1.292–2.369) | <0.0001 |
Disclaimer/Publisher’s Note: The statements, opinions and data contained in all publications are solely those of the individual author(s) and contributor(s) and not of MDPI and/or the editor(s). MDPI and/or the editor(s) disclaim responsibility for any injury to people or property resulting from any ideas, methods, instructions or products referred to in the content. |
© 2023 by the authors. Licensee MDPI, Basel, Switzerland. This article is an open access article distributed under the terms and conditions of the Creative Commons Attribution (CC BY) license (https://creativecommons.org/licenses/by/4.0/).
Share and Cite
Lee, D.-Y.; Shin, S. Association between Chronic Kidney Disease and Dynapenia in Elderly Koreans. Healthcare 2023, 11, 2976. https://doi.org/10.3390/healthcare11222976
Lee D-Y, Shin S. Association between Chronic Kidney Disease and Dynapenia in Elderly Koreans. Healthcare. 2023; 11(22):2976. https://doi.org/10.3390/healthcare11222976
Chicago/Turabian StyleLee, Do-Youn, and Sunghoon Shin. 2023. "Association between Chronic Kidney Disease and Dynapenia in Elderly Koreans" Healthcare 11, no. 22: 2976. https://doi.org/10.3390/healthcare11222976
APA StyleLee, D.-Y., & Shin, S. (2023). Association between Chronic Kidney Disease and Dynapenia in Elderly Koreans. Healthcare, 11(22), 2976. https://doi.org/10.3390/healthcare11222976