
Dynamic Performance Assessment of Hospitals by Applying Credibility-Based Fuzzy Window Data Envelopment Analysis


Abstract
:1. Introduction
2. Literature Review
3. The Proposed Approach
4. Case Study and Experimental Results
5. Conclusions and Future Research Directions
Author Contributions
Funding
Institutional Review Board Statement
Informed Consent Statement
Data Availability Statement
Acknowledgments
Conflicts of Interest
References
- Moshiri, H.; Aljunid, S.M.; Amin, R.M. Hospital efficiency: Concept, measurement techniques and review of hospital efficiency studies. Malays. J. Public Health Med. 2010, 10, 35–43. [Google Scholar]
- Kiadaliri, A.A.; Jafari, M.; Gerdtham, U.G. Frontier-based techniques in measuring hospital efficiency in Iran: A systematic review and meta-regression analysis. BMC Health Serv. Res. 2013, 13, 312. [Google Scholar] [CrossRef] [Green Version]
- Cantor, V.J.M.; Poh, K.L. Integrated analysis of healthcare efficiency: A systematic review. J. Med. Syst. 2018, 42, 8. [Google Scholar] [CrossRef] [PubMed]
- Mahdiyan, S.; Dehghani, A.; Tafti, A.D.; Pakdaman, M.; Askari, R. Hospitals’ efficiency in Iran: A systematic review and meta-analysis. J. Educ. Health Promot. 2019, 8, 126. [Google Scholar] [PubMed]
- Ravaghi, H.; Afshari, M.; Isfahani, P.; Bélorgeot, V.D. A systematic review on hospital inefficiency in the Eastern Mediterranean Region: Sources and solutions. BMC Health Serv. Res. 2019, 19, 830. [Google Scholar]
- Nayar, P.; Ozcan, Y.A. Data envelopment analysis comparison of hospital efficiency and quality. J. Med. Syst. 2008, 32, 193–199. [Google Scholar] [CrossRef]
- Bahadori, M.; Izadi, A.R.; Ghardashi, F.; Ravangard, R.; Hosseini, S.M. The evaluation of hospital performance in Iran: A systematic review article. Iran. J. Public Health 2016, 45, 855. [Google Scholar]
- Alinezhad, A.; Mirmozaffari, M. Malmquist Productivity Index Using Two-Stage DEA Model in Heart Hospitals. Iran. J. Optim. 2018, 10, 81–92. [Google Scholar]
- Peykani, P.; Mohammadi, E.; Seyed Esmaeili, F.S. Measuring performance, estimating most productive scale size, and benchmarking of hospitals using DEA approach: A case study in Iran. Int. J. Hosp. Res. 2018, 7, 21–41. [Google Scholar]
- Peykani, P.; Seyed Esmaeili, F.S.; Rostamy-Malkhalifeh, M.; Hosseinzadeh Lotfi, F. Measuring productivity changes of hospitals in Tehran: The fuzzy Malmquist productivity index. Int. J. Hosp. Res. 2018, 7, 1–17. [Google Scholar]
- Kohl, S.; Schoenfelder, J.; Fügener, A.; Brunner, J.O. The use of Data Envelopment Analysis (DEA) in healthcare with a focus on hospitals. Health Care Manag. Sci. 2019, 22, 245–286. [Google Scholar] [CrossRef]
- Zakowska, I.; Godycki-Cwirko, M. Data envelopment analysis applications in primary health care: A systematic review. Fam. Pract. 2020, 37, 147–153. [Google Scholar] [CrossRef] [PubMed]
- Mirmozaffari, M.; Yazdani, R.; Shadkam, E.; Khalili, S.M.; Tavassoli, L.S.; Boskabadi, A. A novel hybrid parametric and non-parametric optimisation model for average technical efficiency assessment in public hospitals during and post-COVID-19 pandemic. Bioengineering 2021, 9, 7. [Google Scholar] [CrossRef] [PubMed]
- O’Neill, L.; Rauner, M.; Heidenberger, K.; Kraus, M. A cross-national comparison and taxonomy of DEA-based hospital efficiency studies. Socio-Econ. Plan. Sci. 2008, 42, 158–189. [Google Scholar] [CrossRef]
- Mirmozaffari, M.; Alinezhad, A. Ranking of Heart Hospitals Using cross-efficiency and two-stage DEA. In Proceedings of the 7th International Conference on Computer and Knowledge Engineering, Mashhad, Iran, 26–27 October 2017; pp. 217–222. [Google Scholar]
- Azreena, E.; Juni, M.H.; Rosliza, A.M. A systematic review of hospital inputs and outputs in measuring technical efficiency using data envelopment analysis. Int. J. Public Health Clin. Sci. 2018, 5, 17–35. [Google Scholar]
- Rezaei, S.; Hajizadeh, M.; Nouri, B.; Ahmadi, S.; Rezaeian, S.; Salimi, Y.; Karyani, A.K. Iranian hospital efficiency: A systematic review and meta-analysis. Int. J. Health Care Qual. Assur. 2019, 32, 385–397. [Google Scholar] [CrossRef] [PubMed]
- Zhou, L.; Ampon-Wireko, S.; Dauda, L.; Xu, X.; Antwi, M.O.; Larnyo, E. Empirical analysis of factors influencing healthcare efficiency among emerging countries. Healthcare 2020, 9, 31. [Google Scholar] [CrossRef]
- Fazria, N.F.; Dhamanti, I. A Literature review on the Identification of Variables for Measuring Hospital Efficiency in the Data Envelopment Analysis (DEA). Unnes J. Public Health 2021, 10, 1–15. [Google Scholar] [CrossRef]
- Gómez-Gallego, J.C.; Gómez-Gallego, M.; García-García, J.F.; Faura-Martinez, U. Evaluation of the efficiency of European health systems using fuzzy data envelopment analysis. Healthcare 2021, 9, 1270. [Google Scholar] [CrossRef]
- Kim, Y.; Lee, K.H.; Choi, S.W. Multifaced evidence of hospital performance in Pennsylvania. Healthcare 2021, 9, 670. [Google Scholar] [CrossRef] [PubMed]
- Lin, C.S.; Chiu, C.M.; Huang, Y.C.; Lang, H.C.; Chen, M.S. Evaluating the Operational Efficiency and Quality of Tertiary Hospitals in Taiwan: The Application of the EBITDA Indicator to the DEA Method and TOBIT Regression. Healthcare 2021, 10, 58. [Google Scholar] [CrossRef] [PubMed]
- Mirmozaffari, M.; Shadkam, E.; Khalili, S.M.; Yazdani, M. Developing a novel integrated generalised data envelopment analysis (DEA) to evaluate hospitals providing stroke care services. Bioengineering 2021, 8, 207. [Google Scholar] [CrossRef] [PubMed]
- Yin, G.; Chen, C.; Zhuo, L.; He, Q.; Tao, H. Efficiency comparison of public hospitals under different administrative affiliations in China: A pilot city case. Healthcare 2021, 9, 437. [Google Scholar] [CrossRef] [PubMed]
- Charnes, A.; Cooper, W.W.; Rhodes, E. Measuring the efficiency of decision making units. Eur. J. Oper. Res. 1978, 2, 429–444. [Google Scholar] [CrossRef]
- Banker, R.D.; Charnes, A.; Cooper, W.W. Some models for estimating technical and scale inefficiencies in data envelopment analysis. Manag. Sci. 1984, 30, 1078–1092. [Google Scholar] [CrossRef] [Green Version]
- Charnes, A.; Cooper, W.; Lewin, A.Y.; Seiford, L.M. Data envelopment analysis theory, methodology and applications. J. Oper. Res. Soc. 1997, 48, 332–333. [Google Scholar] [CrossRef]
- Emrouznejad, A. Advances in data envelopment analysis. Ann. Oper. Res. 2014, 214, 1–4. [Google Scholar] [CrossRef] [Green Version]
- Emrouznejad, A.; Yang, G.L. A survey and analysis of the first 40 years of scholarly literature in DEA: 1978–2016. Socio-Econ. Plan. Sci. 2018, 61, 4–8. [Google Scholar] [CrossRef]
- Gannon, B. Technical efficiency and total factor productivity growth of hospitals in Ireland. In Proceedings of the 4th International Conference on Data Envelopment Analysis, Birmingham, UK, 5–8 September 2004. [Google Scholar]
- Ozcan, Y.A.; Merwin, E.; Lee, K.; Morrissey, J.P. Benchmarking Using DEA: The Case of Mental Health Organizations. Operations Research and Health Care; Springer: Boston, MA, USA, 2005; pp. 169–189. [Google Scholar]
- Kazley, A.S.; Ozcan, Y.A. Electronic medical record use and efficiency: A DEA and windows analysis of hospitals. Socio-Econ. Plan. Sci. 2009, 43, 209–216. [Google Scholar] [CrossRef]
- Weng, S.J.; Wu, T.; Blackhurst, J.; Mackulak, G. An extended DEA model for hospital performance evaluation and improvement. Health Serv. Outcomes Res. Methodol. 2009, 9, 39–53. [Google Scholar] [CrossRef]
- Flokou, A.; Aletras, V.; Niakas, D. A window-DEA based efficiency evaluation of the public hospital sector in Greece during the 5-year economic crisis. PLoS ONE 2017, 12, e0177946. [Google Scholar] [CrossRef] [PubMed]
- Jia, T.; Yuan, H. The application of DEA (data envelopment analysis) window analysis in the assessment of influence on operational efficiencies after the establishment of branched hospitals. BMC Health Serv. Res. 2017, 17, 265. [Google Scholar] [CrossRef] [PubMed]
- Klangrahad, C. Evaluation of Thailand’s regional hospital efficiency: An application of data envelopment analysis. In Proceedings of the 7th International Conference on Information Communication and Management, Moscow, Russia, 28–30 August 2017; pp. 104–109. [Google Scholar]
- Mirmozaffari, M.; Alinezhad, A. Window analysis using two-stage DEA in heart hospitals. In Proceedings of the 10th International Conference on Innovations in Science, Engineering, Computers and Technology, Kuala Lumpur, Malaysia, 23–25 July 2017; pp. 44–51. [Google Scholar]
- Pirani, N.; Zahiri, M.; Engali, K.A.; Torabipour, A. Hospital efficiency measurement before and after health sector evolution plan in southwest of Iran: A DEA-Panel Data Study. Acta Inform. Med. 2018, 26, 106–110. [Google Scholar] [CrossRef]
- Serván-Mori, E.; Chivardi, C.; Mendoza, M.Á.; Nigenda, G. A longitudinal assessment of technical efficiency in the outpatient production of maternal health services in México. Health Policy Plan. 2018, 33, 889–897. [Google Scholar] [CrossRef] [PubMed]
- Stefko, R.; Gavurova, B.; Kocisova, K. Healthcare efficiency assessment using DEA analysis in the Slovak Republic. Health Econ. Rev. 2018, 8, 6. [Google Scholar] [CrossRef] [PubMed]
- Fuentes, R.; Ferrándiz-Gomis, R.; Fuster-Garcia, B. Efficiency of acute public hospitals in the region of Murcia, Spain. J. Comp. Eff. Res. 2019, 8, 929–946. [Google Scholar] [CrossRef]
- Kocisova, K.; Gavurova, B.; Behun, M. The importance of implementing environmental variables in the process of assessment of healthcare efficiency through DEA. Ekon. Cas. 2019, 2019, 367–387. [Google Scholar]
- Serván-Mori, E.; Mendoza, M.Á.; Chivardi, C.; Pineda-Antúnez, C.; Rodríguez-Franco, R.; Nigenda, G. A spatio-temporal cluster analysis of technical efficiency in the production of outpatient maternal health services and its structural correlates in México. Int. J. Health Plan. Manag. 2019, 34, 1417–1436. [Google Scholar] [CrossRef] [PubMed]
- Andrews, A. An application of PCA-DEA with the double-bootstrap approach to estimate the technical efficiency of New Zealand District Health Boards. Health Econ. Policy Law 2021, 17, 175–179. [Google Scholar] [CrossRef] [PubMed]
- Miszczynska, K.; Miszczyński, P.M. Measuring the efficiency of the healthcare sector in Poland—A window-DEA evaluation. Int. J. Product. Perform. Manag. 2021, 1–28. [Google Scholar] [CrossRef]
- Yüksel, O. Comparison of Healthcare System Performances in OECD Countries. Int. J. Health Serv. Res. Policy 2021, 6, 251–261. [Google Scholar] [CrossRef]
- Vaňková, I.; Vrabková, I. Productivity analysis of regional-level hospital care in the Czech Republic and Slovak Republic. BMC Health Serv. Res. 2022, 22, 180. [Google Scholar] [CrossRef] [PubMed]
- Charnes, A.; Clark, C.T.; Cooper, W.W.; Golany, B. A development study of data envelopment analysis in measuring the effect of maintenance units in the US Air Force. Ann. Oper. Res. 1985, 2, 95–112. [Google Scholar] [CrossRef]
- Charnes, A.; Cooper, W.W. Preface to topics in data envelopment analysis. Ann. Oper. Res. 1985, 2, 59–94. [Google Scholar] [CrossRef]
- Tulkens, H.; Vanden Eeckaut, P. Non-parametric efficiency, progress and regress measures for panel data: Methodological aspects. Eur. J. Oper. Res. 1995, 80, 474–499. [Google Scholar] [CrossRef] [Green Version]
- Asmild, M.; Paradi, J.C.; Aggarwall, V.; Schaffnit, C. Combining DEA window analysis with the Malmquist index approach in a study of the Canadian banking industry. J. Product. Anal. 2004, 21, 67–89. [Google Scholar] [CrossRef]
- Peykani, P.; Mohammadi, E. Window network data envelopment analysis: An application to investment companies. Int. J. Ind. Math. 2020, 12, 89–99. [Google Scholar]
- Peykani, P.; Farzipoor Saen, R.; Seyed Esmaeili, F.S.; Gheidar-Kheljani, J. Window data envelopment analysis approach: A review and bibliometric analysis. Expert Syst. 2021, 38, e12721. [Google Scholar] [CrossRef]
- Peykani, P.; Mohammadi, E.; Pishvaee, M.S.; Rostamy-Malkhalifeh, M.; Jabbarzadeh, A. A novel fuzzy data envelopment analysis based on robust possibilistic programming: Possibility, necessity and credibility-based approaches. RAIRO-Oper. Res. 2018, 52, 1445–1463. [Google Scholar] [CrossRef]
- Peykani, P.; Mohammadi, E.; Emrouznejad, A. An adjustable fuzzy chance-constrained network DEA approach with application to ranking investment firms. Expert Syst. Appl. 2021, 166, 113938. [Google Scholar] [CrossRef]
- Peykani, P.; Namakshenas, M.; Arabjazi, N.; Shirazi, F.; Kavand, N. Optimistic and pessimistic fuzzy data envelopment analysis: Empirical evidence from Tehran stock market. Fuzzy Optim. Modeling J. 2021, 2, 12–21. [Google Scholar]
- Peykani, P.; Namazi, M.; Mohammadi, E. Bridging the knowledge gap between technology and business: An innovation strategy perspective. PLoS ONE 2022, 17, e0266843. [Google Scholar] [CrossRef] [PubMed]
- Charnes, A.; Cooper, W.W. Chance-constrained programming. Manag. Sci. 1959, 6, 73–79. [Google Scholar] [CrossRef]
- Zadeh, L.A. Fuzzy Sets as a Basis for a Theory of Possibility. Fuzzy Sets Syst. 1978, 1, 3–28. [Google Scholar] [CrossRef]
- Xu, J.; Zhou, X. Fuzzy-Like Multiple Objective Decision Making; Springer: Berlin/Heidelberg, Germany, 2011. [Google Scholar]
- Peykani, P.; Mohammadi, E.; Emrouznejad, A.; Pishvaee, M.S.; Rostamy-Malkhalifeh, M. Fuzzy data envelopment analysis: An adjustable approach. Expert Syst. Appl. 2019, 136, 439–452. [Google Scholar] [CrossRef]
- Peykani, P.; Nouri, M.; Eshghi, F.; Khamechian, M.; Farrokhi-Asl, M. A novel mathematical approach for fuzzy multi-period multi-objective portfolio optimization problem under uncertain environment and practical constraints. J. Fuzzy Ext. Appl. 2021, 2, 191–203. [Google Scholar]
- Peykani, P.; Seyed Esmaeili, F.S. Malmquist productivity index under fuzzy environment. Fuzzy Optim. Model. J. 2021, 2, 10–19. [Google Scholar]
- Peykani, P.; Hosseinzadeh Lotfi, F.; Sadjadi, S.J.; Ebrahimnejad, A.; Mohammadi, E. Fuzzy chance-constrained data envelopment analysis: A structured literature review, current trends, and future directions. Fuzzy Optim. Decis. Mak. 2022, 21, 197–261. [Google Scholar] [CrossRef]
- Peykani, P.; Namakshenas, M.; Nouri, M.; Kavand, N.; Rostamy-Malkhalifeh, M. A Possibilistic Programming Approach to Portfolio Optimization Problem under Fuzzy Data. Advances in Econometrics, Operational Research, Data Science and Actuarial Studies; Springer: Berlin/Heidelberg, Germany, 2022; pp. 377–387. [Google Scholar]
- Hatami-Marbini, A.; Tavana, M.; Emrouznejad, A. Productivity growth and efficiency measurements in fuzzy environments with an application to health care. Int. J. Fuzzy Syst. Appl. 2012, 2, 1–35. [Google Scholar] [CrossRef] [Green Version]
- Gabrel, V.; Murat, C.; Thiele, A. Recent advances in robust optimization: An overview. Eur. J. Oper. Res. 2014, 235, 471–483. [Google Scholar] [CrossRef]
- Peykani, P.; Mohammadi, E.; Farzipoor Saen, R.; Sadjadi, S.J.; Rostamy-Malkhalifeh, M. Data envelopment analysis and robust optimization: A review. Expert Syst. 2020, 37, e12534. [Google Scholar] [CrossRef]
- Peykani, P.; Mohammadi, E.; Jabbarzadeh, A.; Rostamy-Malkhalifeh, M.; Pishvaee, M.S. A novel two-phase robust portfolio selection and optimization approach under uncertainty: A case study of Tehran stock exchange. PLoS ONE 2020, 15, e0239810. [Google Scholar] [CrossRef] [PubMed]
- Dehnokhalaji, A.; Khezri, S.; Emrouznejad, A. A box-uncertainty in DEA: A robust performance measurement framework. Expert Syst. Appl. 2022, 187, 115855. [Google Scholar] [CrossRef]
- Omrani, H.; Alizadeh, A.; Emrouznejad, A.; Teplova, T. A robust credibility DEA model with fuzzy perturbation degree: An application to hospitals performance. Expert Syst. Appl. 2022, 189, 116021. [Google Scholar] [CrossRef]
- Peykani, P.; Emrouznejad, A.; Mohammadi, E.; Gheidar-Kheljani, J. A novel robust network data envelopment analysis approach for performance assessment of mutual funds under uncertainty. Ann. Oper. Res. 2022, 225. [Google Scholar] [CrossRef]
- Toloo, M.; Mensah, E.K.; Salahi, M. Robust optimization and its duality in data envelopment analysis. Omega 2022, 108, 102583. [Google Scholar] [CrossRef]
- Wen, M.; Zhang, Q.; Kang, R.; Yang, Y. Some new ranking criteria in data envelopment analysis under uncertain environment. Comput. Ind. Eng. 2017, 110, 498–504. [Google Scholar] [CrossRef]
- Mohmmad Nejad, Z.; Ghaffari-Hadigheh, A. A novel DEA model based on uncertainty theory. Ann. Oper. Res. 2018, 264, 367–389. [Google Scholar] [CrossRef]
- Wen, M.; Yu, X.; Wang, F. A new uncertain DEA model and application to scientific research personnel. Soft Comput. 2020, 24, 2841–2847. [Google Scholar] [CrossRef]
- Jiang, B.; Chen, H.; Li, J.; Lio, W. The uncertain two-stage network DEA models. Soft Comput. 2021, 25, 421–429. [Google Scholar] [CrossRef]
- Jiang, B.; Yang, C.; Li, J. The uncertain network DEA model for two-stage system with additive relationship. Symmetry 2021, 13, 1893. [Google Scholar] [CrossRef]
- Peykani, P.; Gheidar-Kheljani, J.; Rahmani, D.; Karimi Gavareshki, M.H.; Jabbarzadeh, A. Uncertain Super-Efficiency Data Envelopment Analysis. Advances in Econometrics, Operational Research, Data Science and Actuarial Studies; Springer: Berlin/Heidelberg, Germany, 2022; pp. 311–320. [Google Scholar]
- Zadeh, L.A. A note on Z-numbers. Inf. Sci. 2011, 181, 2923–2932. [Google Scholar] [CrossRef]
- Azadeh, A.; Kokabi, R. Z-number DEA: A new possibilistic DEA in the context of Z-numbers. Adv. Eng. Inform. 2016, 30, 604–617. [Google Scholar] [CrossRef]
- Kang, B.; Deng, Y.; Hewage, K.; Sadiq, R. A method of measuring uncertainty for Z-number. IEEE Trans. Fuzzy Syst. 2018, 27, 731–738. [Google Scholar] [CrossRef]
- Abbasi, M.; Pishvaee, M.S.; Bairamzadeh, S. Land suitability assessment for Paulownia cultivation using combined GIS and Z-number DEA: A case study. Comput. Electron. Agric. 2020, 176, 105666. [Google Scholar] [CrossRef]
- Tavana, M.; Nazari-Shirkouhi, S.; Farzaneh Kholghabad, H. An integrated quality and resilience engineering framework in healthcare with Z-number data envelopment analysis. Health Care Manag. Sci. 2021, 24, 768–785. [Google Scholar] [CrossRef]
- Yazdanparast, R.; Tavakkoli-Moghaddam, R.; Heidari, R.; Aliabadi, L. A hybrid Z-number data envelopment analysis and neural network for assessment of supply chain resilience: A case study. Cent. Eur. J. Oper. Res. 2021, 29, 611–631. [Google Scholar] [CrossRef]


| Year | Research | DEA Model | Case Study (Location) | Data Type |
|---|---|---|---|---|
| 2004 | Gannon [30] | CCR * | Hospital (Ireland) | Crisp |
| 2005 | Ozcan et al. [31] | BCC * | Mental Health Service (USA) | Crisp |
| 2009 | Kazley and Ozcan [32] | CCR | Hospital (USA) | Crisp |
| 2009 | Weng et al. [33] | CCR | Hospital (USA) | Crisp |
| 2017 | Flokou et al. [34] | BCC | Public Hospital Sector (Greece) | Crisp |
| 2017 | Jia and Yuan [35] | BCC | Multi-Branched Hospital (China) | Crisp |
| 2017 | Klangrahad [36] | BCC | Hospital (Thailand) | Crisp |
| 2017 | Mirmozaffari and Alinezhad [37] | Two-Stage DEA | Heart Hospital (Iran) | Crisp |
| 2018 | Pirani et al. [38] | BCC | Public Hospital (Iran) | Crisp |
| 2018 | Serván-Mori et al. [39] | BCC | Maternal Health Service (México) | Crisp |
| 2018 | Stefko et al. [40] | CCR | Reginal Health Care (Slovakia) | Crisp |
| 2019 | Fuentes et al. [41] | CCR | Public Hospital (Spain) | Crisp |
| 2019 | Kocisova et al. [42] | CCR | Reginal Health Care (Slovakia) | Crisp |
| 2019 | Serván-Mori et al. [43] | BCC | Maternal Health Service (México) | Crisp |
| 2021 | Andrews [44] | BCC | Health Board (New Zealand) | Crisp |
| 2021 | Miszczynska and Miszczyński [45] | CCR | Health Care System (Poland) | Crisp |
| 2021 | Yüksel [46] | CCR | Health Care System (OECD) | Crisp |
| 2022 | Vaňková and Vrabková [47] | CCR | Hospital (Czech and Slovakia) | Crisp |
| The Current Research | Fuzzy DEA | Hospital (USA) | Uncertain | |
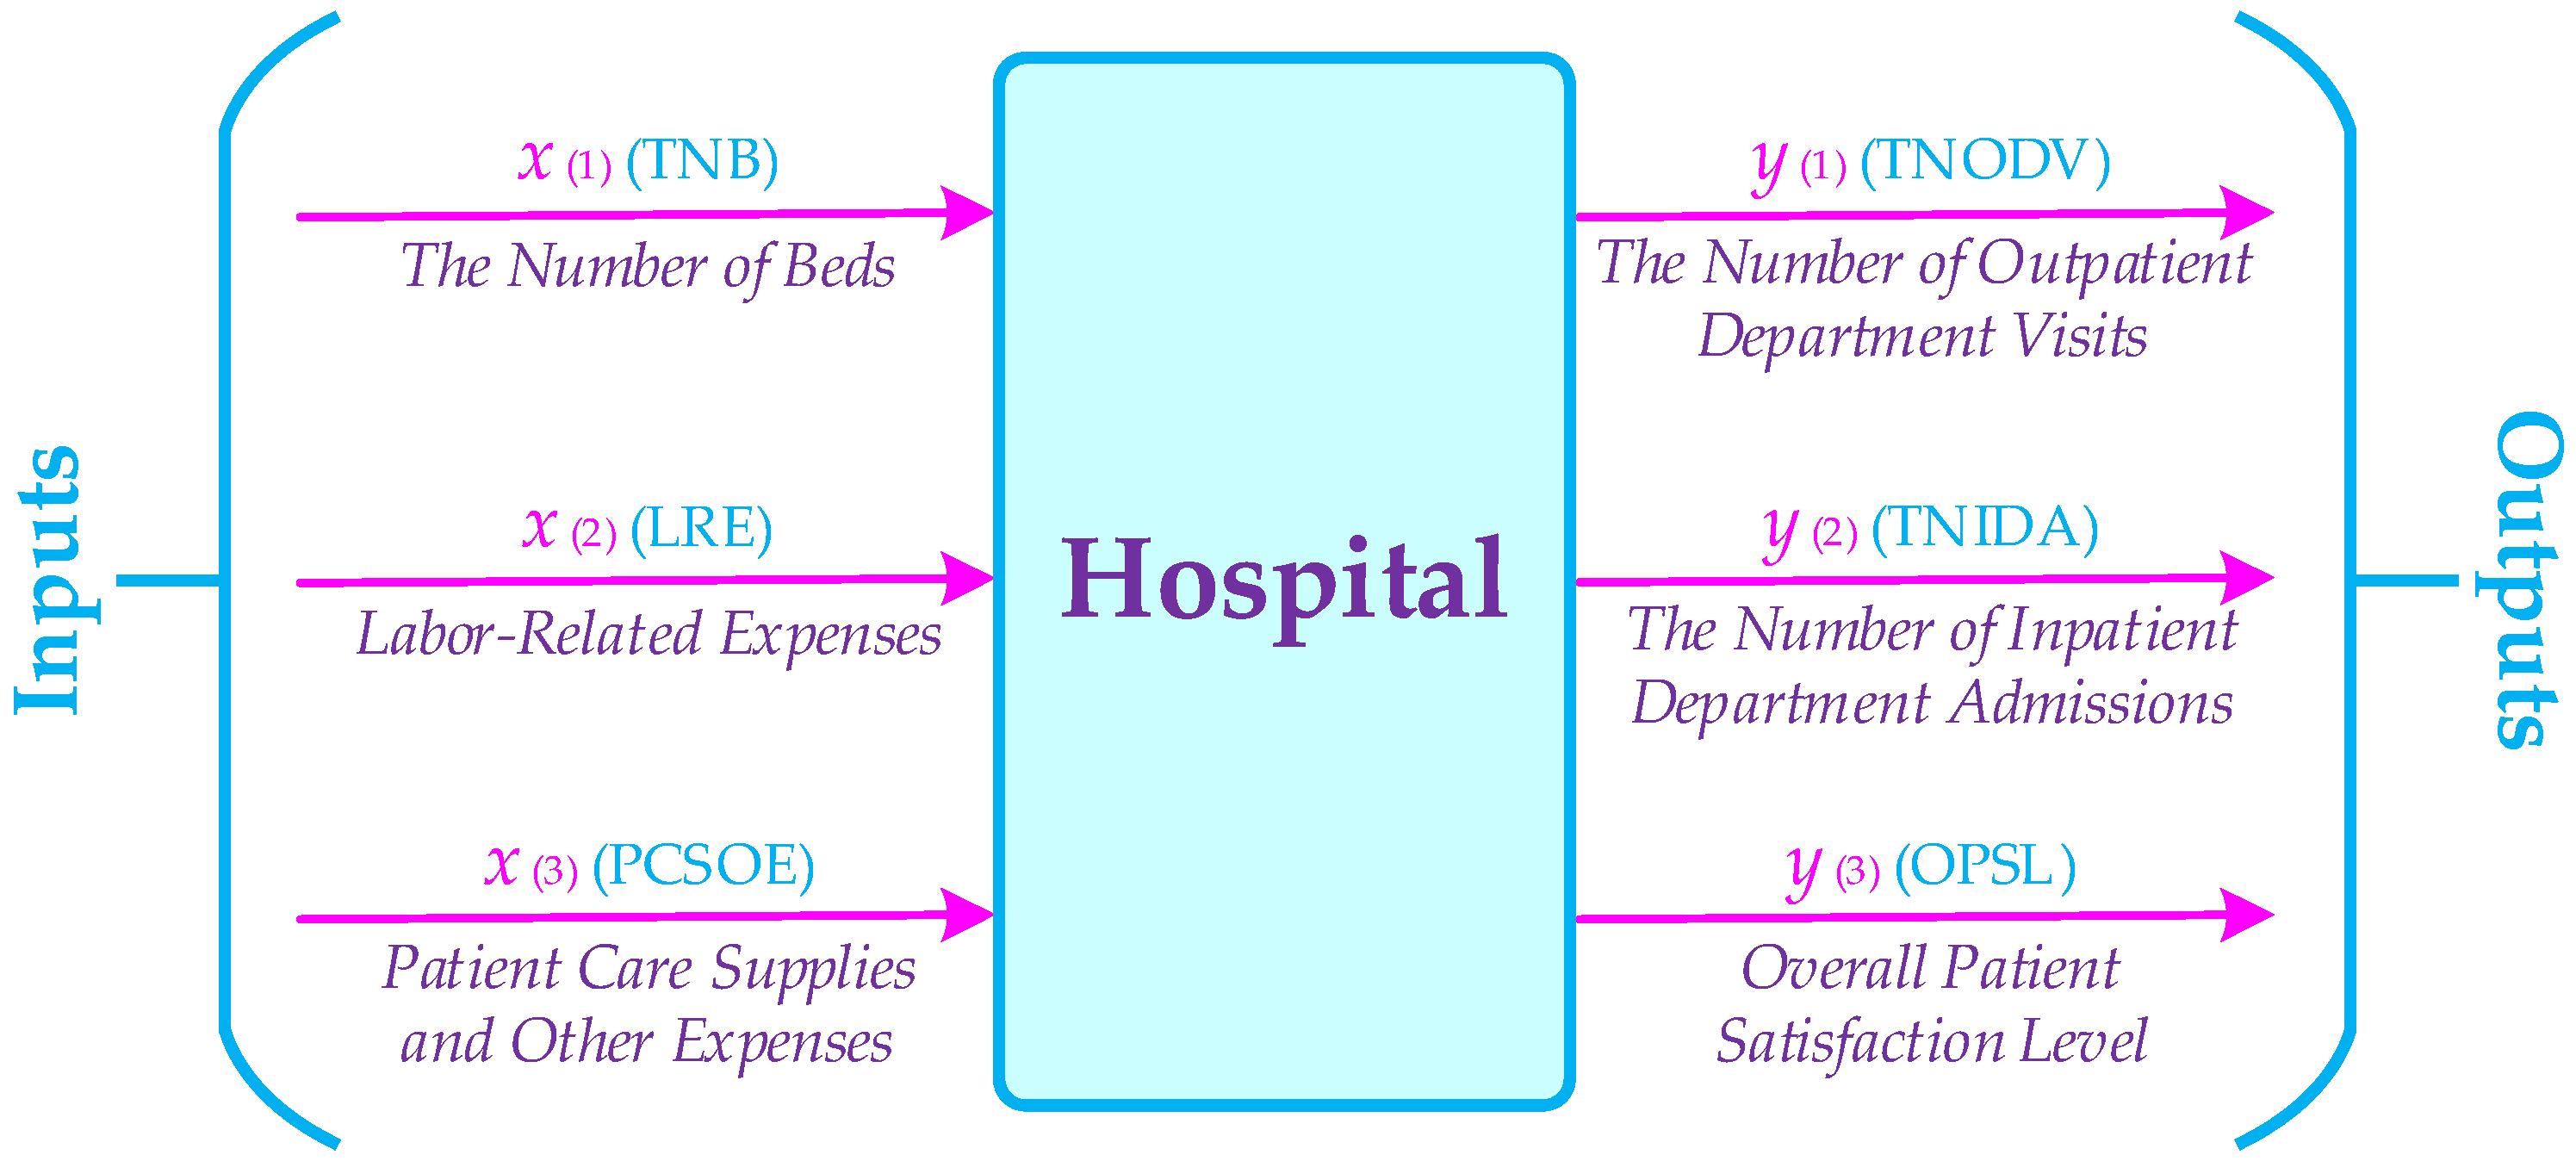
| Variables | Description | Min | Max | |
|---|---|---|---|---|
| Inputs | TNB | The Number of Beds | 49 | 90 |
| LRE | Compensation of Medical Doctors, Salaries and Wages of Non-Medical Doctors, Non-Payroll Labor, and Fringe Benefits | 3,778,001 | 9,202,308 | |
| PCSOE | Drugs, Medical Supplies, Food and Food Service Supplies, and Other Supplies and Expenses | 2,036,342 | 4,741,523 | |
| Outputs | TNODV | The Number of Patients that Not Require Hospital Admission | 35,649 | 78,483 |
| TNIDA | The Number of Patients that Require Hospital Admission | 3476 | 7574 | |
| OPSL | The Feedback and Opinion of Patient about the Provided Services | VL | VH | |
| Linguistic Variable | Trapezoidal Fuzzy Number |
|---|---|
| Very Low | (0, 0, 0.1, 0.2) |
| Low | (0.1, 0.2, 0.2, 0.3) |
| Medium Low | (0.2, 0.3, 0.4, 0.5) |
| Medium | (0.4, 0.5, 0.5, 0.6) |
| Medium High | (0.5, 0.6, 0.7, 0.8) |
| High | (0.7, 0.8, 0.8, 0.9) |
| Very High | (0.8, 0.9, 0.9, 1) |
| Hospitals | Windows | Period 1 | Period 2 | Period 3 | Period 4 | Period 5 | Period 6 | Average |
|---|---|---|---|---|---|---|---|---|
| Hospital 1 | Window 1 | 0.69954 | 1.60000 | 1.28571 | 1.19509 | |||
| Window 2 | 1.49822 | 0.95784 | 1.25000 | 1.23535 | ||||
| Window 3 | 0.95784 | 1.25000 | 0.62459 | 0.94414 | ||||
| Window 4 | 1.25000 | 0.61719 | 0.87440 | 0.91387 | ||||
| Average | 0.69954 | 1.54911 | 1.06713 | 1.25000 | 0.62089 | 0.87440 | 1.01018 | |
| Hospital 2 | Window 1 | 0.85771 | 0.62875 | 0.71094 | 0.73247 | |||
| Window 2 | 0.76536 | 0.77909 | 0.84856 | 0.79767 | ||||
| Window 3 | 0.78860 | 0.90136 | 0.81288 | 0.83428 | ||||
| Window 4 | 0.84450 | 0.81288 | 0.83861 | 0.83200 | ||||
| Average | 0.85771 | 0.69706 | 0.75954 | 0.86481 | 0.81288 | 0.83861 | 0.80510 | |
| Hospital 3 | Window 1 | 0.90842 | 0.88028 | 0.83627 | 0.87499 | |||
| Window 2 | 0.70965 | 0.69628 | 0.87135 | 0.75909 | ||||
| Window 3 | 0.81856 | 1.05776 | 0.67136 | 0.84923 | ||||
| Window 4 | 1.05776 | 0.65933 | 0.92485 | 0.88065 | ||||
| Average | 0.90842 | 0.79497 | 0.78370 | 0.99563 | 0.66534 | 0.92485 | 0.84548 | |
| Hospital 4 | Window 1 | 1.09588 | 1.28005 | 0.55113 | 0.97569 | |||
| Window 2 | 0.93733 | 0.66996 | 0.67735 | 0.76155 | ||||
| Window 3 | 0.70903 | 0.70578 | 1.17396 | 0.86292 | ||||
| Window 4 | 0.70578 | 1.17396 | 0.89116 | 0.92363 | ||||
| Average | 1.09588 | 1.10869 | 0.64337 | 0.69630 | 1.17396 | 0.89116 | 0.93489 | |
| Hospital 5 | Window 1 | 0.77416 | 0.62891 | 0.86885 | 0.75731 | |||
| Window 2 | 0.70416 | 0.71245 | 1.00862 | 0.80841 | ||||
| Window 3 | 0.78428 | 1.00862 | 0.70284 | 0.83191 | ||||
| Window 4 | 1.00862 | 0.70097 | 0.73921 | 0.81627 | ||||
| Average | 0.77416 | 0.66653 | 0.78852 | 1.00862 | 0.70191 | 0.73921 | 0.77983 | |
| Hospital 6 | Window 1 | 0.70281 | 1.54583 | 0.97302 | 1.07389 | |||
| Window 2 | 1.31824 | 0.74550 | 0.68100 | 0.91491 | ||||
| Window 3 | 0.78235 | 0.76689 | 0.85136 | 0.80020 | ||||
| Window 4 | 0.76689 | 0.85136 | 0.70932 | 0.77586 | ||||
| Average | 0.70281 | 1.43204 | 0.83362 | 0.73826 | 0.85136 | 0.70932 | 0.87790 |
| Hospitals | Windows | Period 1 | Period 2 | Period 3 | Period 4 | Period 5 | Period 6 | Average |
|---|---|---|---|---|---|---|---|---|
| Hospital 1 | Window 1 | 0.69760 | 1.40741 | 1.15082 | 1.08527 | |||
| Window 2 | 1.36173 | 0.88692 | 1.14286 | 1.13050 | ||||
| Window 3 | 0.88107 | 1.14286 | 0.62459 | 0.88284 | ||||
| Window 4 | 1.14286 | 0.61484 | 0.84296 | 0.86689 | ||||
| Average | 0.69760 | 1.38457 | 0.97293 | 1.14286 | 0.61972 | 0.84296 | 0.94344 | |
| Hospital 2 | Window 1 | 0.76599 | 0.58971 | 0.66467 | 0.67346 | |||
| Window 2 | 0.76536 | 0.77909 | 0.84856 | 0.79767 | ||||
| Window 3 | 0.78860 | 0.90136 | 0.80334 | 0.83110 | ||||
| Window 4 | 0.84149 | 0.80334 | 0.79600 | 0.81361 | ||||
| Average | 0.76599 | 0.67754 | 0.74412 | 0.86381 | 0.80334 | 0.79600 | 0.77513 | |
| Hospital 3 | Window 1 | 0.84930 | 0.78614 | 0.74684 | 0.79409 | |||
| Window 2 | 0.70845 | 0.69417 | 0.79675 | 0.73313 | ||||
| Window 3 | 0.80875 | 1.02819 | 0.67136 | 0.83610 | ||||
| Window 4 | 1.02819 | 0.65676 | 0.91871 | 0.86789 | ||||
| Average | 0.84930 | 0.74730 | 0.74992 | 0.95105 | 0.66406 | 0.91871 | 0.81339 | |
| Hospital 4 | Window 1 | 0.97566 | 1.17815 | 0.51691 | 0.89024 | |||
| Window 2 | 0.85698 | 0.66996 | 0.64963 | 0.72553 | ||||
| Window 3 | 0.70903 | 0.69538 | 1.07333 | 0.82592 | ||||
| Window 4 | 0.69538 | 1.07333 | 0.87532 | 0.88135 | ||||
| Average | 0.97566 | 1.01756 | 0.63197 | 0.68013 | 1.07333 | 0.87532 | 0.87566 | |
| Hospital 5 | Window 1 | 0.72663 | 0.58830 | 0.77593 | 0.69695 | |||
| Window 2 | 0.70306 | 0.71038 | 0.92217 | 0.77854 | ||||
| Window 3 | 0.77532 | 0.92217 | 0.70284 | 0.80011 | ||||
| Window 4 | 0.92217 | 0.69814 | 0.73120 | 0.78384 | ||||
| Average | 0.72663 | 0.64568 | 0.75388 | 0.92217 | 0.70049 | 0.73120 | 0.74667 | |
| Hospital 6 | Window 1 | 0.70096 | 1.35997 | 0.88505 | 0.98199 | |||
| Window 2 | 1.21642 | 0.67758 | 0.67899 | 0.85767 | ||||
| Window 3 | 0.75422 | 0.75772 | 0.84120 | 0.78438 | ||||
| Window 4 | 0.75772 | 0.84120 | 0.70724 | 0.76872 | ||||
| Average | 0.70096 | 1.28820 | 0.77228 | 0.73148 | 0.84120 | 0.70724 | 0.84023 |
| Hospitals | Windows | Period 1 | Period 2 | Period 3 | Period 4 | Period 5 | Period 6 | Average |
|---|---|---|---|---|---|---|---|---|
| Hospital 1 | Window 1 | 0.69760 | 1.24138 | 1.02792 | 0.98897 | |||
| Window 2 | 1.22791 | 0.82422 | 1.09454 | 1.04889 | ||||
| Window 3 | 0.83853 | 1.09454 | 0.62459 | 0.85255 | ||||
| Window 4 | 1.09303 | 0.61271 | 0.82642 | 0.84405 | ||||
| Average | 0.69760 | 1.23465 | 0.89689 | 1.09404 | 0.61865 | 0.82642 | 0.89471 | |
| Hospital 2 | Window 1 | 0.71131 | 0.58787 | 0.62037 | 0.63985 | |||
| Window 2 | 0.76536 | 0.77909 | 0.84856 | 0.79767 | ||||
| Window 3 | 0.78860 | 0.90136 | 0.79434 | 0.82810 | ||||
| Window 4 | 0.83877 | 0.79434 | 0.76787 | 0.80032 | ||||
| Average | 0.71131 | 0.67662 | 0.72935 | 0.86290 | 0.79434 | 0.76787 | 0.75706 | |
| Hospital 3 | Window 1 | 0.79269 | 0.73003 | 0.69353 | 0.73875 | |||
| Window 2 | 0.70845 | 0.69227 | 0.76802 | 0.72291 | ||||
| Window 3 | 0.79928 | 0.99947 | 0.67136 | 0.82337 | ||||
| Window 4 | 0.99947 | 0.65444 | 0.91313 | 0.85568 | ||||
| Average | 0.79269 | 0.71924 | 0.72836 | 0.92232 | 0.66290 | 0.91313 | 0.78977 | |
| Hospital 4 | Window 1 | 0.87205 | 1.08181 | 0.51384 | 0.82257 | |||
| Window 2 | 0.78525 | 0.66996 | 0.64775 | 0.70099 | ||||
| Window 3 | 0.70903 | 0.68752 | 0.98909 | 0.79521 | ||||
| Window 4 | 0.68752 | 0.98909 | 0.86502 | 0.84721 | ||||
| Average | 0.87205 | 0.93353 | 0.63095 | 0.67427 | 0.98909 | 0.86502 | 0.82748 | |
| Hospital 5 | Window 1 | 0.68342 | 0.58320 | 0.72055 | 0.66239 | |||
| Window 2 | 0.70306 | 0.70852 | 0.84498 | 0.75218 | ||||
| Window 3 | 0.76719 | 0.86784 | 0.70284 | 0.77929 | ||||
| Window 4 | 0.86784 | 0.69559 | 0.72565 | 0.76302 | ||||
| Average | 0.68342 | 0.64313 | 0.73209 | 0.86022 | 0.69921 | 0.72565 | 0.72395 | |
| Hospital 6 | Window 1 | 0.69947 | 1.19964 | 0.80189 | 0.90033 | |||
| Window 2 | 1.12348 | 0.63971 | 0.67718 | 0.81346 | ||||
| Window 3 | 0.73975 | 0.74888 | 0.83139 | 0.77334 | ||||
| Window 4 | 0.74888 | 0.83139 | 0.70537 | 0.76188 | ||||
| Average | 0.69947 | 1.16156 | 0.72712 | 0.72498 | 0.83139 | 0.70537 | 0.80831 |
| Hospitals | Windows | Period 1 | Period 2 | Period 3 | Period 4 | Period 5 | Period 6 | Average |
|---|---|---|---|---|---|---|---|---|
| Hospital 1 | Window 1 | 0.69760 | 1.00190 | 0.80556 | 0.83502 | |||
| Window 2 | 1.00190 | 0.71833 | 1.09243 | 0.93755 | ||||
| Window 3 | 0.82086 | 1.09243 | 0.62459 | 0.84596 | ||||
| Window 4 | 1.08775 | 0.60742 | 0.79939 | 0.83152 | ||||
| Average | 0.69760 | 1.00190 | 0.78158 | 1.09087 | 0.61601 | 0.79939 | 0.83122 | |
| Hospital 2 | Window 1 | 0.63949 | 0.58787 | 0.60378 | 0.61038 | |||
| Window 2 | 0.76536 | 0.77909 | 0.84856 | 0.79767 | ||||
| Window 3 | 0.78860 | 0.90136 | 0.77940 | 0.82312 | ||||
| Window 4 | 0.83388 | 0.77940 | 0.74863 | 0.78730 | ||||
| Average | 0.63949 | 0.67662 | 0.72382 | 0.86127 | 0.77940 | 0.74863 | 0.73821 | |
| Hospital 3 | Window 1 | 0.77150 | 0.65632 | 0.62351 | 0.68378 | |||
| Window 2 | 0.70845 | 0.68832 | 0.76802 | 0.72159 | ||||
| Window 3 | 0.78390 | 0.97207 | 0.67136 | 0.80911 | ||||
| Window 4 | 0.96738 | 0.65255 | 0.89908 | 0.83967 | ||||
| Average | 0.77150 | 0.68239 | 0.69858 | 0.90249 | 0.66195 | 0.89908 | 0.76933 | |
| Hospital 4 | Window 1 | 0.66585 | 0.88611 | 0.51384 | 0.68860 | |||
| Window 2 | 0.69212 | 0.66996 | 0.64347 | 0.66851 | ||||
| Window 3 | 0.70903 | 0.67378 | 0.92848 | 0.77043 | ||||
| Window 4 | 0.67378 | 0.92760 | 0.84895 | 0.81678 | ||||
| Average | 0.66585 | 0.78911 | 0.63095 | 0.66367 | 0.92804 | 0.84895 | 0.75443 | |
| Hospital 5 | Window 1 | 0.57909 | 0.58320 | 0.64780 | 0.60336 | |||
| Window 2 | 0.70306 | 0.70590 | 0.72061 | 0.70986 | ||||
| Window 3 | 0.75944 | 0.83768 | 0.70284 | 0.76665 | ||||
| Window 4 | 0.83768 | 0.68944 | 0.71322 | 0.74678 | ||||
| Average | 0.57909 | 0.64313 | 0.70438 | 0.79865 | 0.69614 | 0.71322 | 0.68910 | |
| Hospital 6 | Window 1 | 0.69899 | 0.90918 | 0.61228 | 0.74015 | |||
| Window 2 | 0.94415 | 0.63280 | 0.67358 | 0.75017 | ||||
| Window 3 | 0.71553 | 0.73910 | 0.80667 | 0.75377 | ||||
| Window 4 | 0.73910 | 0.80667 | 0.70318 | 0.74965 | ||||
| Average | 0.69899 | 0.92666 | 0.65354 | 0.71726 | 0.80667 | 0.70318 | 0.75105 |
| Hospitals | Windows | Period 1 | Period 2 | Period 3 | Period 4 | Period 5 | Period 6 | Average |
|---|---|---|---|---|---|---|---|---|
| Hospital 1 | Window 1 | 0.69760 | 1.00190 | 0.73585 | 0.81178 | |||
| Window 2 | 1.00190 | 0.71181 | 1.09102 | 0.93491 | ||||
| Window 3 | 0.80431 | 1.09102 | 0.62459 | 0.83997 | ||||
| Window 4 | 1.08277 | 0.60583 | 0.78949 | 0.82603 | ||||
| Average | 0.69760 | 1.00190 | 0.75065 | 1.08827 | 0.61521 | 0.78949 | 0.82385 | |
| Hospital 2 | Window 1 | 0.60773 | 0.58787 | 0.60321 | 0.59960 | |||
| Window 2 | 0.76536 | 0.77909 | 0.84856 | 0.79767 | ||||
| Window 3 | 0.78860 | 0.90136 | 0.77393 | 0.82130 | ||||
| Window 4 | 0.83388 | 0.77393 | 0.73845 | 0.78209 | ||||
| Average | 0.60773 | 0.67662 | 0.72363 | 0.86127 | 0.77393 | 0.73845 | 0.73027 | |
| Hospital 3 | Window 1 | 0.77076 | 0.62373 | 0.59254 | 0.66234 | |||
| Window 2 | 0.70845 | 0.68730 | 0.76802 | 0.72126 | ||||
| Window 3 | 0.77646 | 0.96714 | 0.67136 | 0.80499 | ||||
| Window 4 | 0.95626 | 0.65255 | 0.89908 | 0.83597 | ||||
| Average | 0.77076 | 0.66609 | 0.68543 | 0.89714 | 0.66195 | 0.89908 | 0.76341 | |
| Hospital 4 | Window 1 | 0.63418 | 0.80132 | 0.51384 | 0.64978 | |||
| Window 2 | 0.68733 | 0.66996 | 0.64347 | 0.66692 | ||||
| Window 3 | 0.70903 | 0.67118 | 0.88602 | 0.75541 | ||||
| Window 4 | 0.67001 | 0.88235 | 0.83758 | 0.79665 | ||||
| Average | 0.63418 | 0.74432 | 0.63095 | 0.66155 | 0.88419 | 0.83758 | 0.73213 | |
| Hospital 5 | Window 1 | 0.57905 | 0.58320 | 0.61563 | 0.59262 | |||
| Window 2 | 0.70306 | 0.70590 | 0.68771 | 0.69889 | ||||
| Window 3 | 0.75505 | 0.80979 | 0.70284 | 0.75590 | ||||
| Window 4 | 0.80979 | 0.68913 | 0.71020 | 0.73638 | ||||
| Average | 0.57905 | 0.64313 | 0.69219 | 0.76910 | 0.69599 | 0.71020 | 0.68161 | |
| Hospital 6 | Window 1 | 0.69899 | 0.89414 | 0.58315 | 0.72543 | |||
| Window 2 | 0.94415 | 0.63096 | 0.67309 | 0.74940 | ||||
| Window 3 | 0.70689 | 0.73466 | 0.80667 | 0.74941 | ||||
| Window 4 | 0.73466 | 0.80667 | 0.70318 | 0.74817 | ||||
| Average | 0.69899 | 0.91914 | 0.64033 | 0.71414 | 0.80667 | 0.70318 | 0.74708 |
| Hospitals | Windows | Period 1 | Period 2 | Period 3 | Period 4 | Period 5 | Period 6 | Average |
|---|---|---|---|---|---|---|---|---|
| Hospital 1 | Window 1 | 0.69760 | 1.00190 | 0.70248 | 0.80066 | |||
| Window 2 | 1.00190 | 0.70787 | 1.09102 | 0.93359 | ||||
| Window 3 | 0.78884 | 1.09102 | 0.62459 | 0.83482 | ||||
| Window 4 | 1.07789 | 0.60583 | 0.78435 | 0.82269 | ||||
| Average | 0.69760 | 1.00190 | 0.73306 | 1.08664 | 0.61521 | 0.78435 | 0.81979 | |
| Hospital 2 | Window 1 | 0.59238 | 0.58787 | 0.60321 | 0.59449 | |||
| Window 2 | 0.76536 | 0.77909 | 0.84856 | 0.79767 | ||||
| Window 3 | 0.78860 | 0.90136 | 0.76922 | 0.81973 | ||||
| Window 4 | 0.83388 | 0.76922 | 0.72866 | 0.77725 | ||||
| Average | 0.59238 | 0.67662 | 0.72363 | 0.86127 | 0.76922 | 0.72866 | 0.72530 | |
| Hospital 3 | Window 1 | 0.77076 | 0.59200 | 0.57577 | 0.64618 | |||
| Window 2 | 0.70845 | 0.68730 | 0.76802 | 0.72126 | ||||
| Window 3 | 0.77173 | 0.96714 | 0.67136 | 0.80341 | ||||
| Window 4 | 0.95626 | 0.65255 | 0.89908 | 0.83597 | ||||
| Average | 0.77076 | 0.65022 | 0.67827 | 0.89714 | 0.66195 | 0.89908 | 0.75957 | |
| Hospital 4 | Window 1 | 0.60370 | 0.72576 | 0.51384 | 0.61443 | |||
| Window 2 | 0.68530 | 0.66996 | 0.64347 | 0.66624 | ||||
| Window 3 | 0.70903 | 0.67118 | 0.84924 | 0.74315 | ||||
| Window 4 | 0.66676 | 0.83927 | 0.82930 | 0.77844 | ||||
| Average | 0.60370 | 0.70553 | 0.63095 | 0.66047 | 0.84425 | 0.82930 | 0.71237 | |
| Hospital 5 | Window 1 | 0.57905 | 0.58320 | 0.58431 | 0.58219 | |||
| Window 2 | 0.70306 | 0.70590 | 0.68497 | 0.69798 | ||||
| Window 3 | 0.75294 | 0.79896 | 0.70284 | 0.75158 | ||||
| Window 4 | 0.79896 | 0.68913 | 0.71020 | 0.73276 | ||||
| Average | 0.57905 | 0.64313 | 0.68105 | 0.76096 | 0.69599 | 0.71020 | 0.67840 | |
| Hospital 6 | Window 1 | 0.69899 | 0.89366 | 0.55470 | 0.71578 | |||
| Window 2 | 0.94415 | 0.62916 | 0.67309 | 0.74880 | ||||
| Window 3 | 0.70230 | 0.73019 | 0.80667 | 0.74639 | ||||
| Window 4 | 0.73019 | 0.80667 | 0.70318 | 0.74668 | ||||
| Average | 0.69899 | 0.91890 | 0.62872 | 0.71116 | 0.80667 | 0.70318 | 0.74460 |
Publisher’s Note: MDPI stays neutral with regard to jurisdictional claims in published maps and institutional affiliations. |
© 2022 by the authors. Licensee MDPI, Basel, Switzerland. This article is an open access article distributed under the terms and conditions of the Creative Commons Attribution (CC BY) license (https://creativecommons.org/licenses/by/4.0/).
Share and Cite
Peykani, P.; Memar-Masjed, E.; Arabjazi, N.; Mirmozaffari, M. Dynamic Performance Assessment of Hospitals by Applying Credibility-Based Fuzzy Window Data Envelopment Analysis. Healthcare 2022, 10, 876. https://doi.org/10.3390/healthcare10050876
Peykani P, Memar-Masjed E, Arabjazi N, Mirmozaffari M. Dynamic Performance Assessment of Hospitals by Applying Credibility-Based Fuzzy Window Data Envelopment Analysis. Healthcare. 2022; 10(5):876. https://doi.org/10.3390/healthcare10050876
Chicago/Turabian StylePeykani, Pejman, Elaheh Memar-Masjed, Nasim Arabjazi, and Mirpouya Mirmozaffari. 2022. "Dynamic Performance Assessment of Hospitals by Applying Credibility-Based Fuzzy Window Data Envelopment Analysis" Healthcare 10, no. 5: 876. https://doi.org/10.3390/healthcare10050876
APA StylePeykani, P., Memar-Masjed, E., Arabjazi, N., & Mirmozaffari, M. (2022). Dynamic Performance Assessment of Hospitals by Applying Credibility-Based Fuzzy Window Data Envelopment Analysis. Healthcare, 10(5), 876. https://doi.org/10.3390/healthcare10050876