
Stateful-Service-Based Pupil Recognition in Natural Light Environments


Abstract
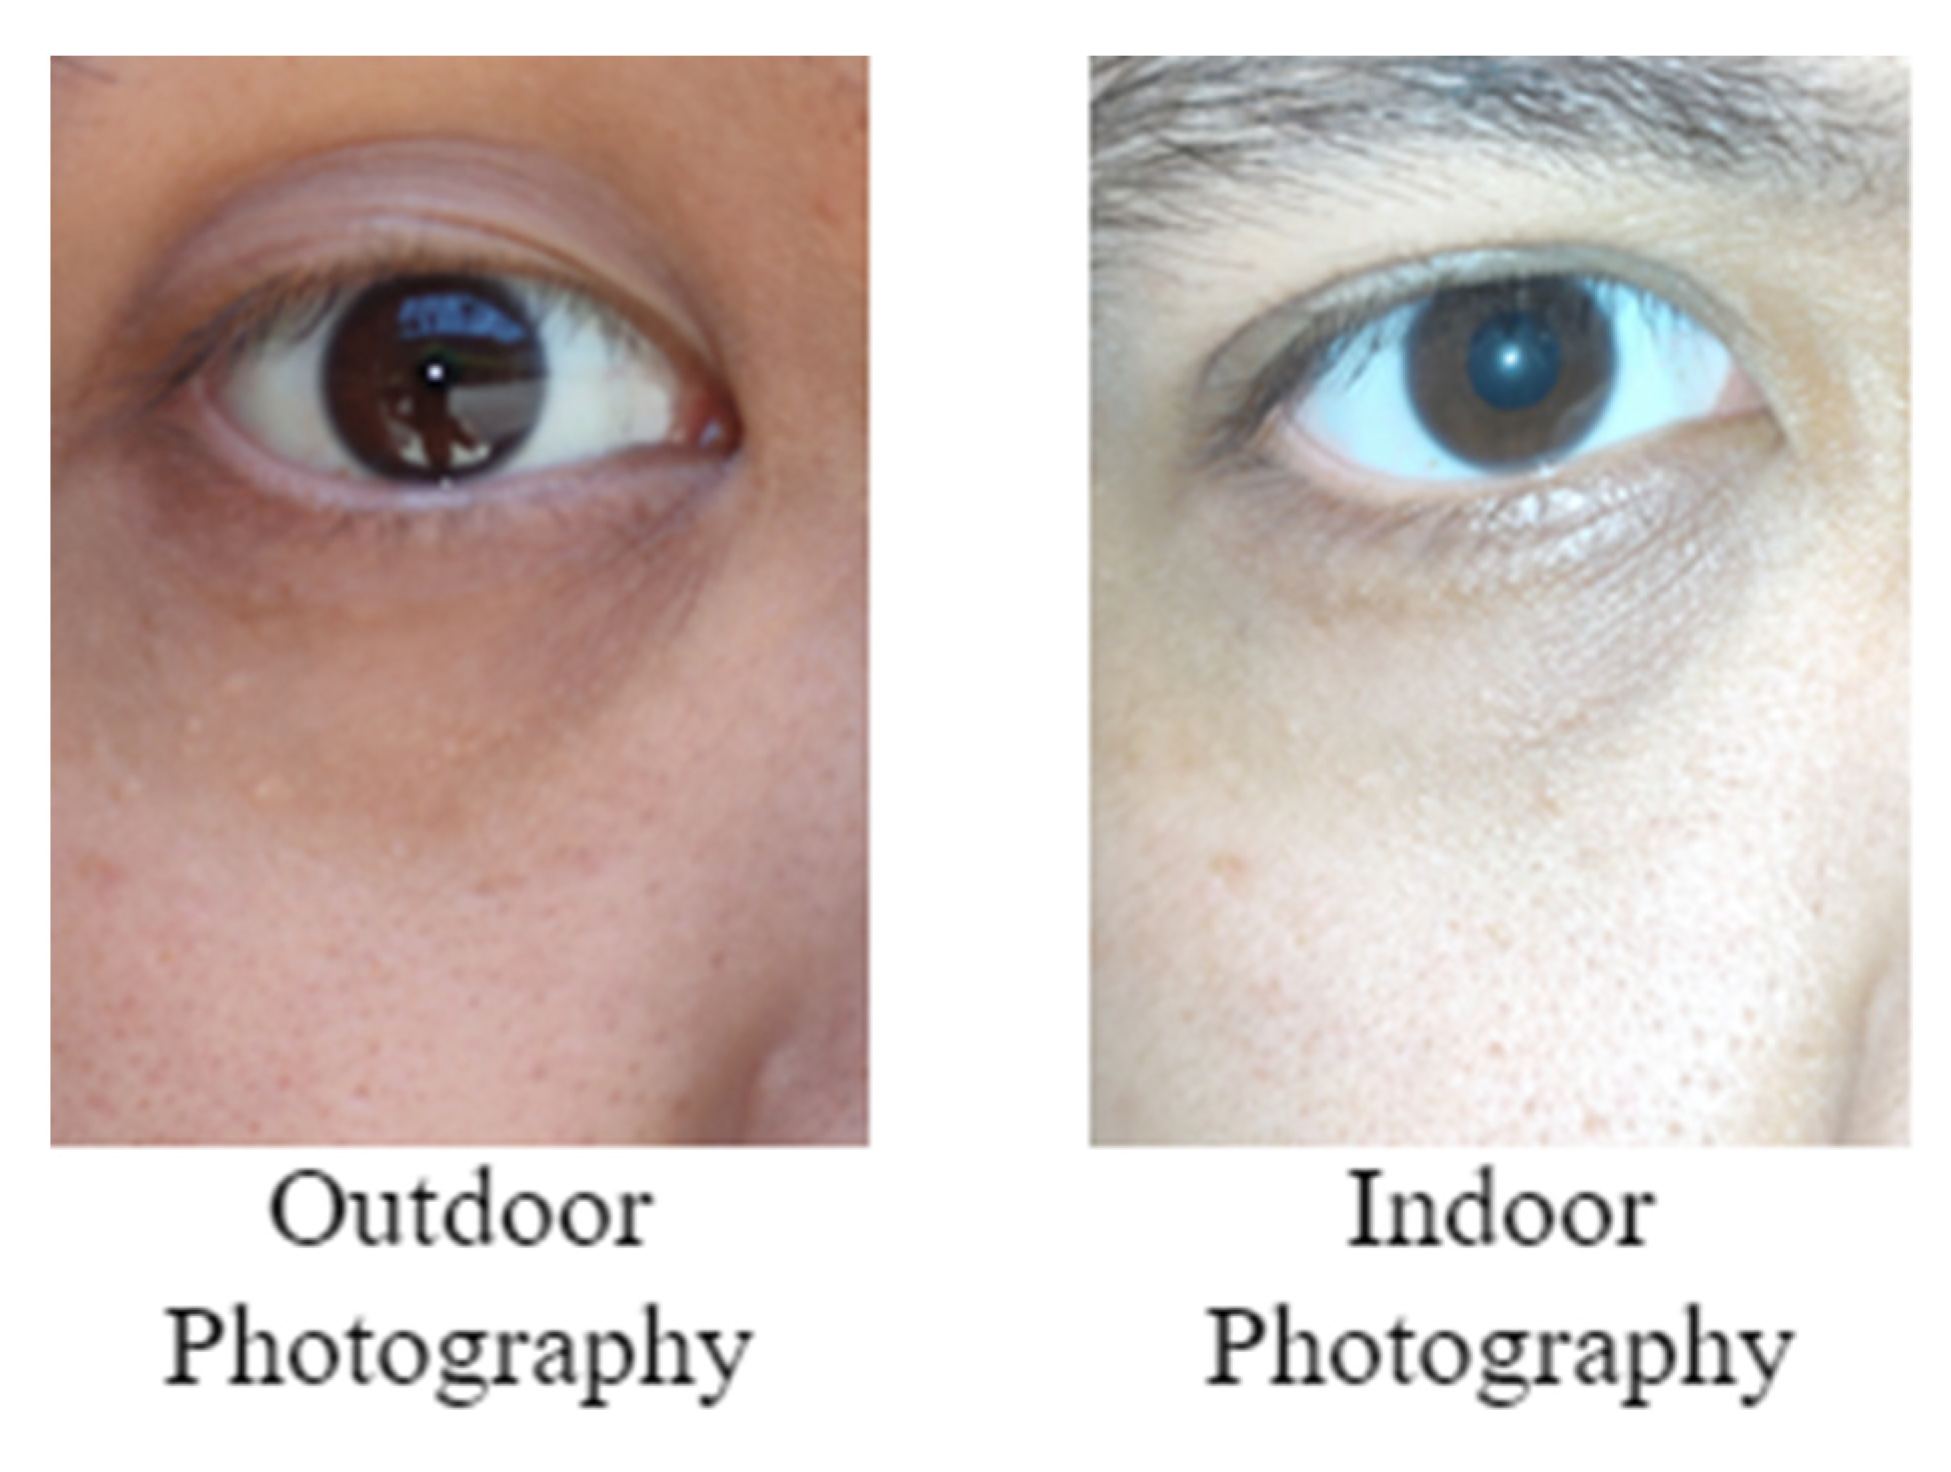
:1. Introduction
2. Related Work
2.1. Image Recognition
2.2. Mathematical Morphology
2.3. Image Analysis
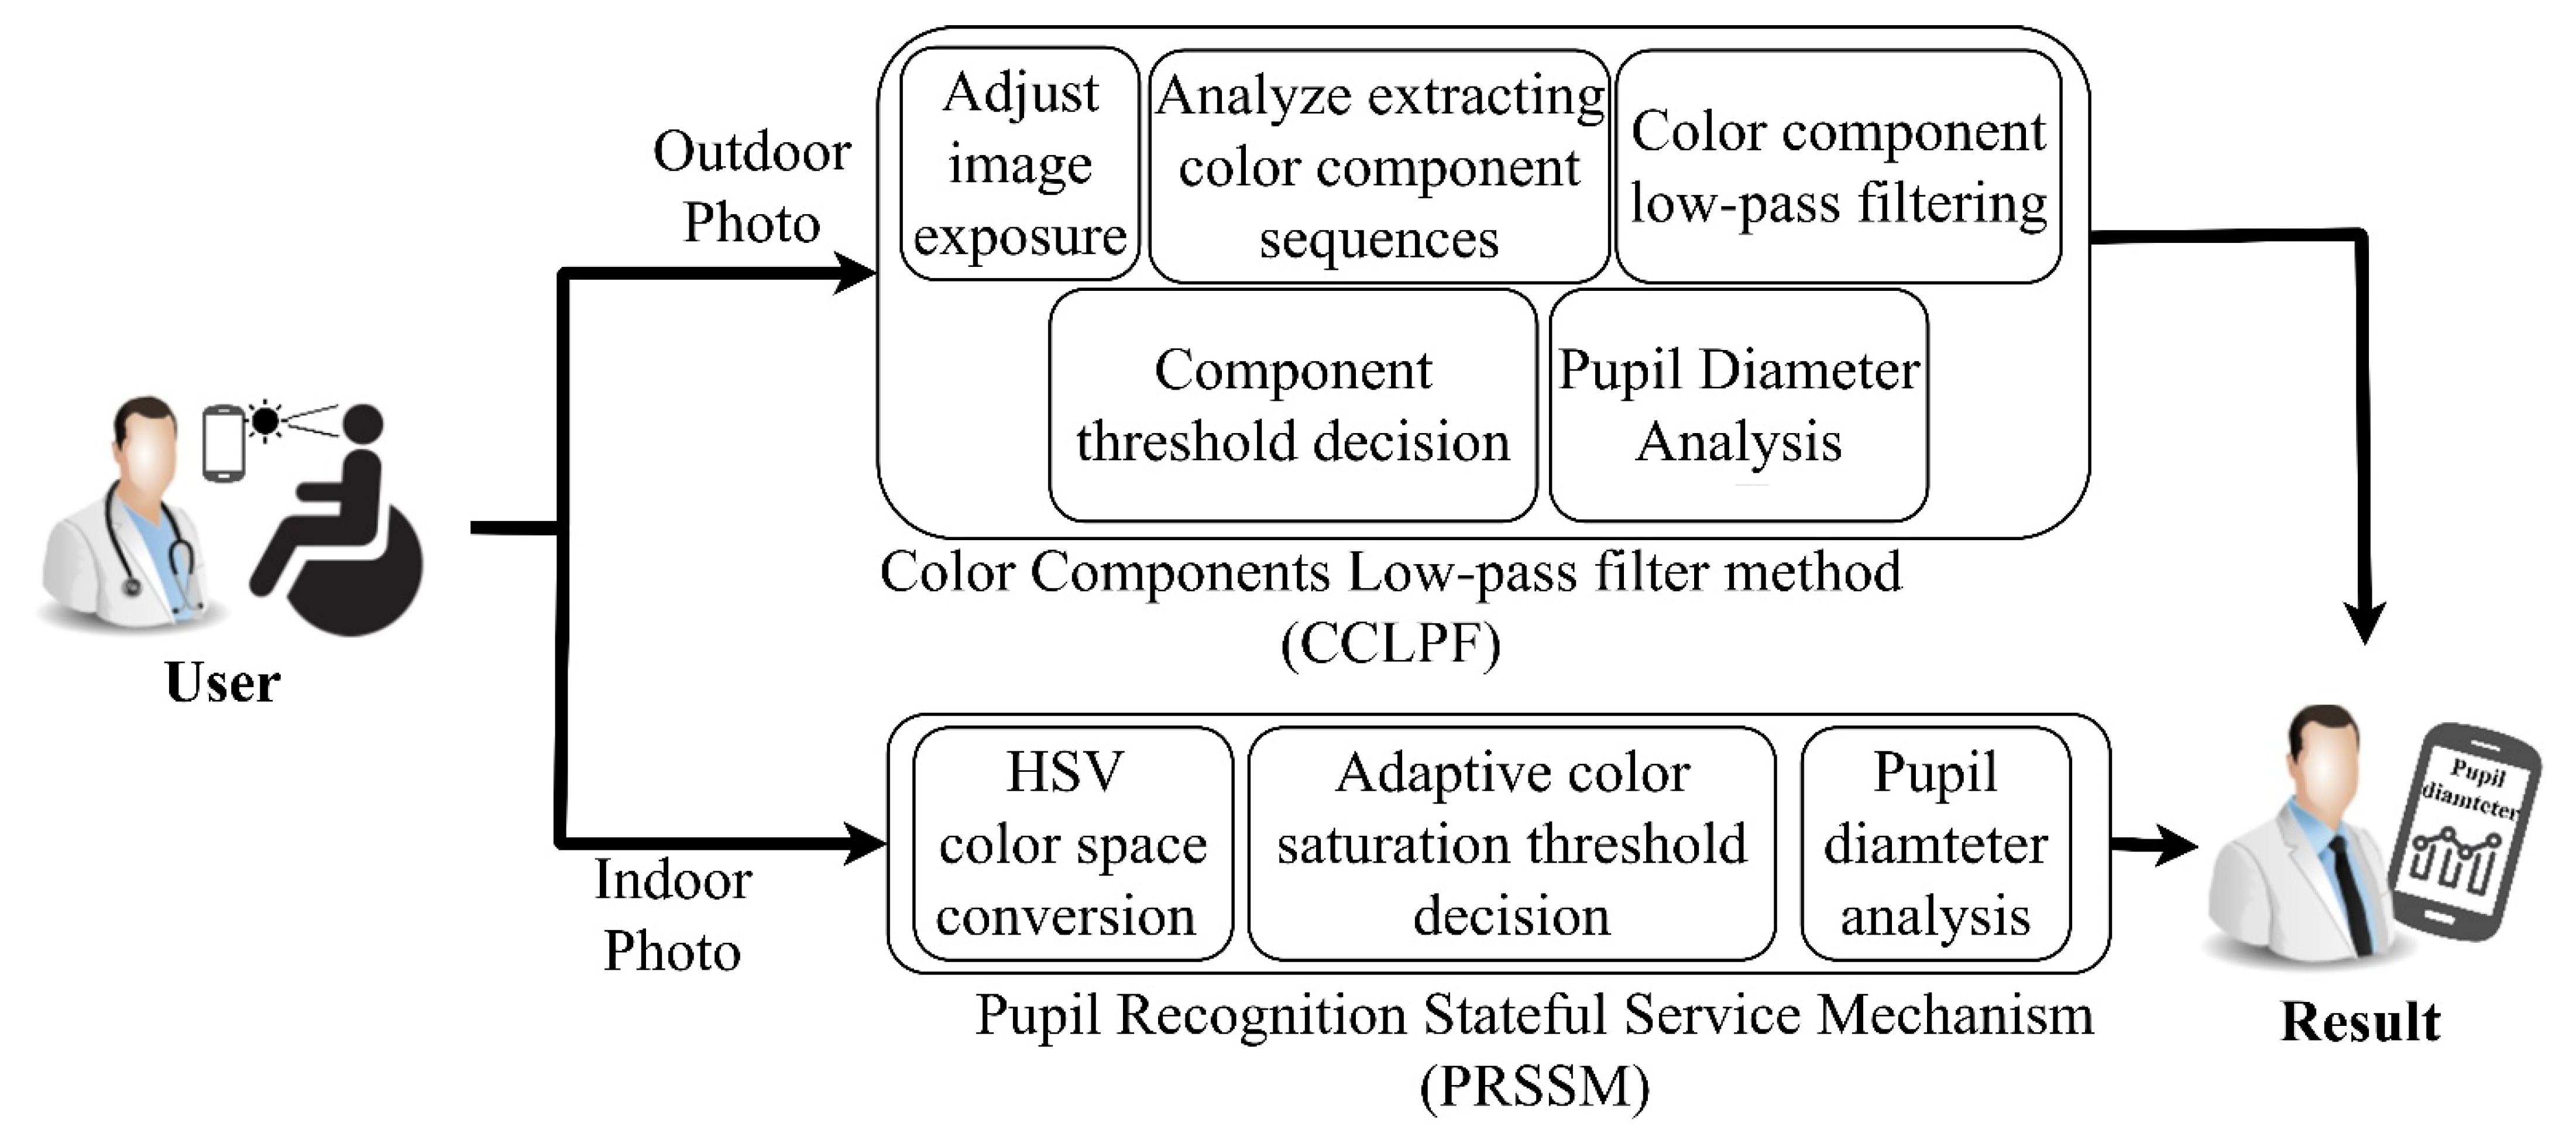
3. Proposed System
3.1. CCLPF Algorithm
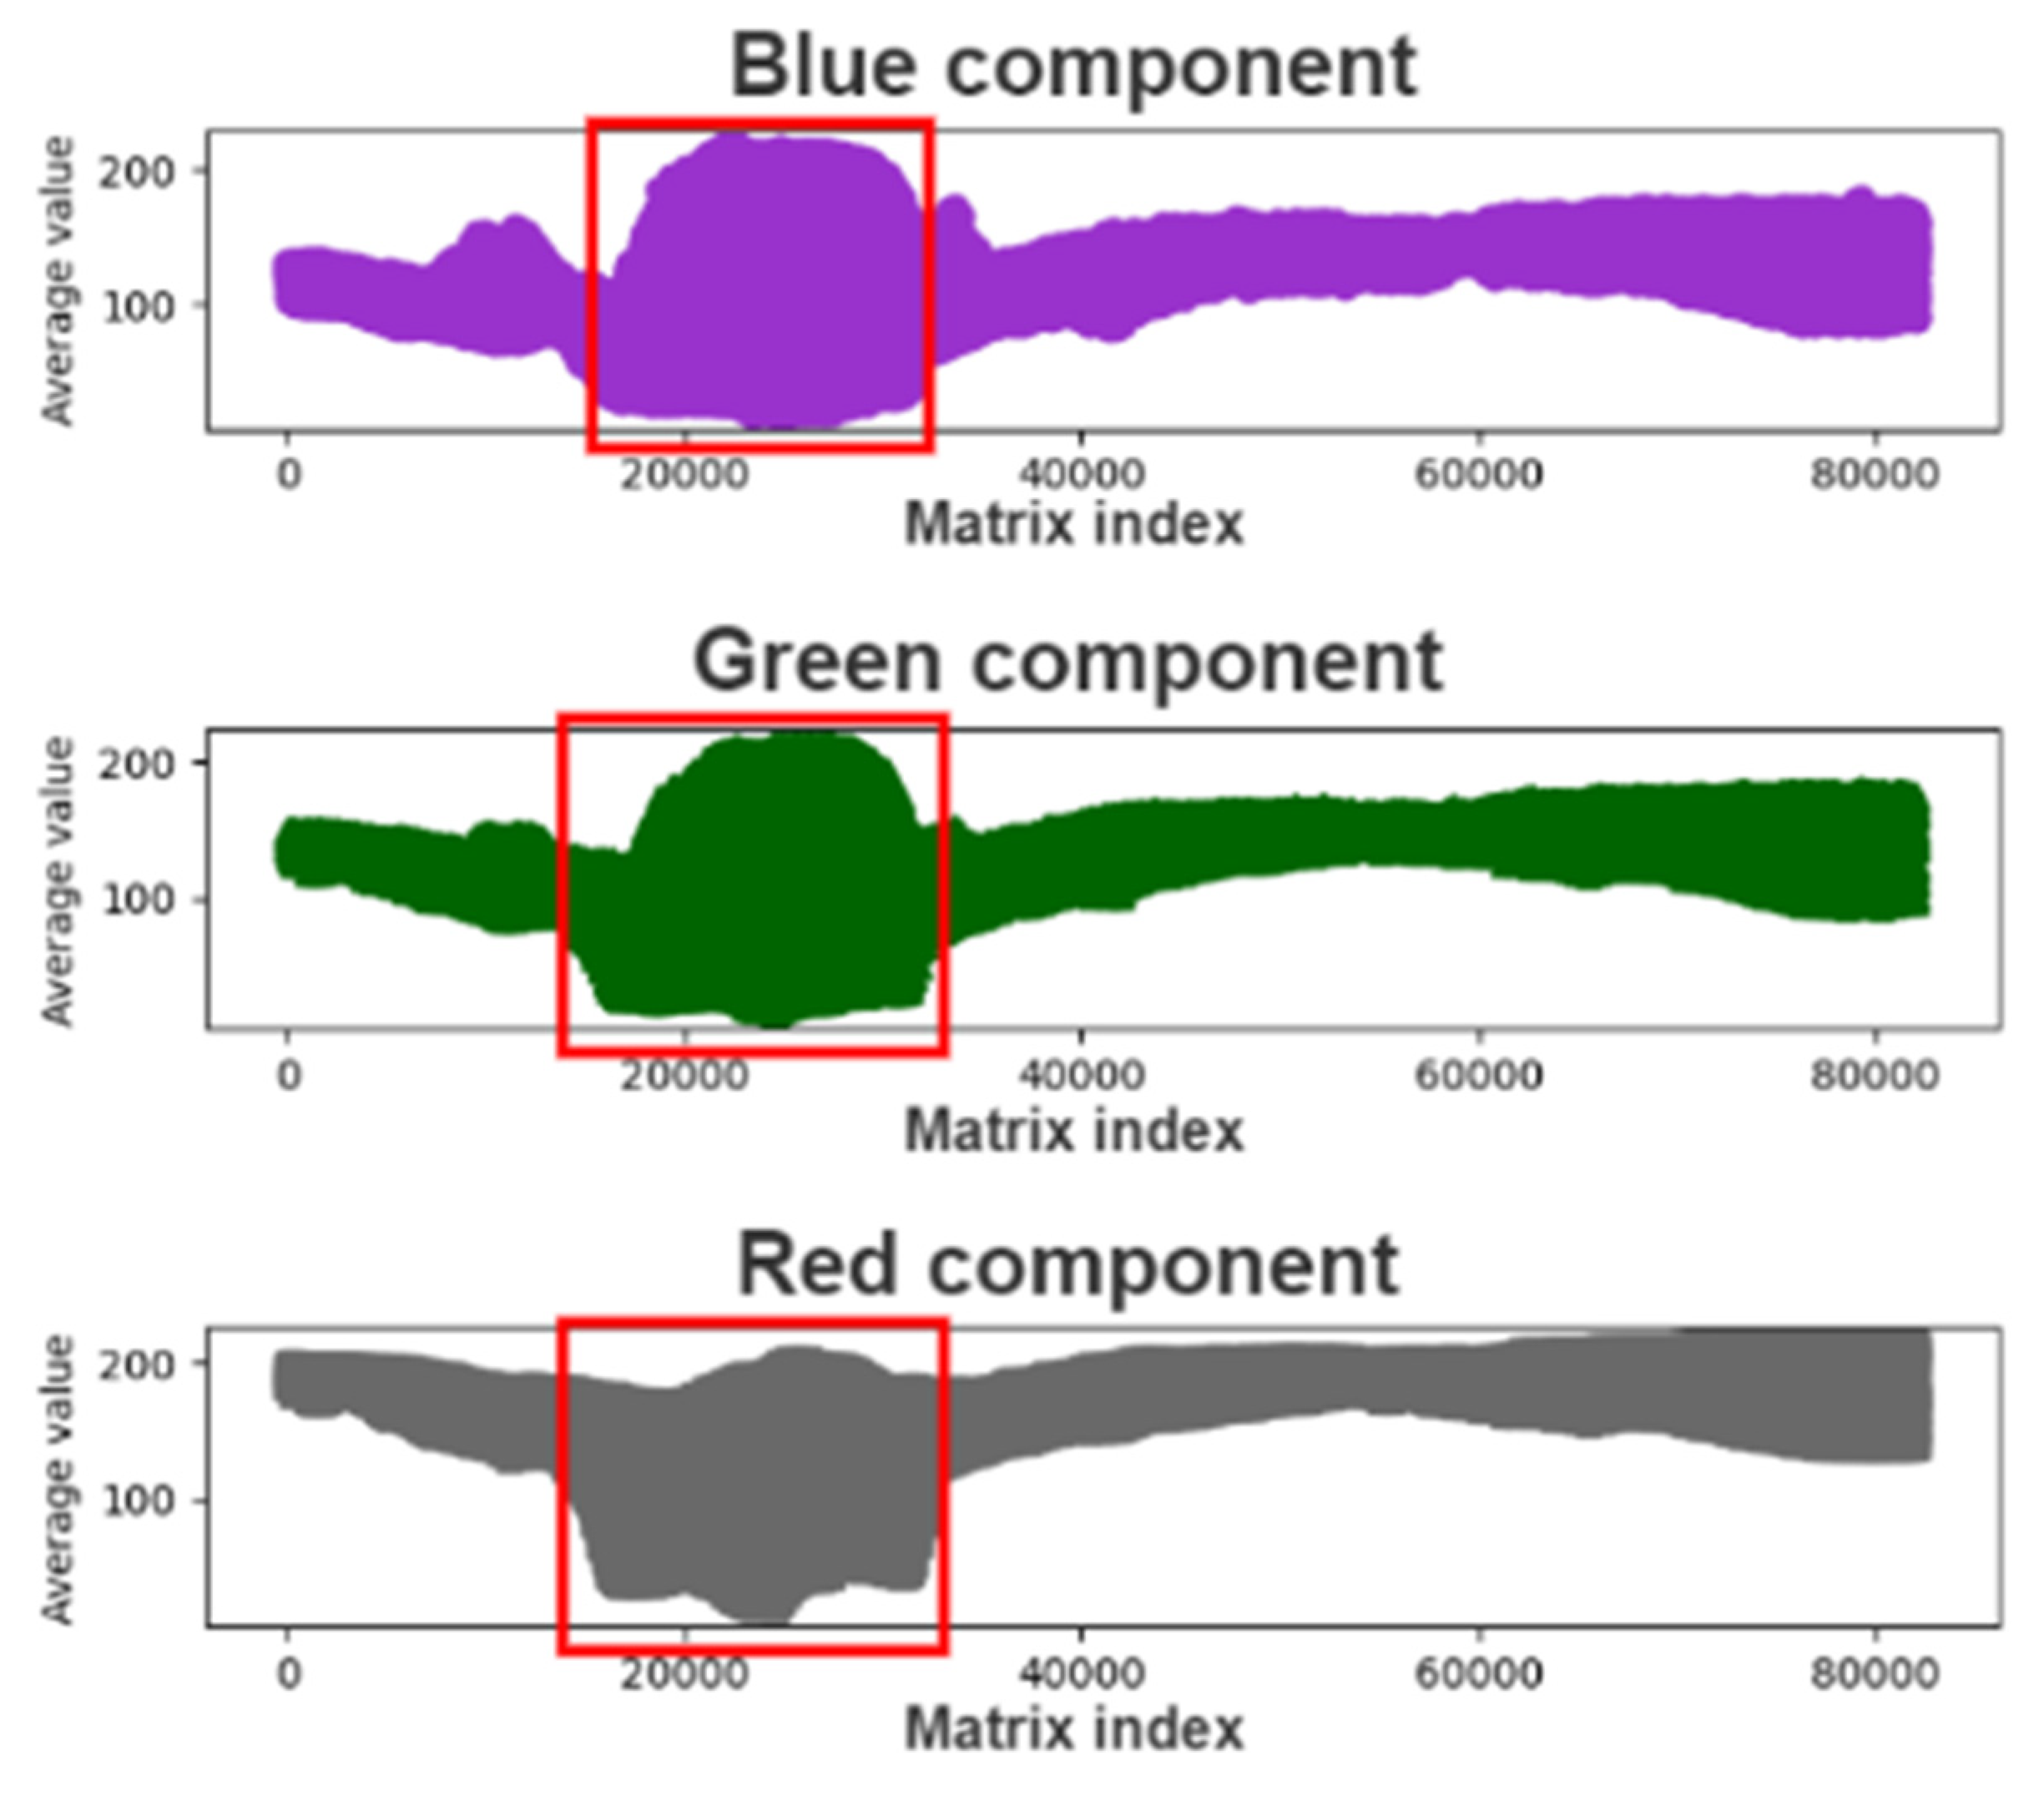
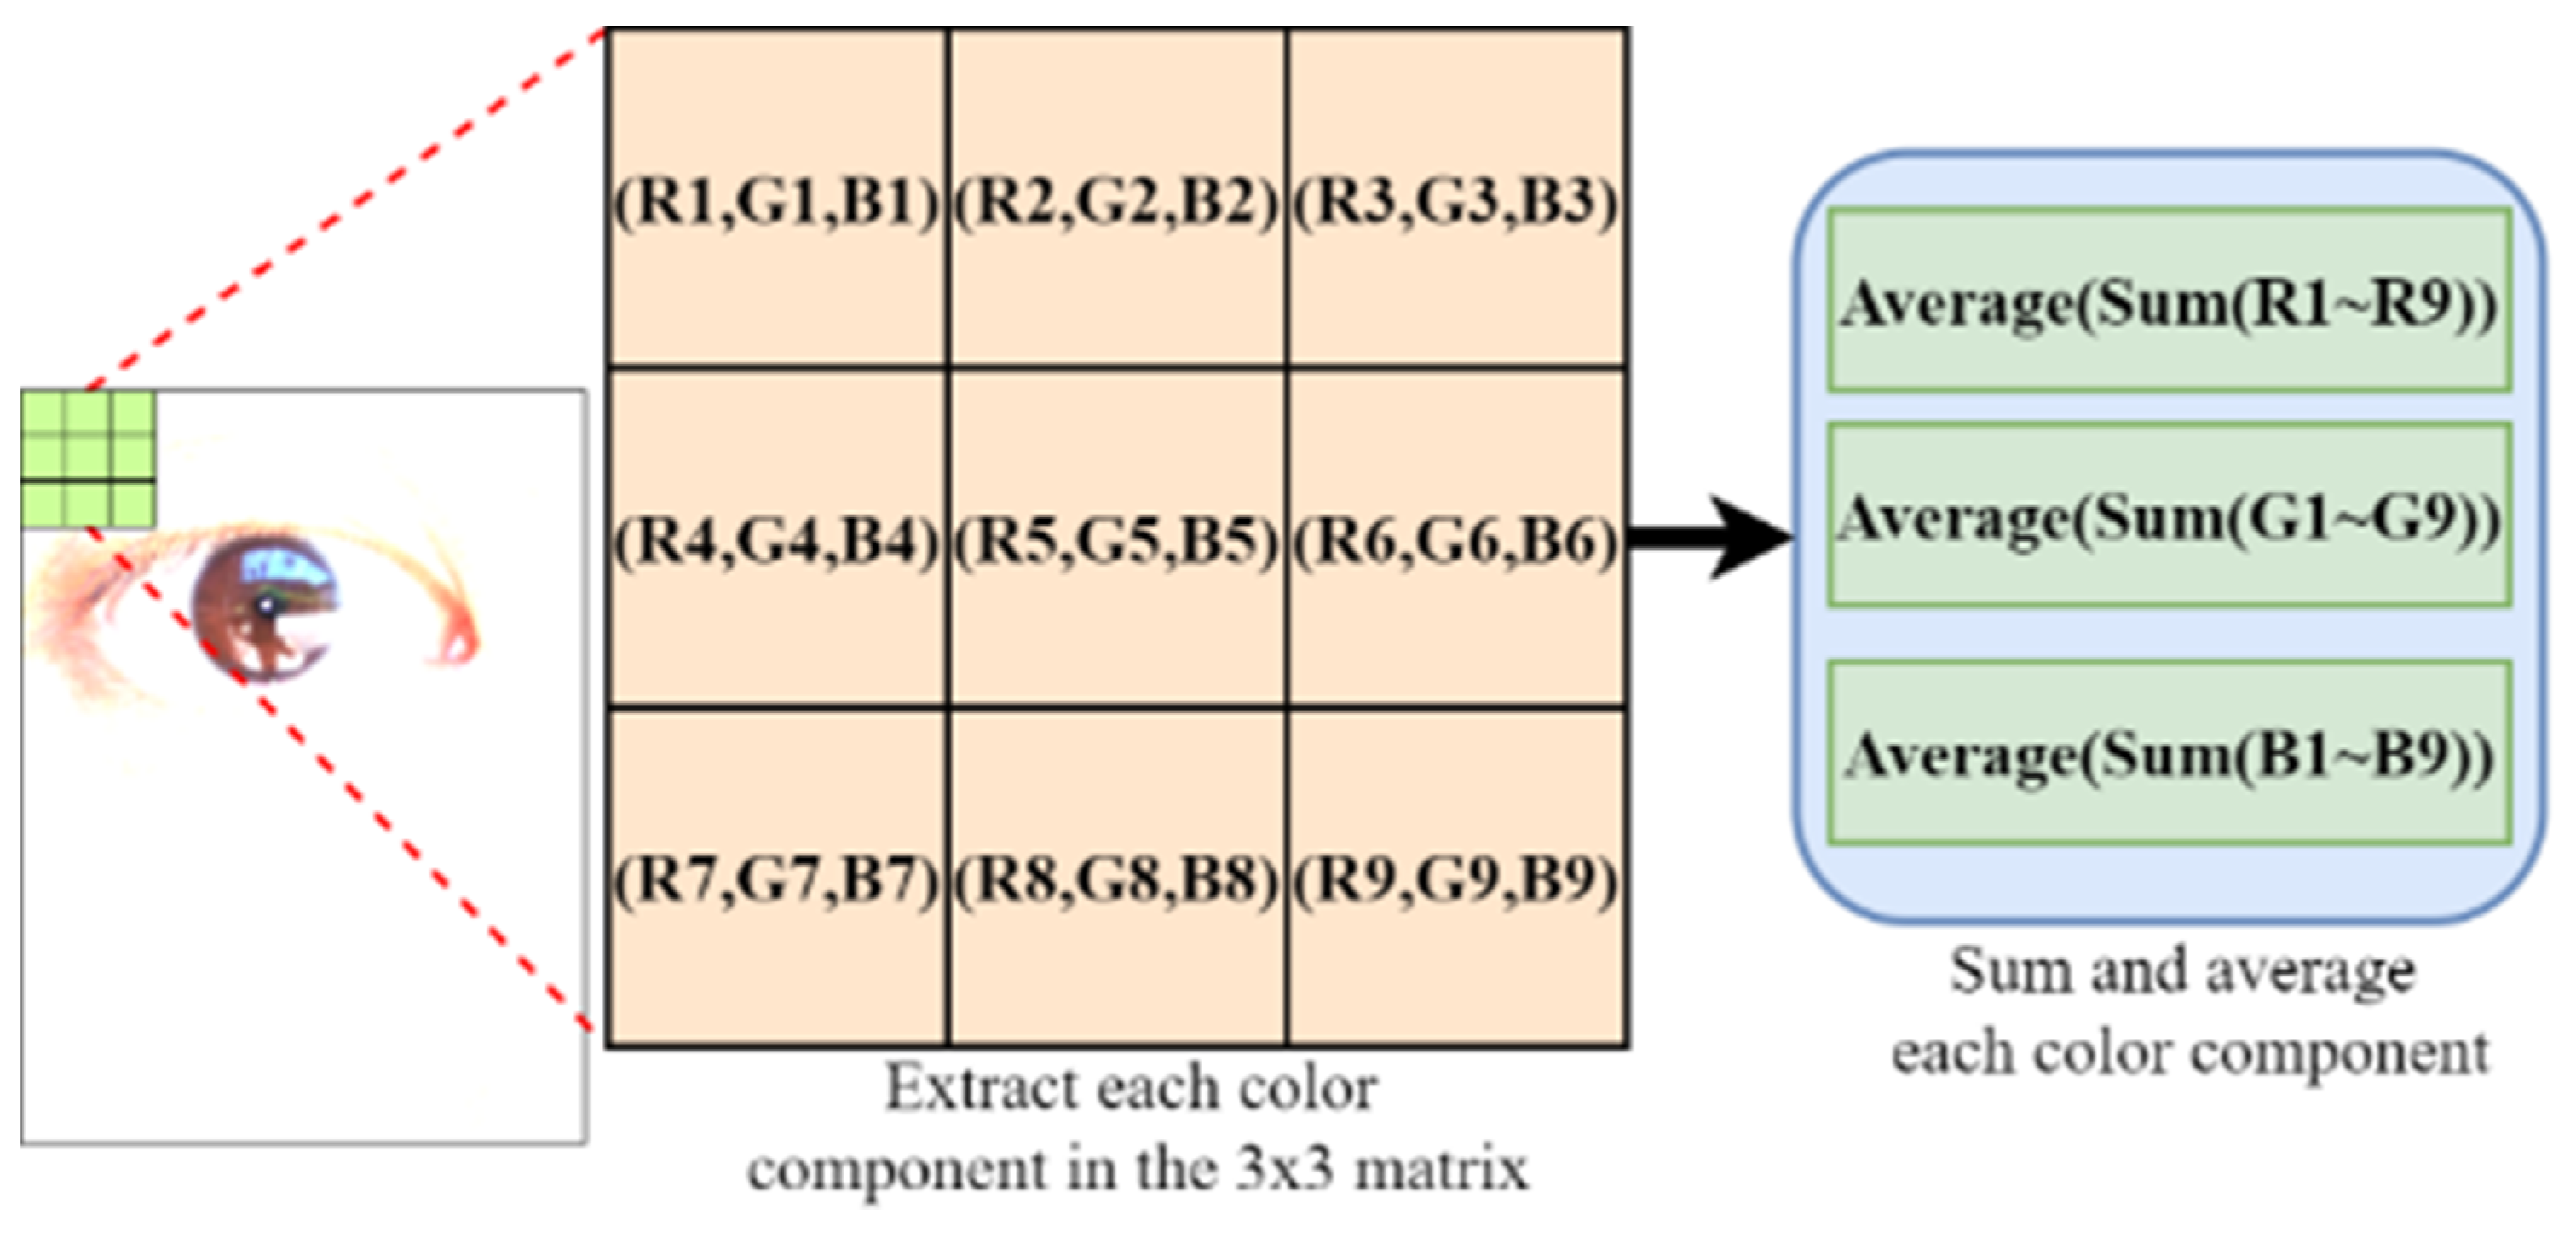
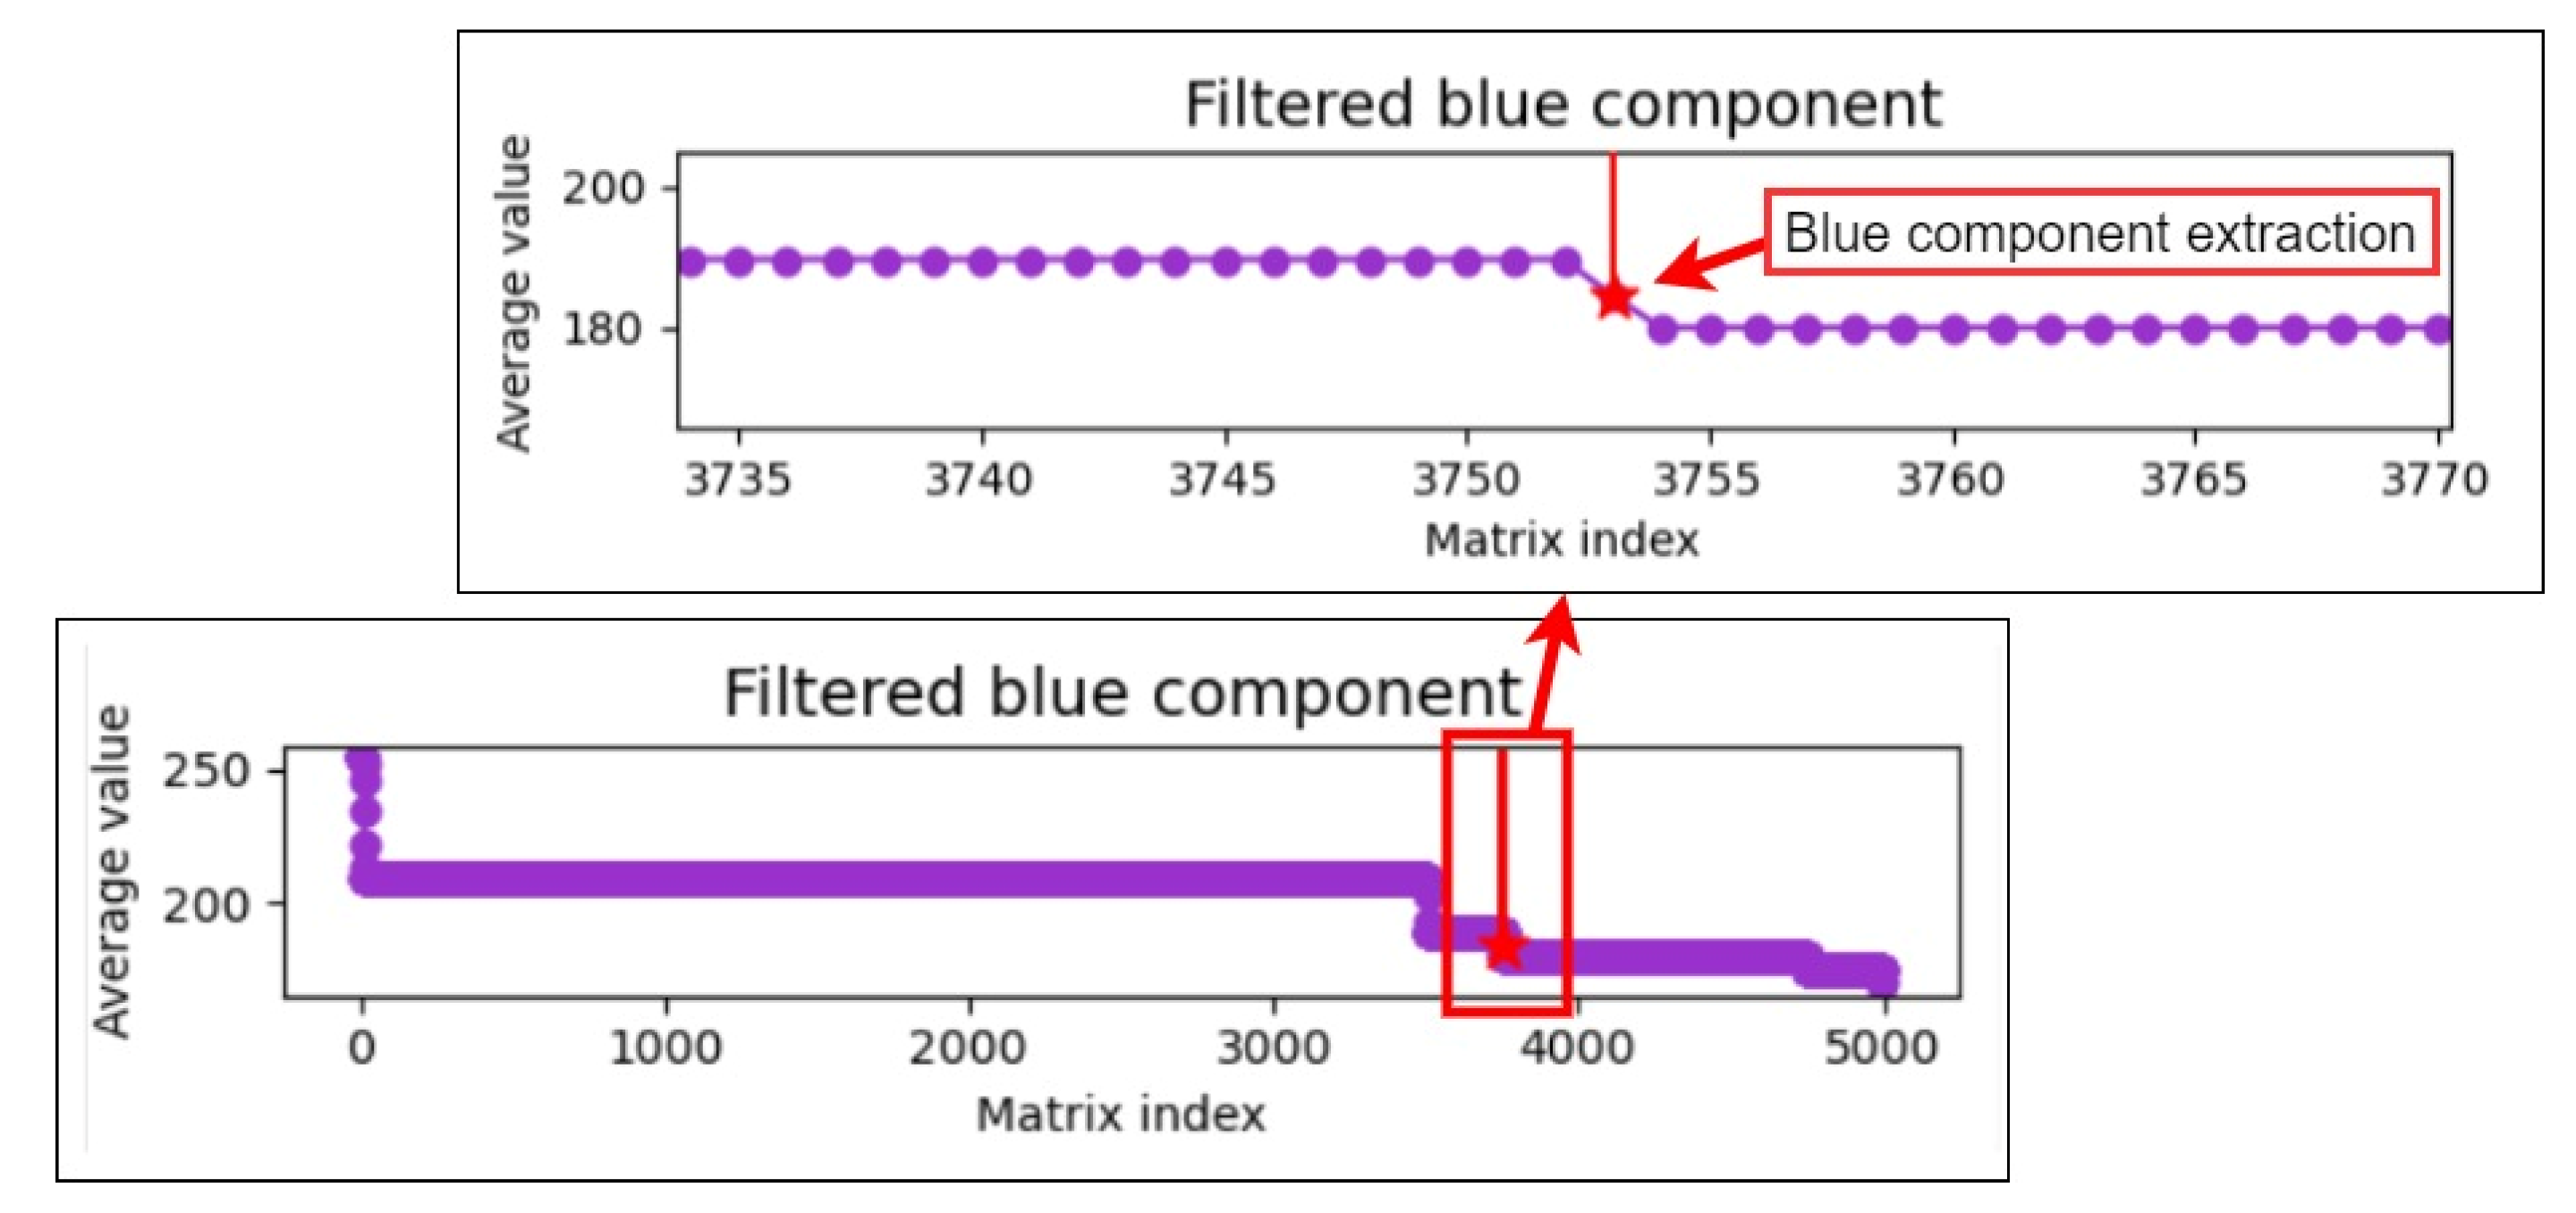
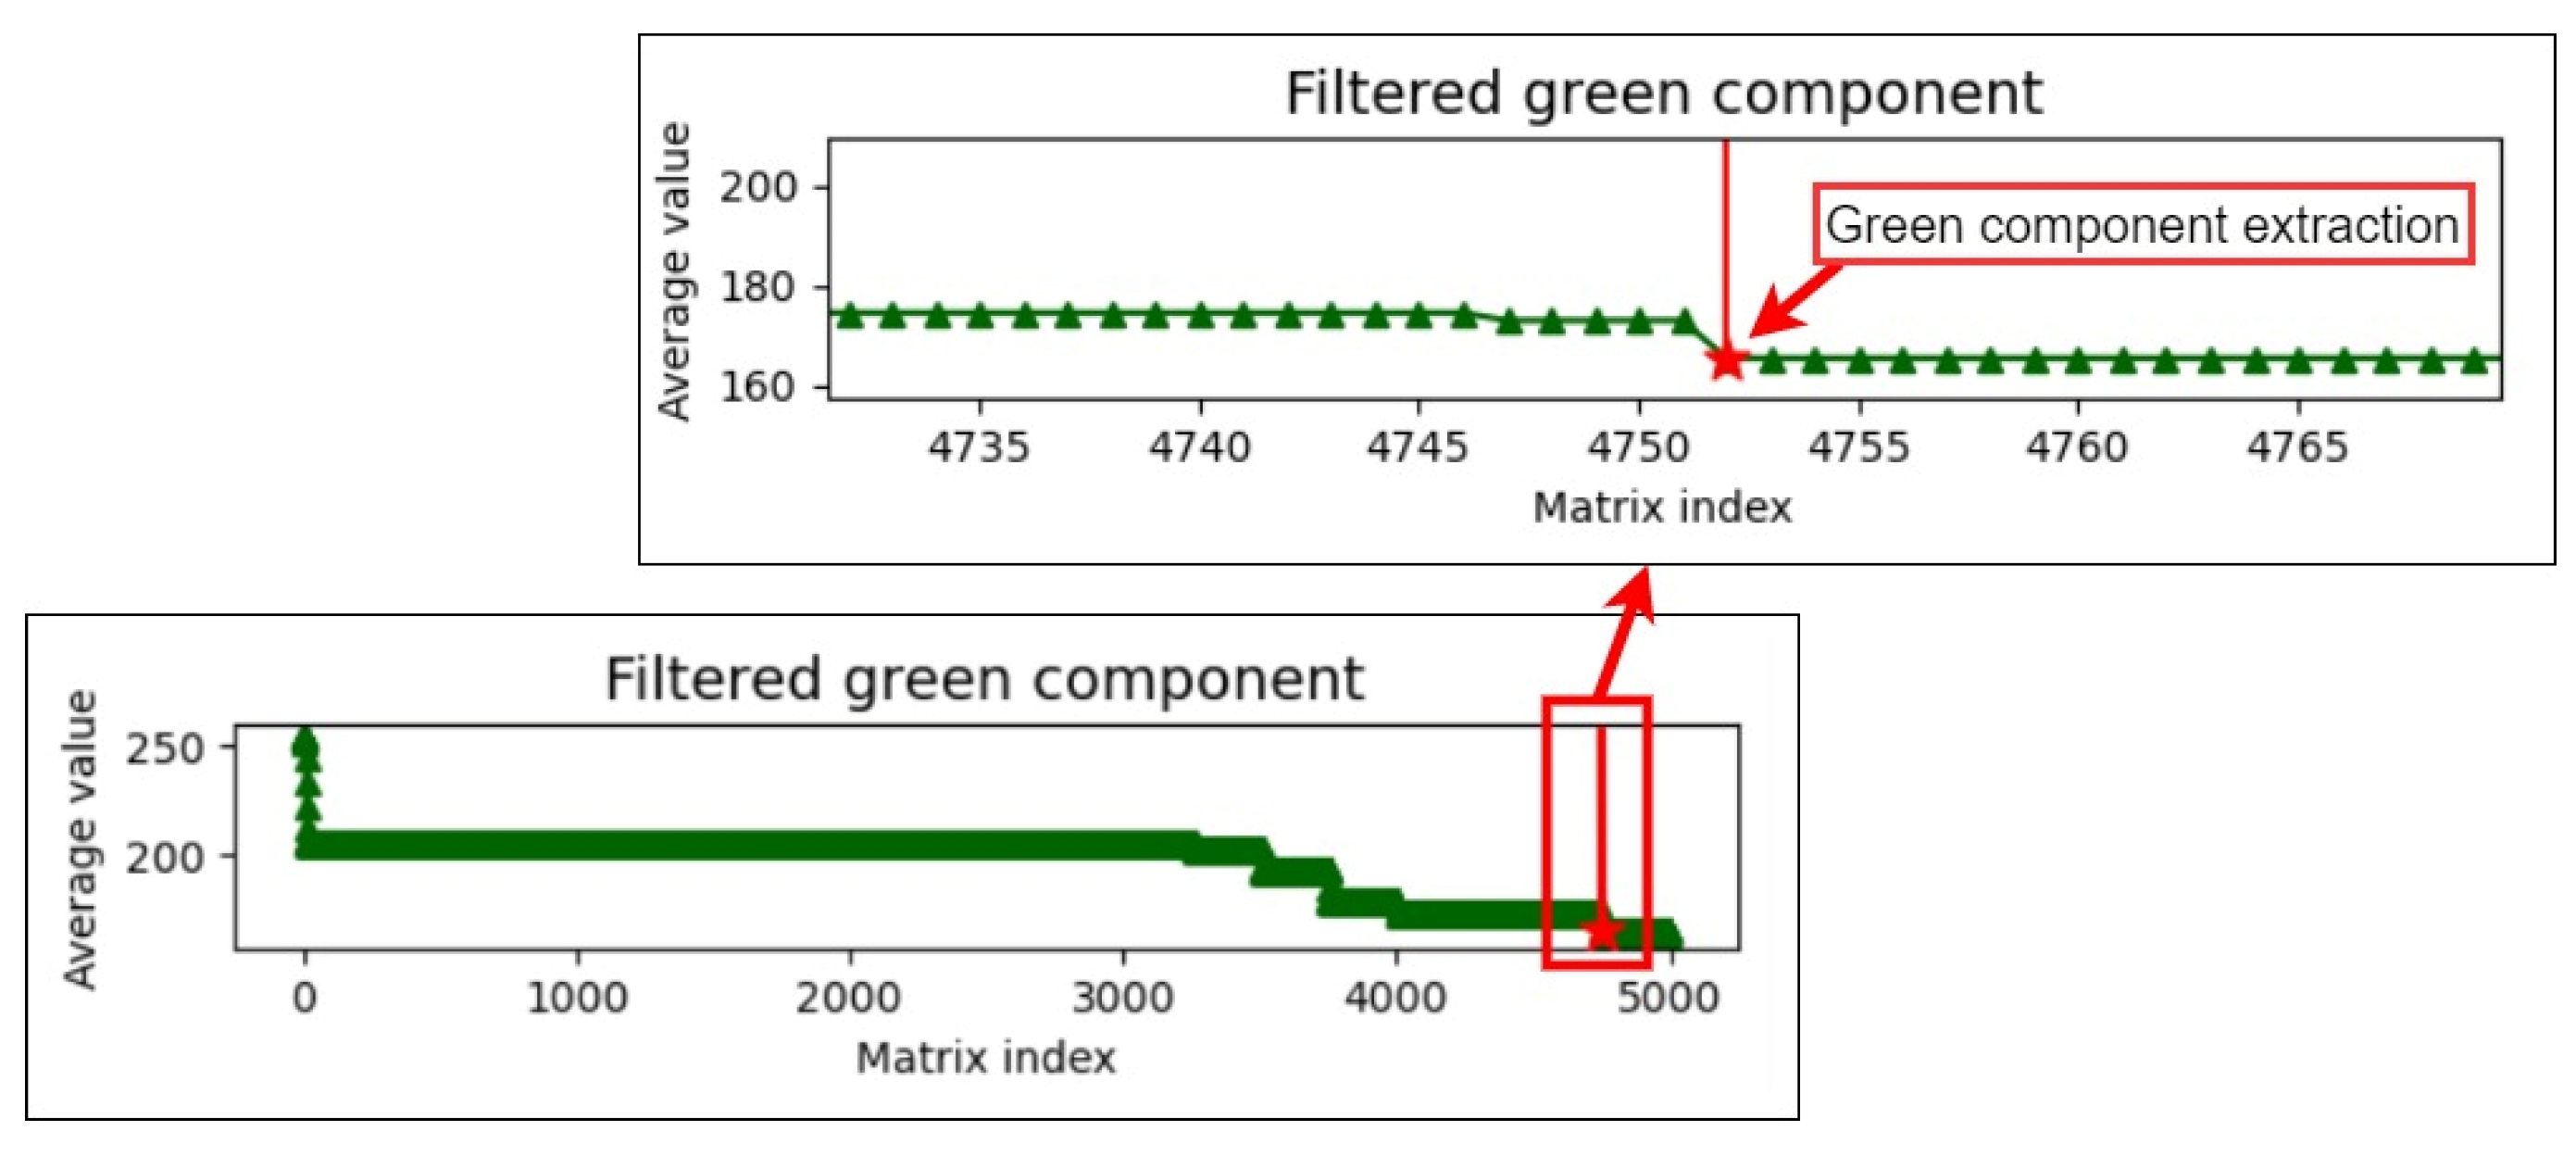
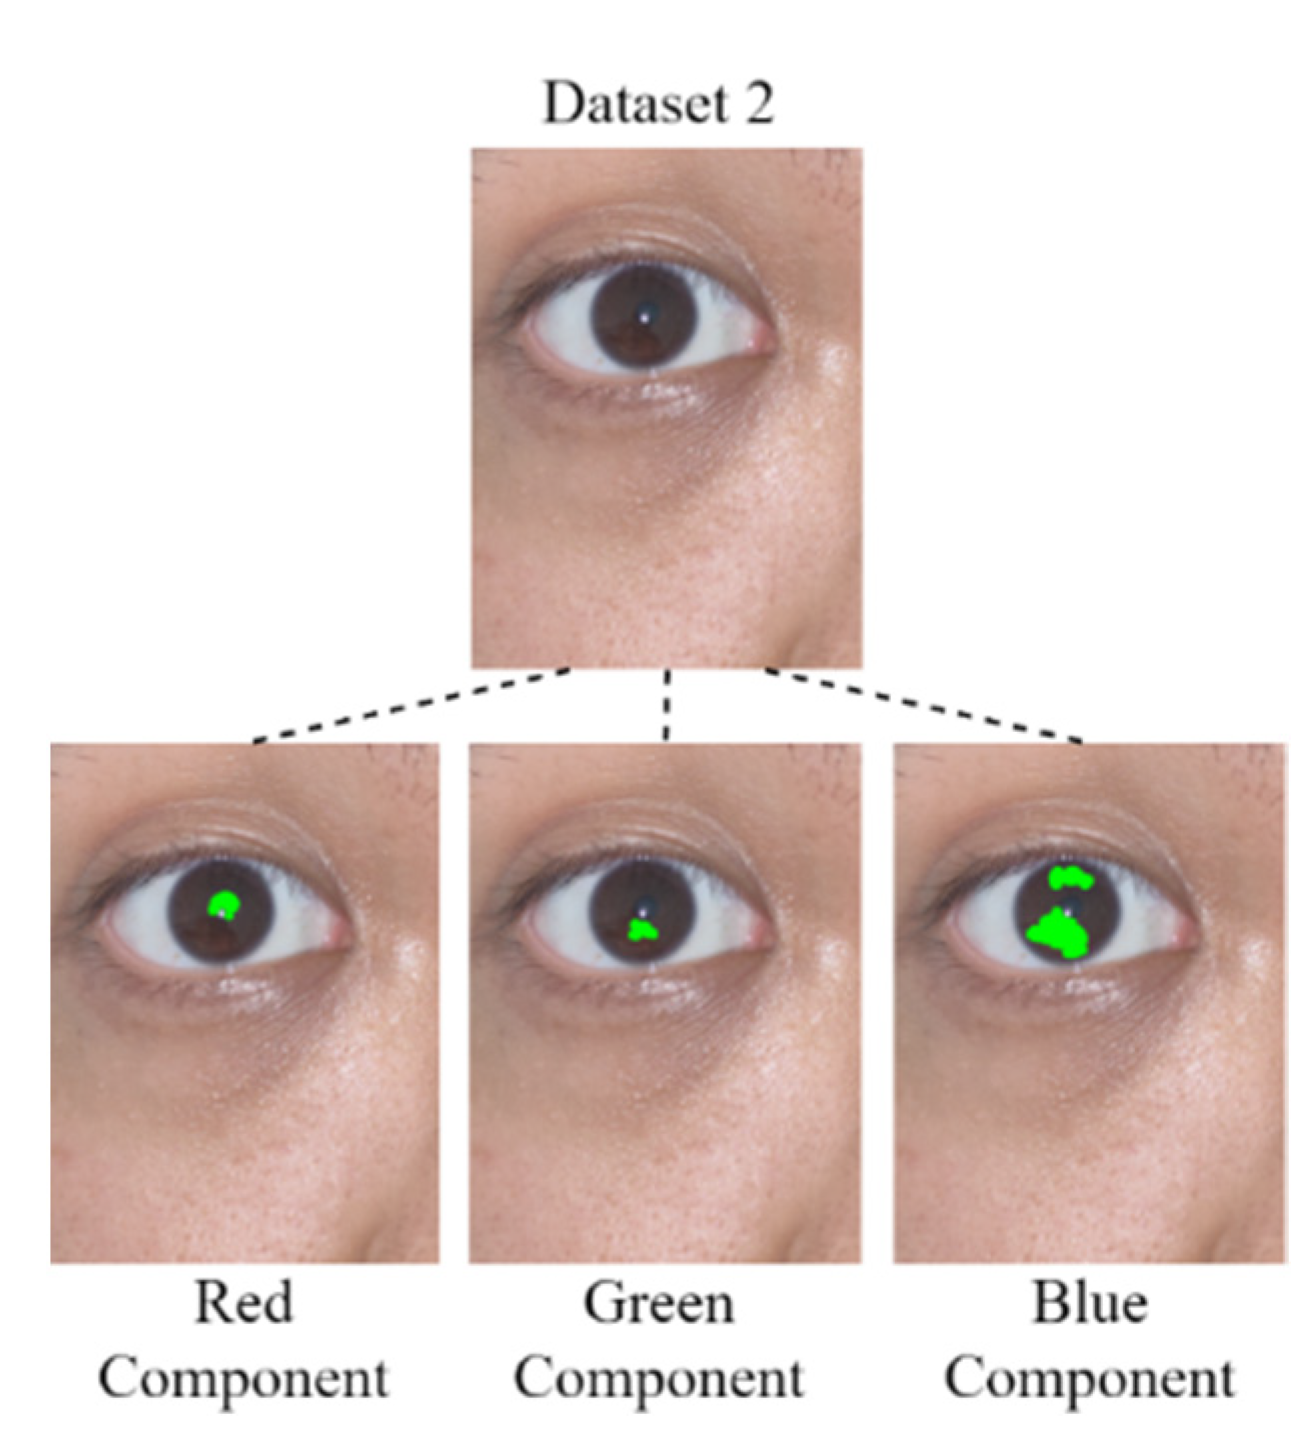
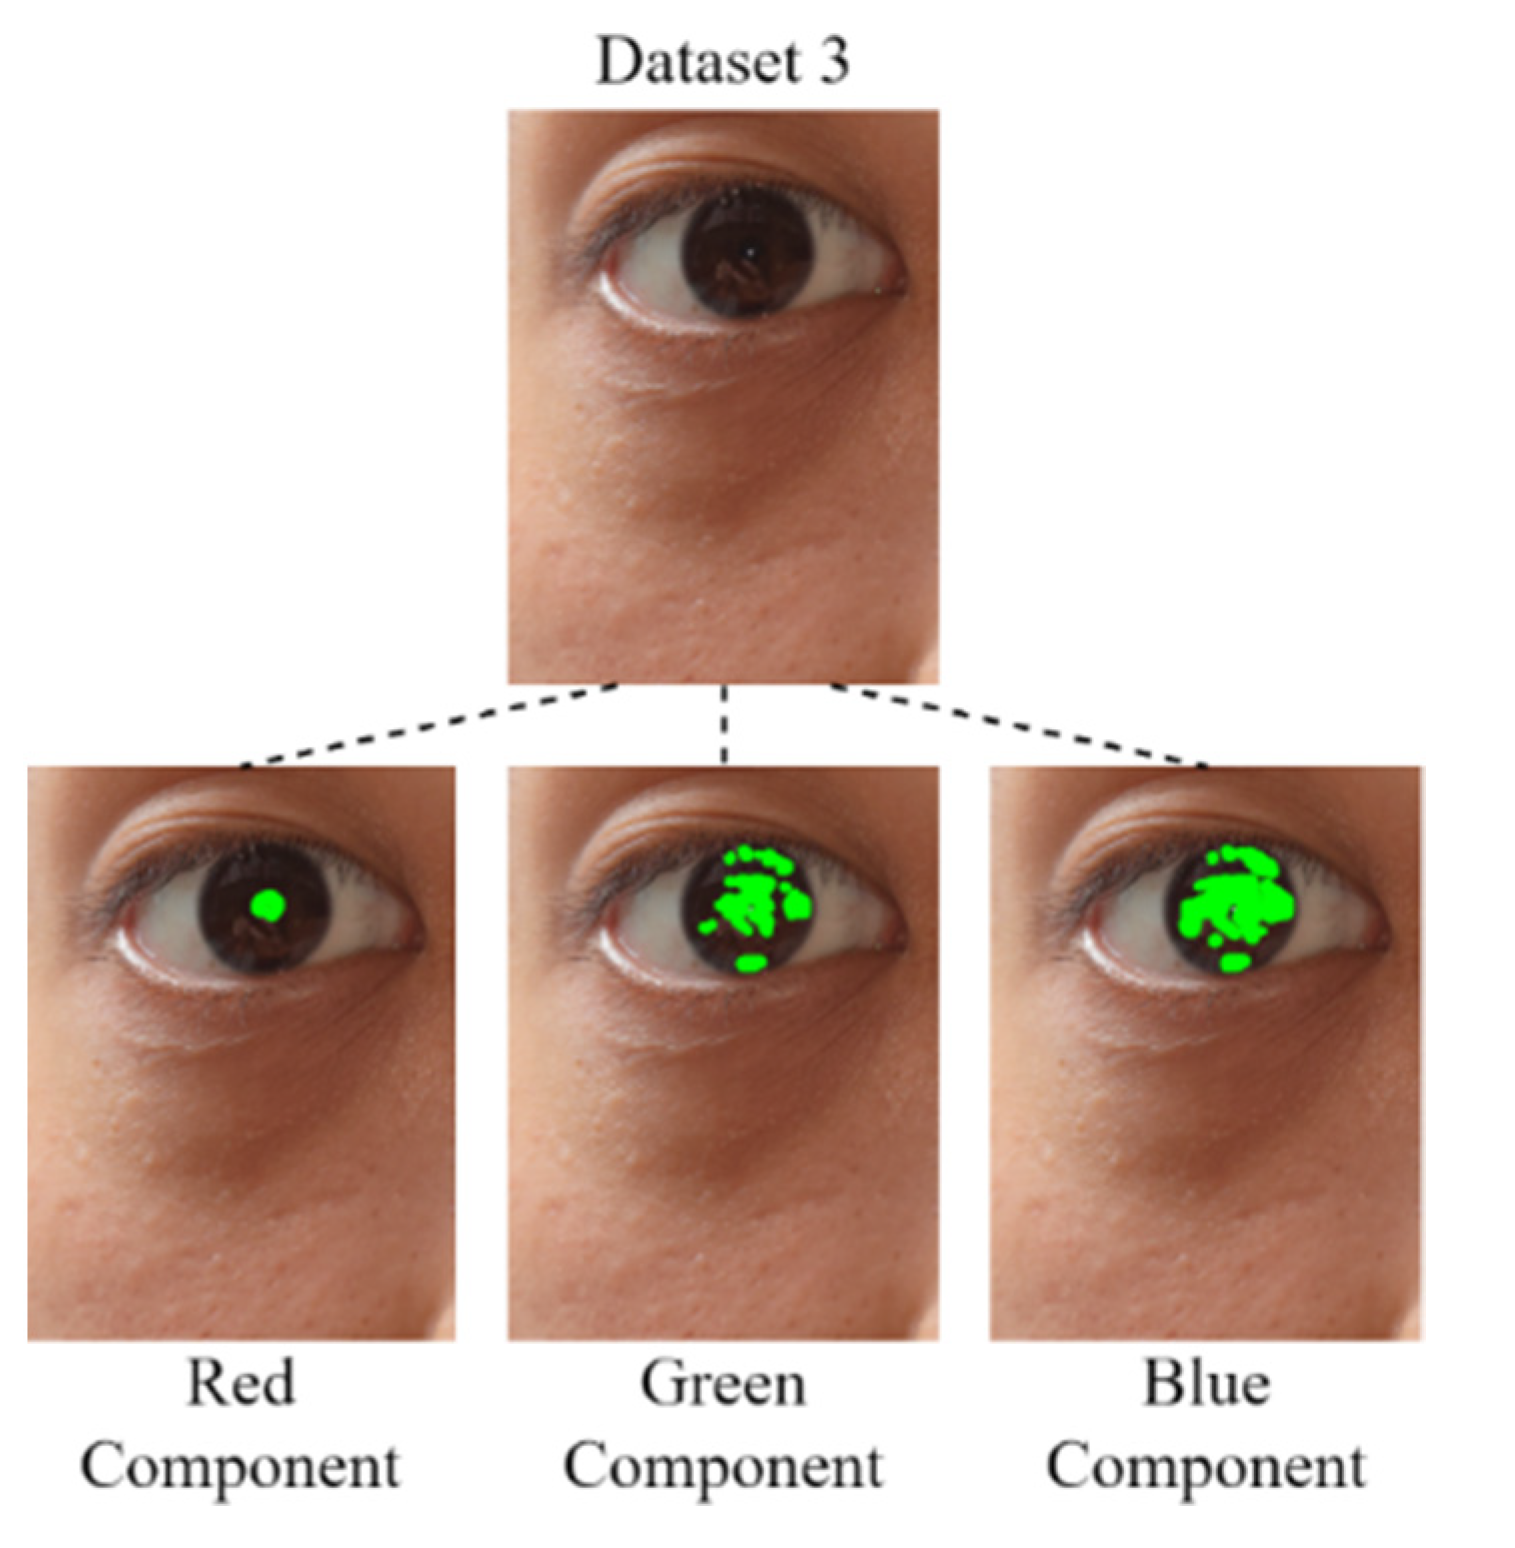
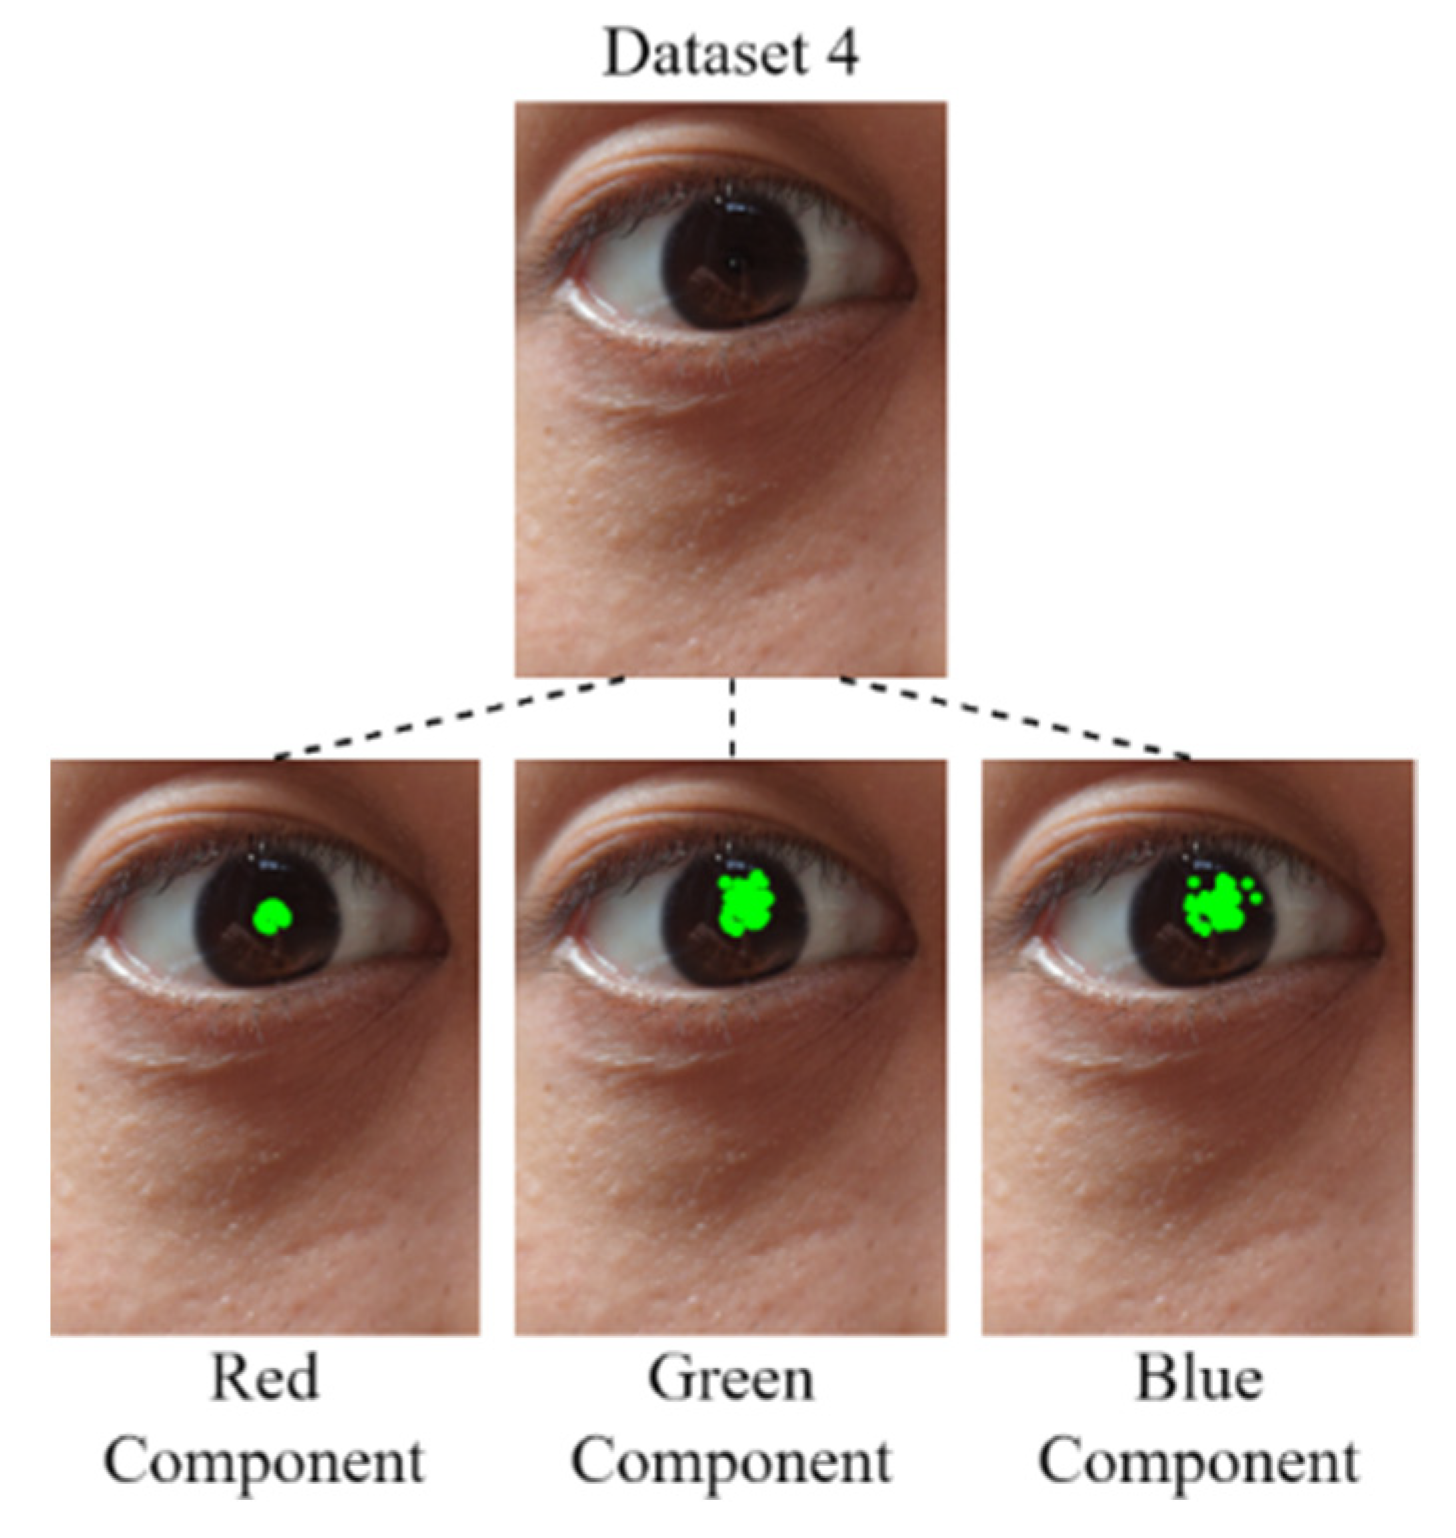
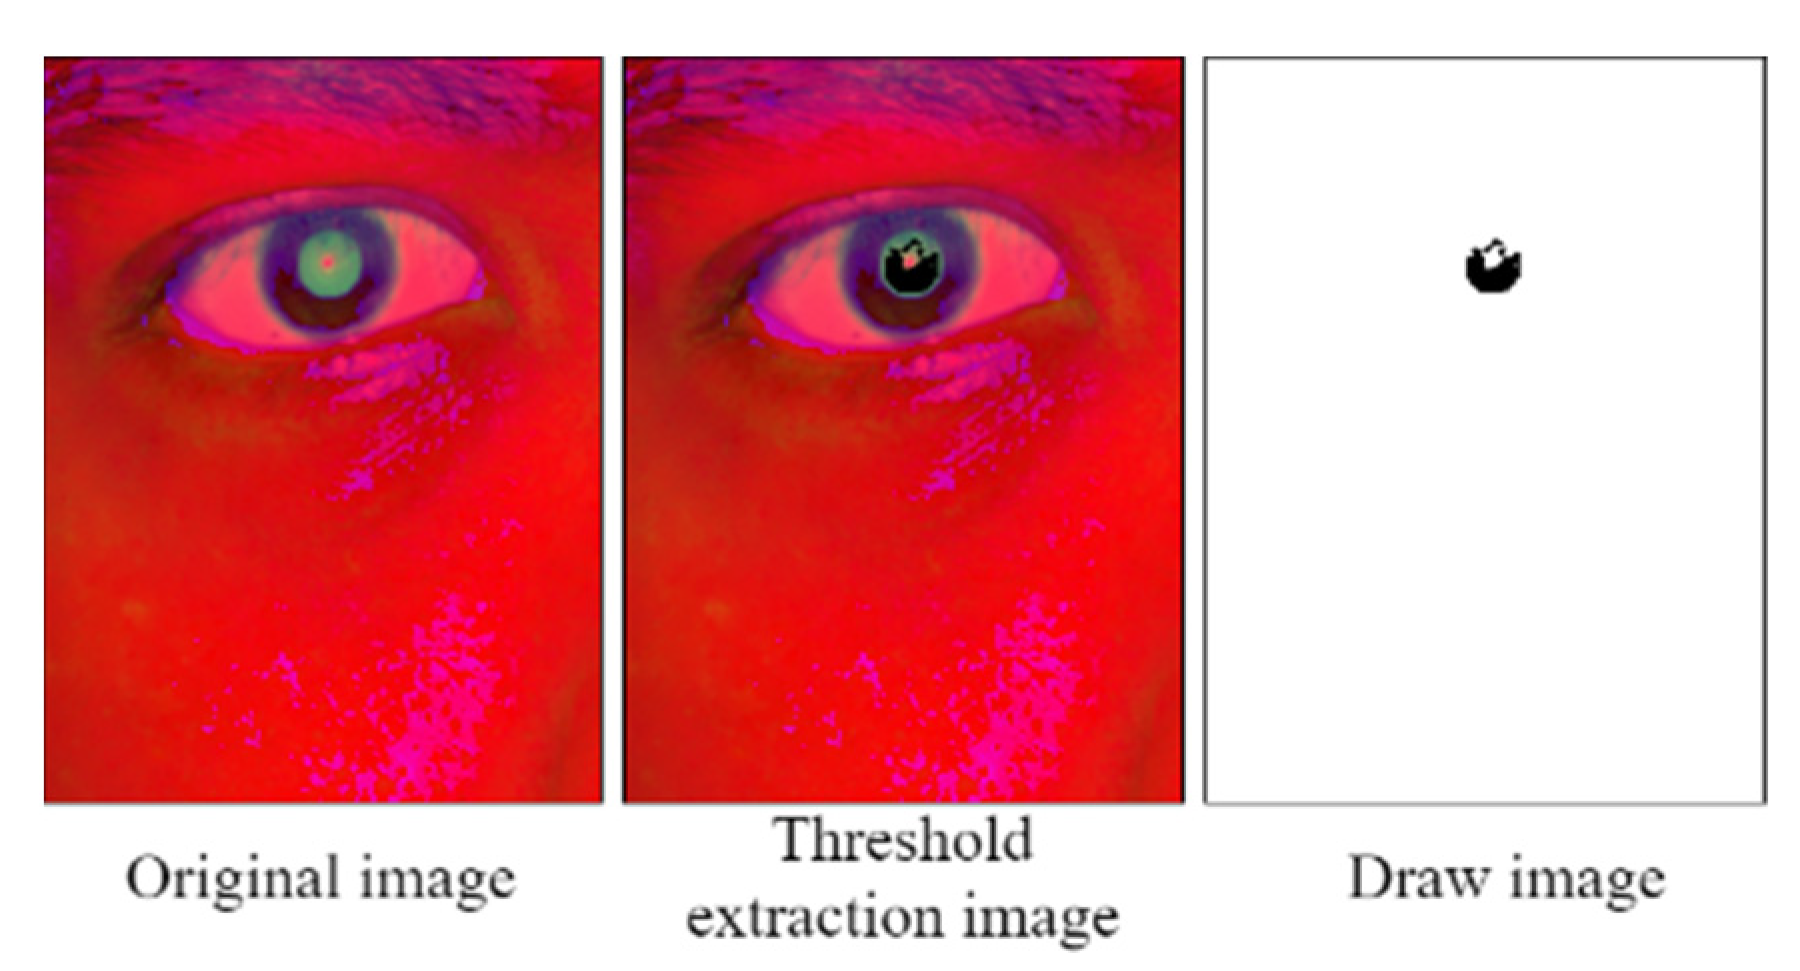
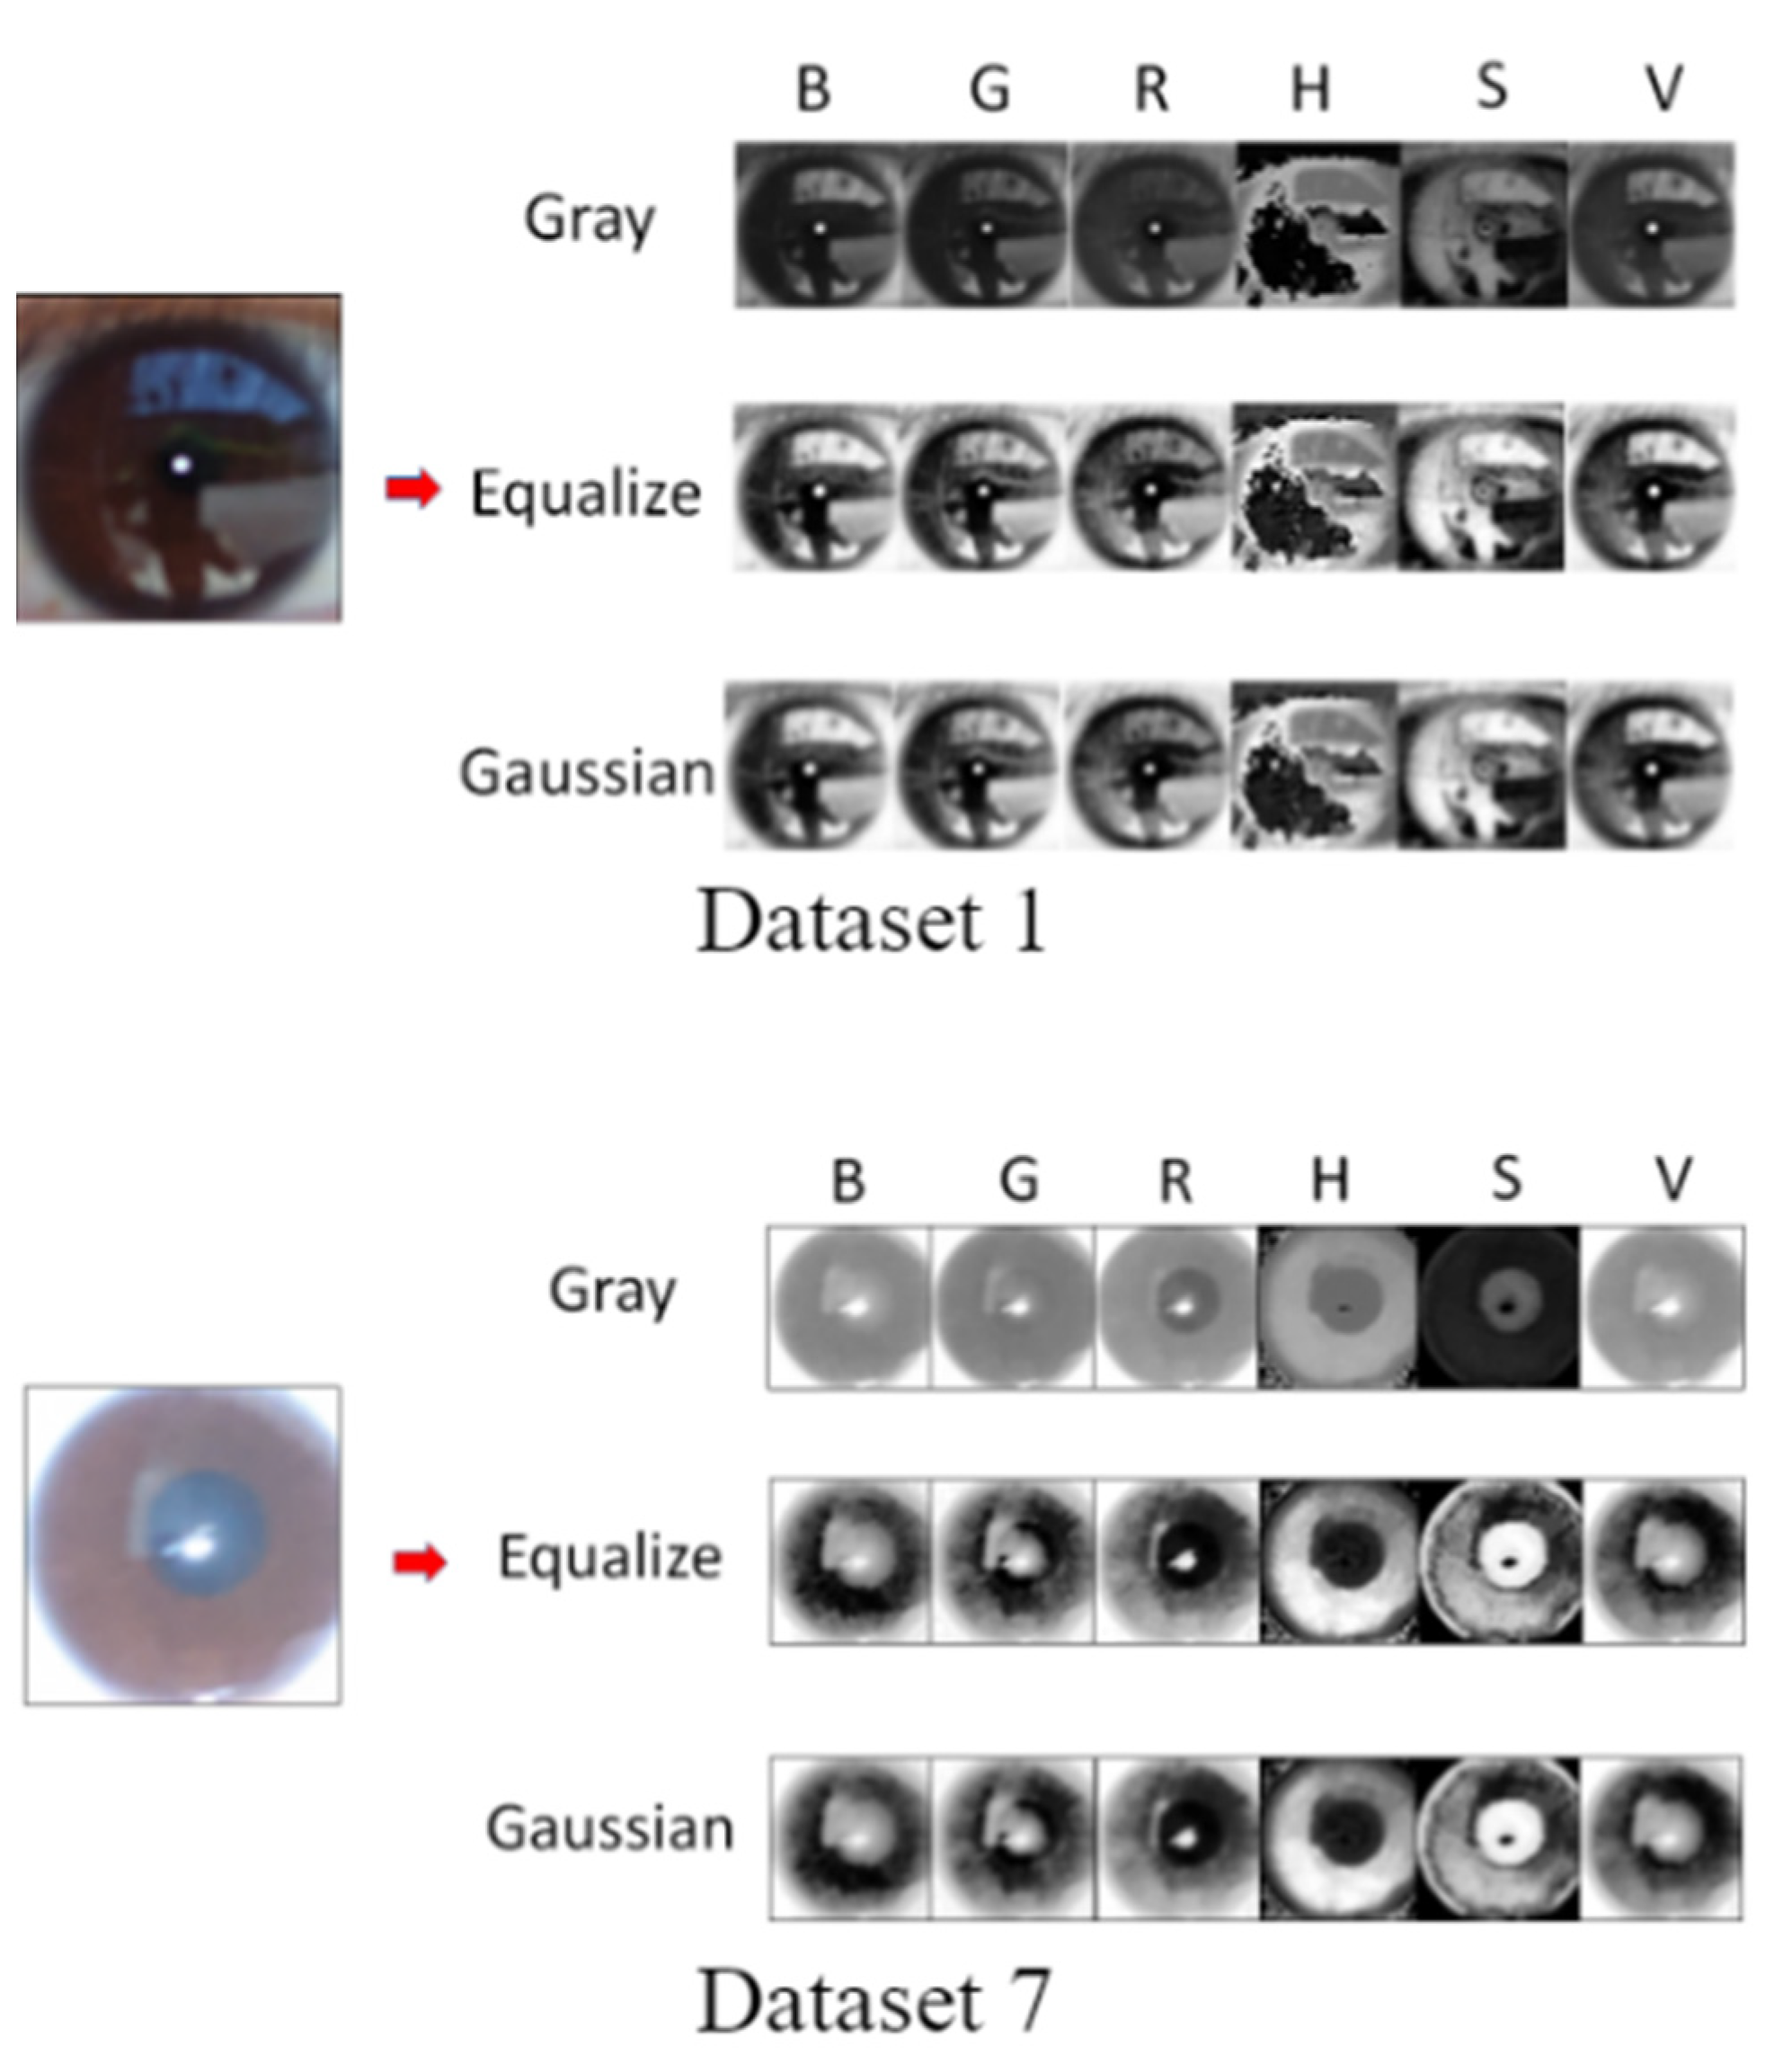
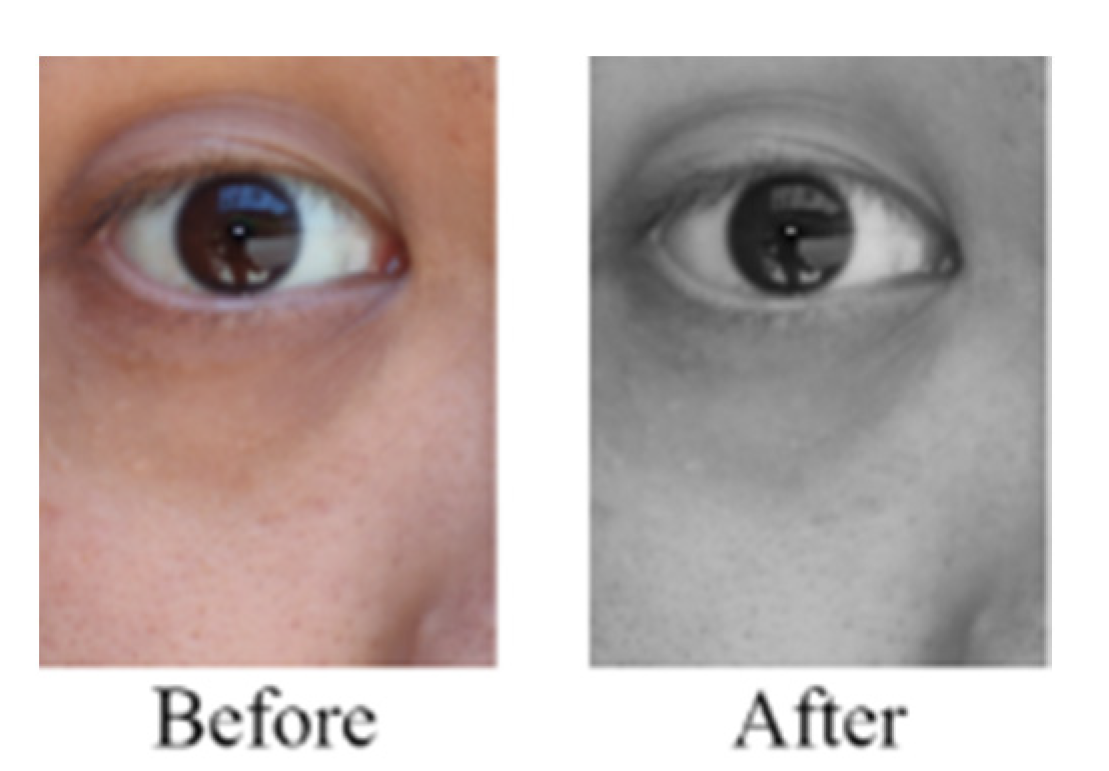
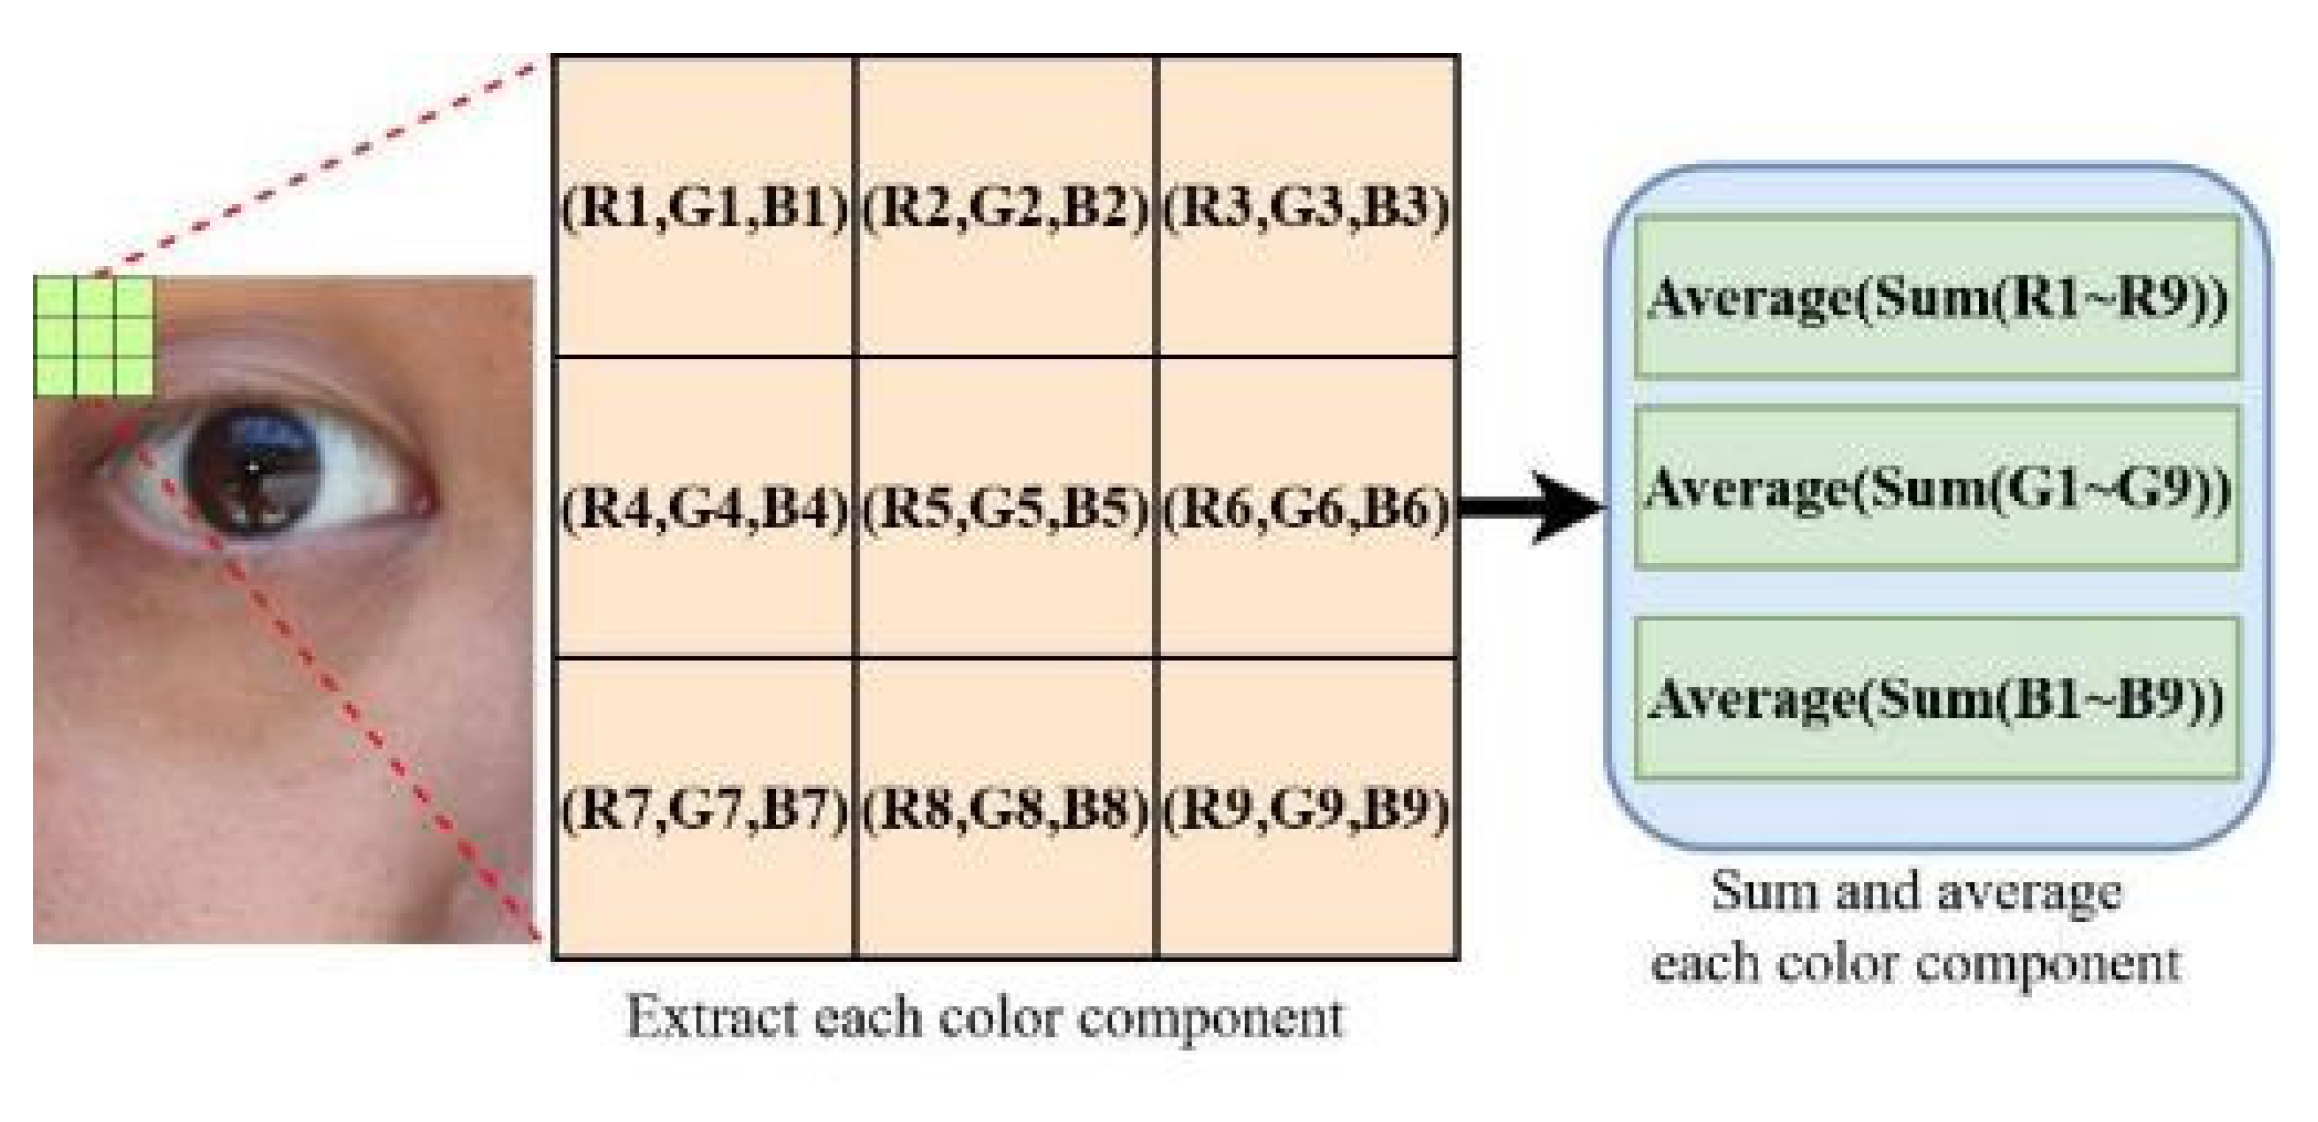
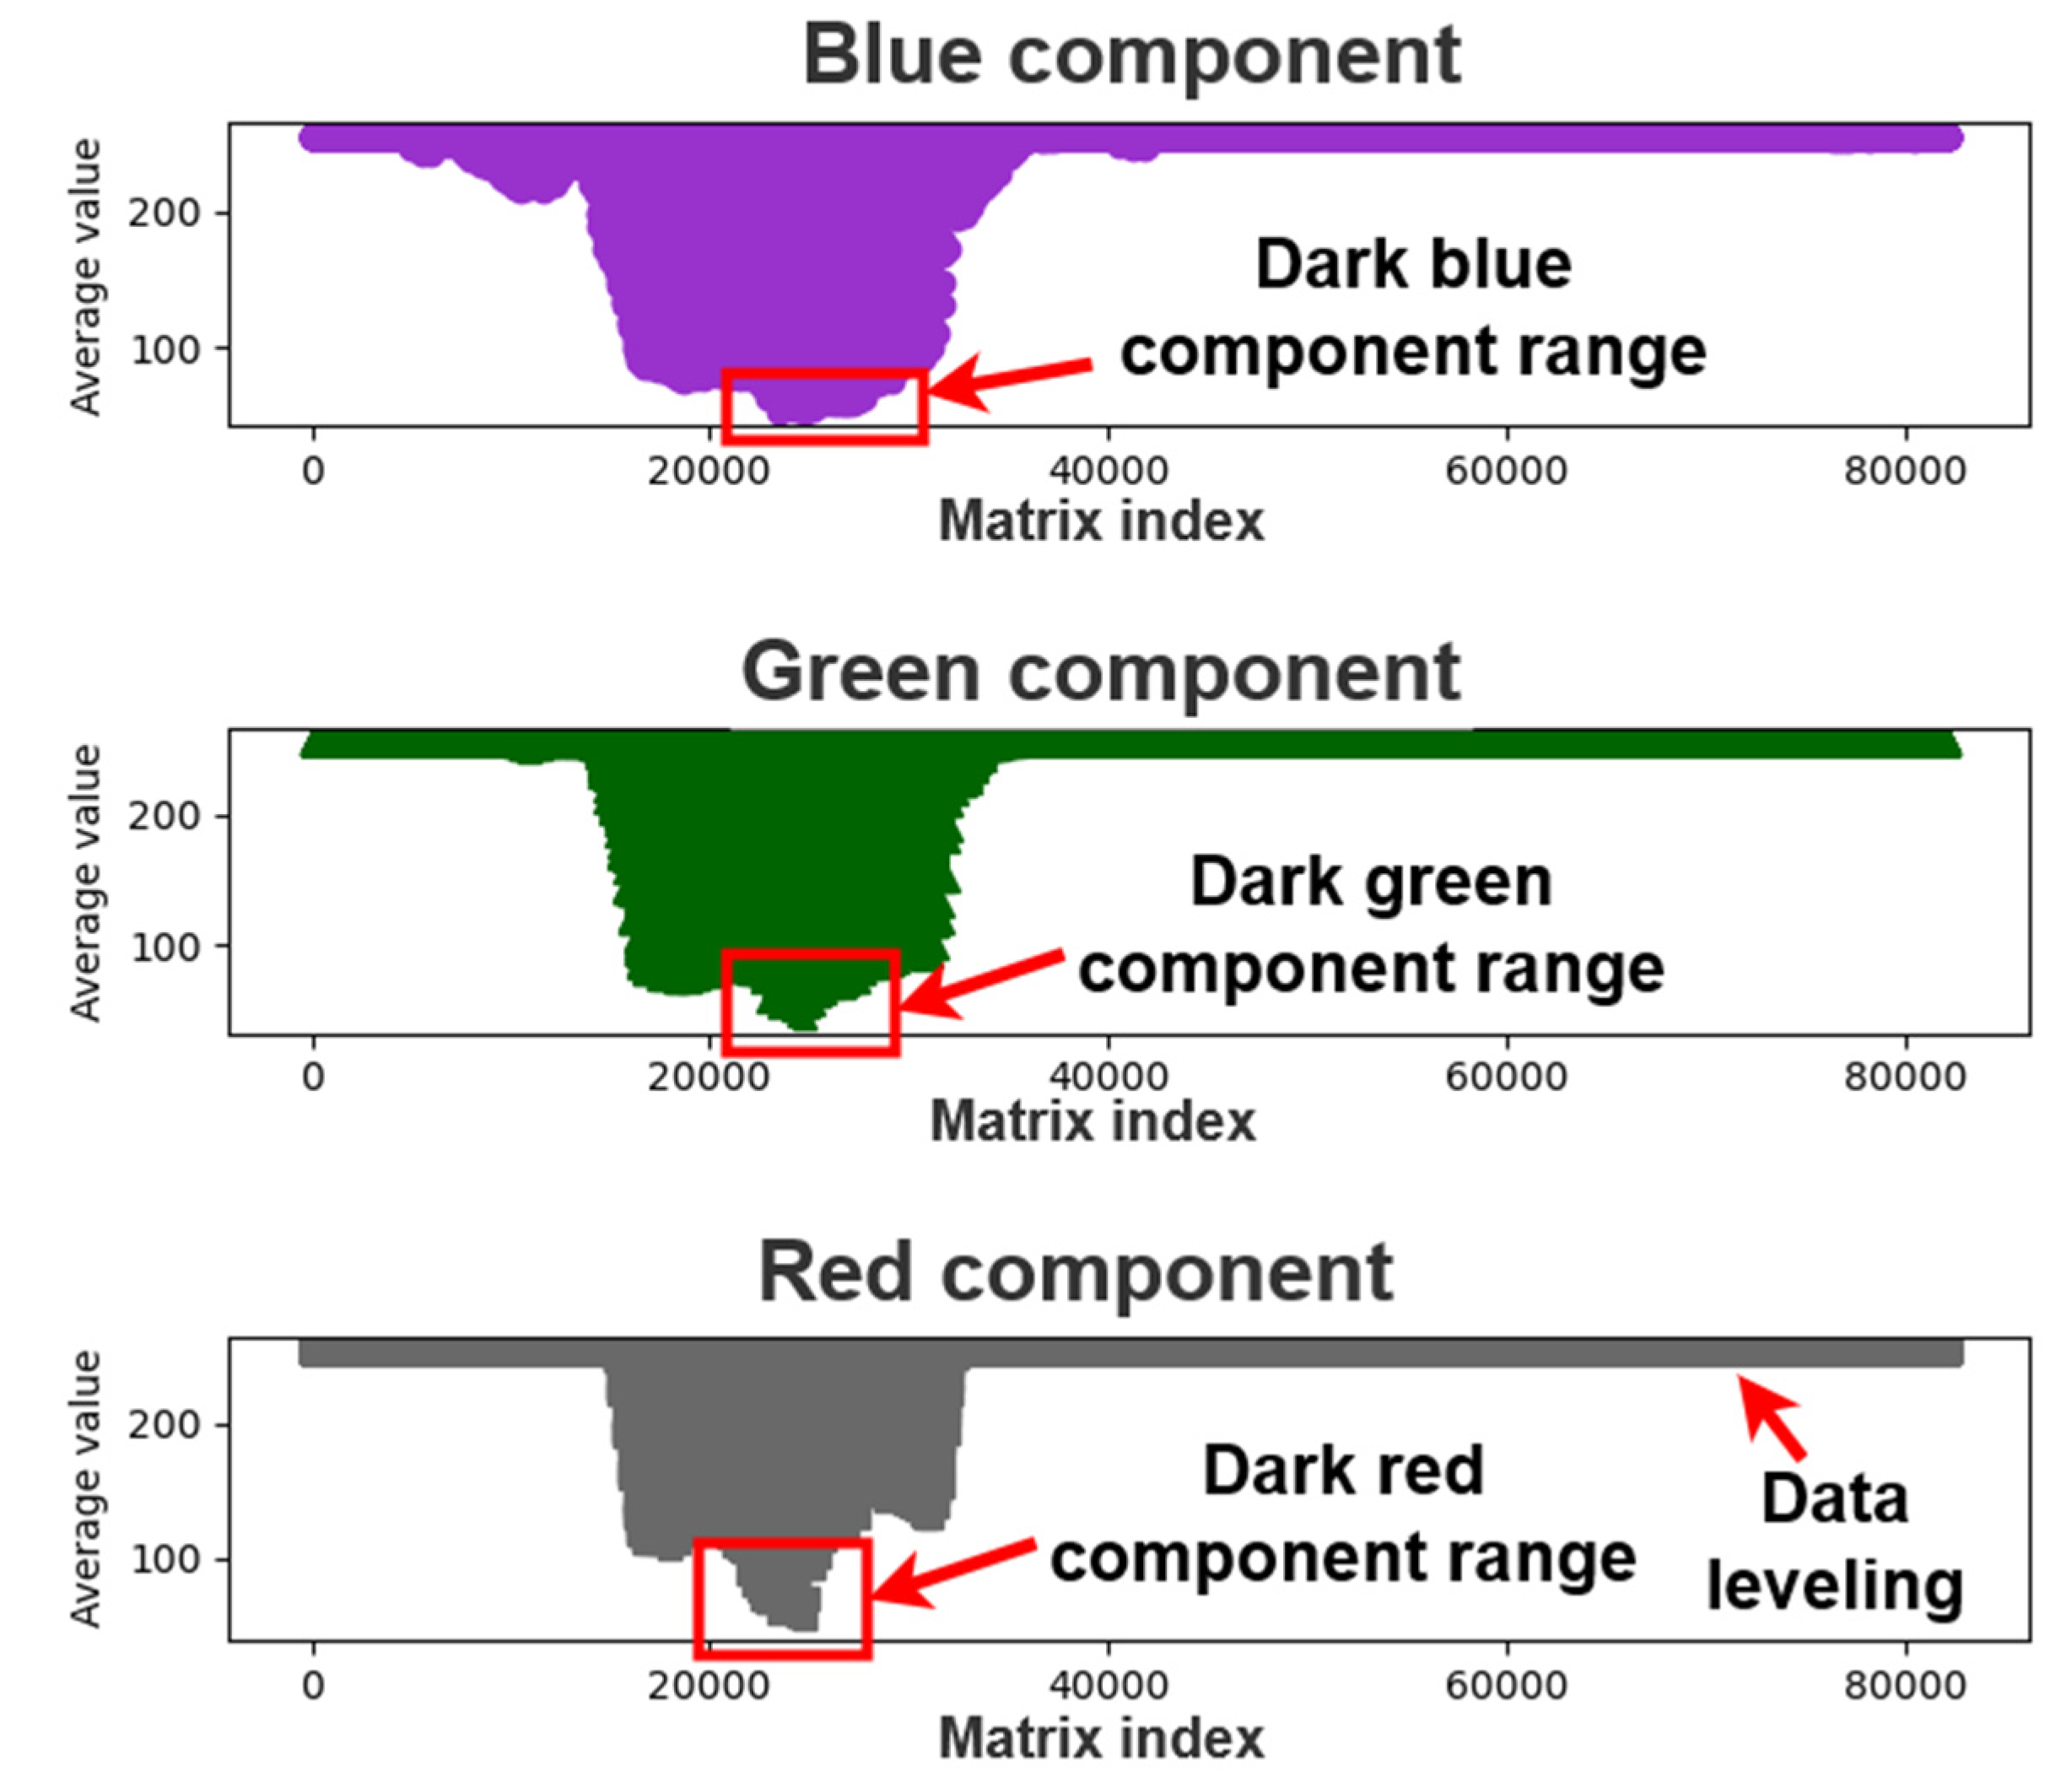
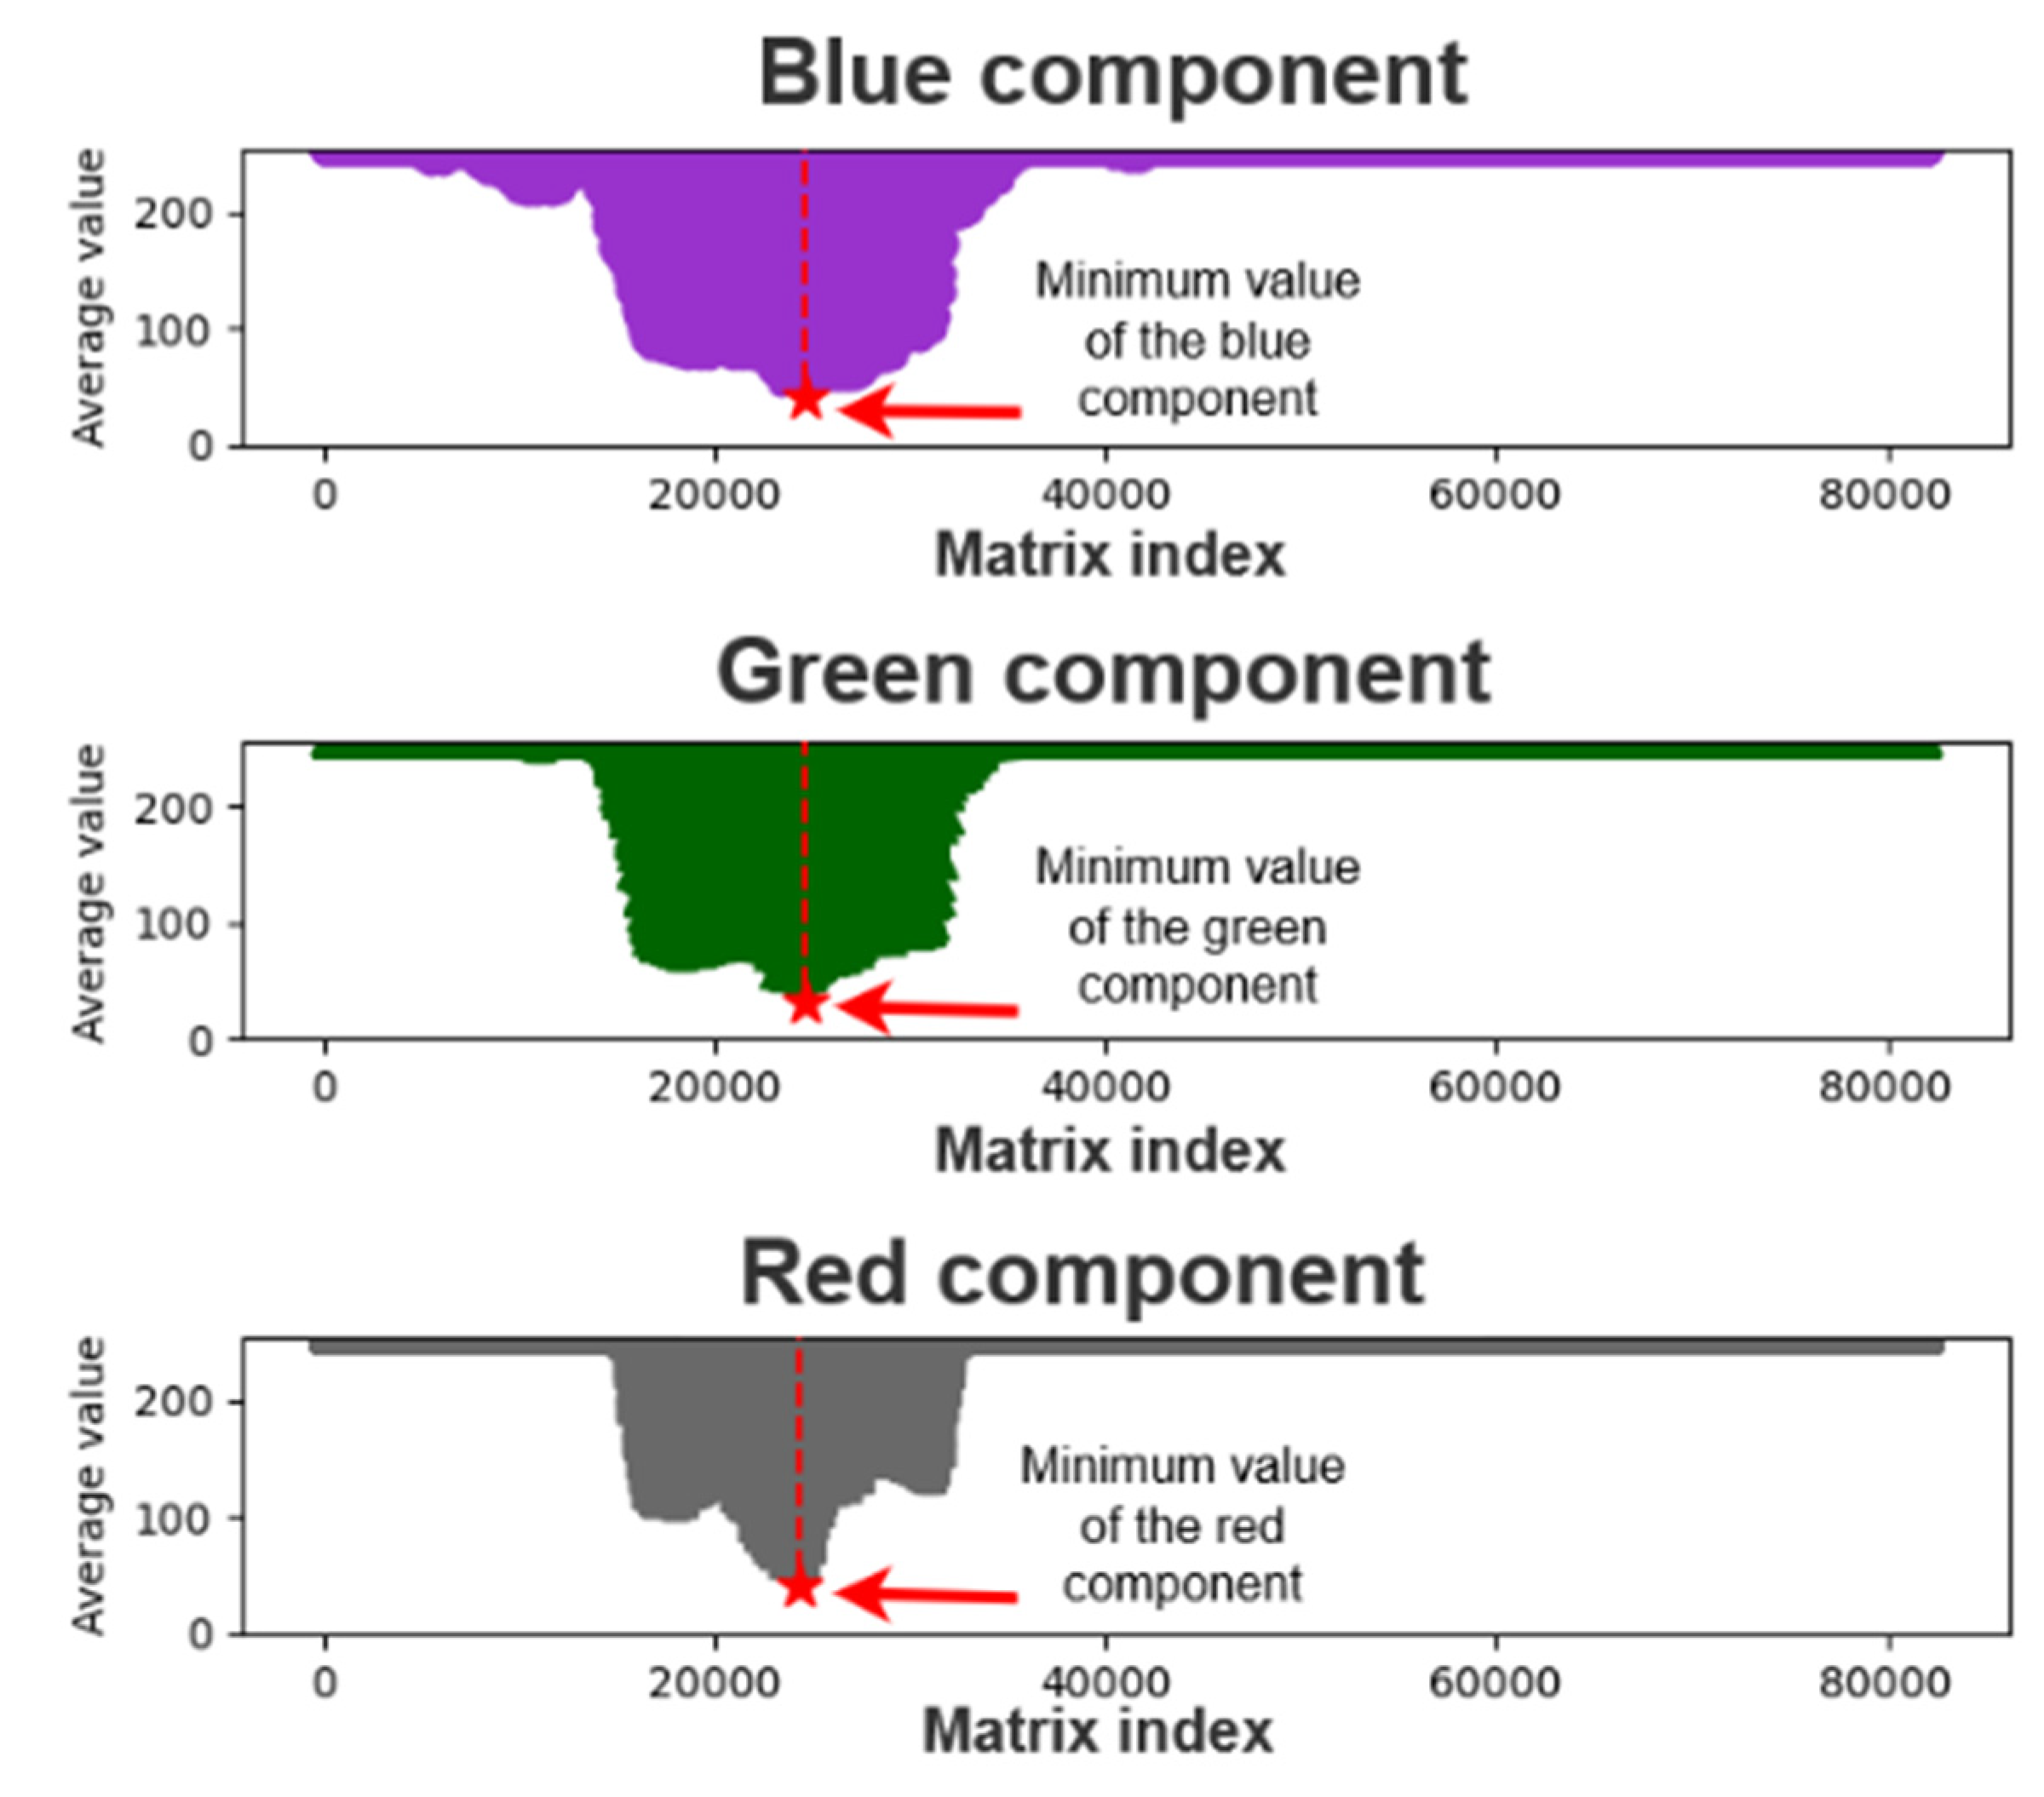
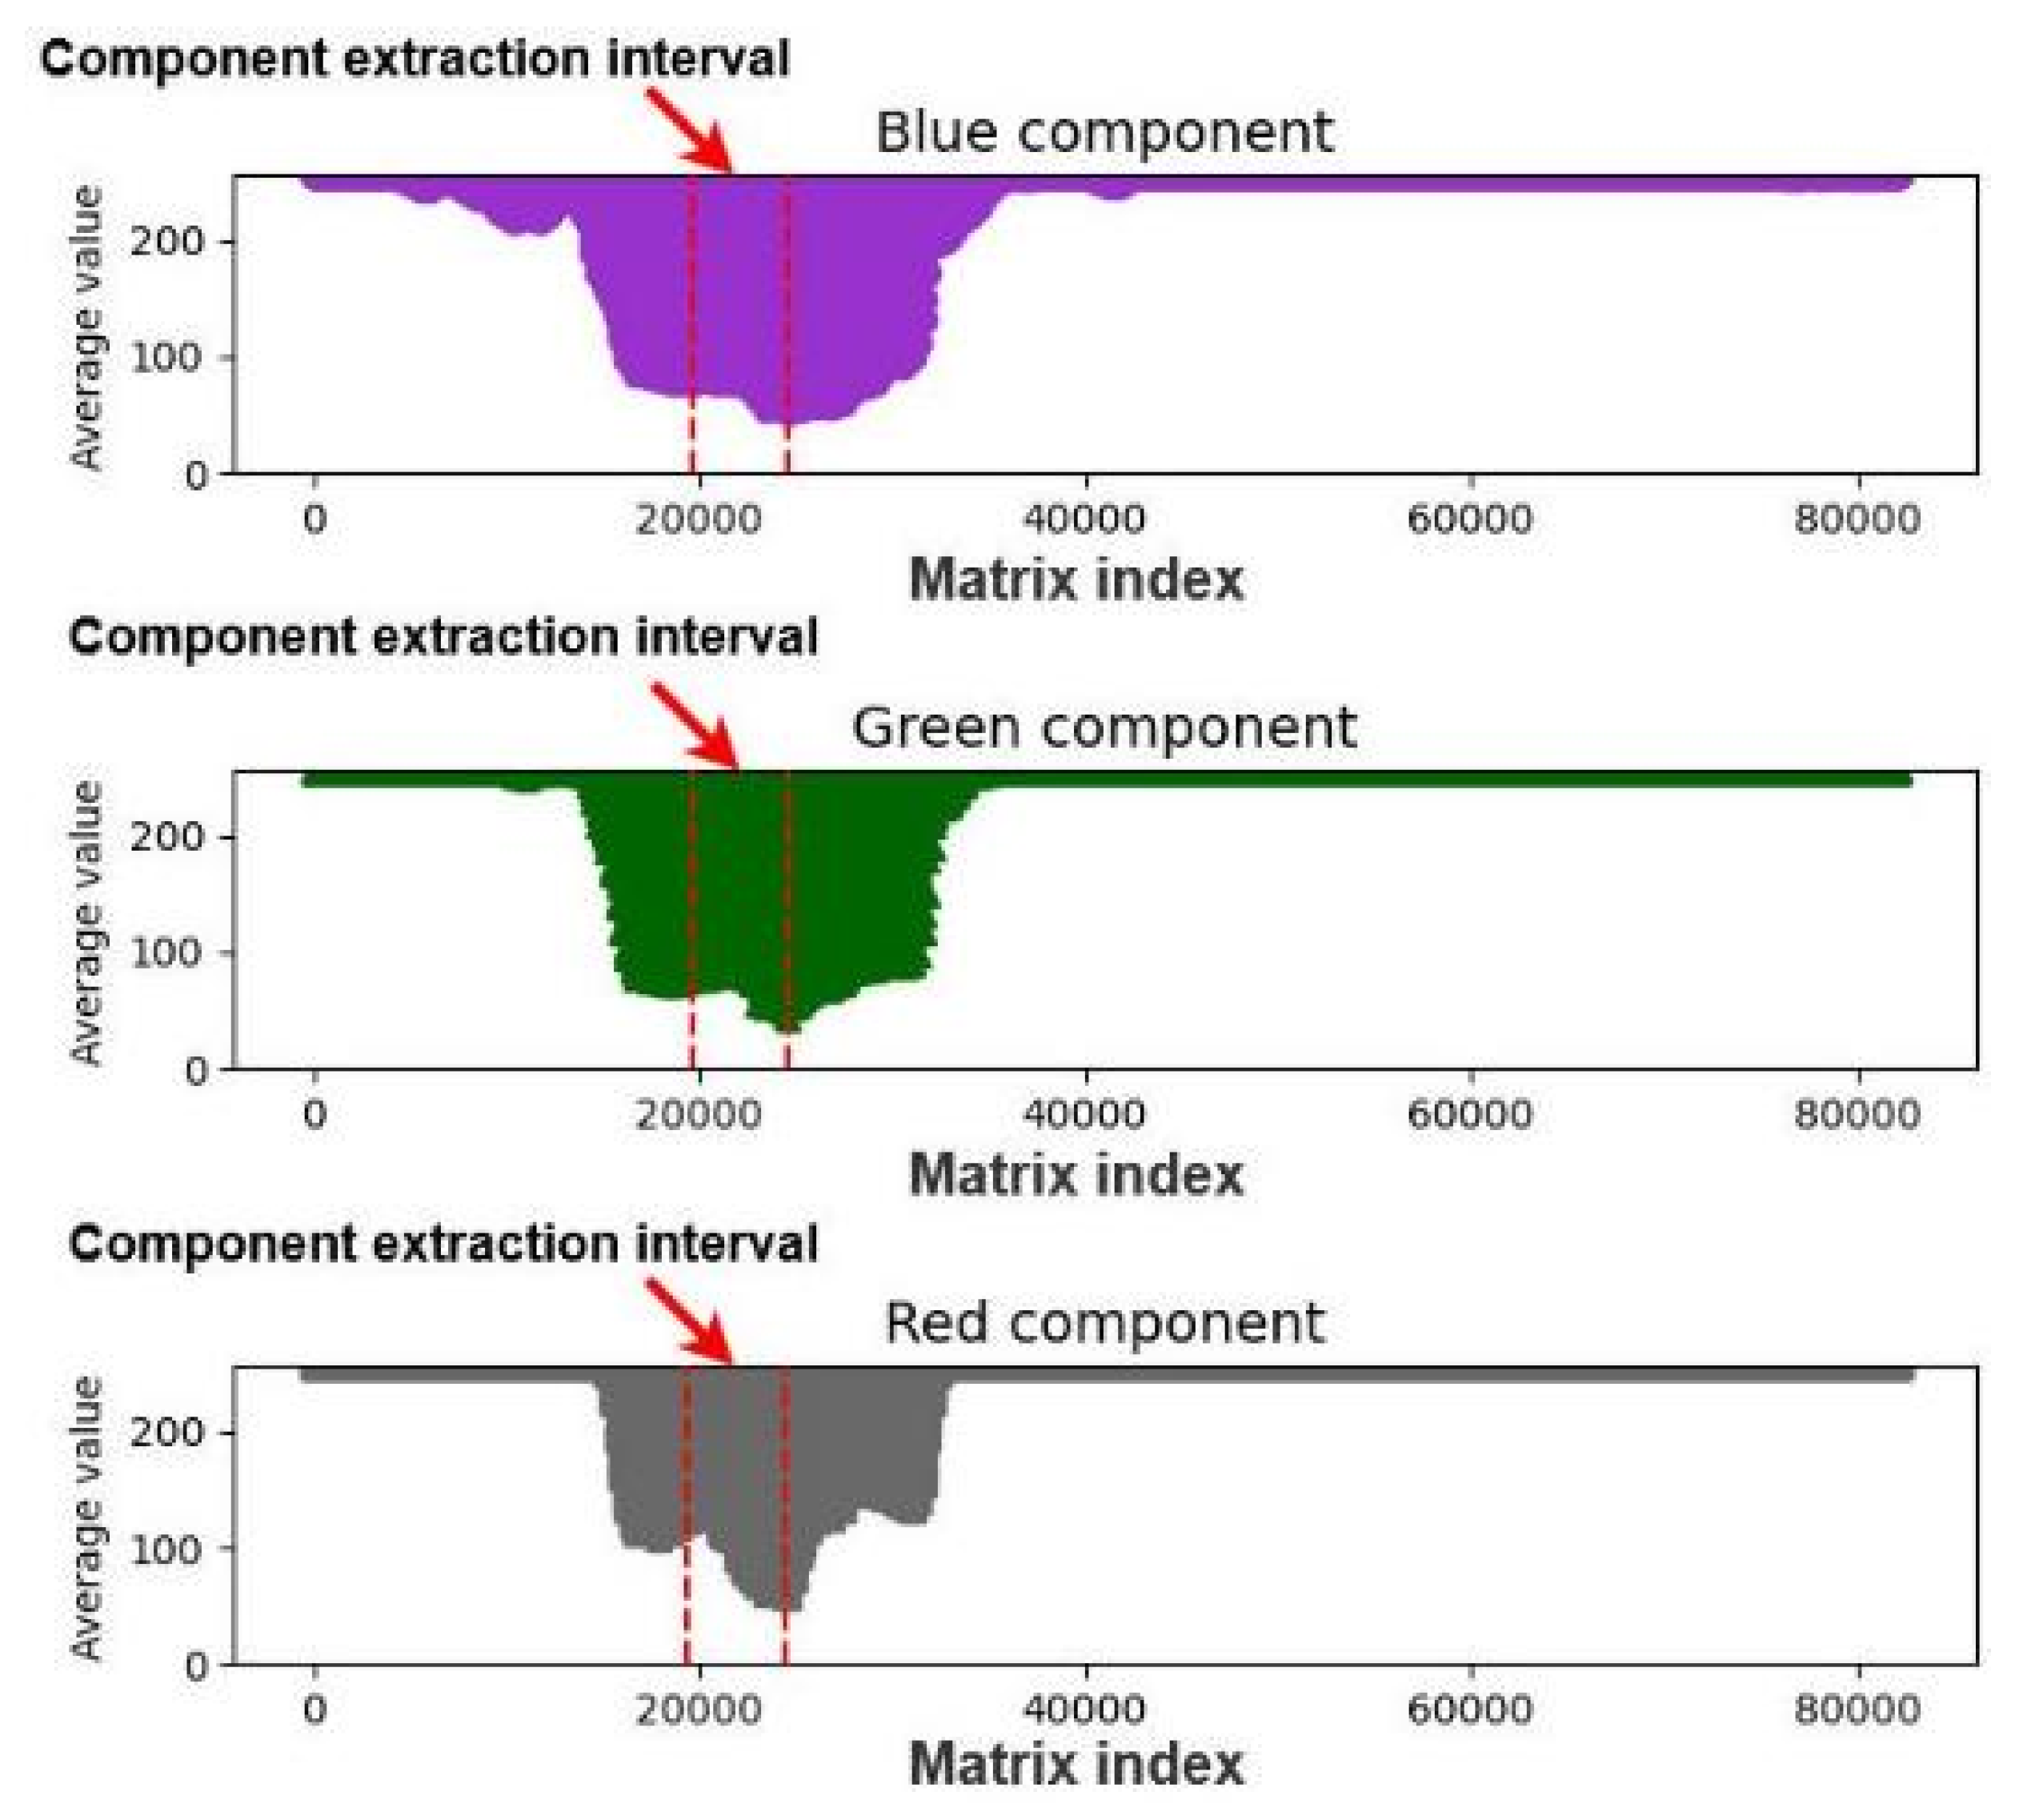
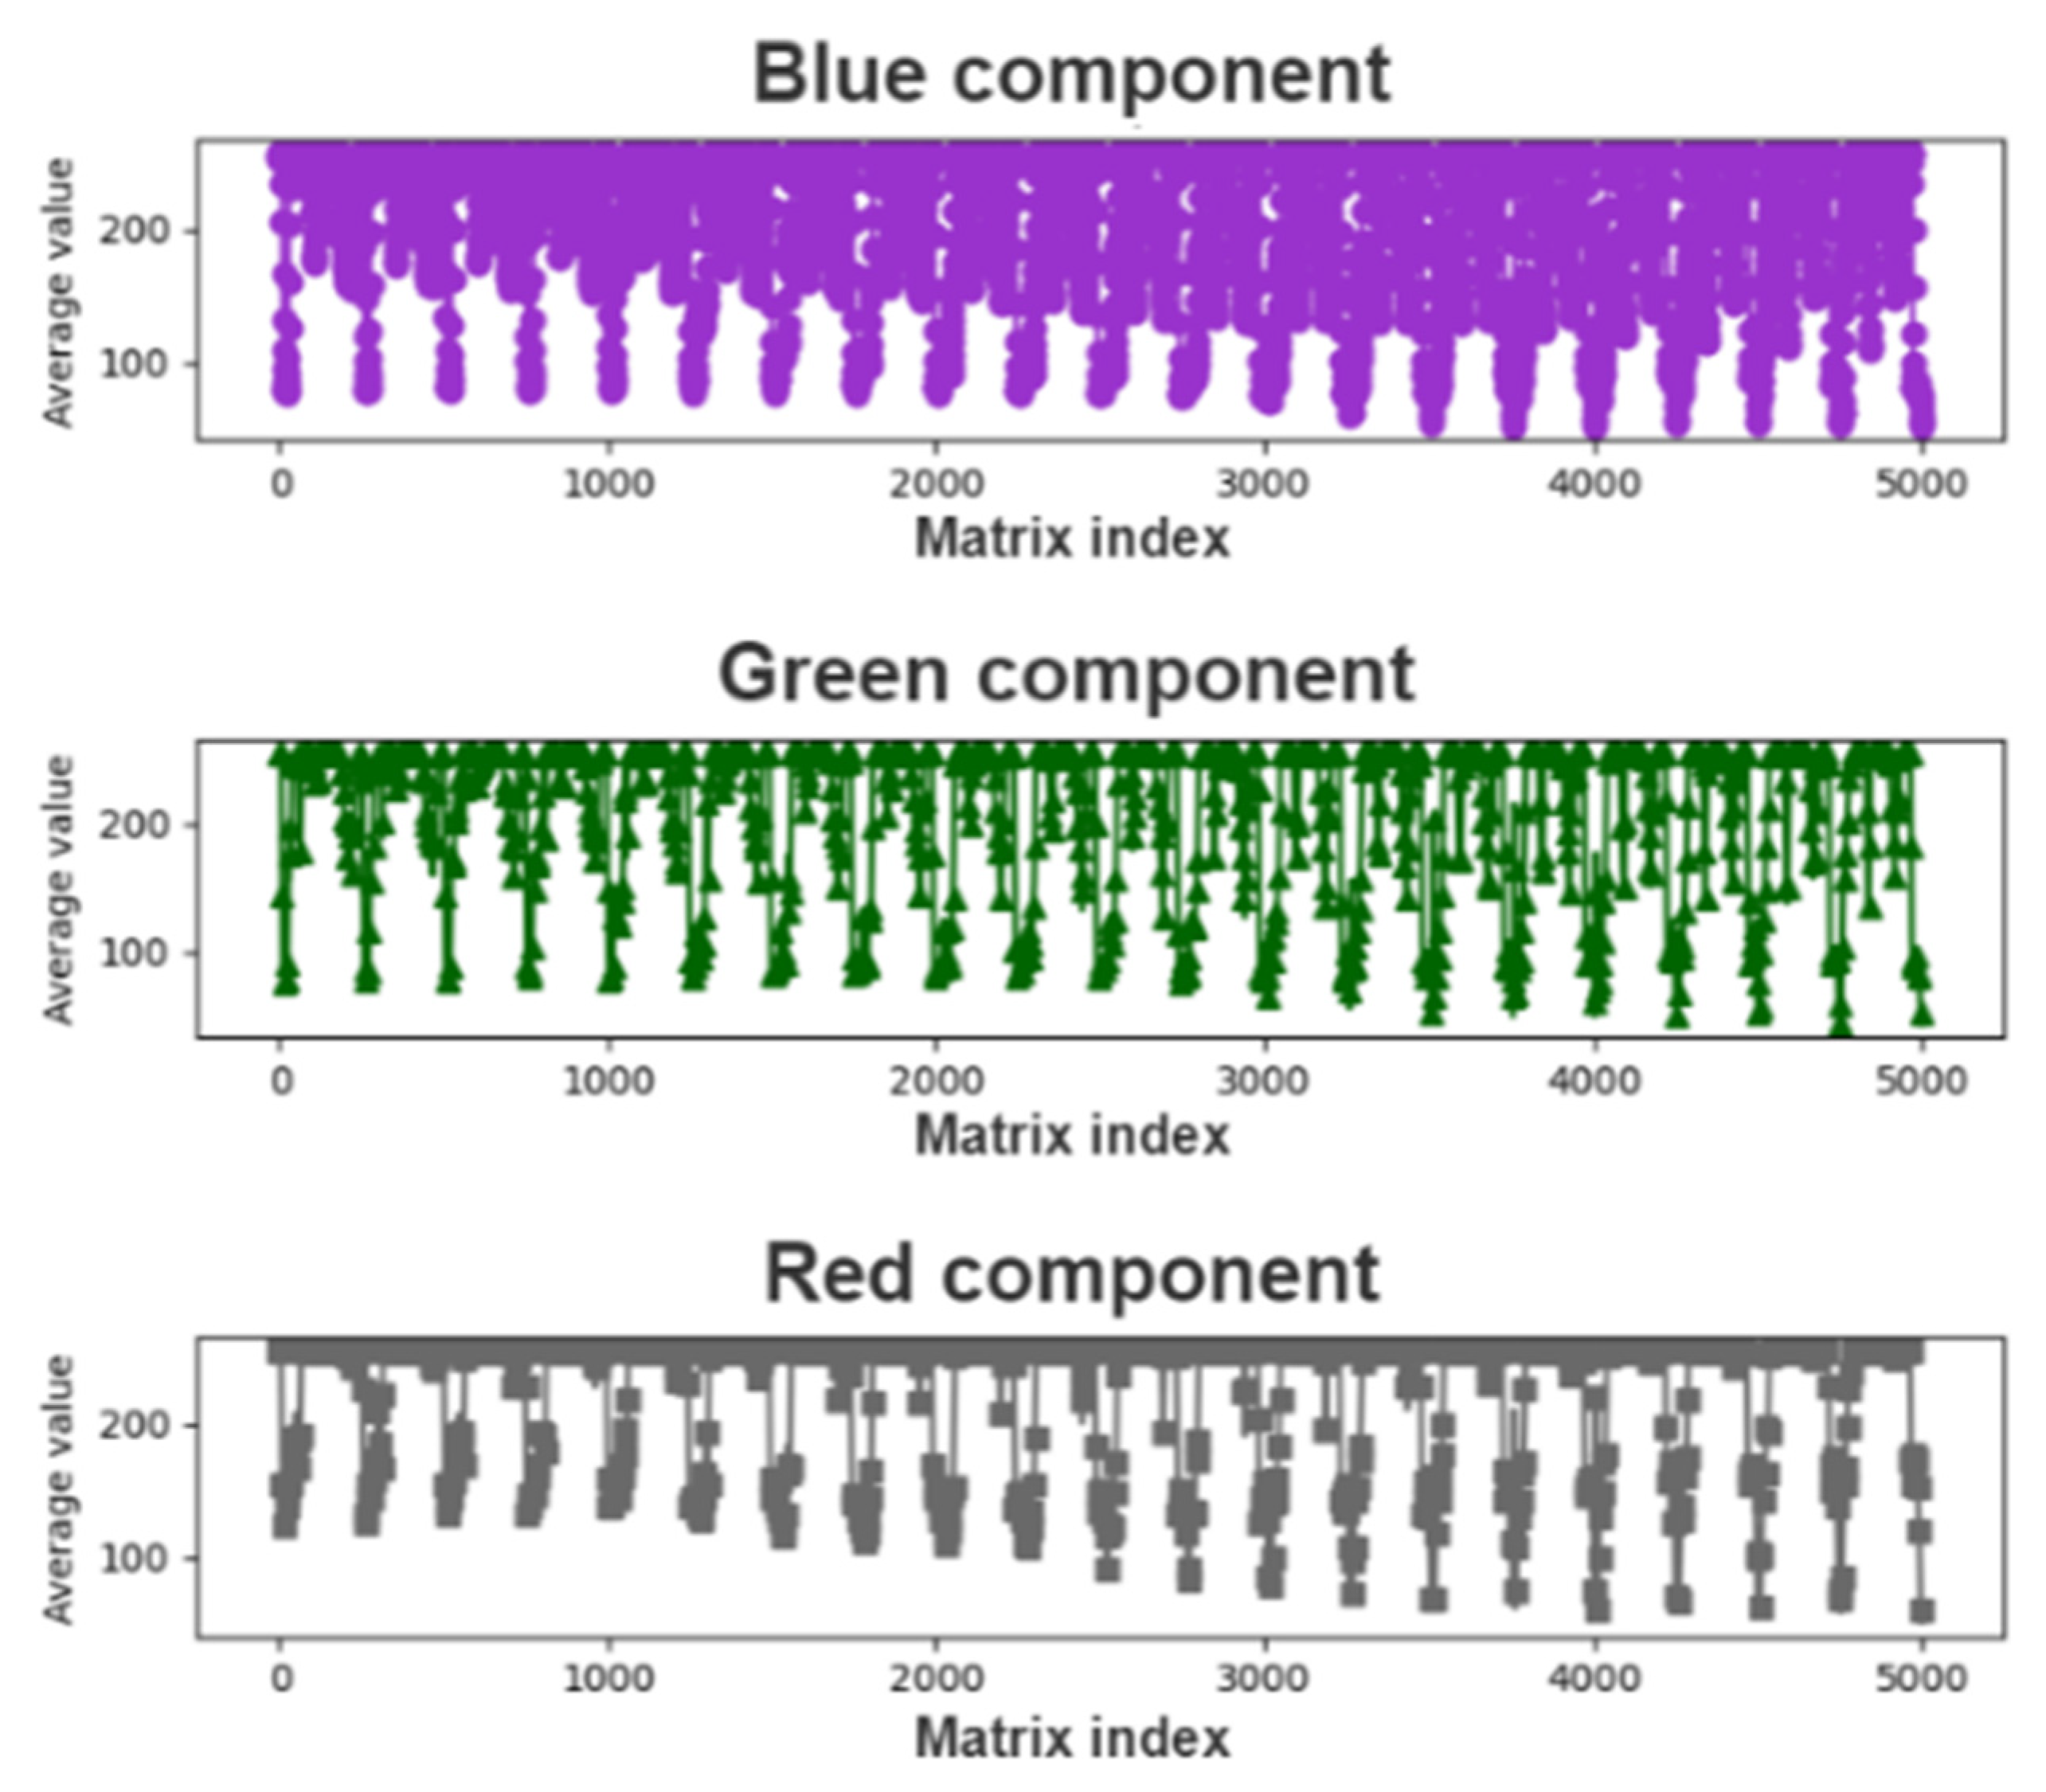
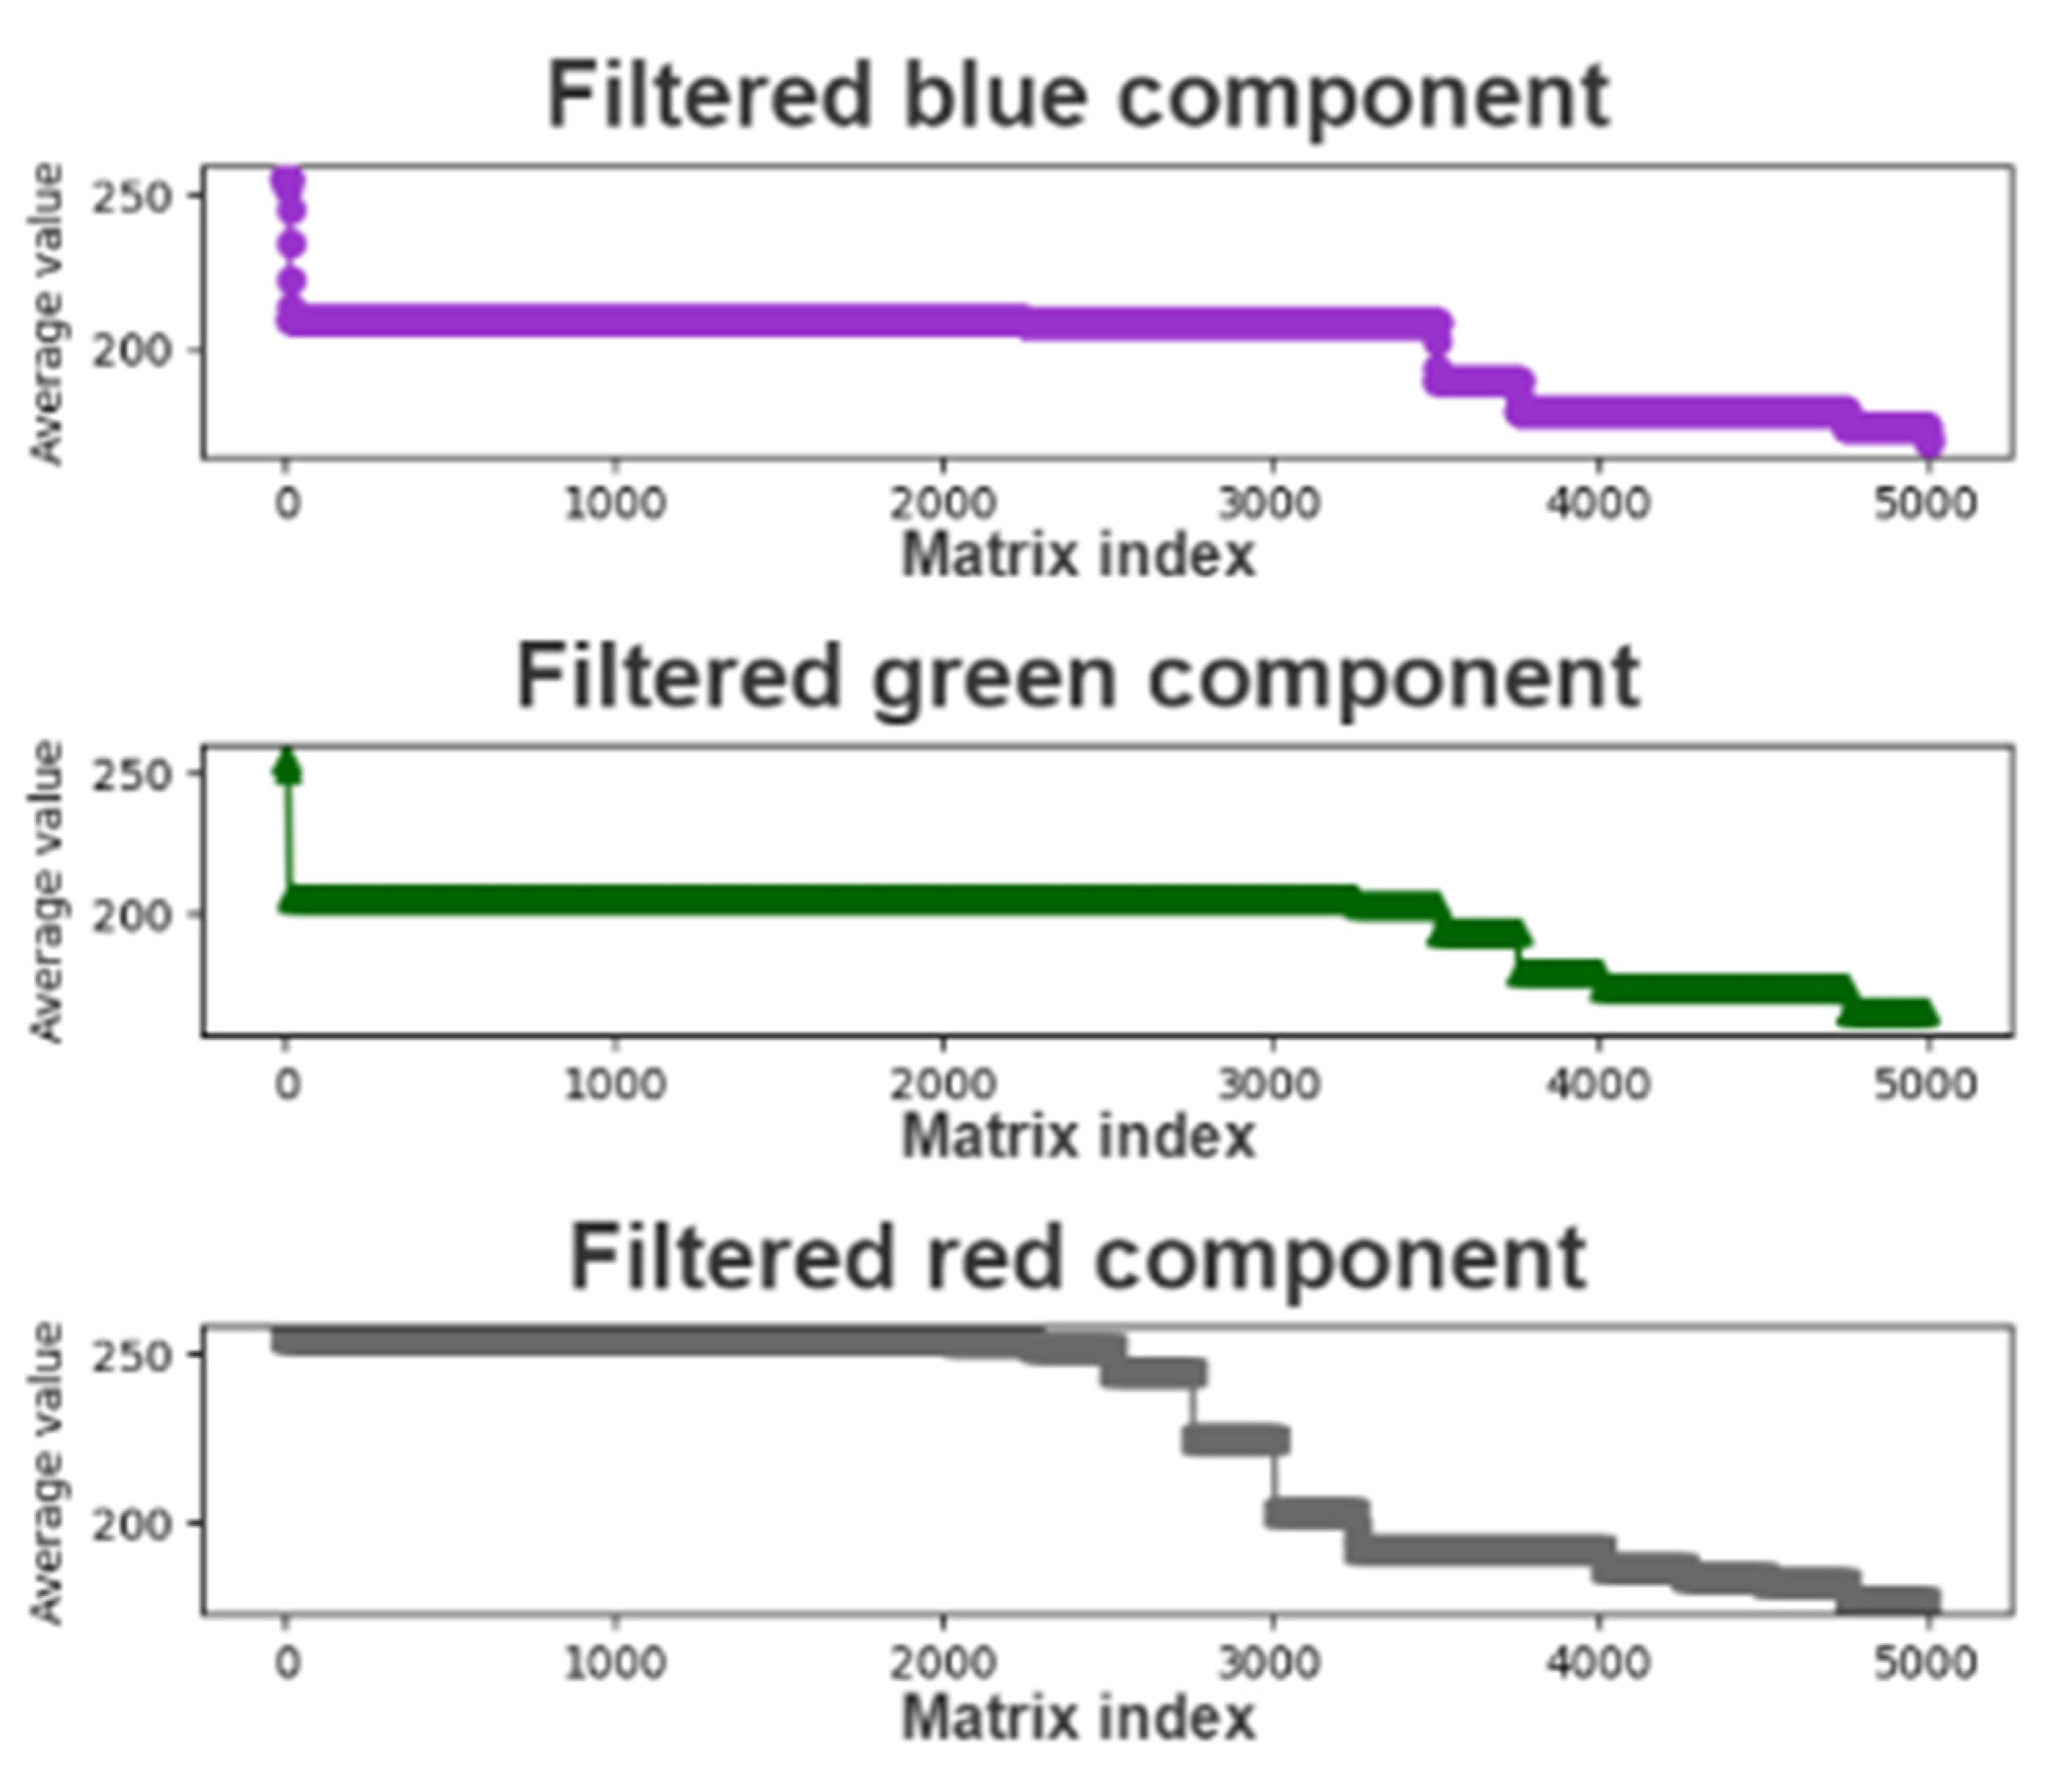
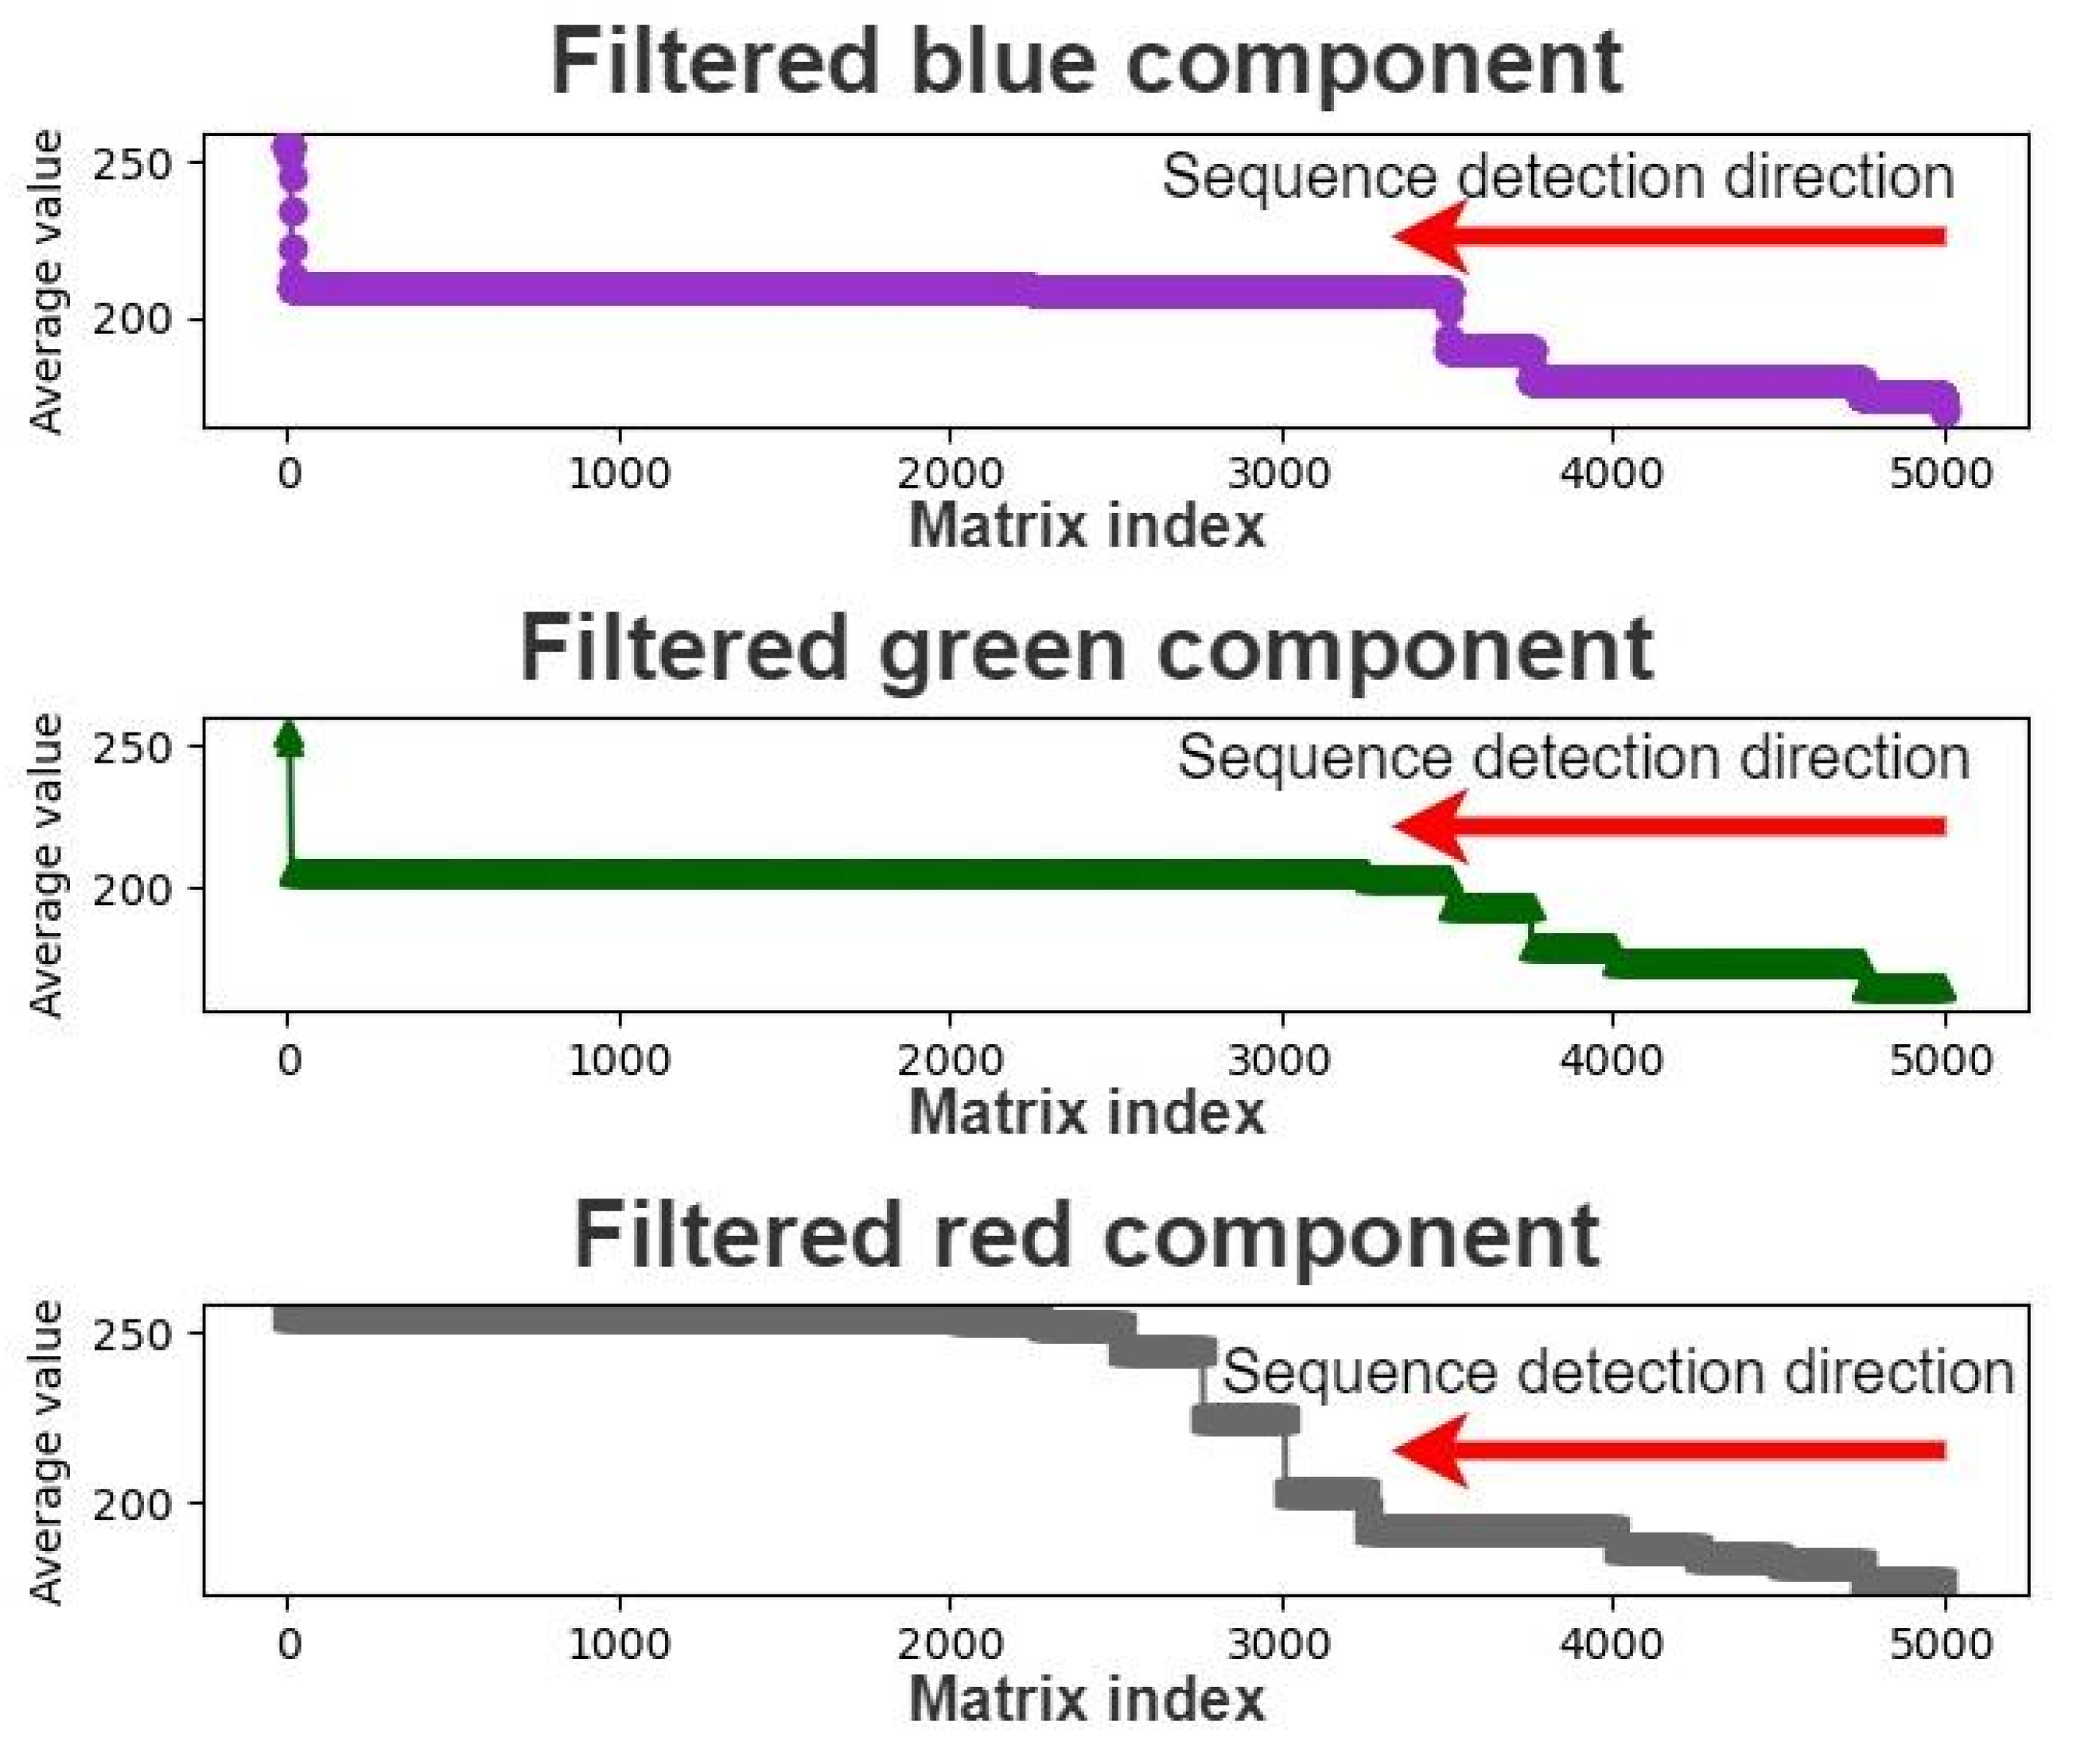
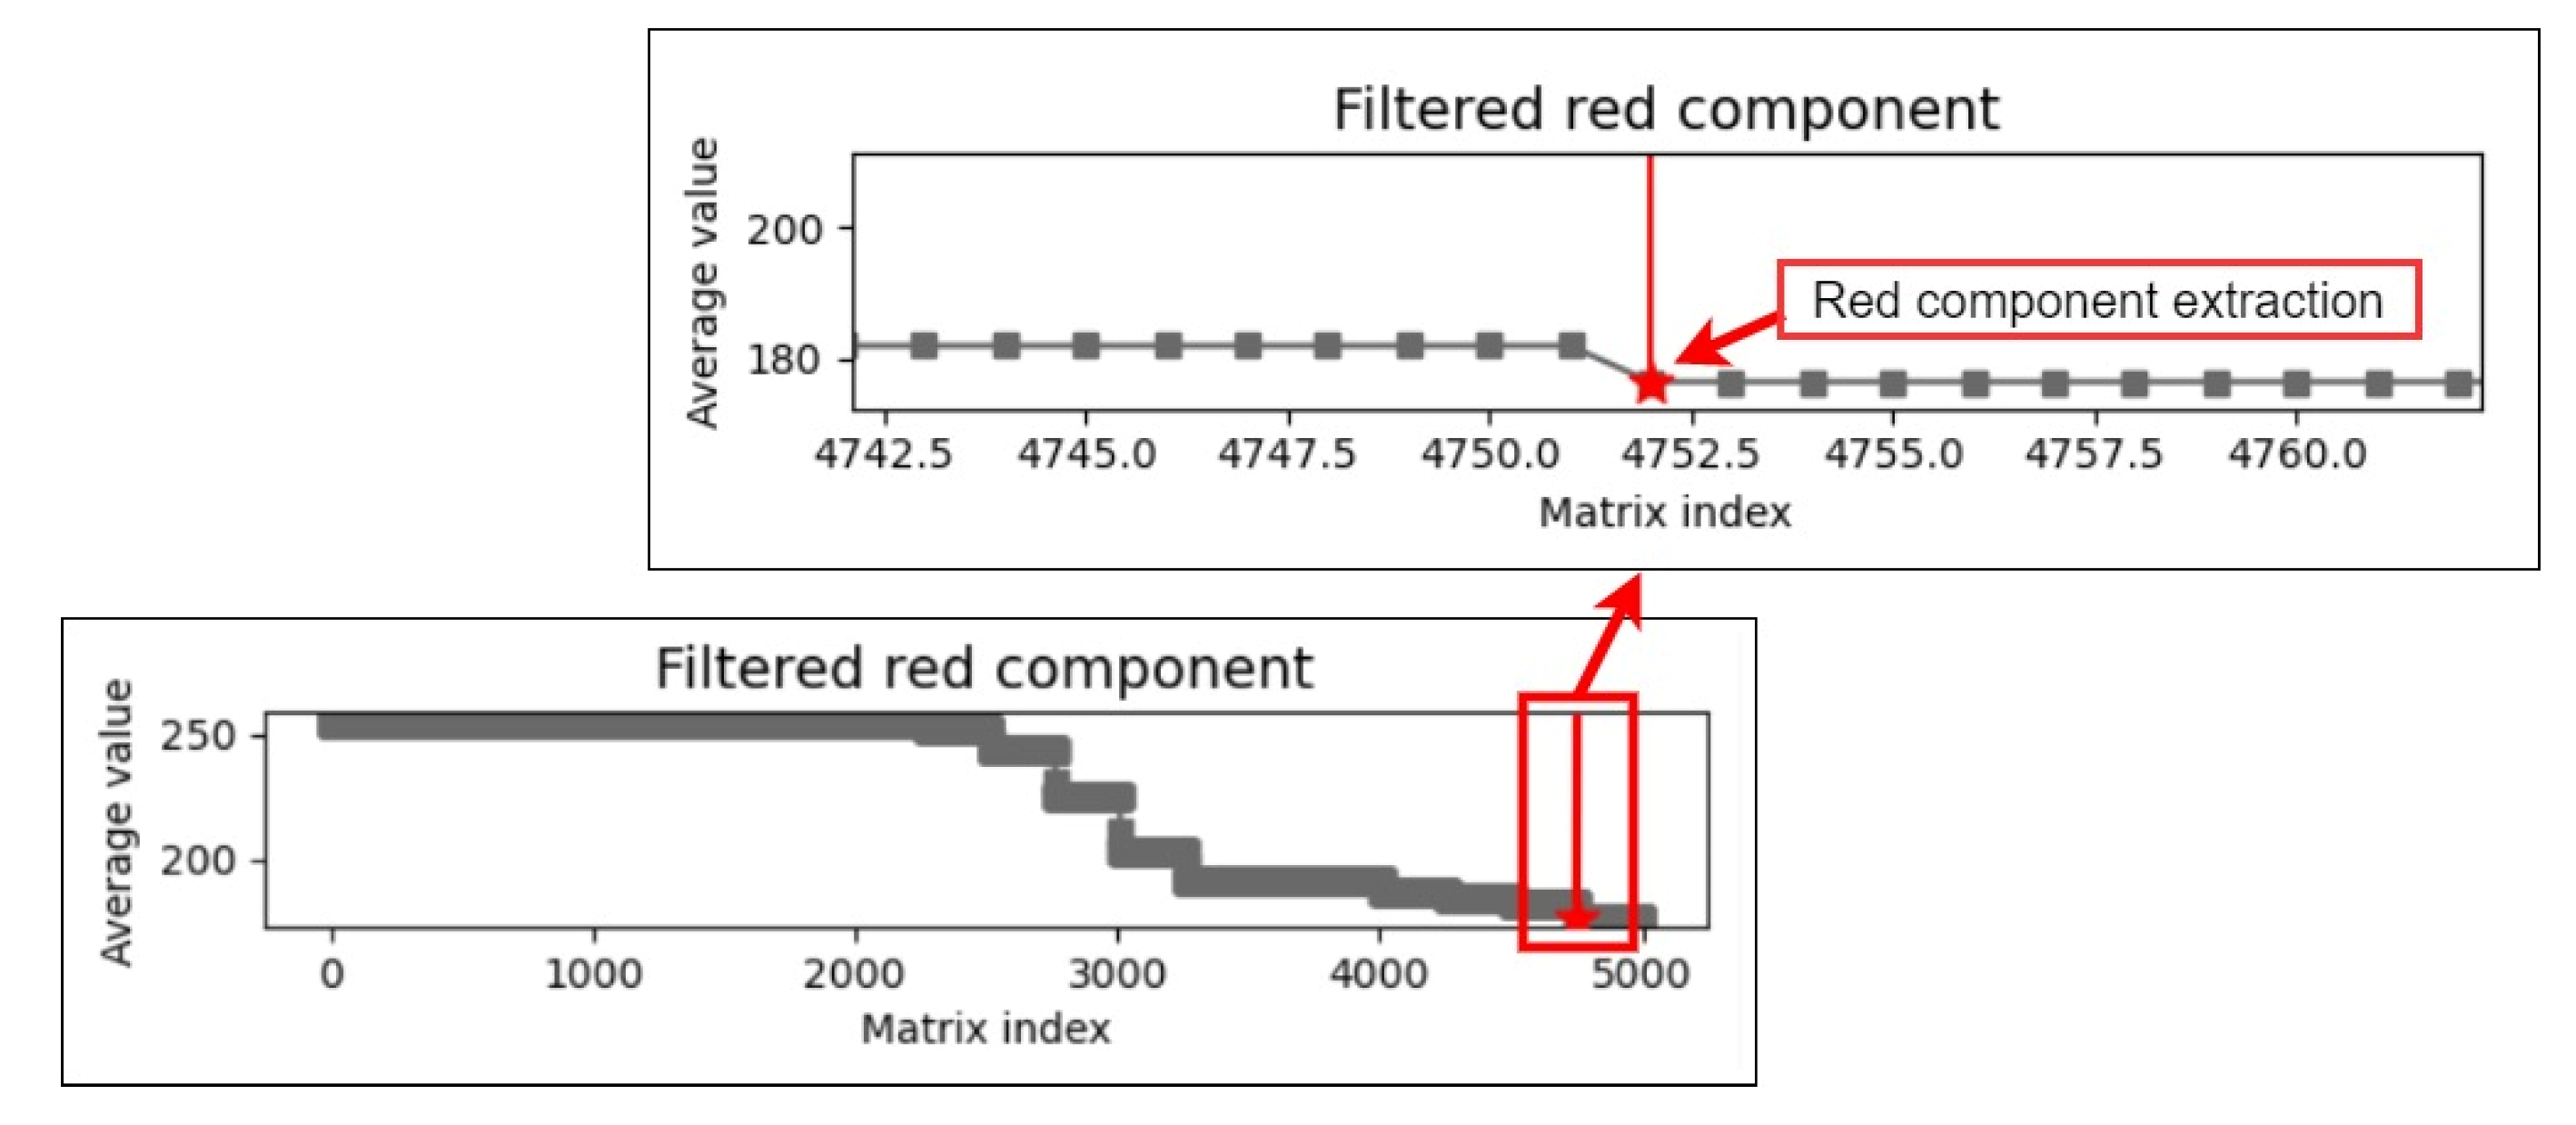
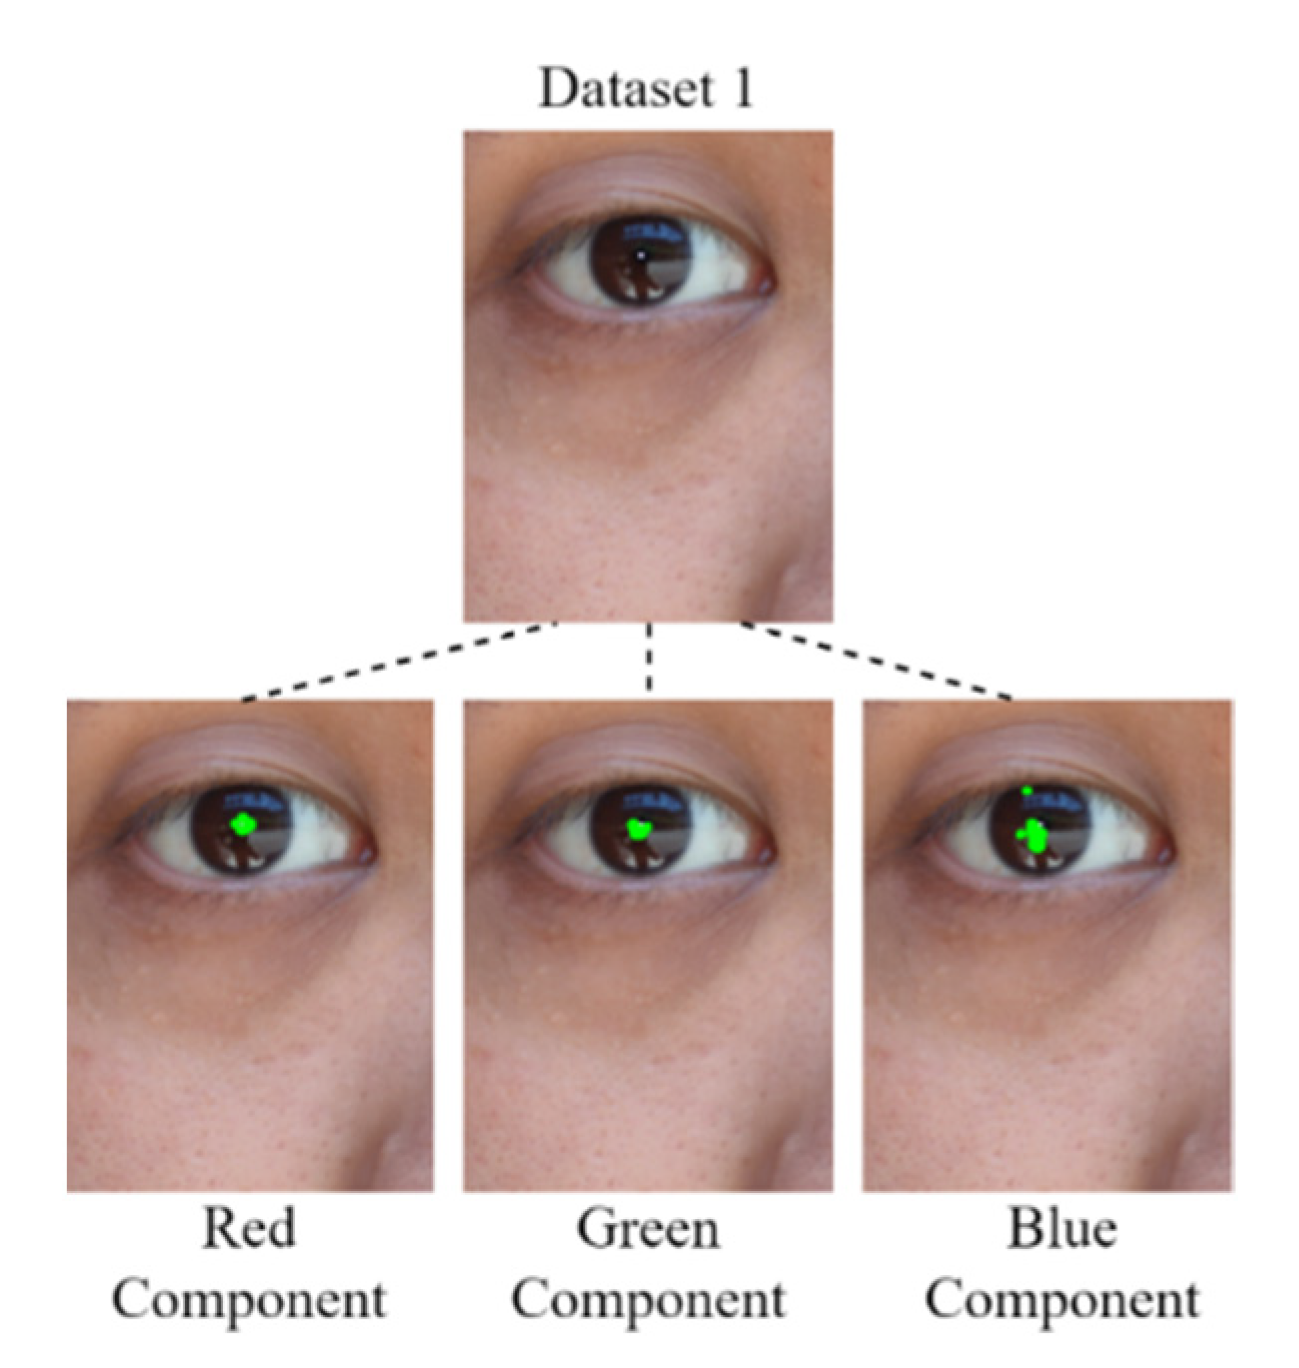
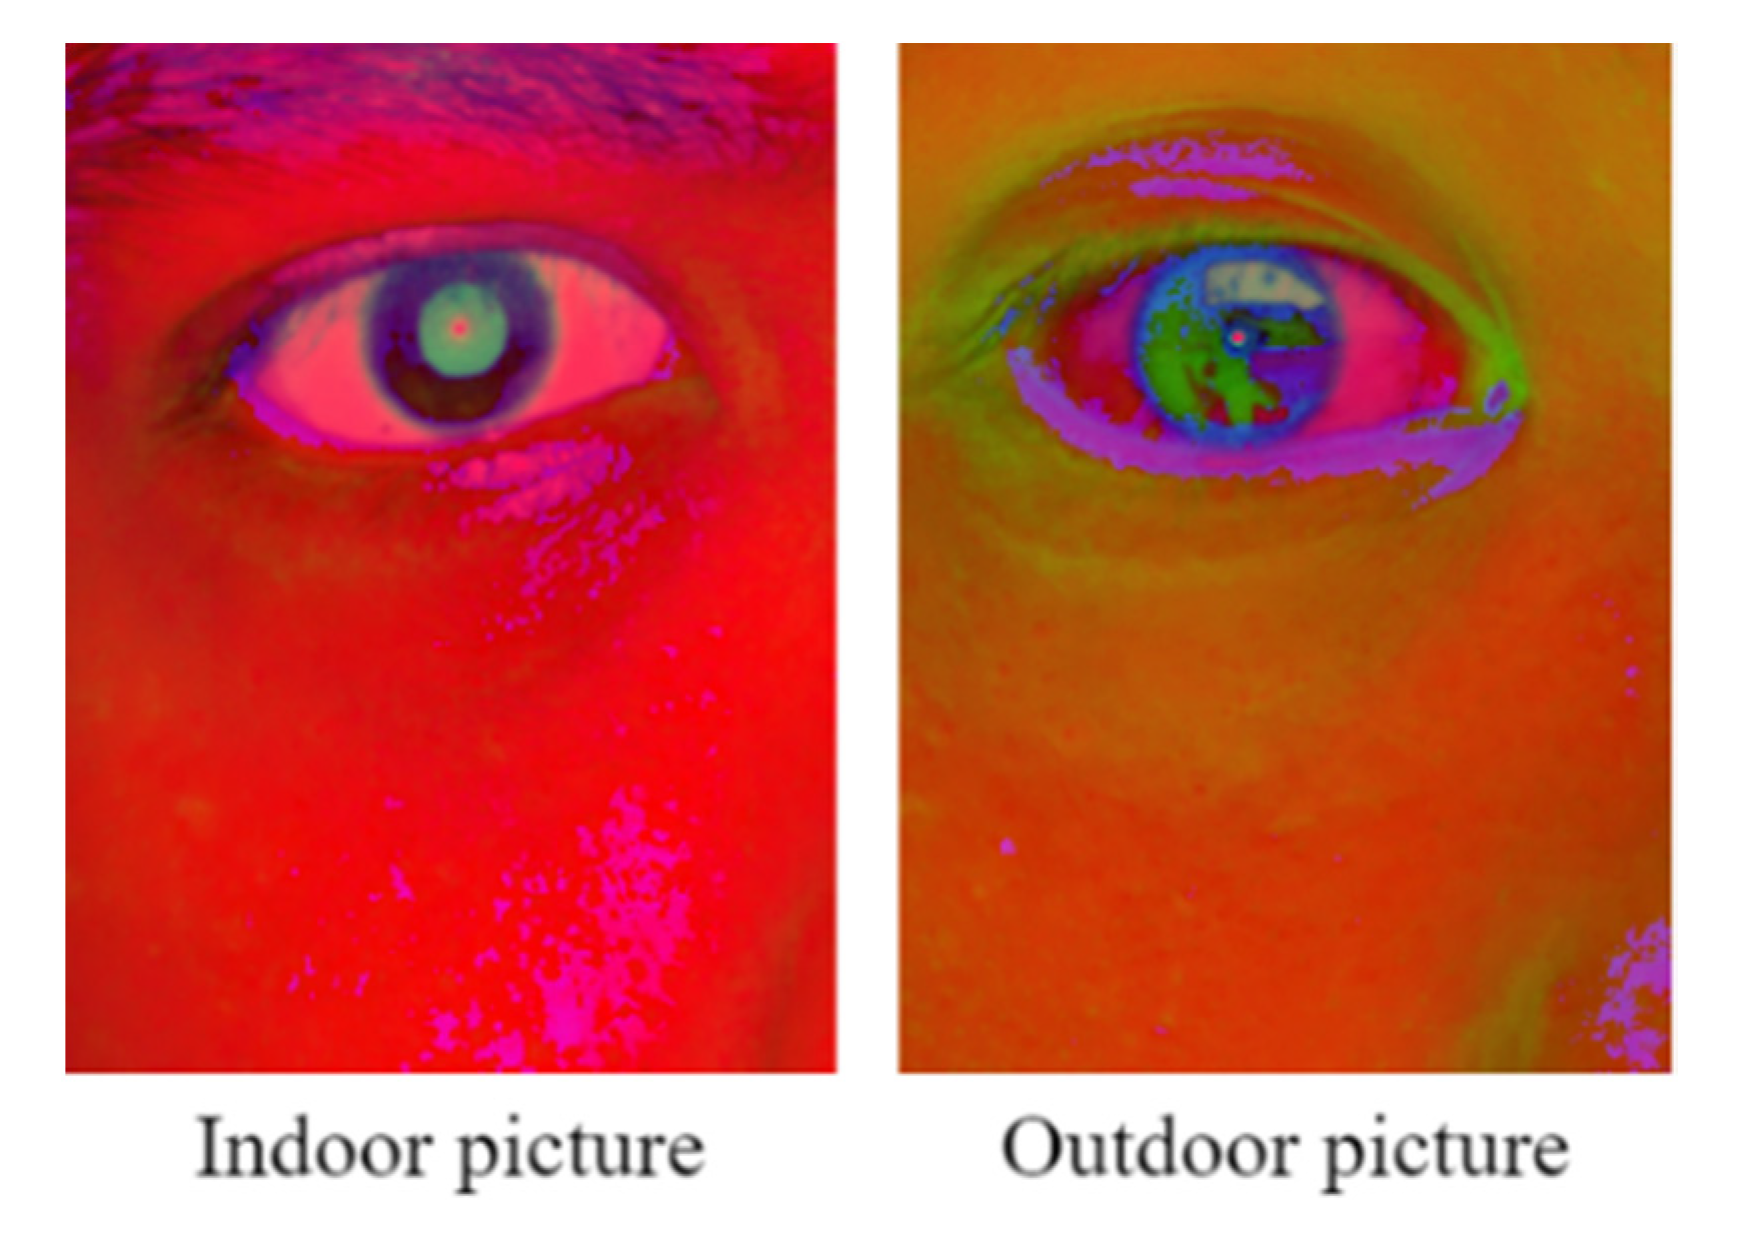
3.1.1. Extraction of Color Components
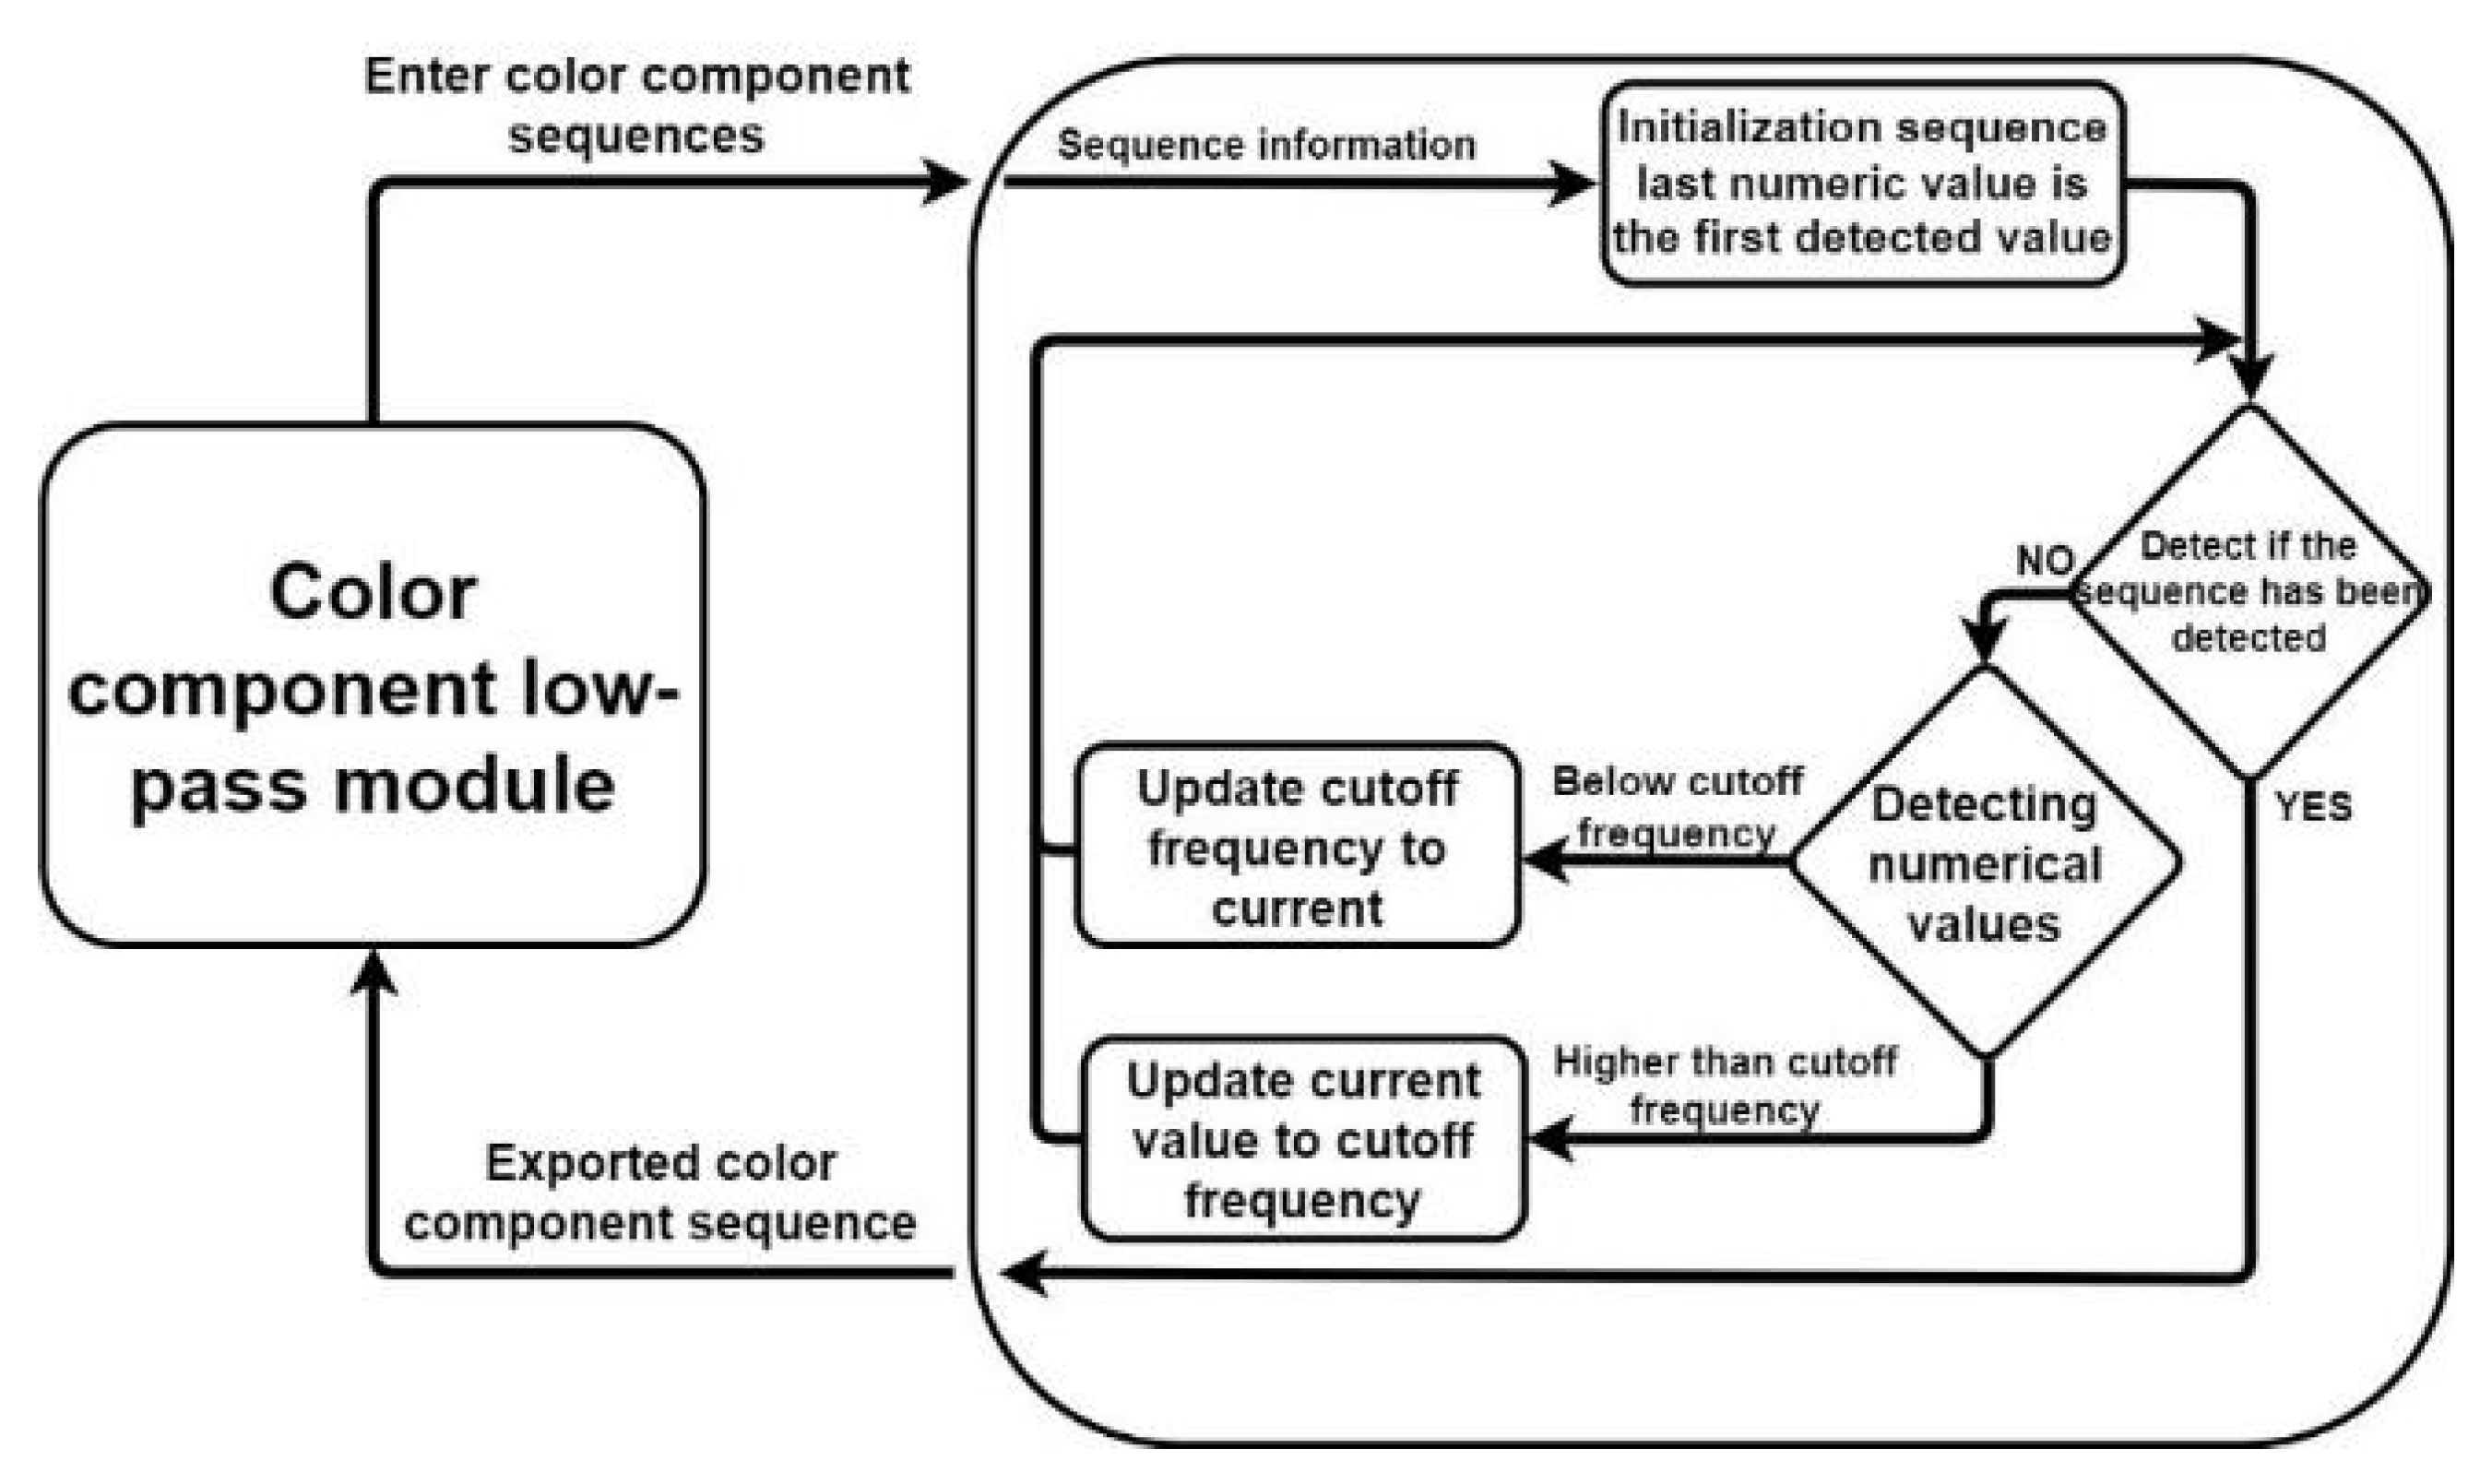
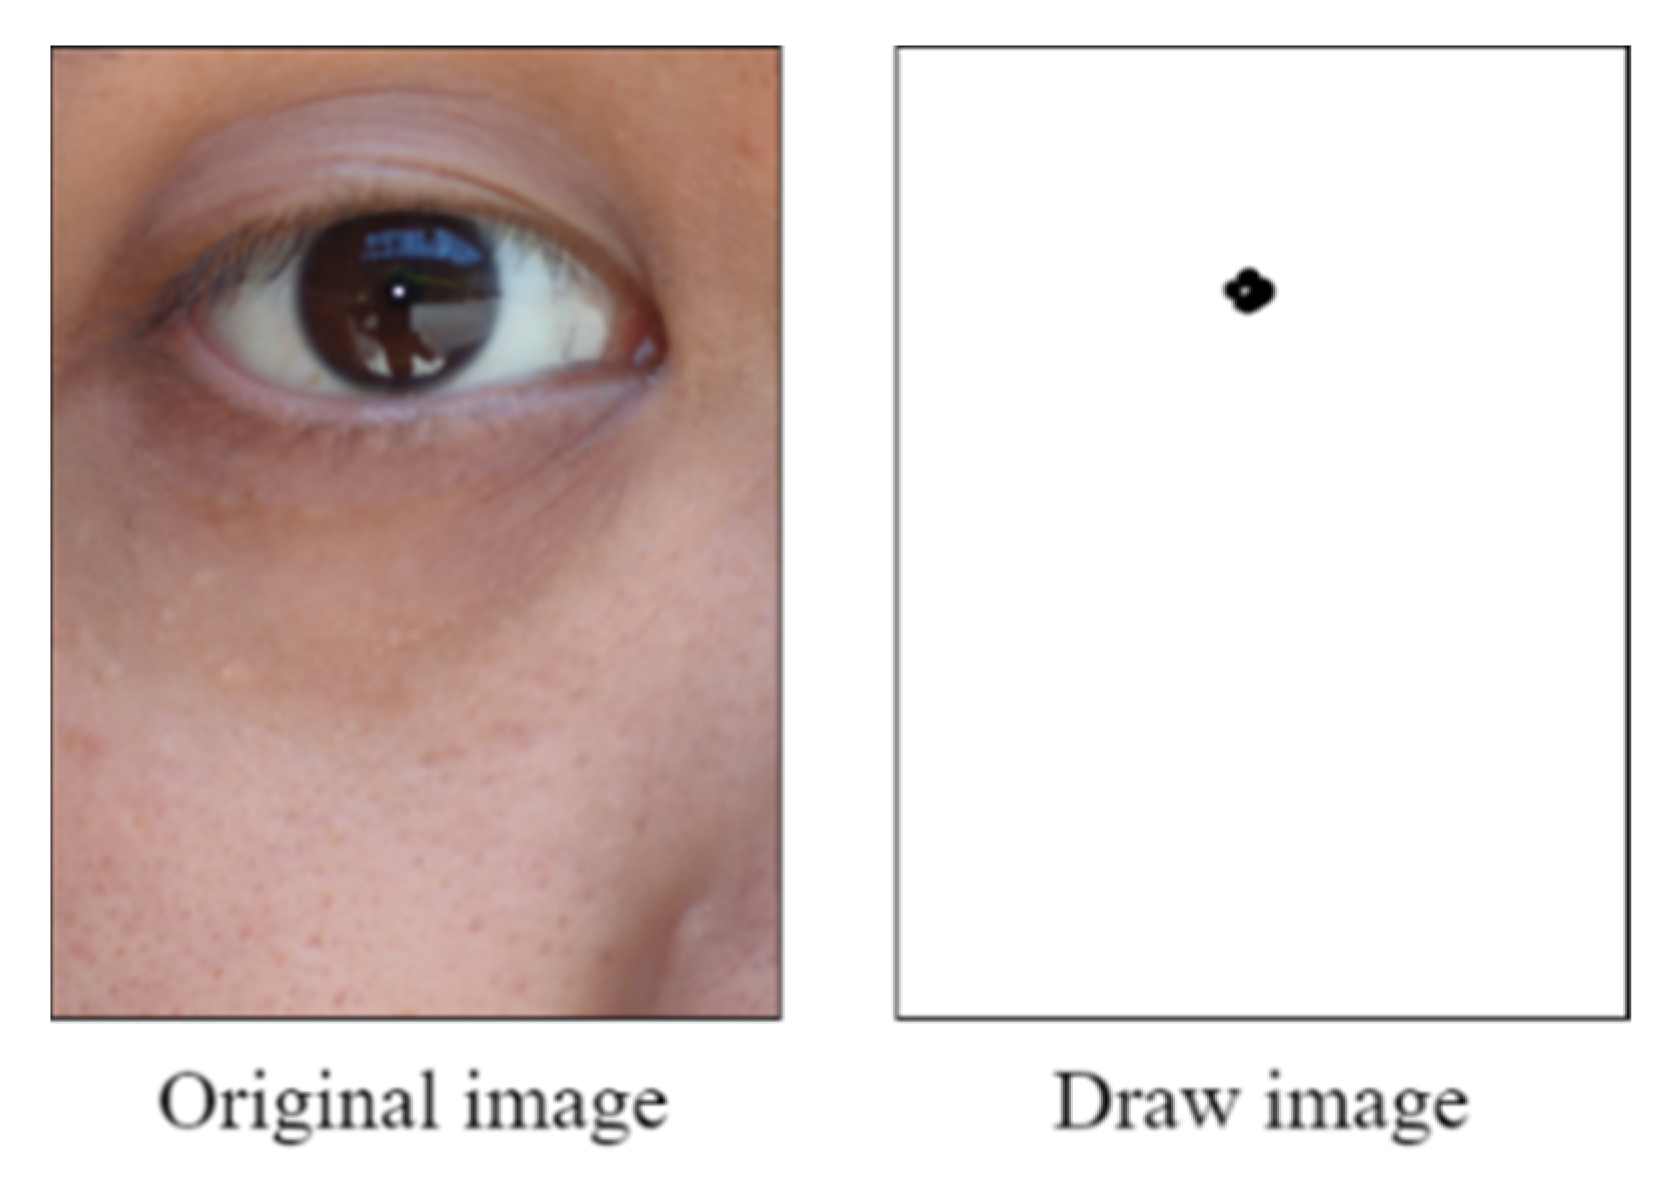
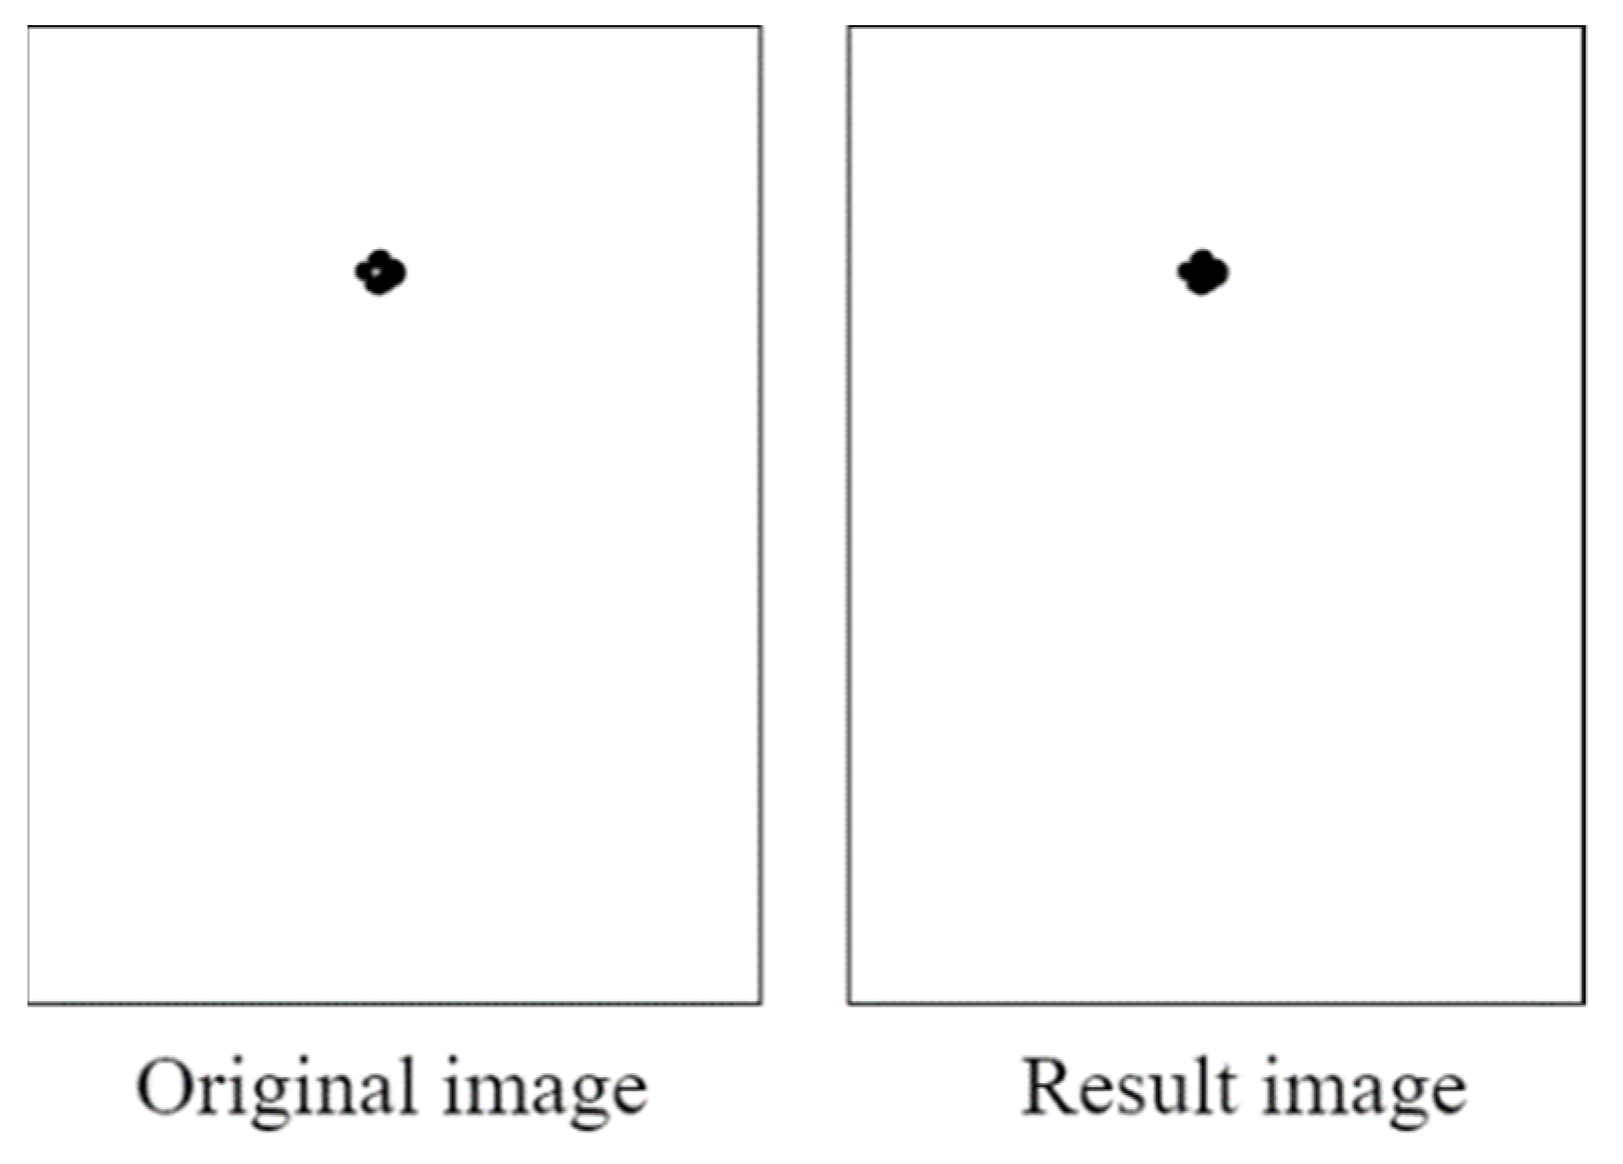
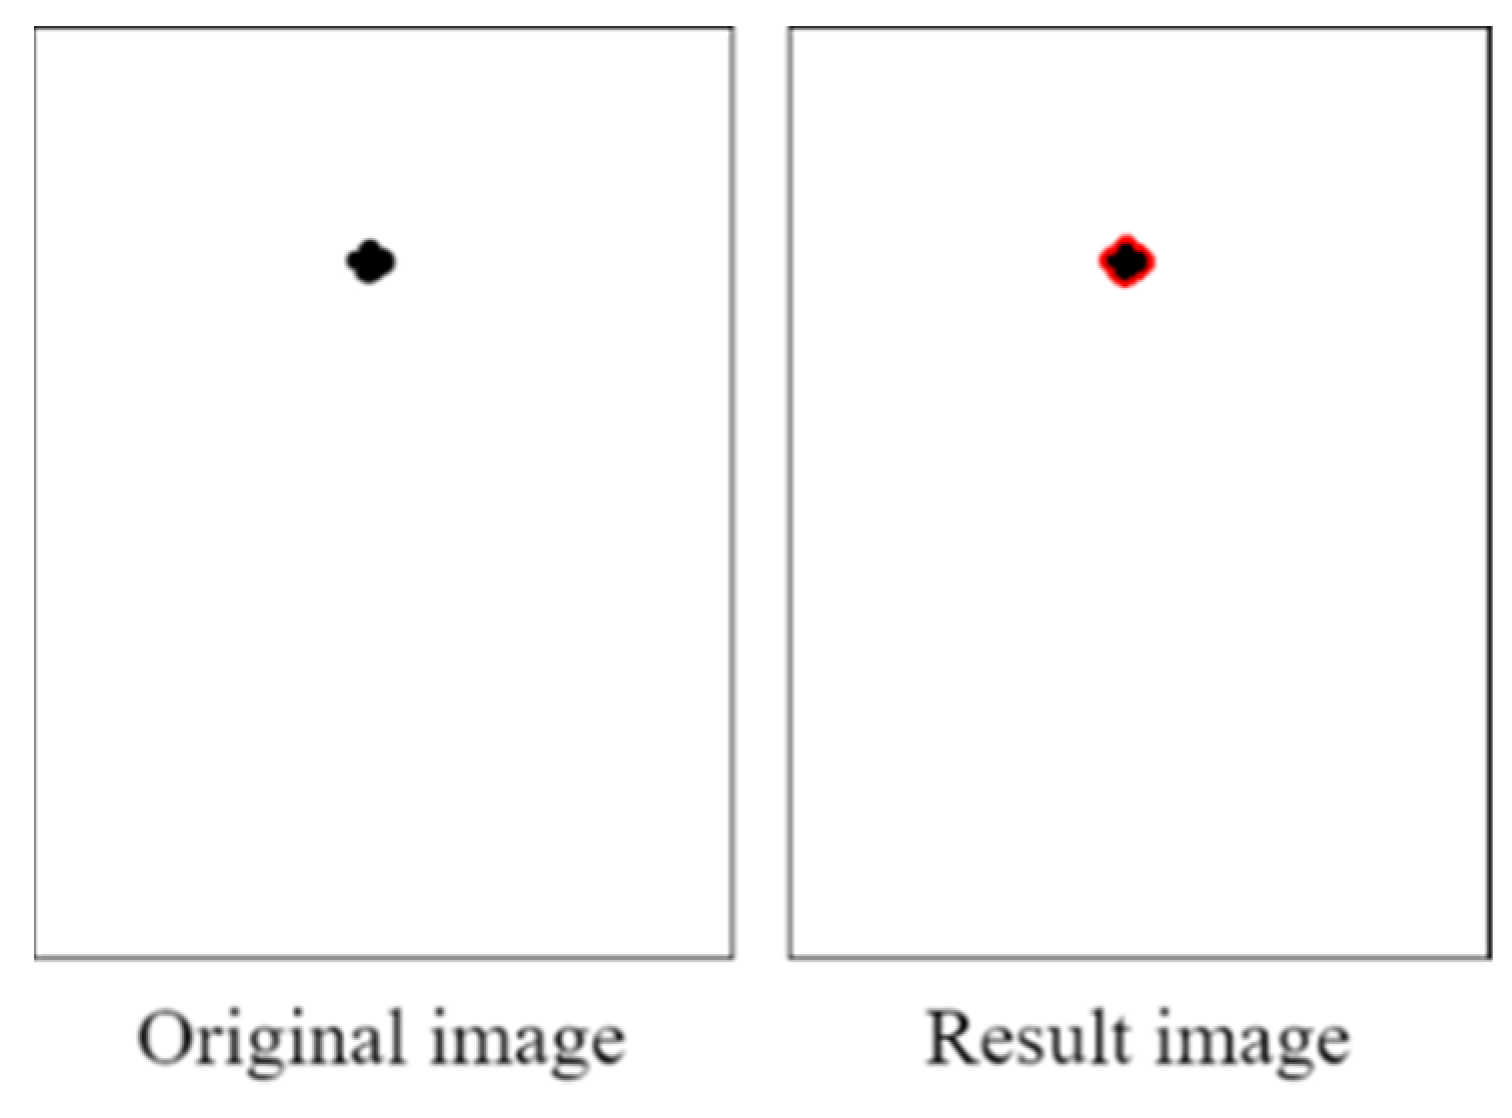
3.1.2. CCLPF Module
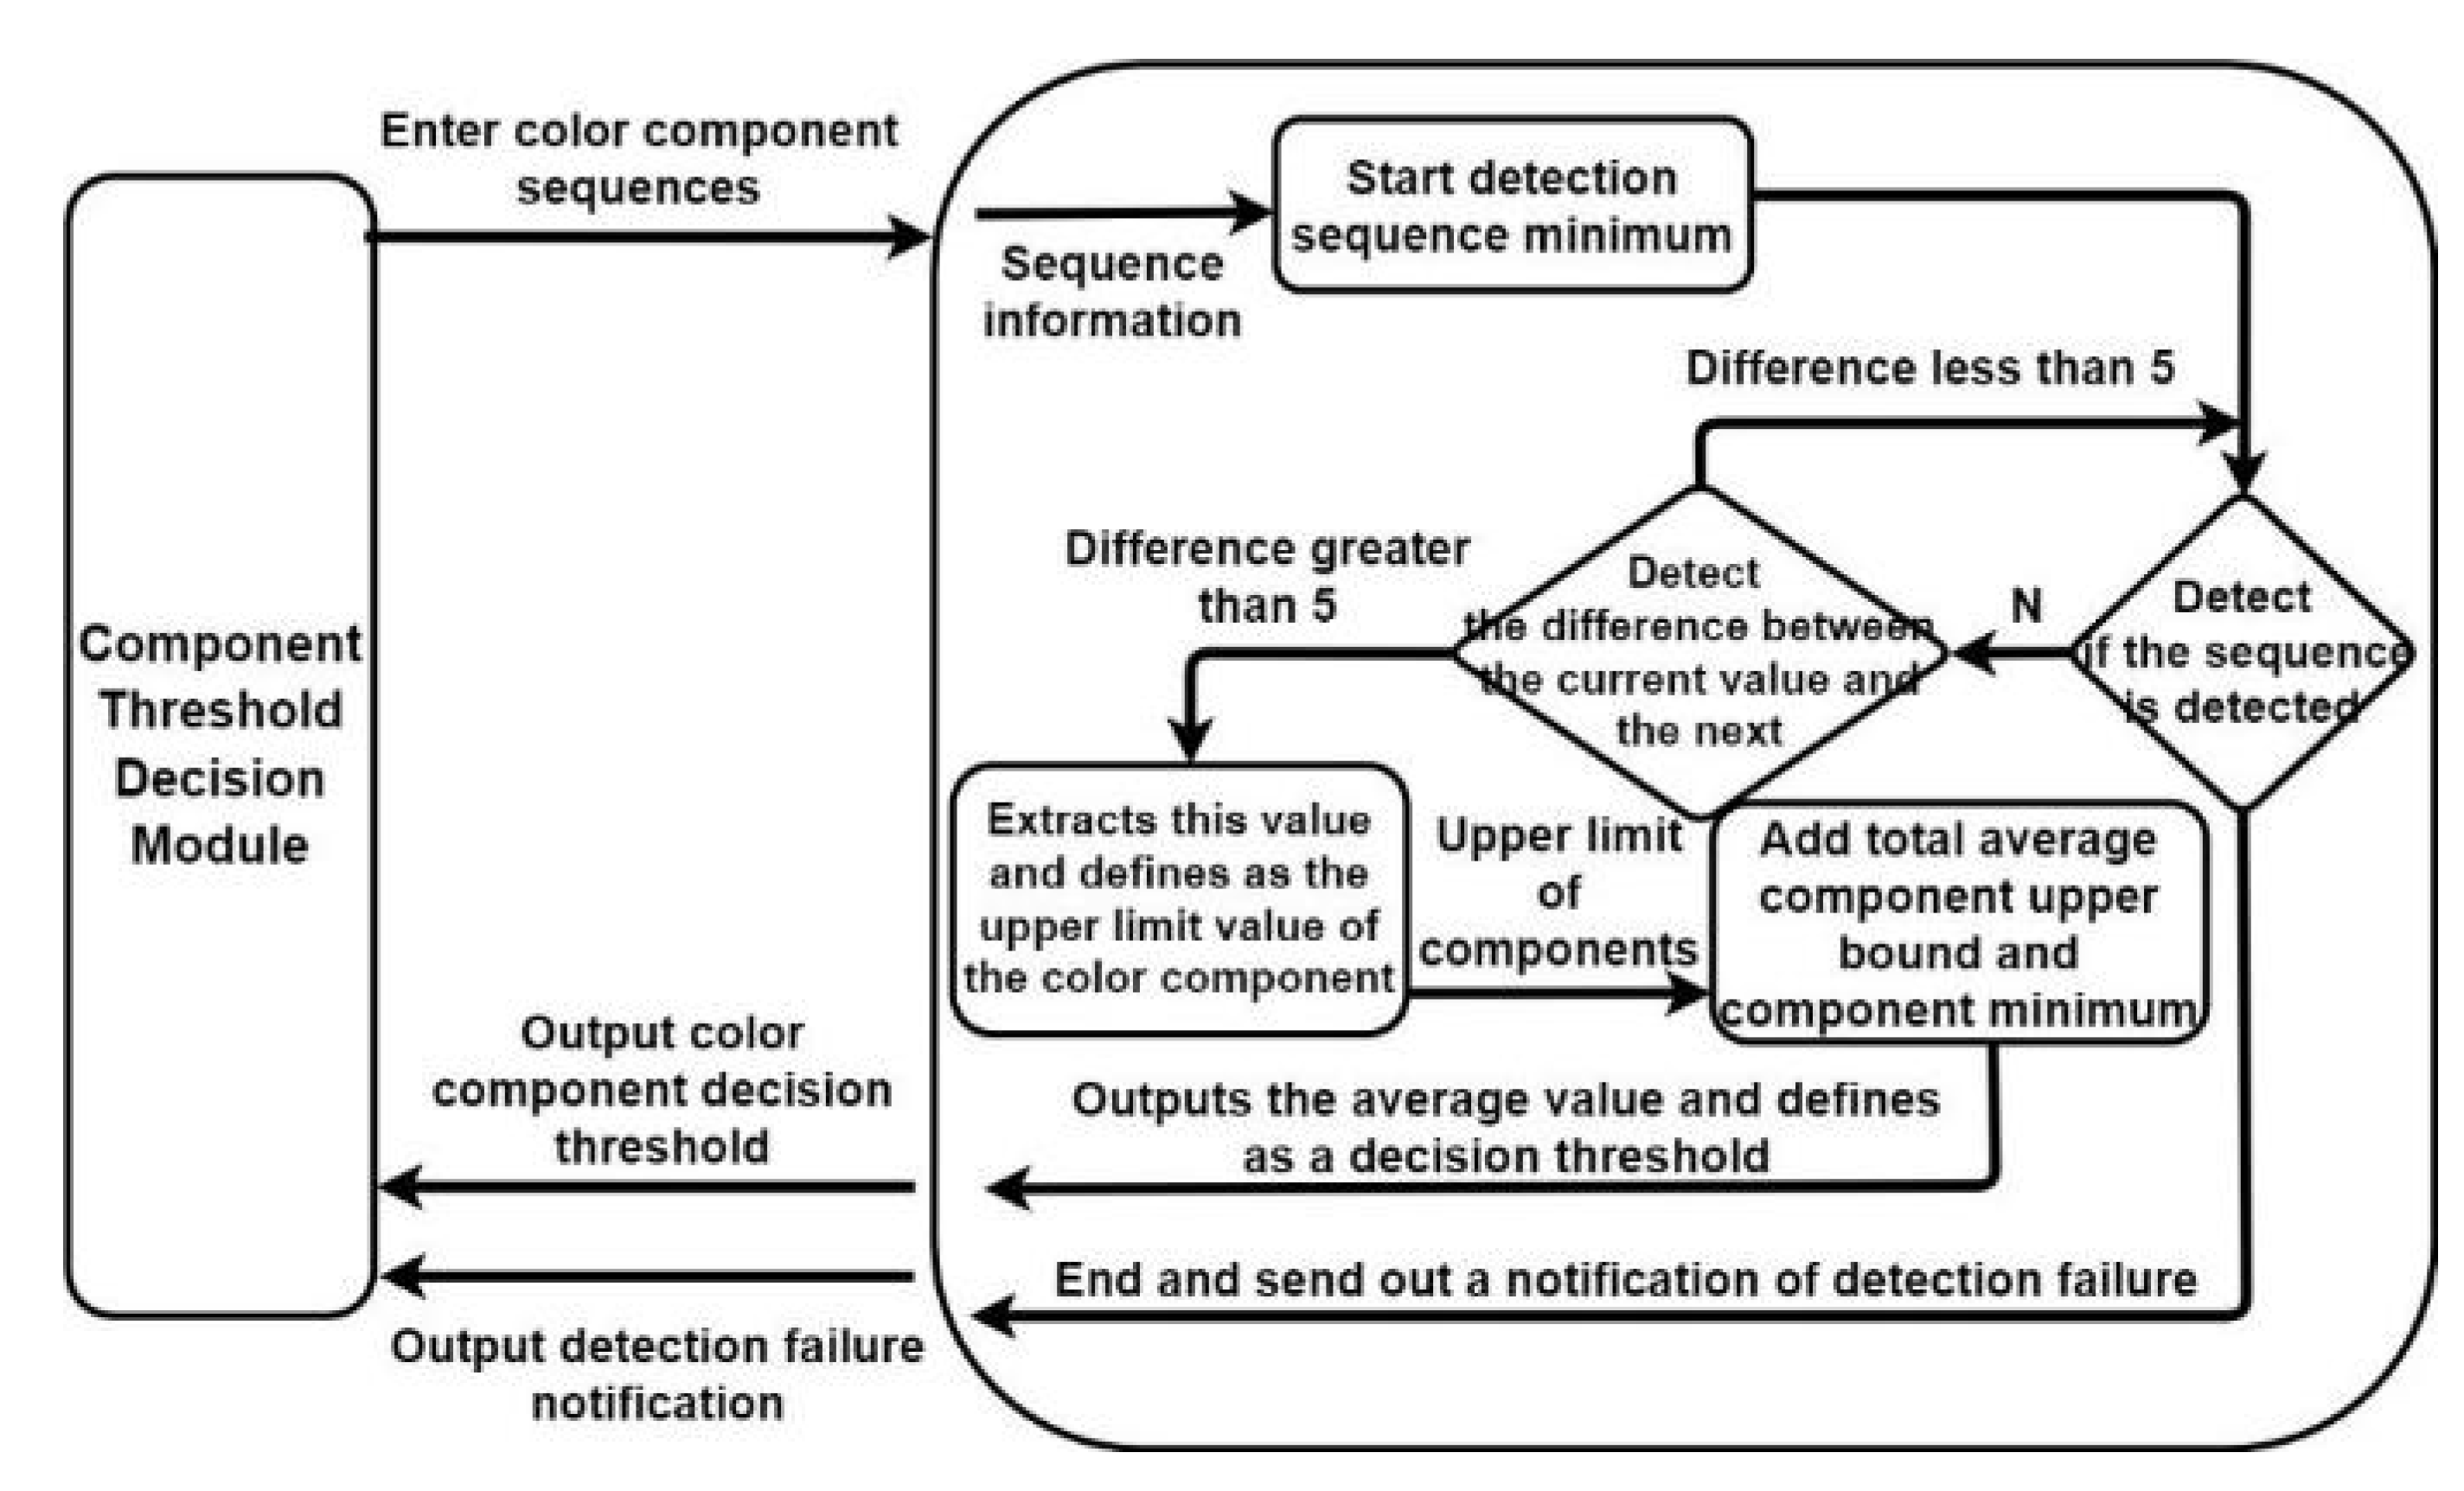
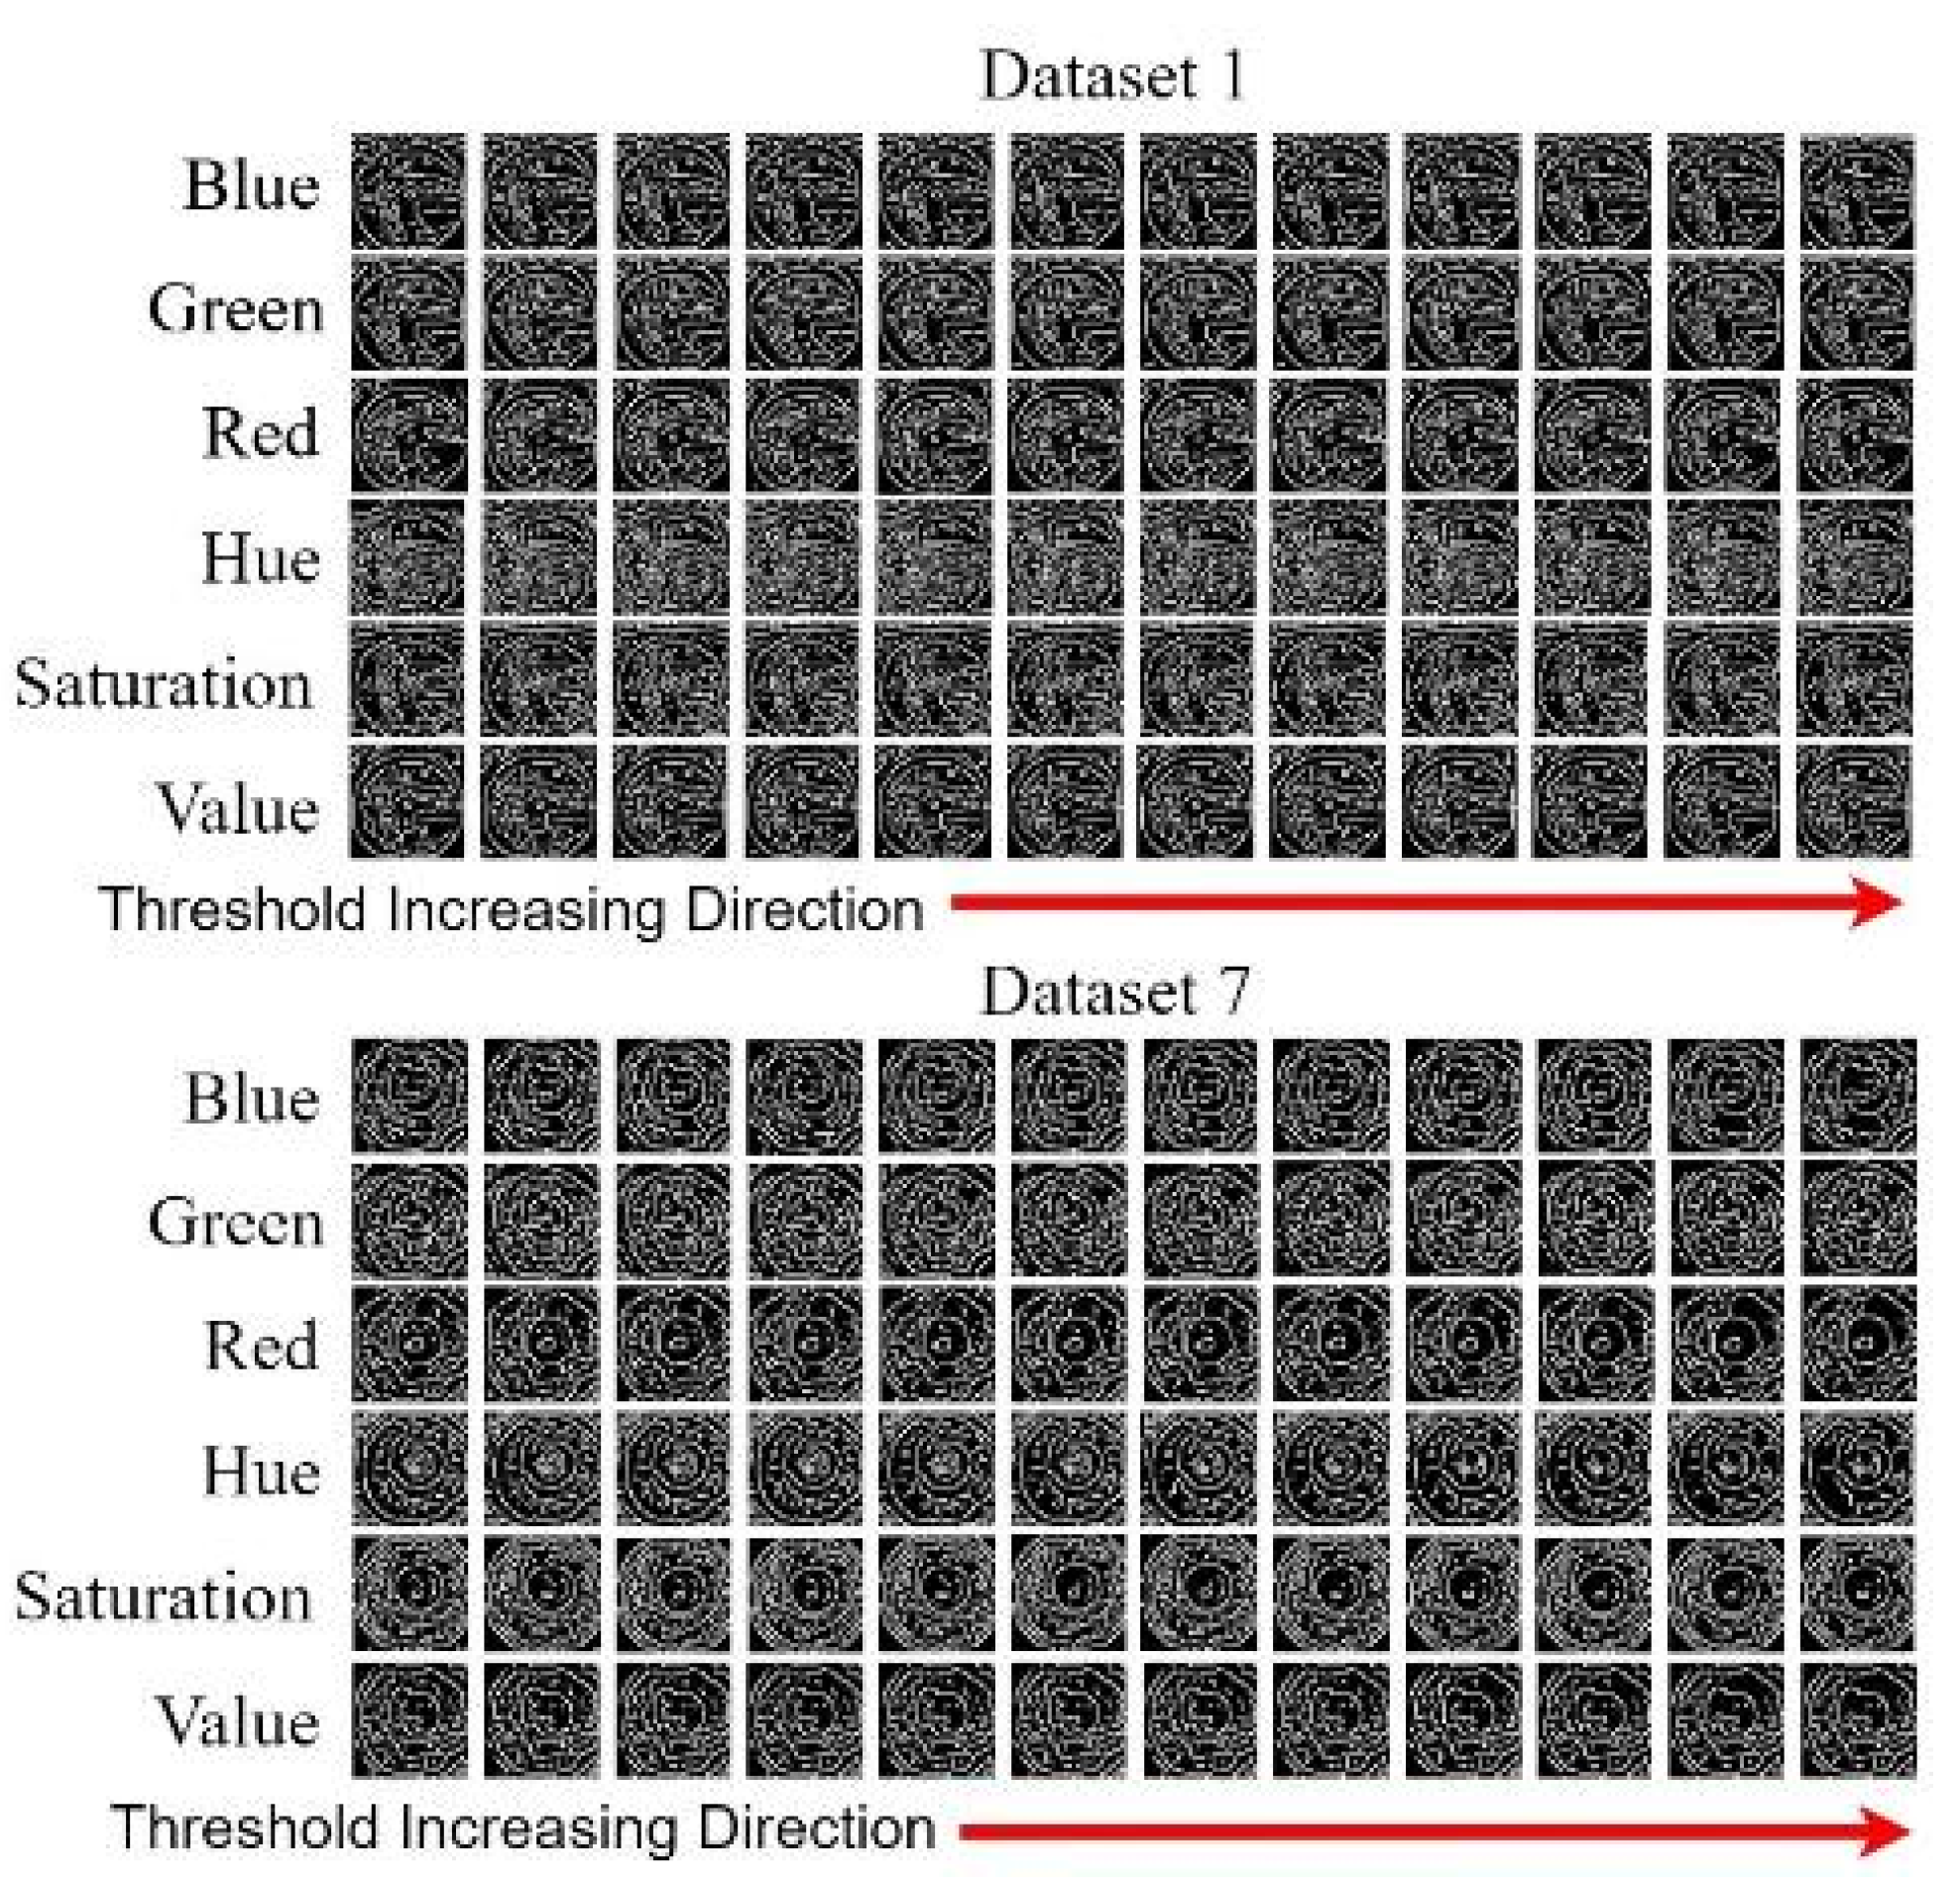
3.1.3. Component Threshold Decision
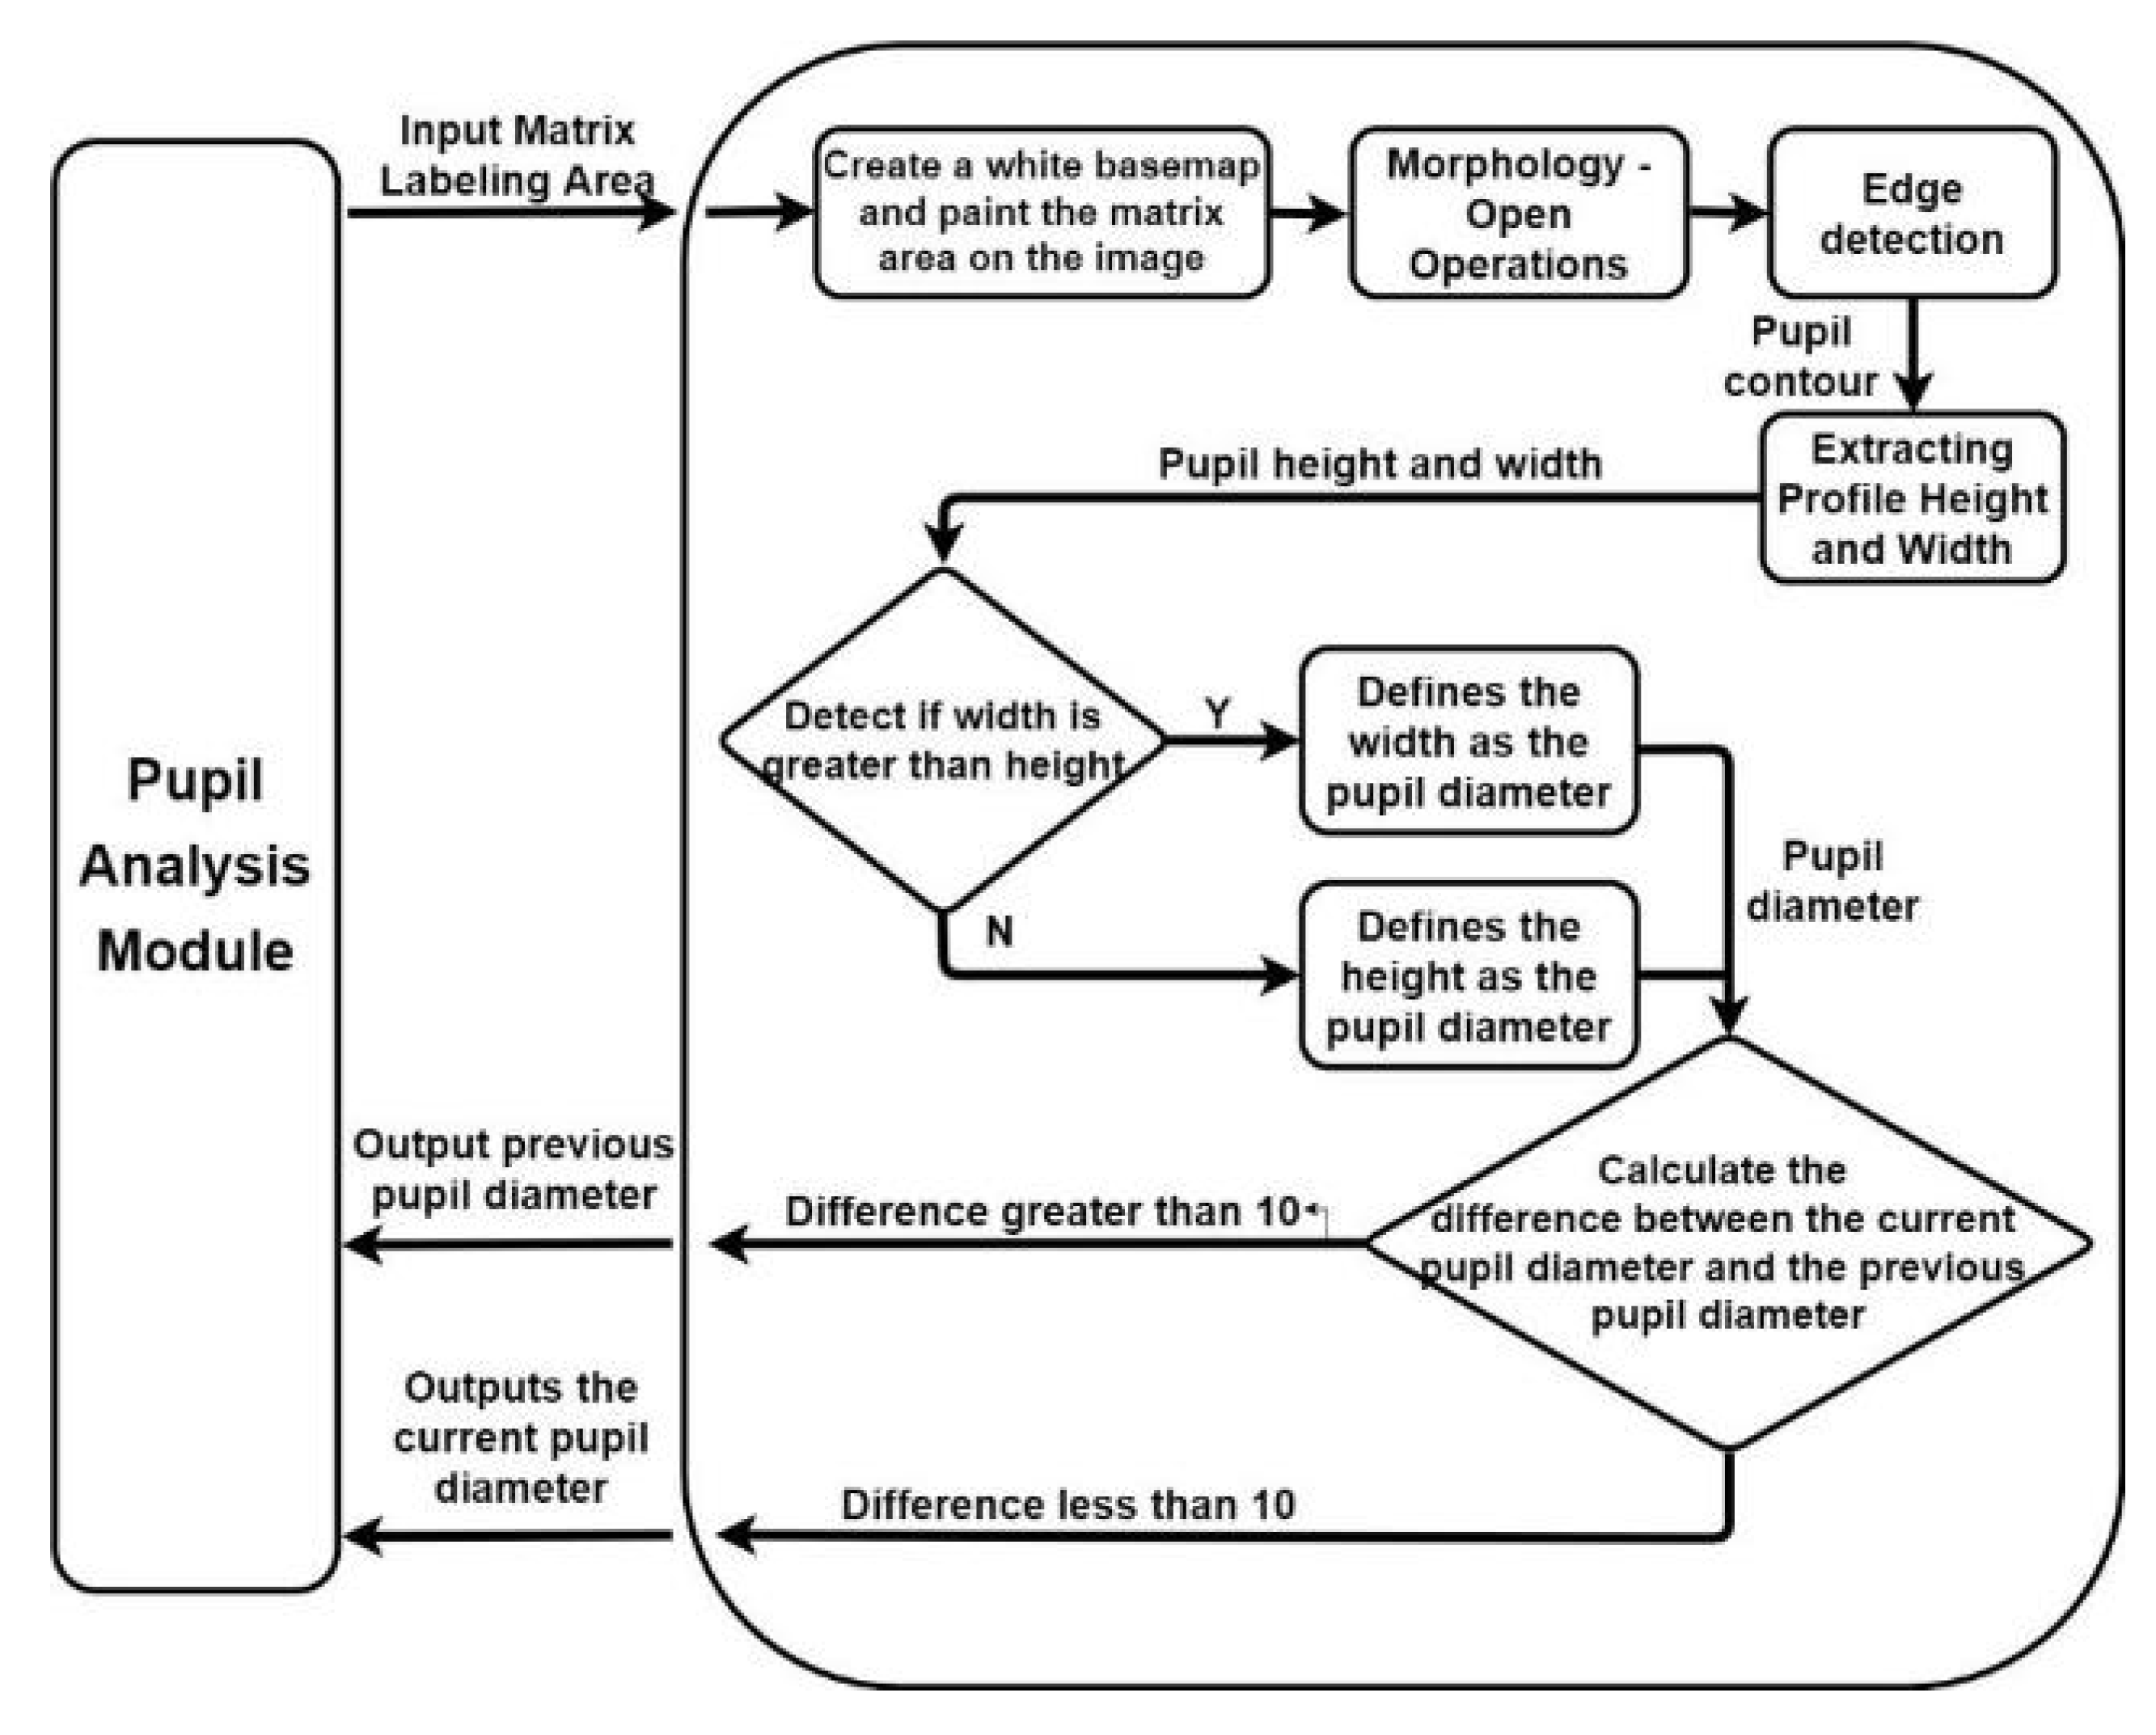
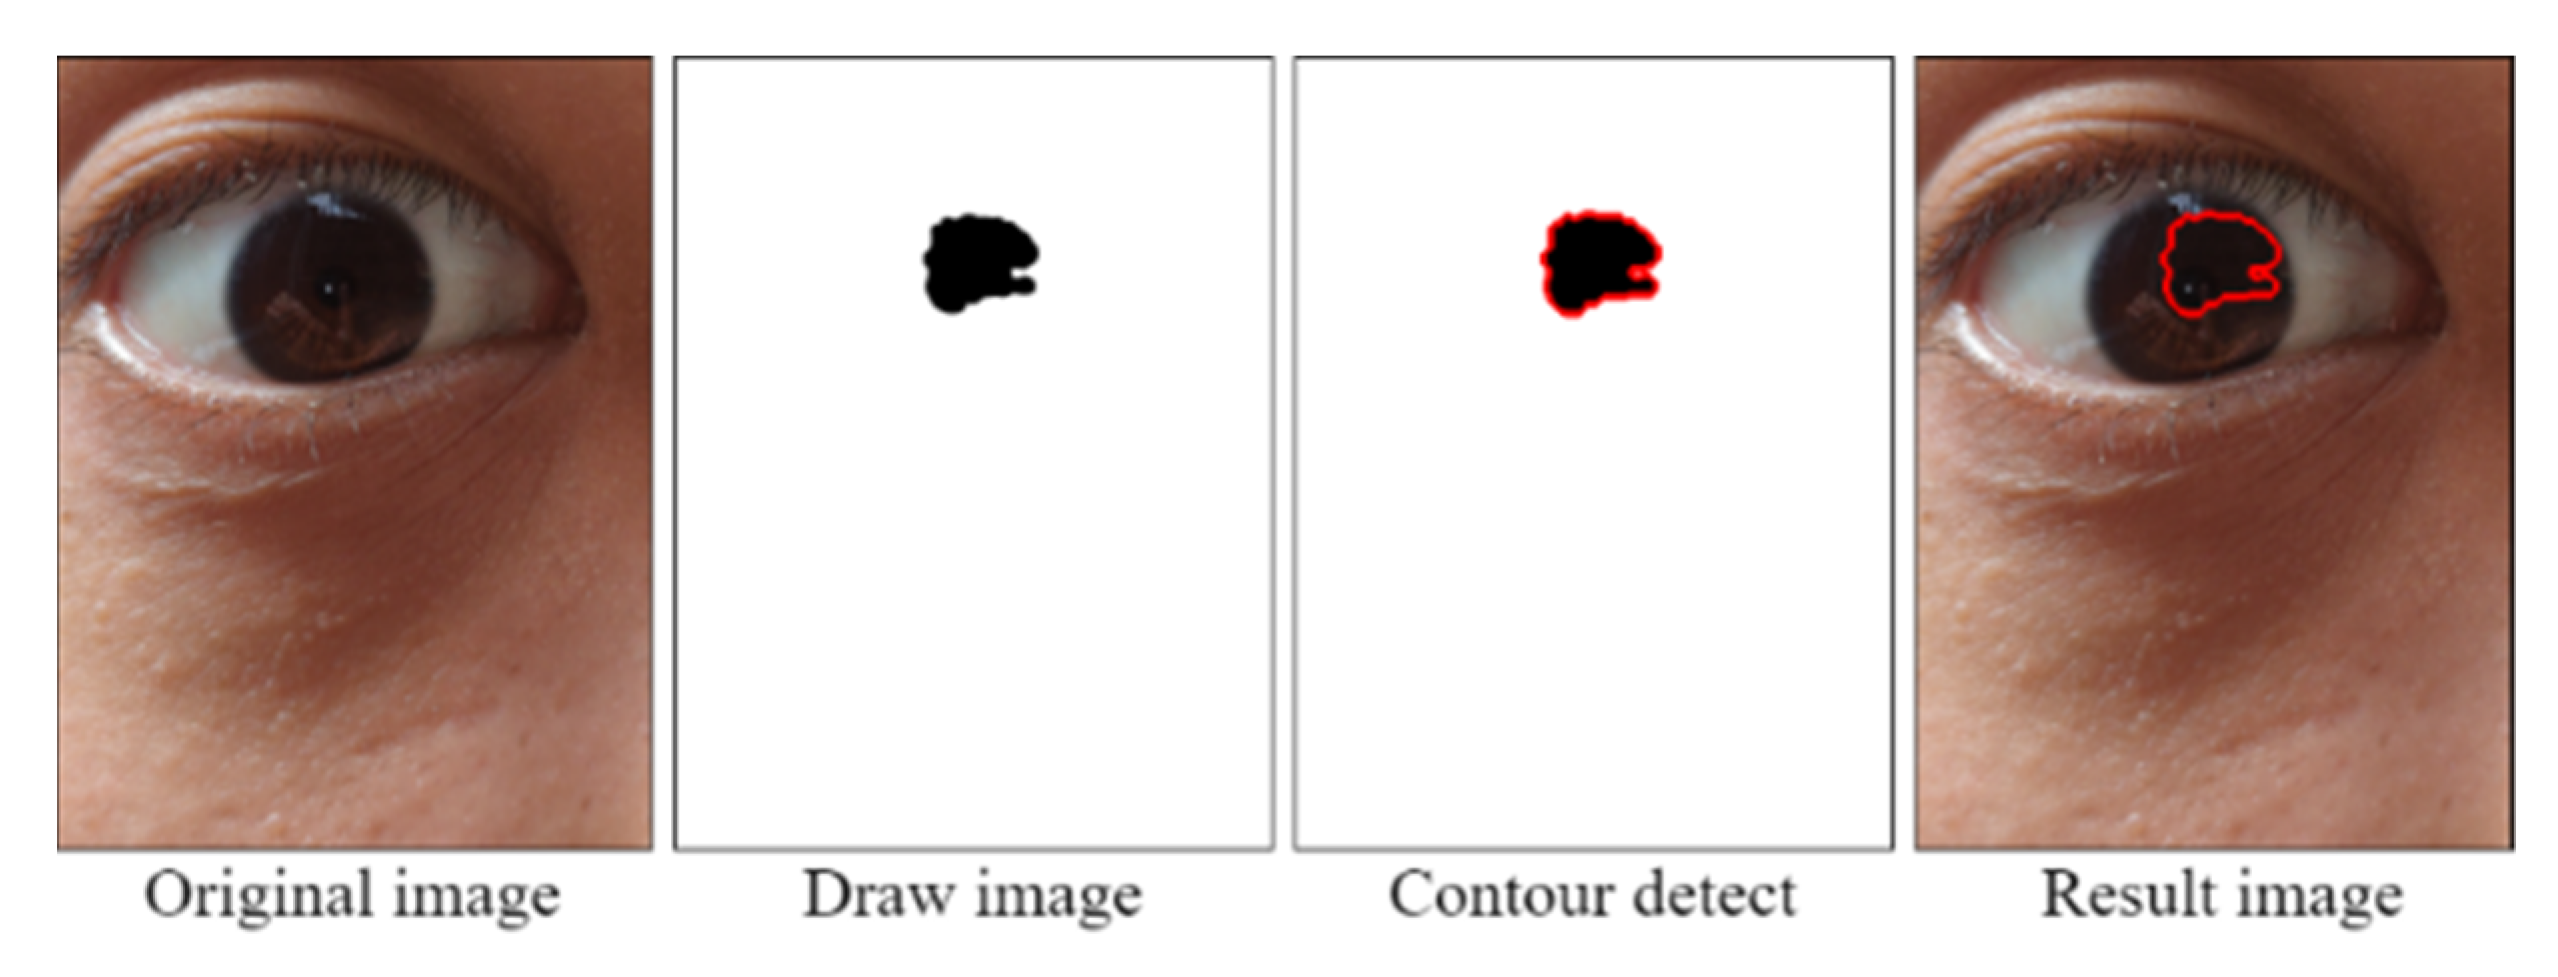
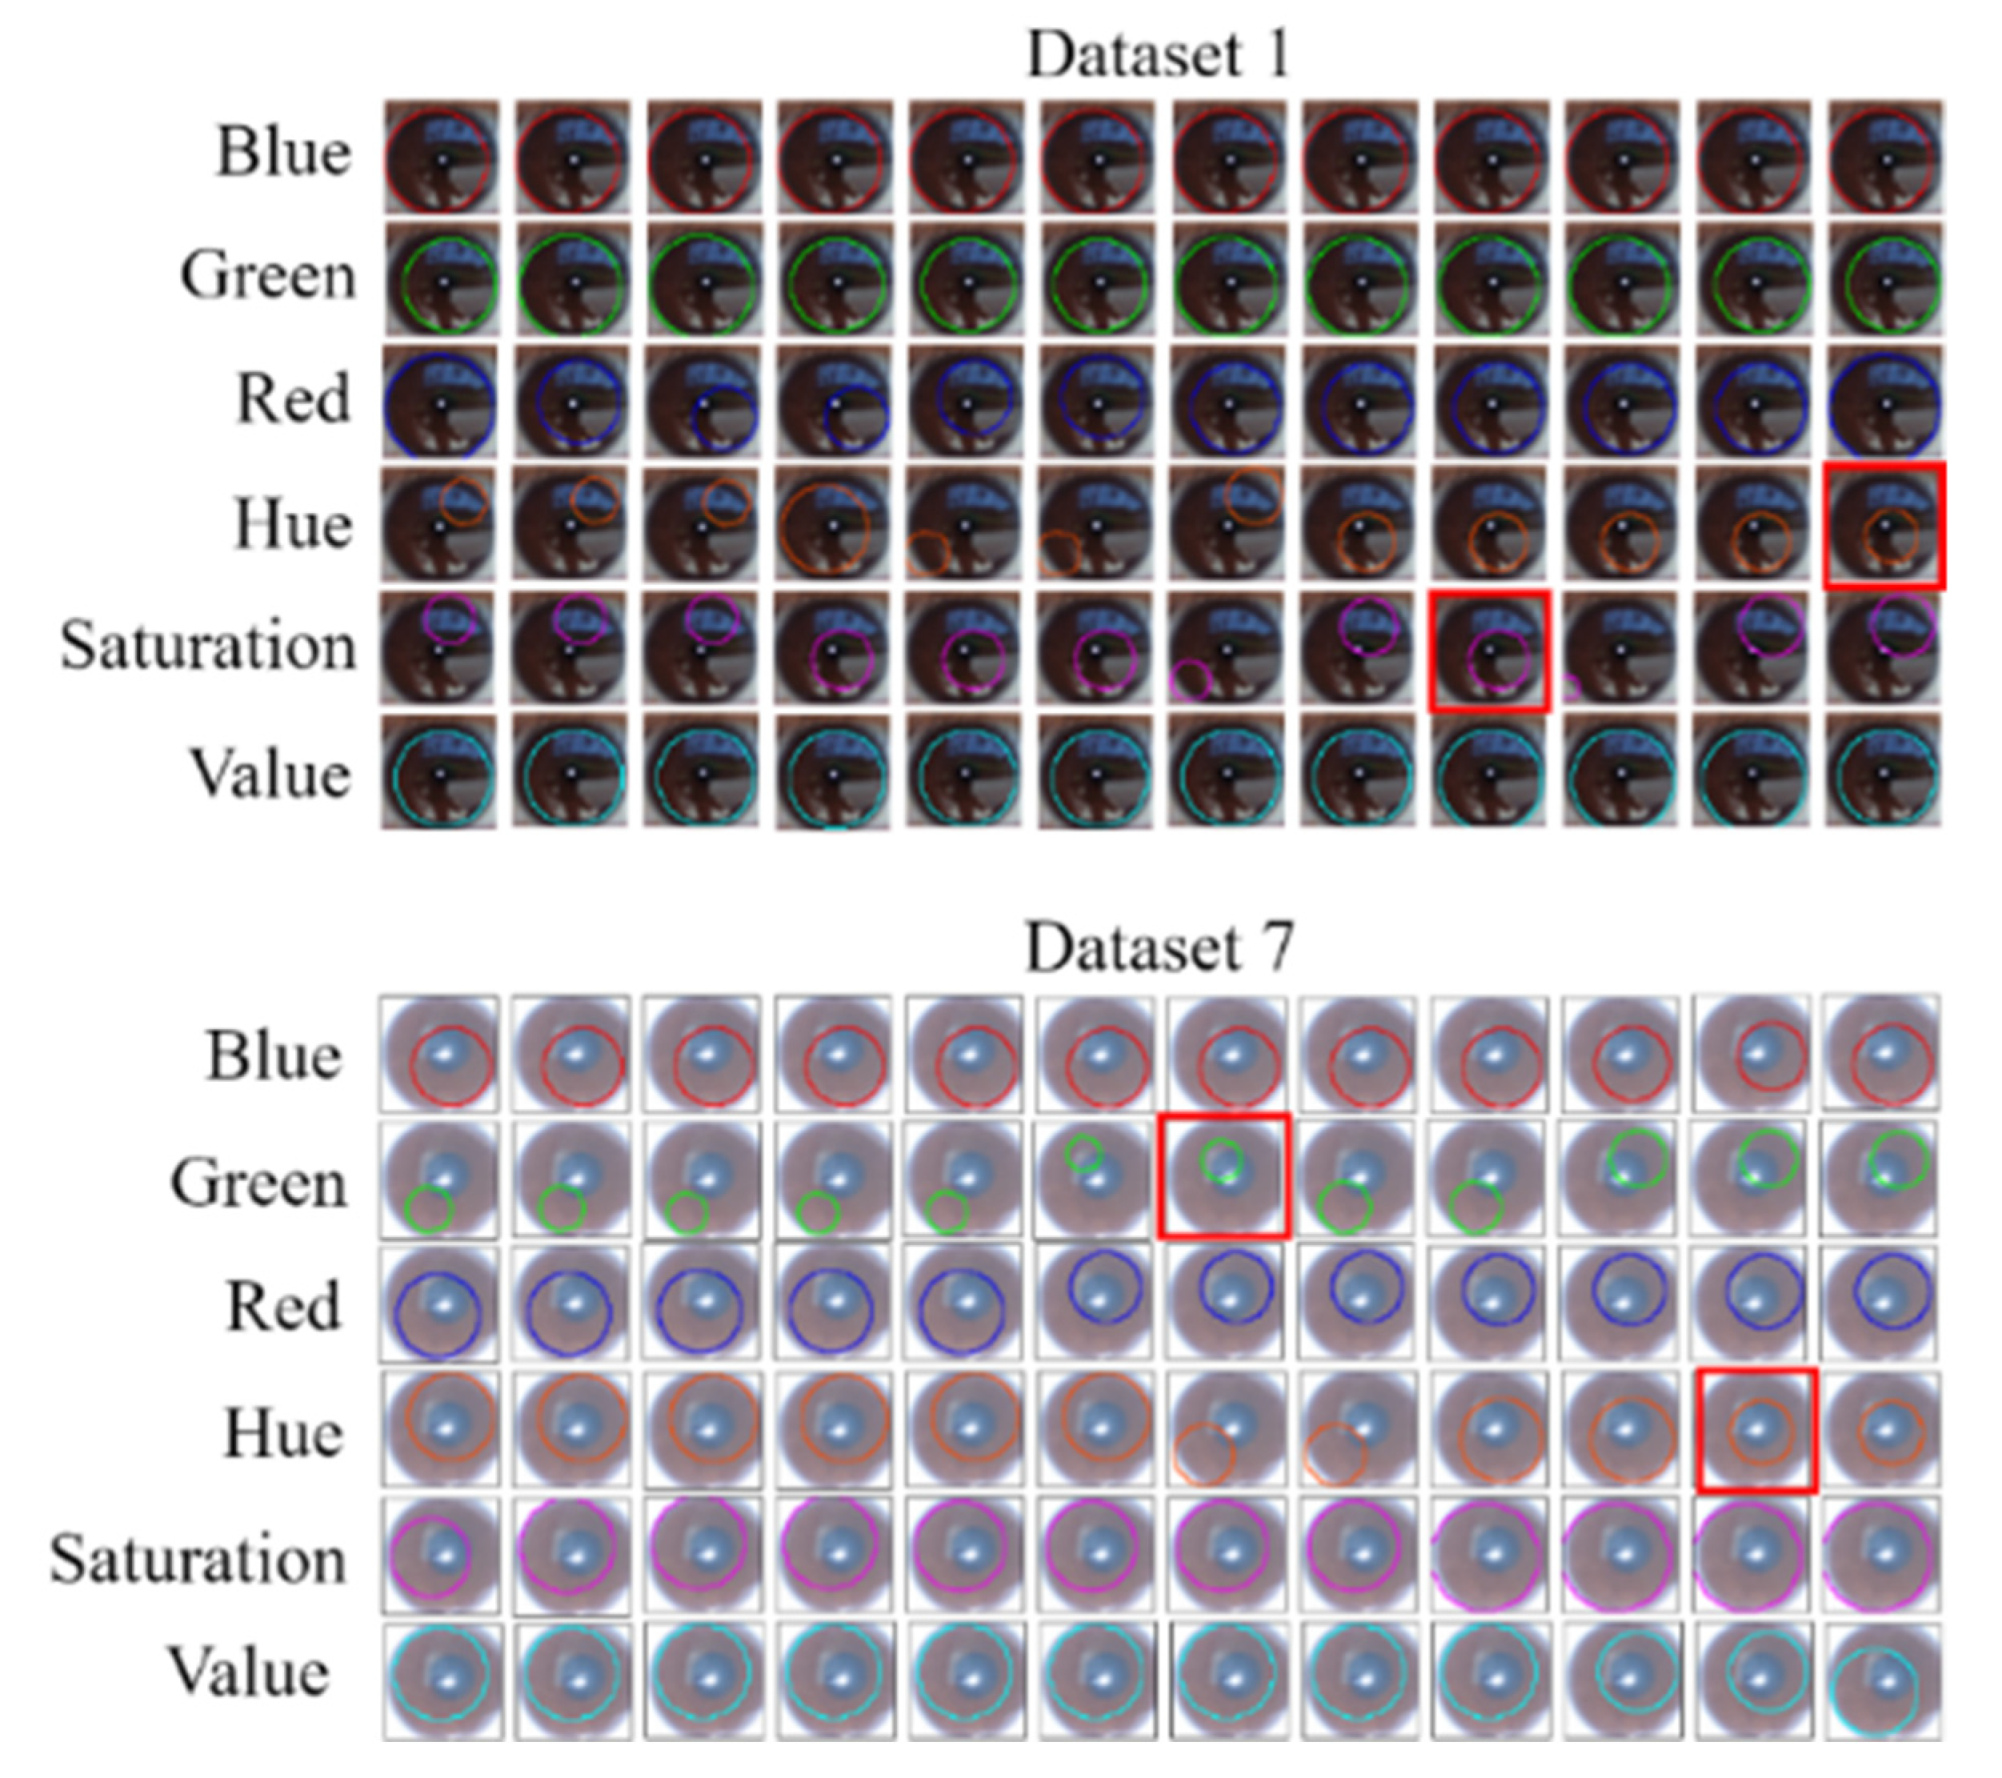
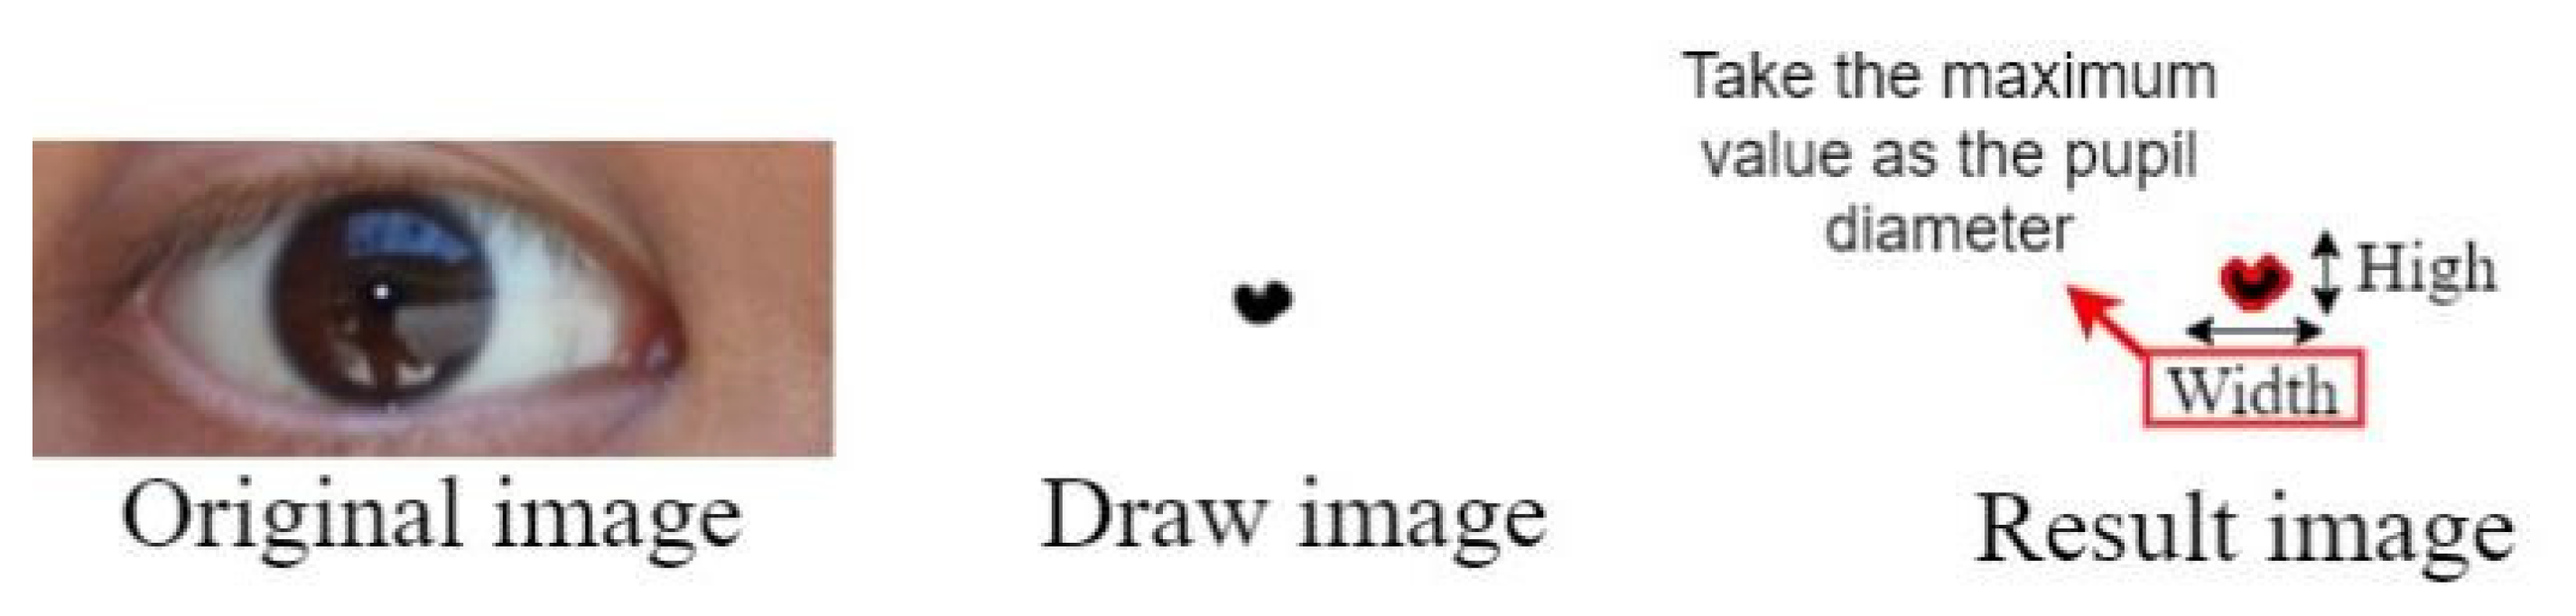
3.1.4. Pupil Diameter Analysis
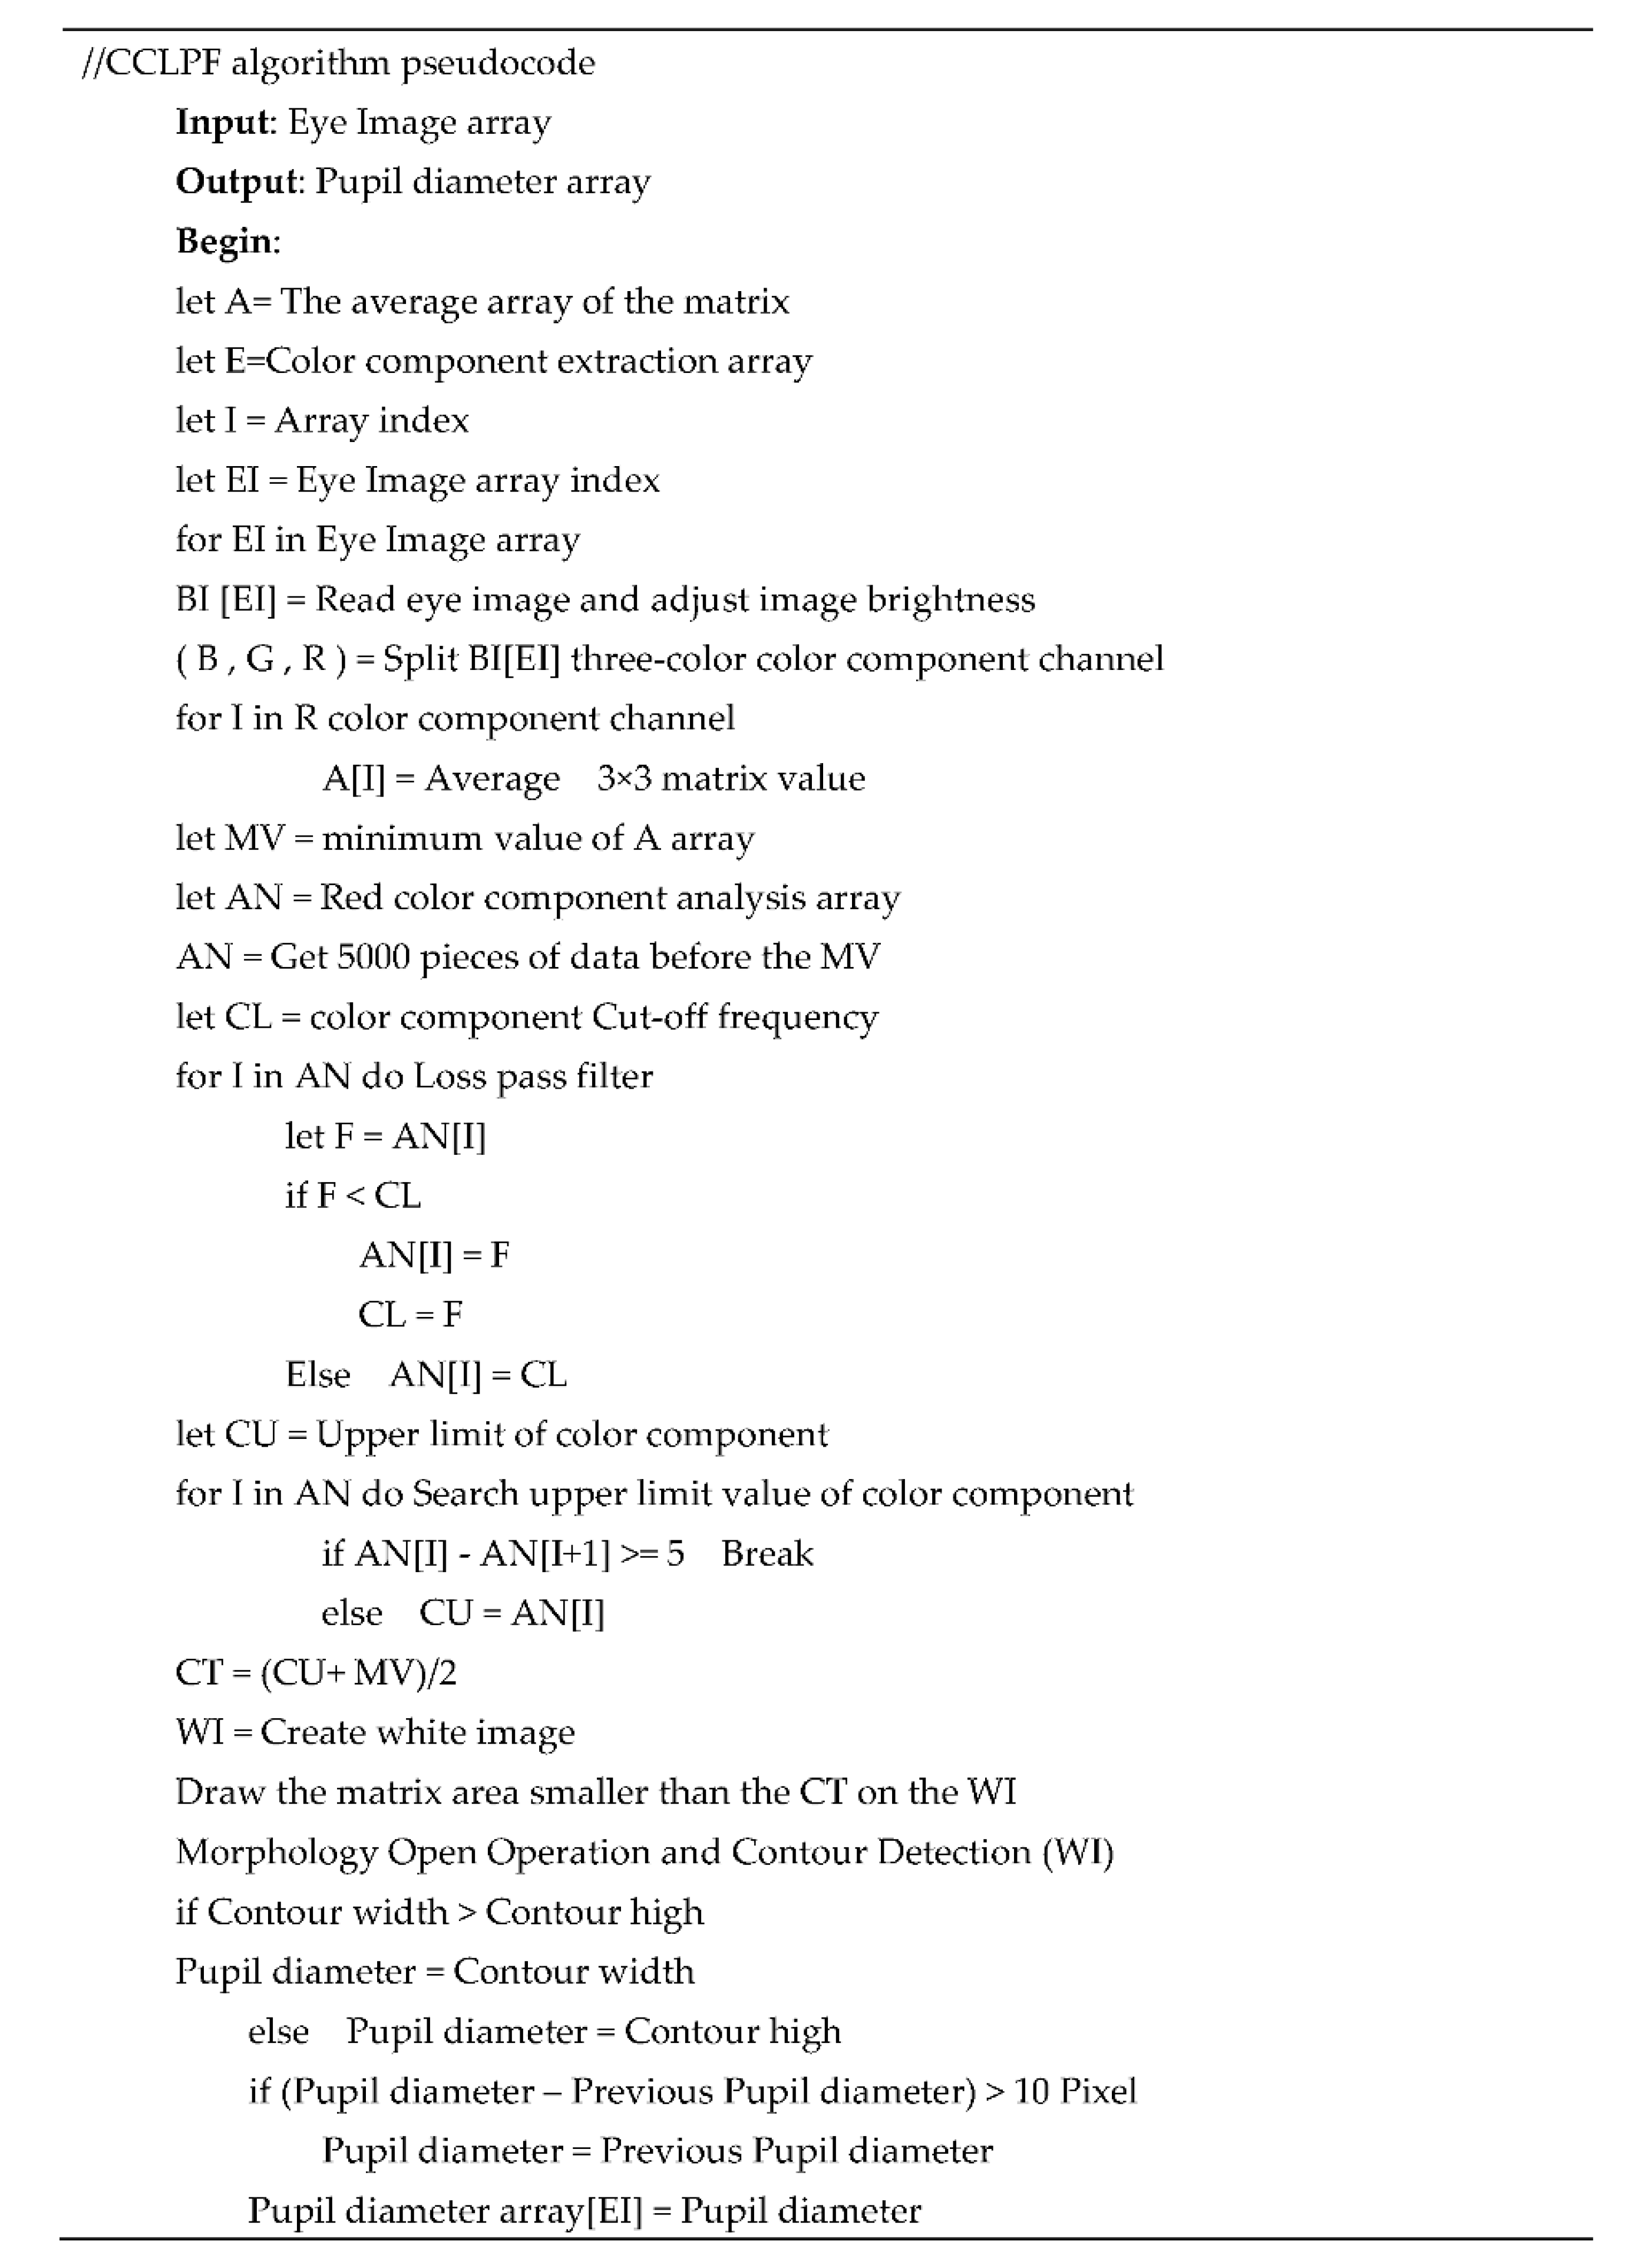
3.1.5. CCLPF Algorithm
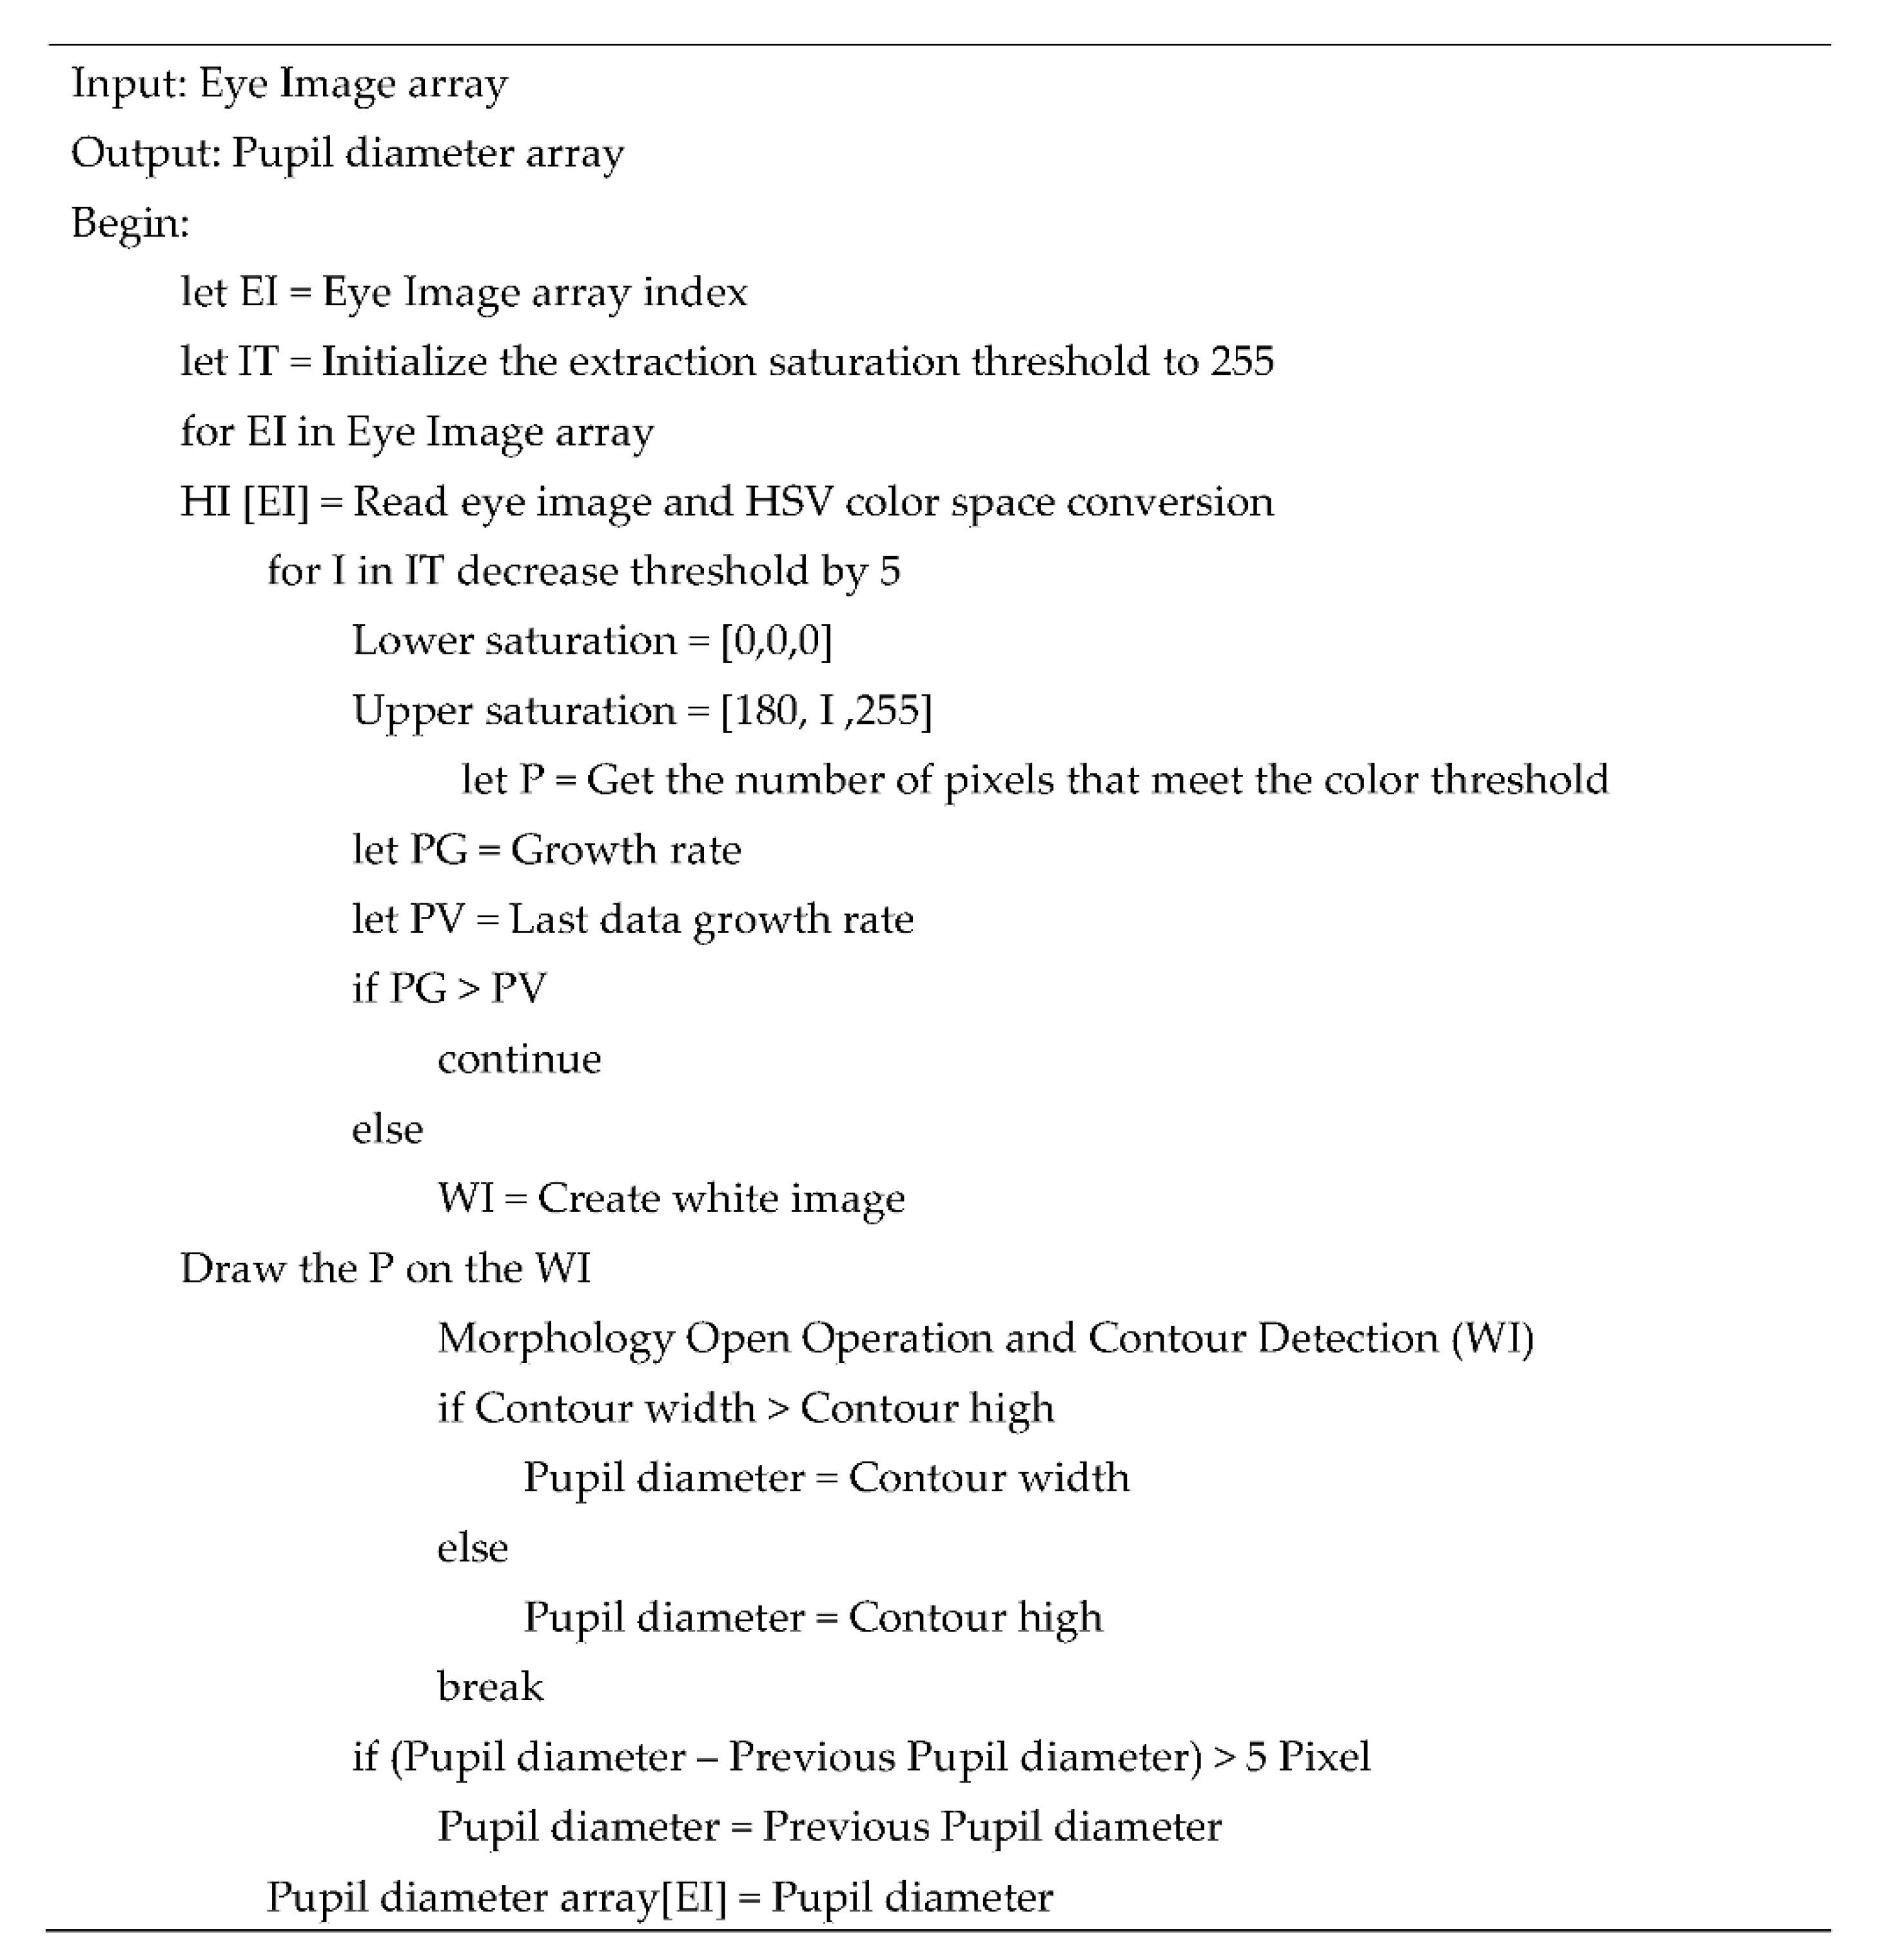
3.2. PRSSM Algorithm
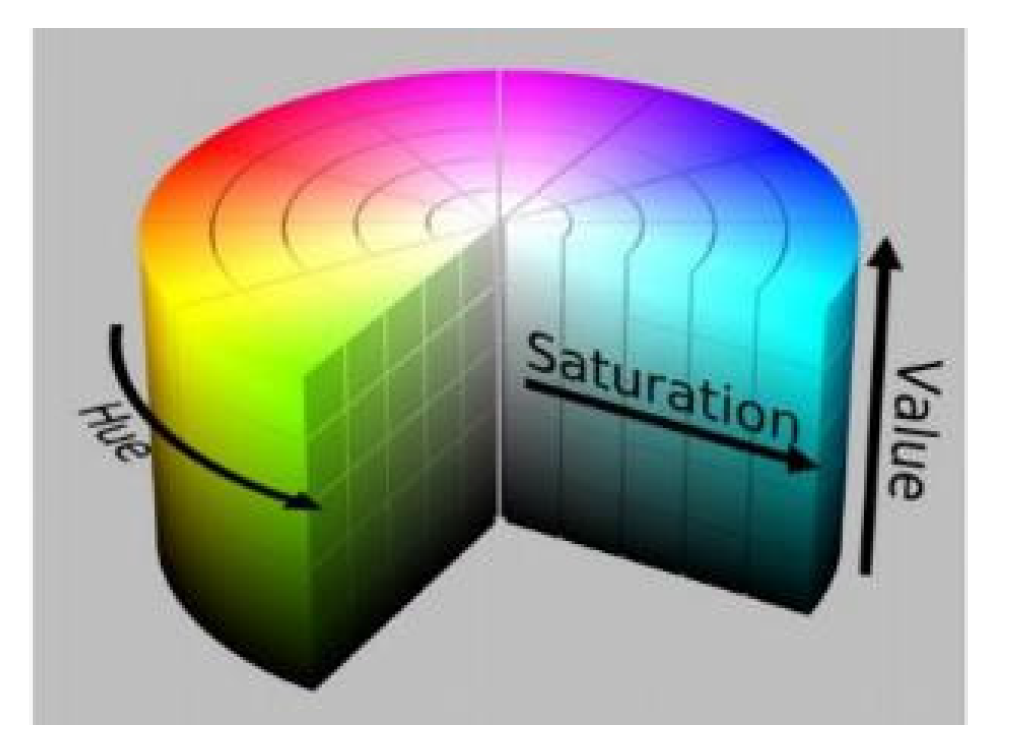
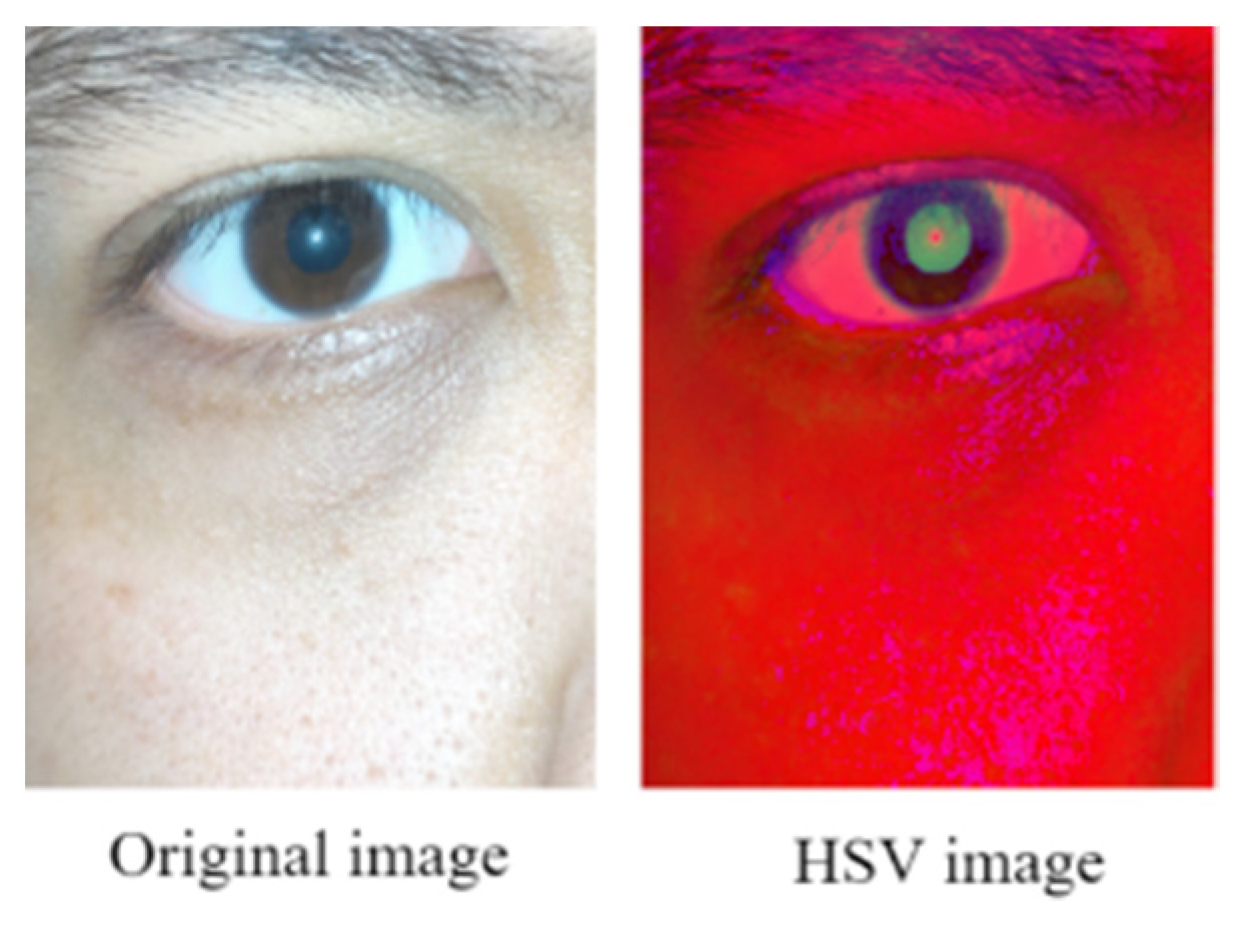
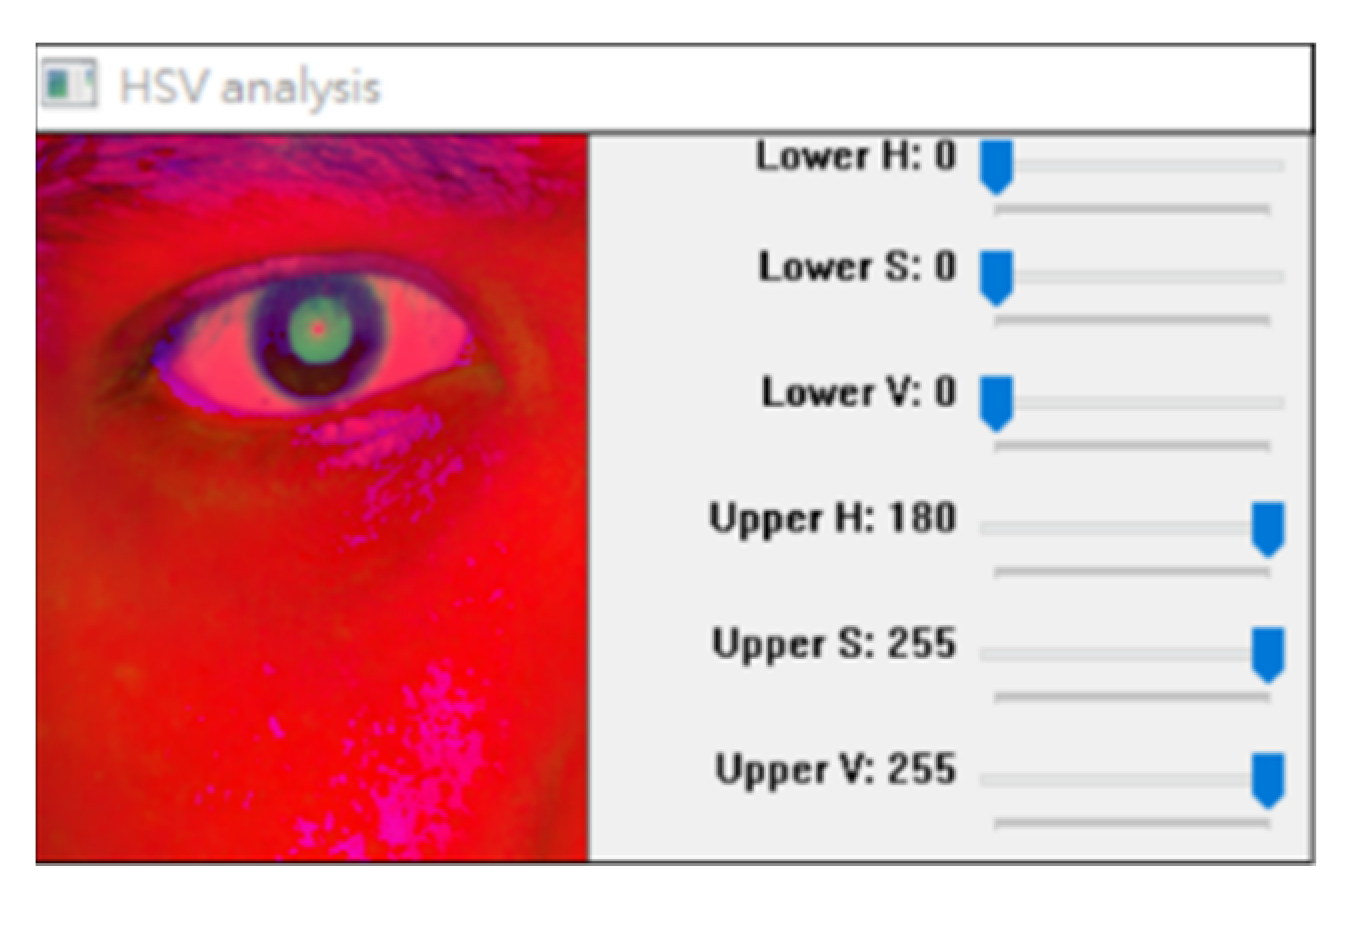
3.2.1. HSV Color Space Conversion
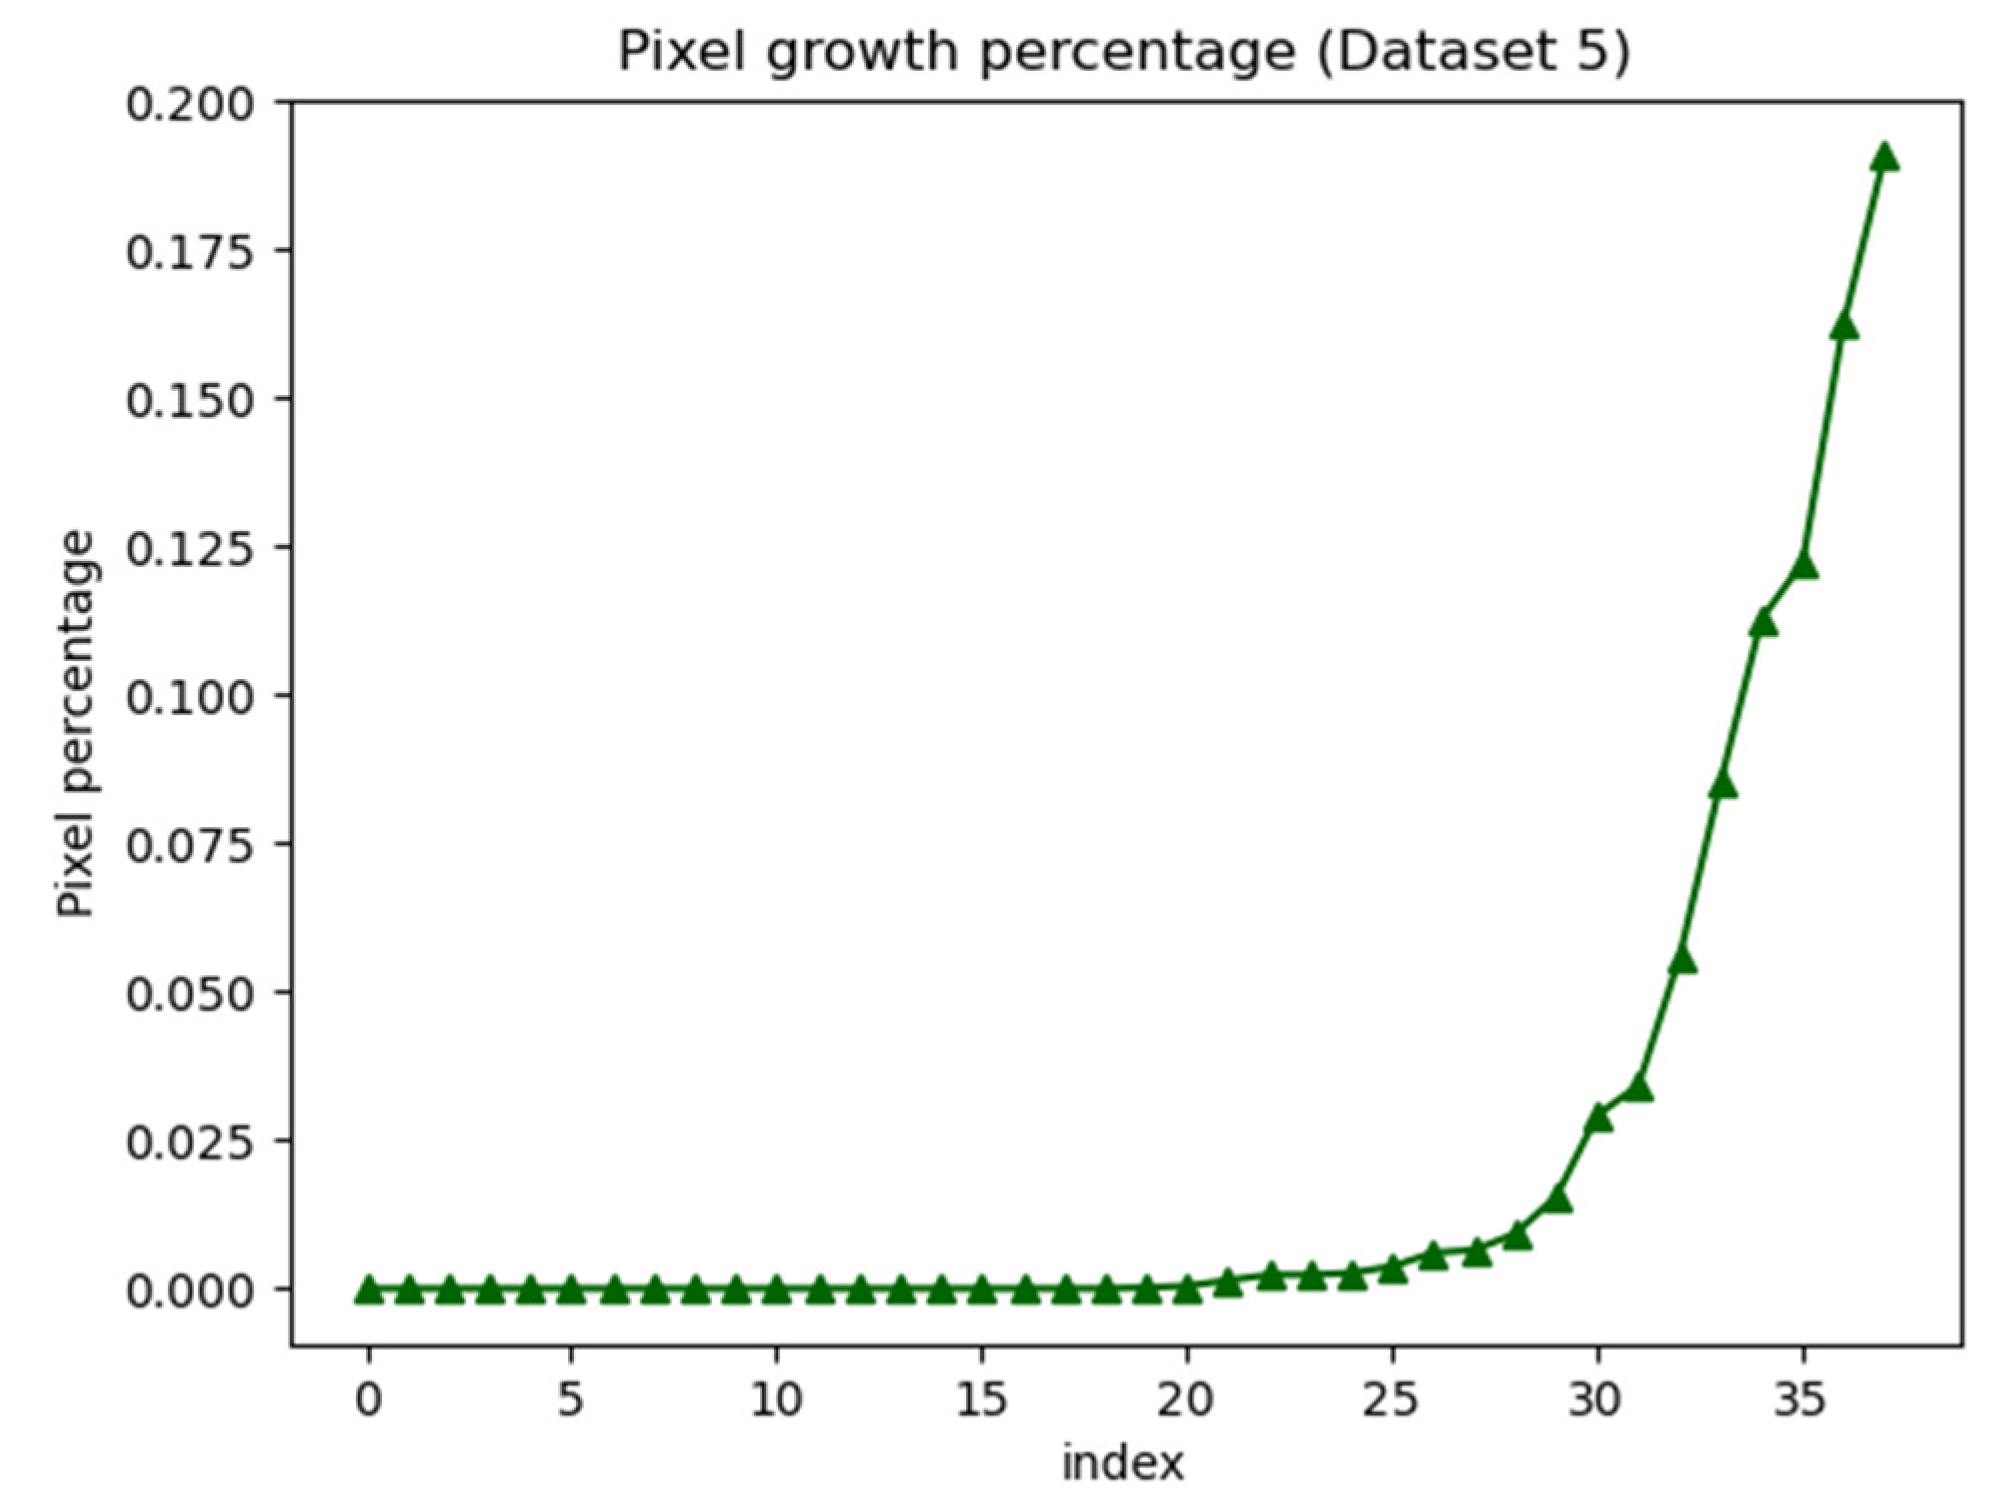
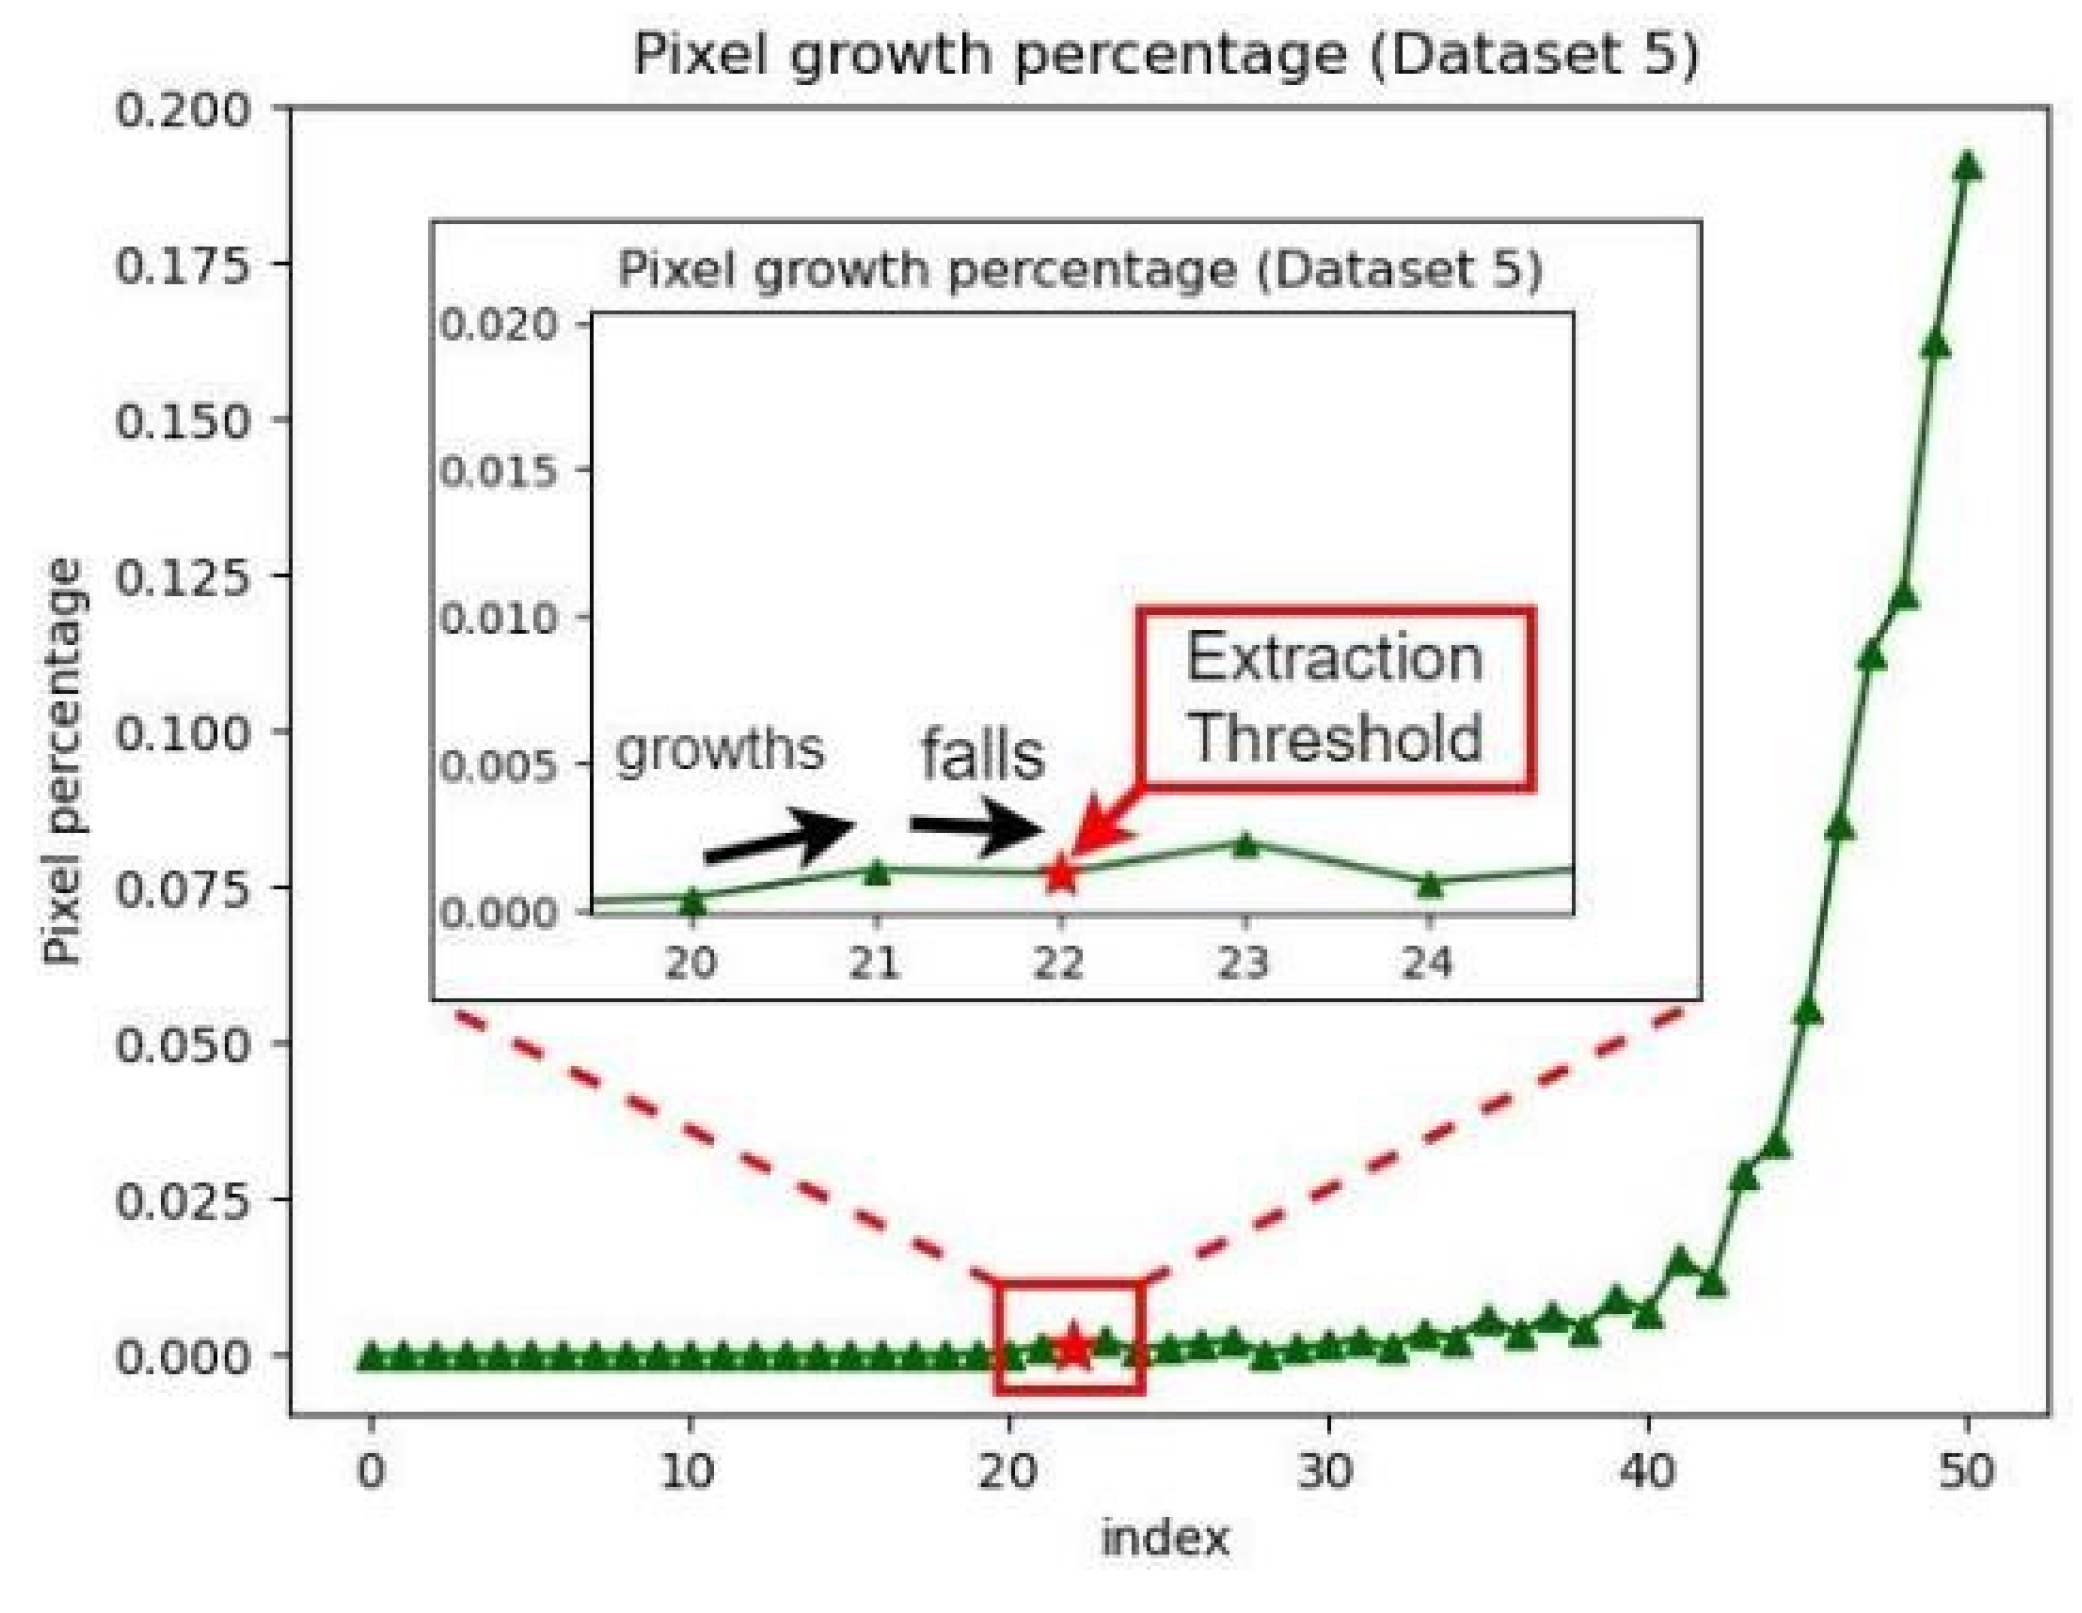
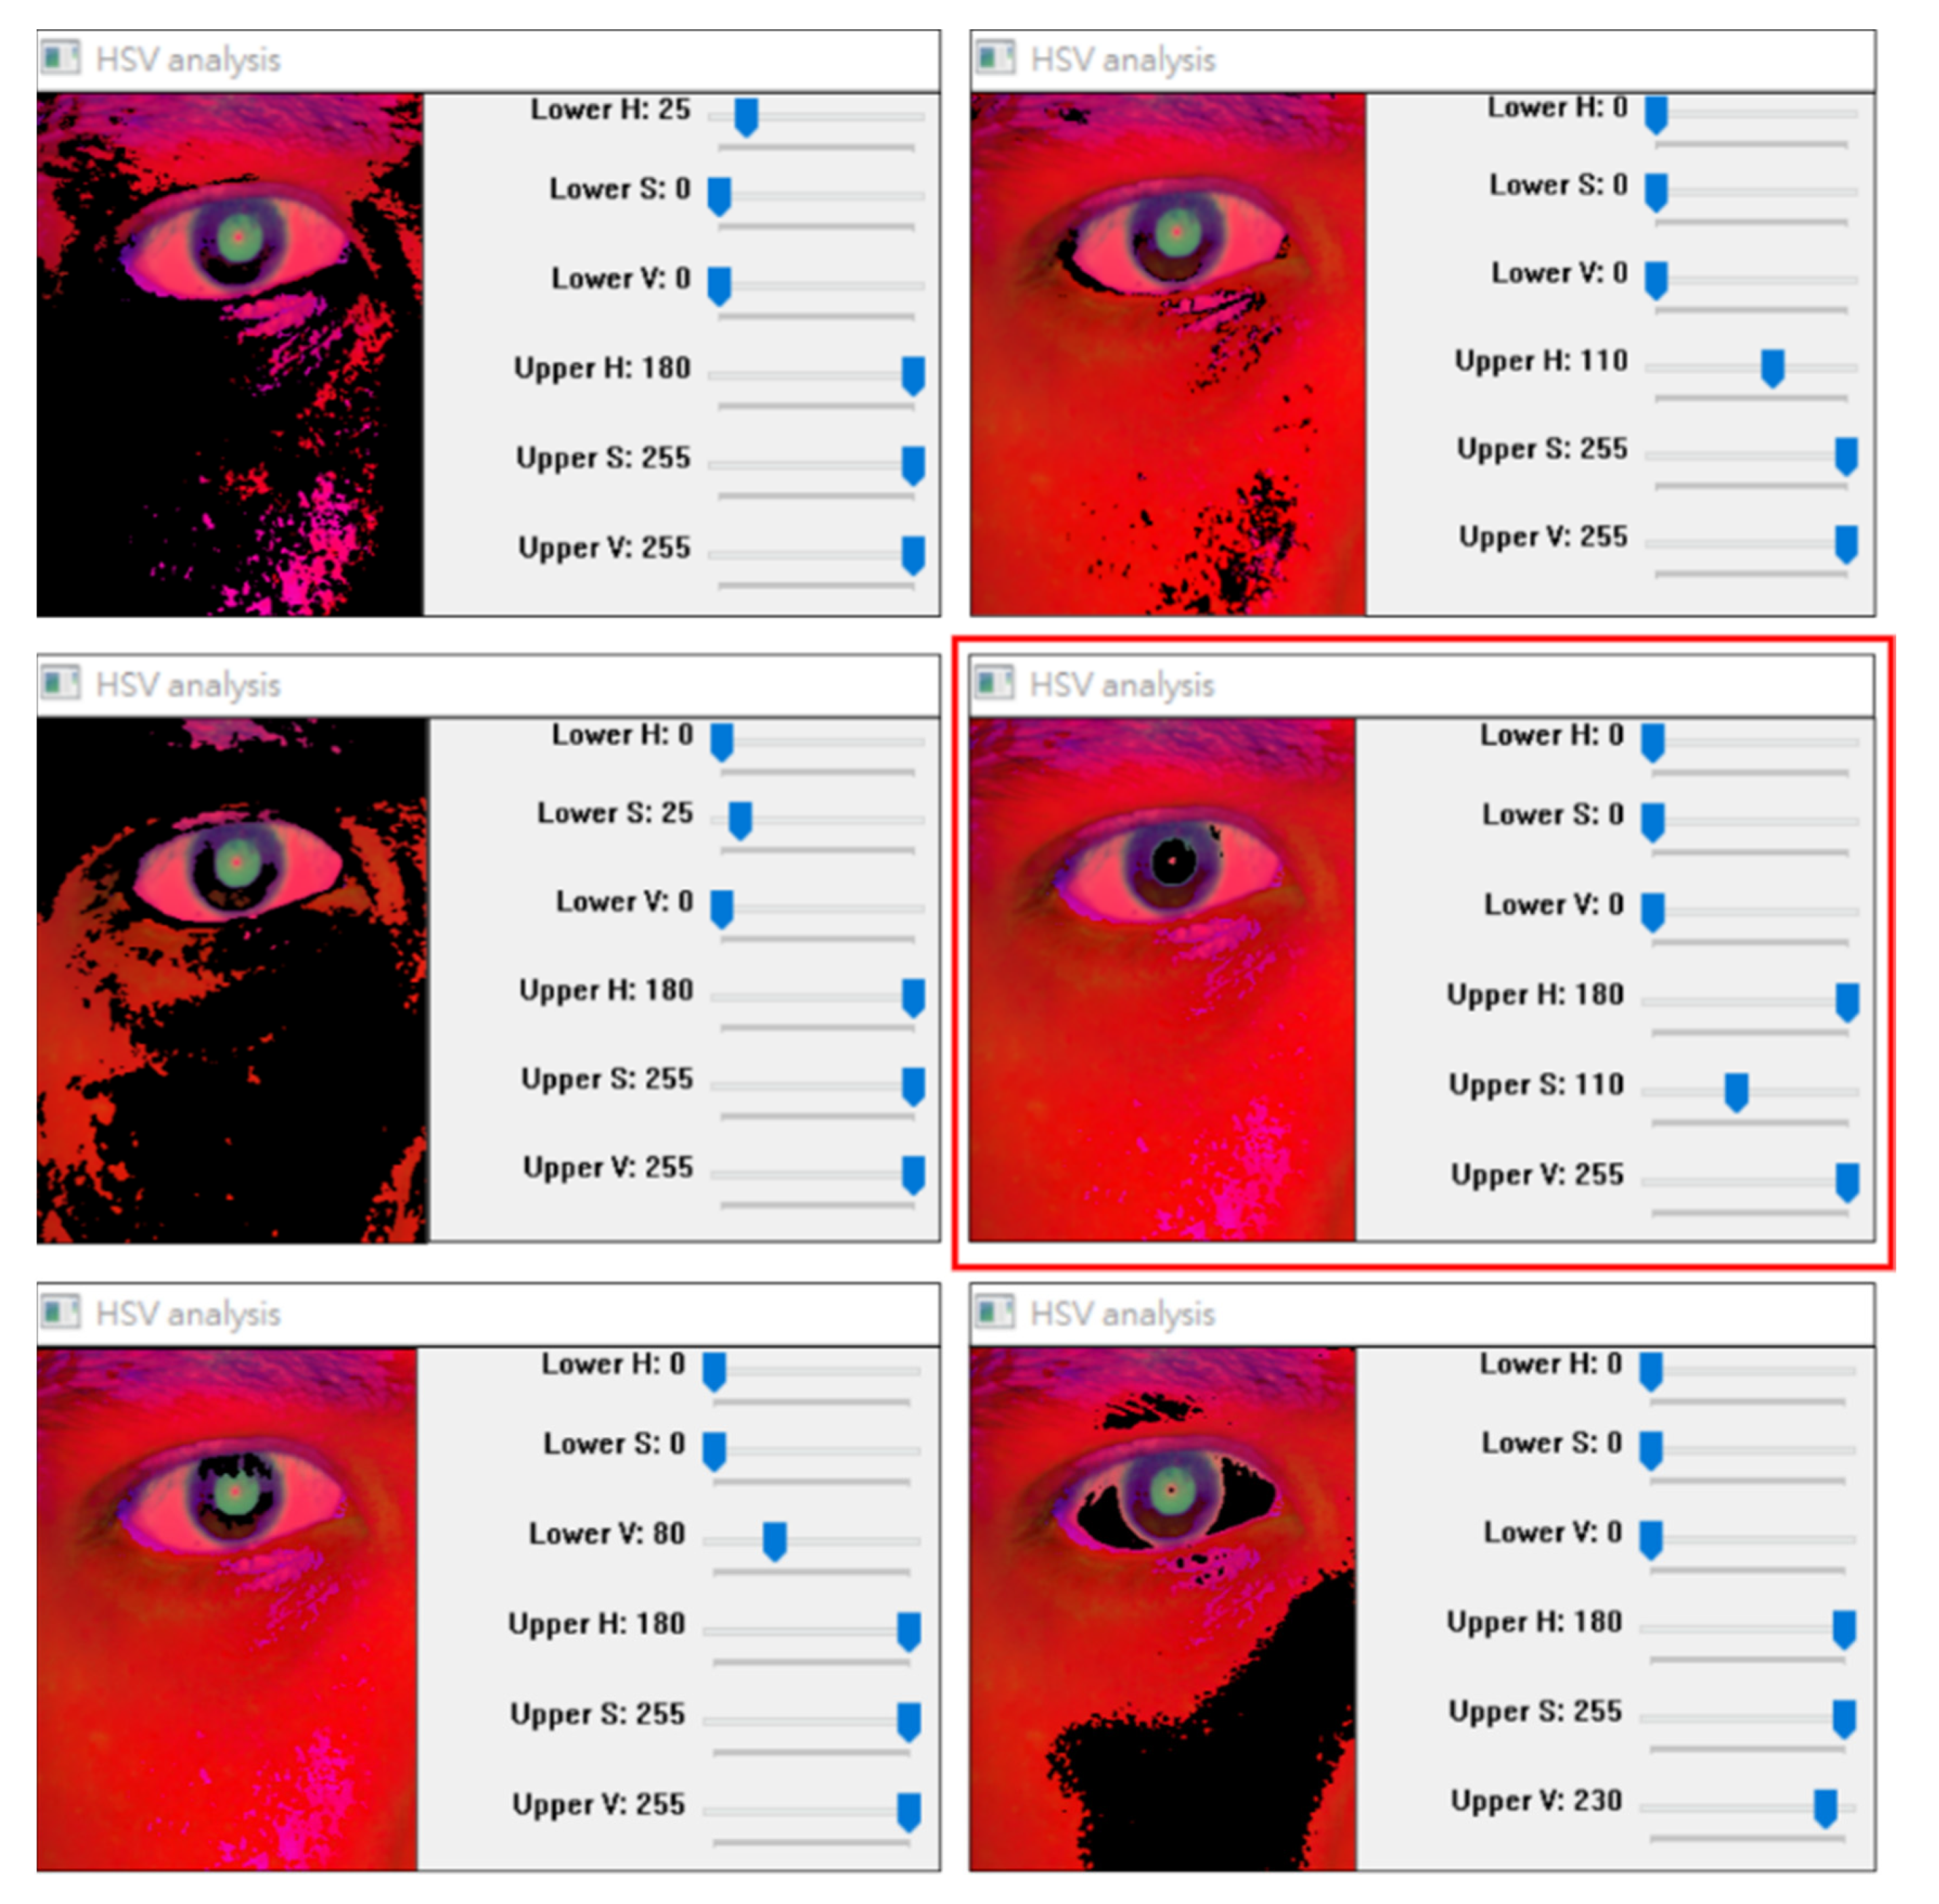
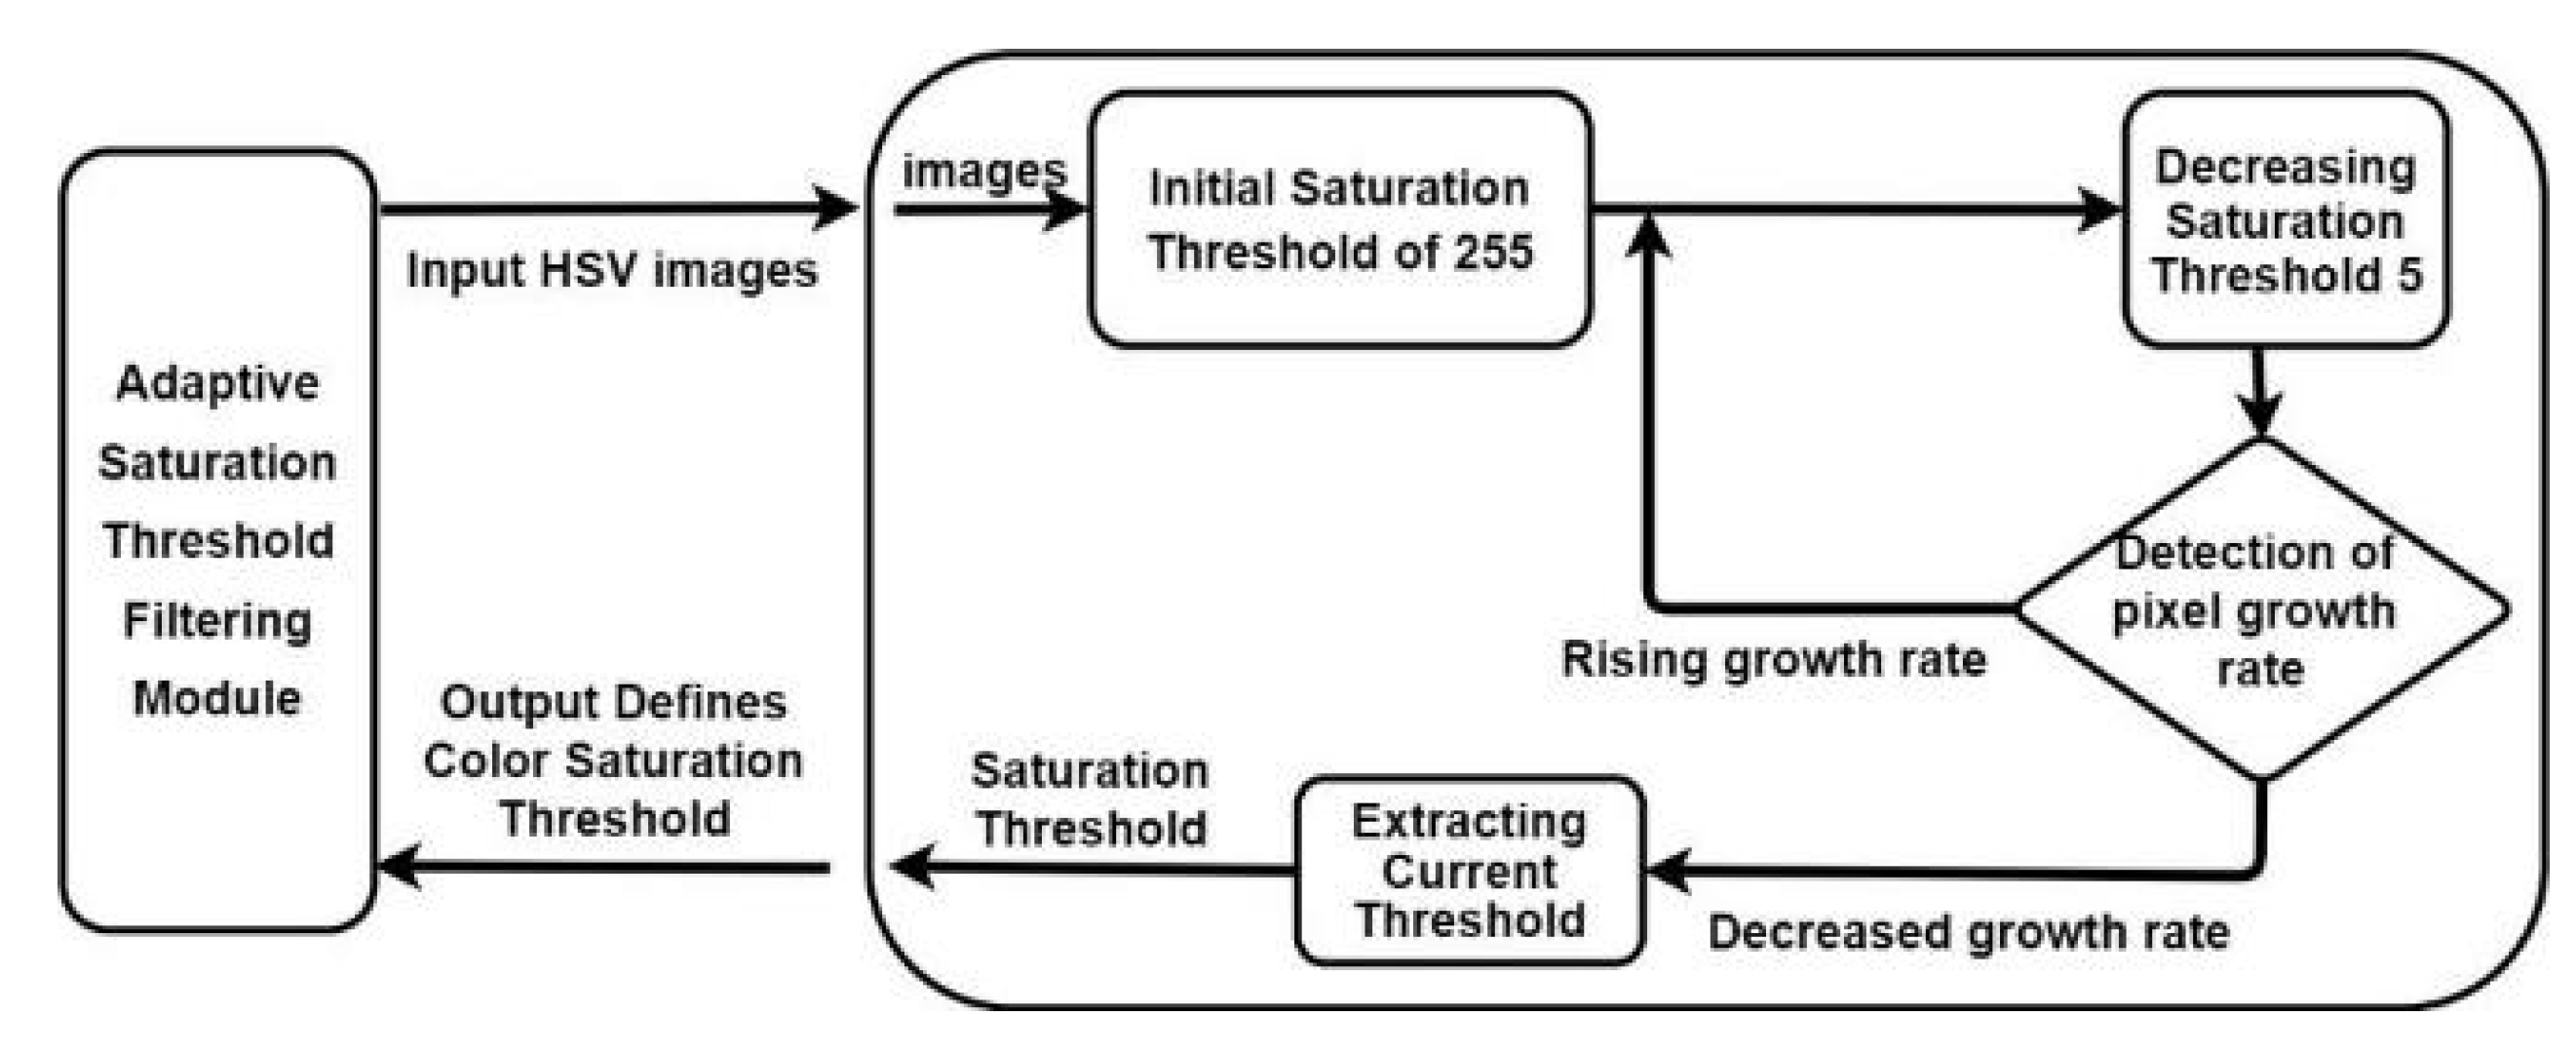
3.2.2. Adaptive Saturation Threshold Filtering
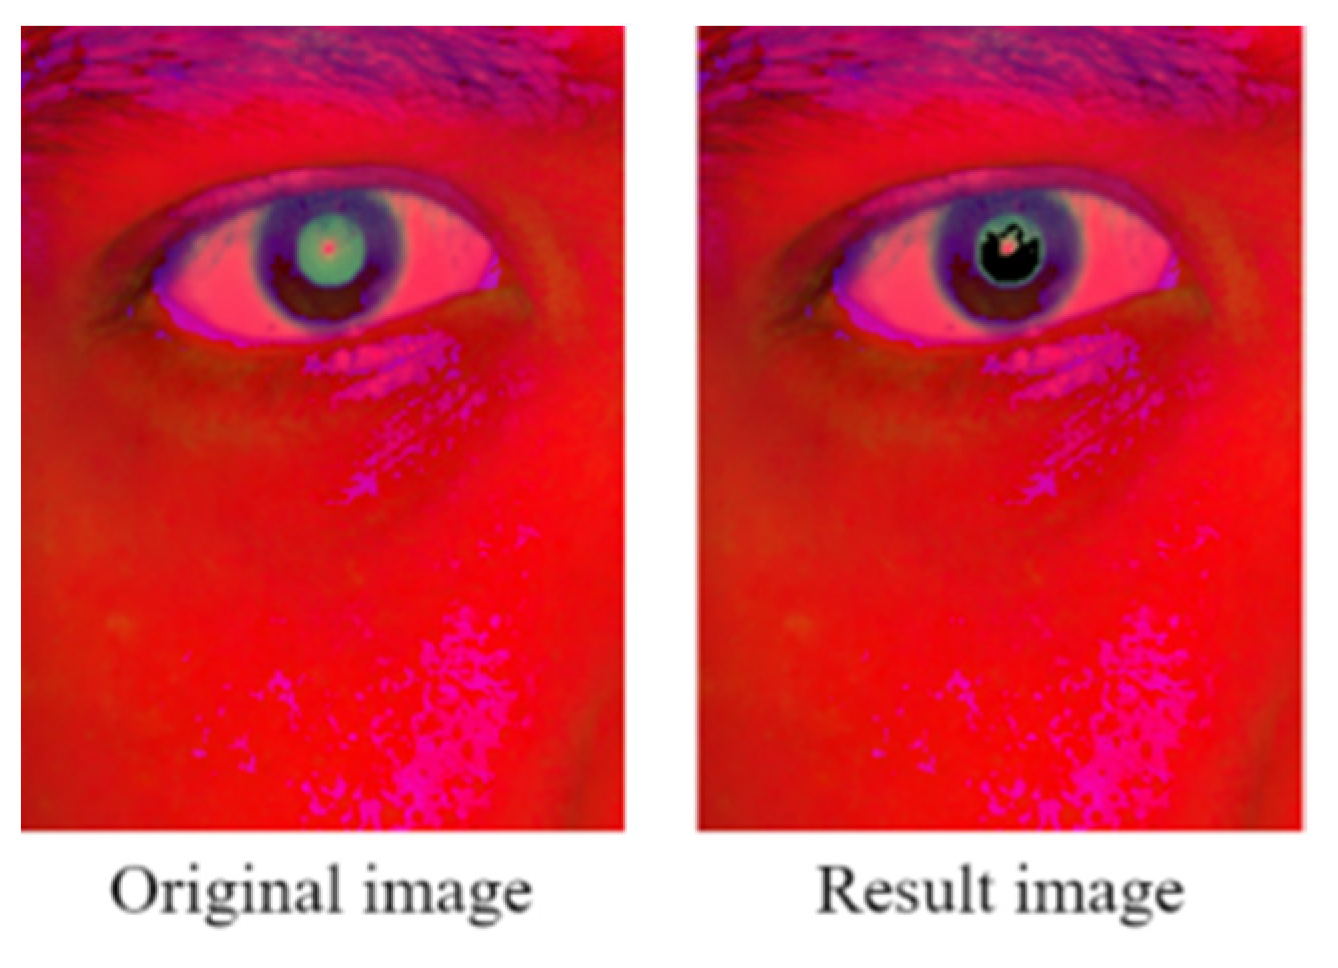
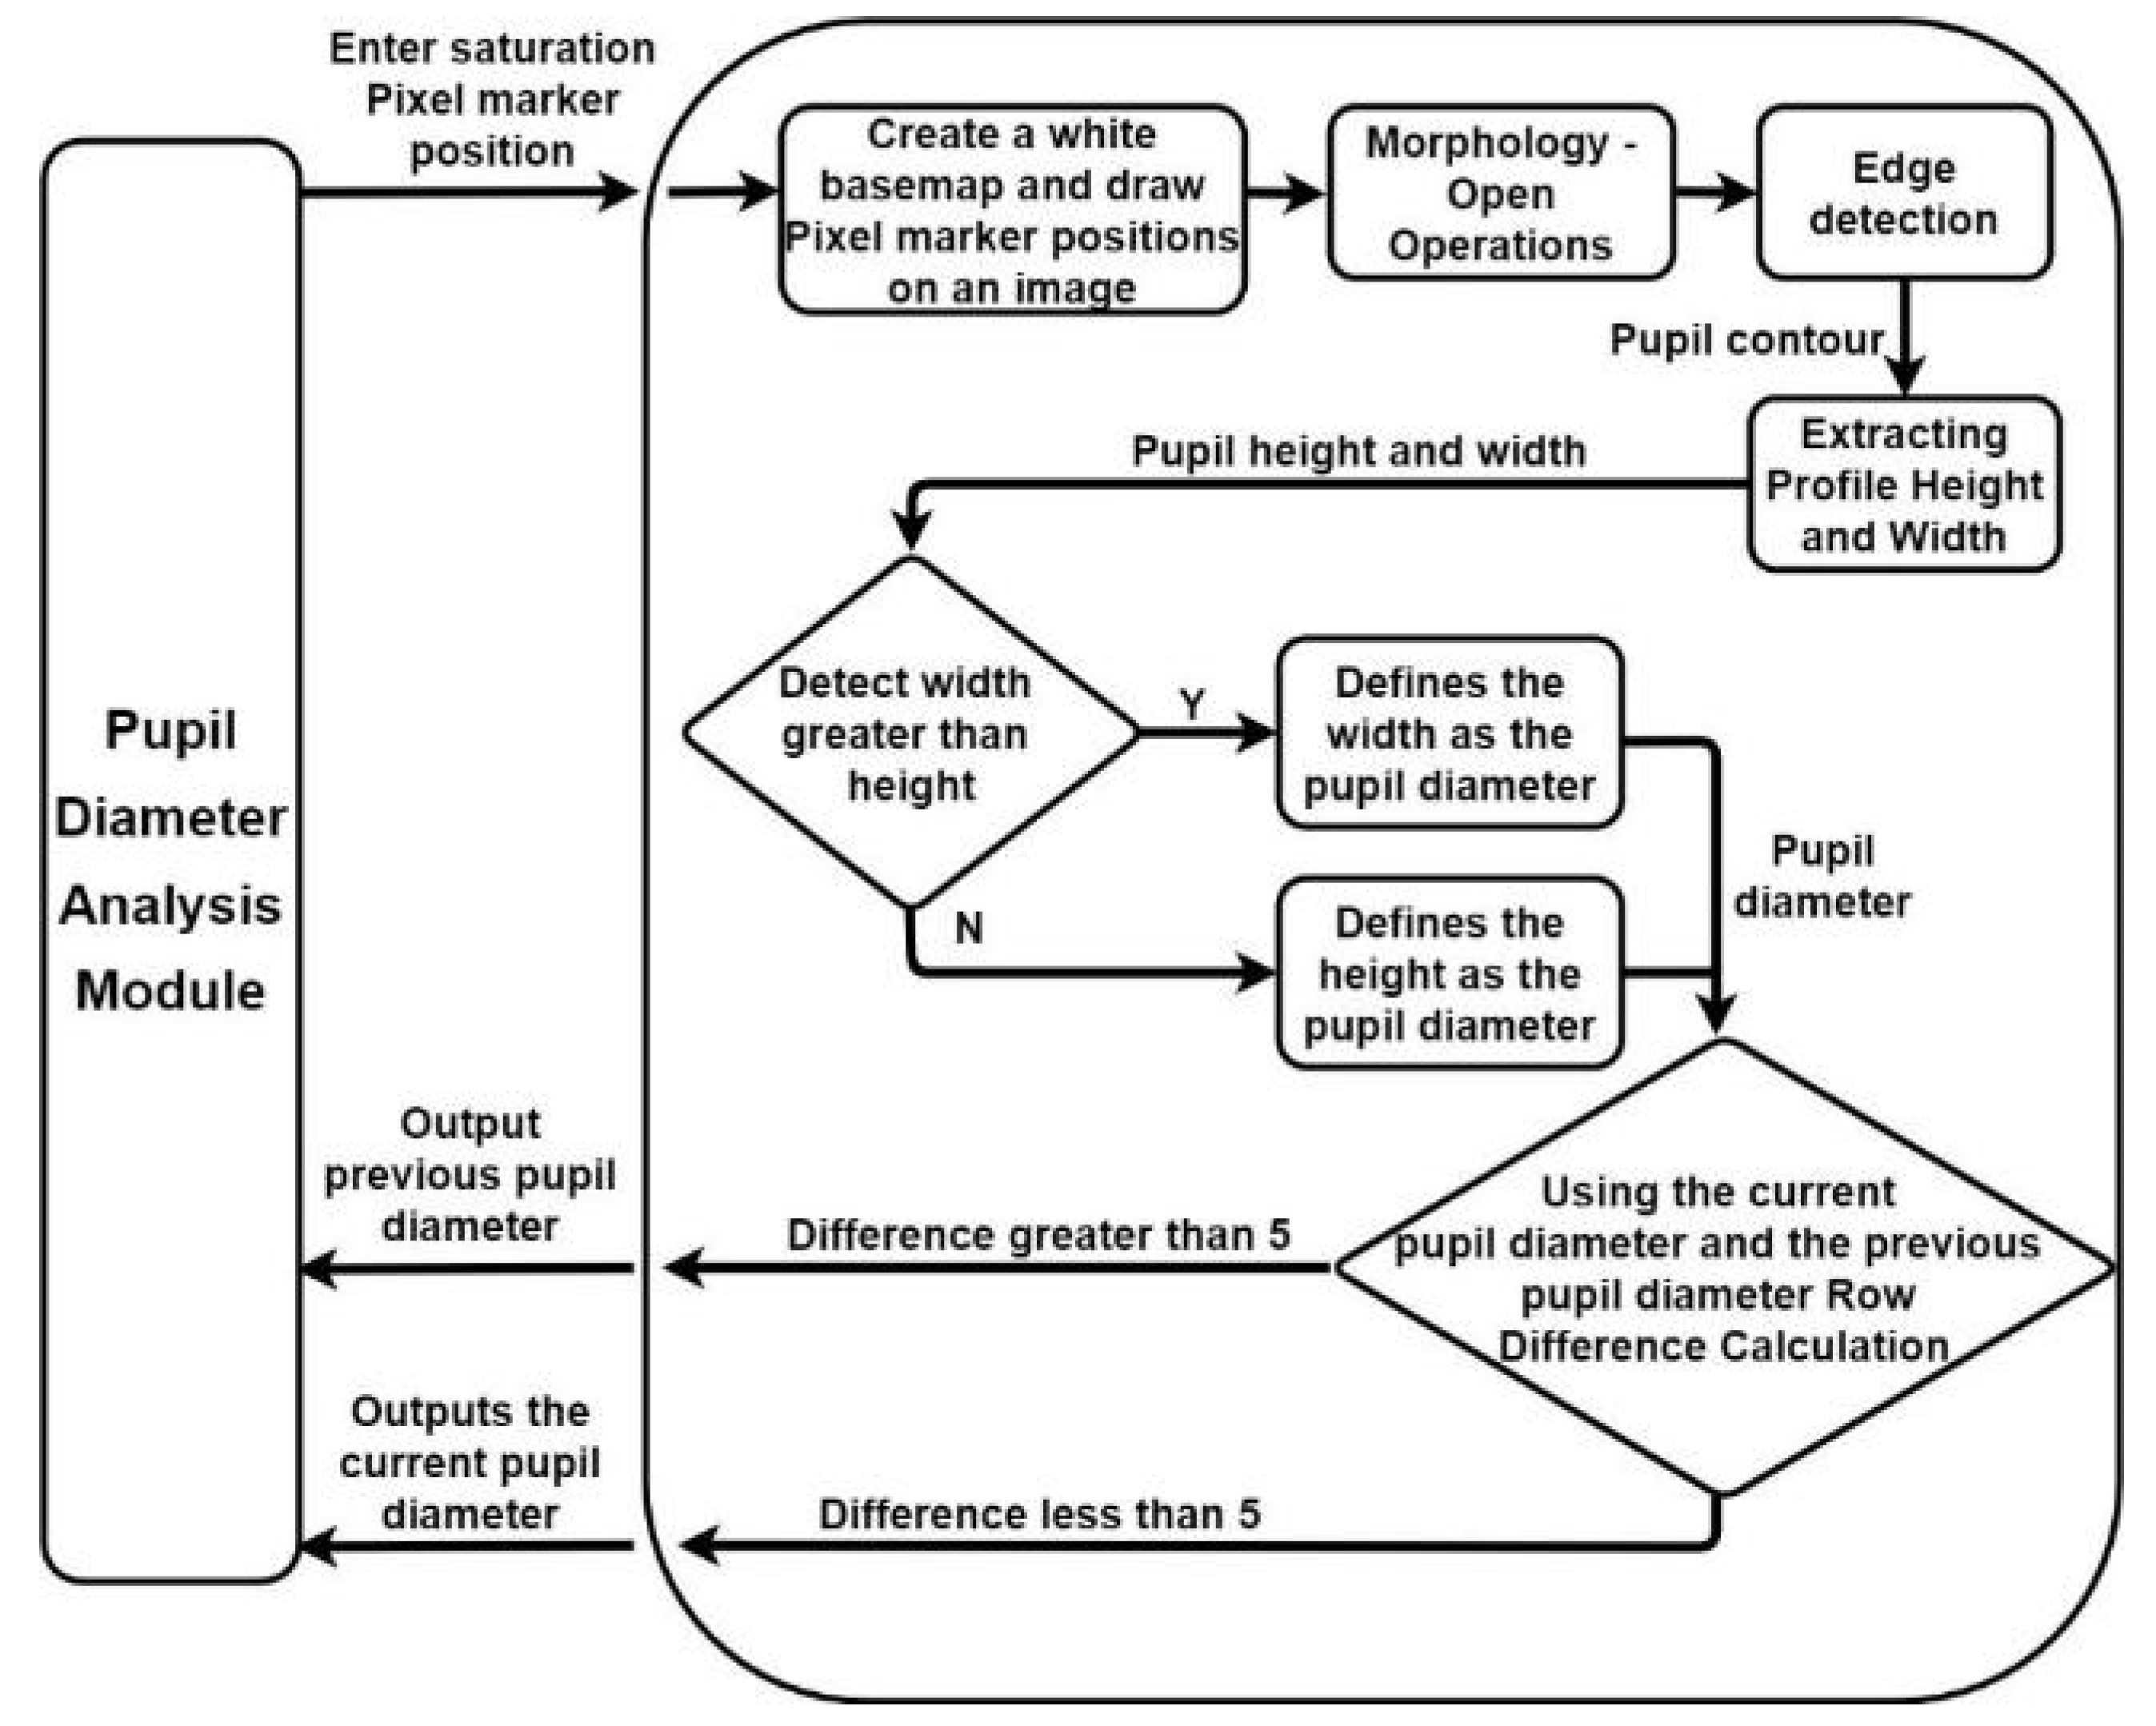
3.2.3. Pupil Diameter Analysis
3.2.4. PRSSM Algorithm
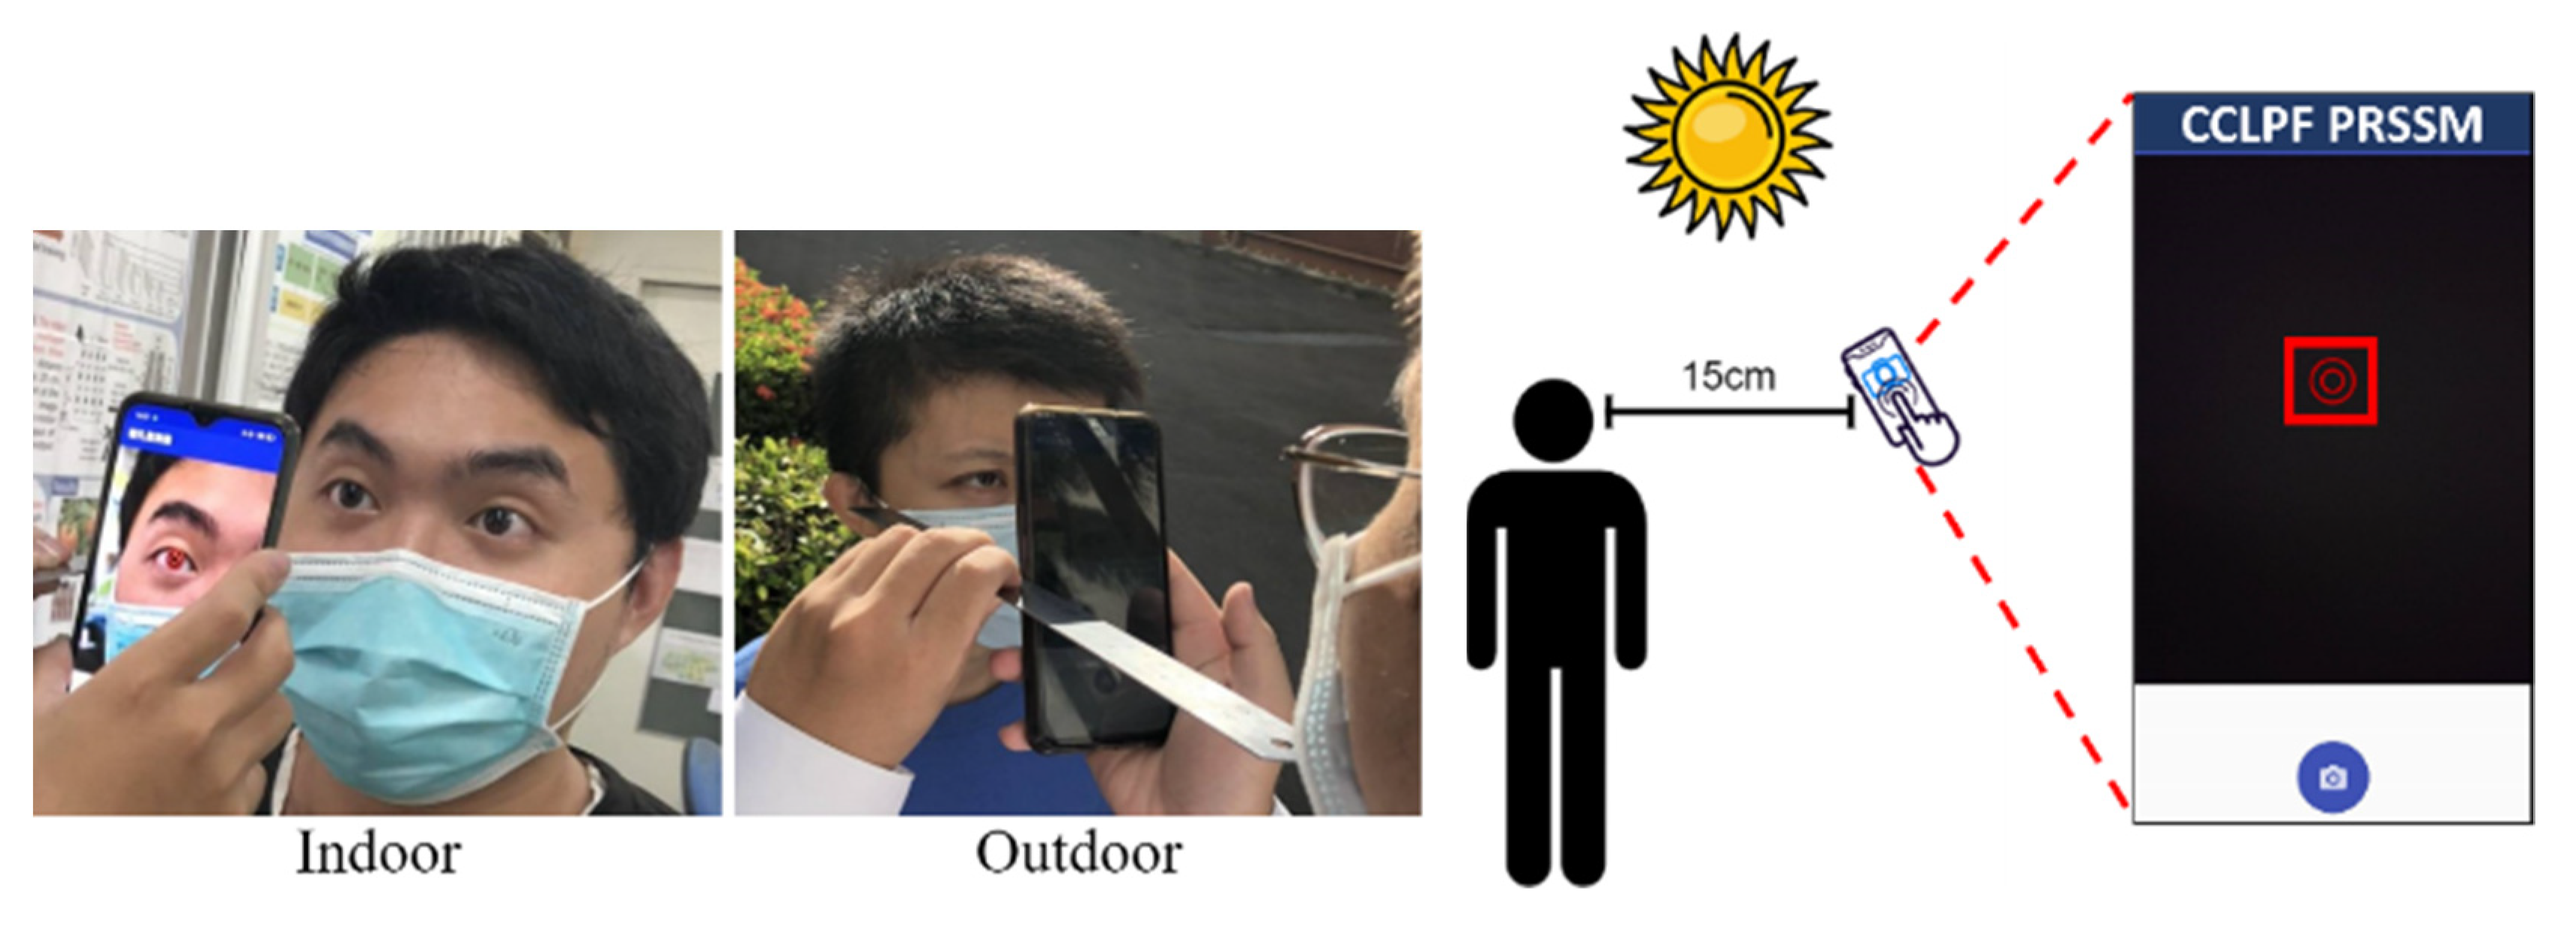
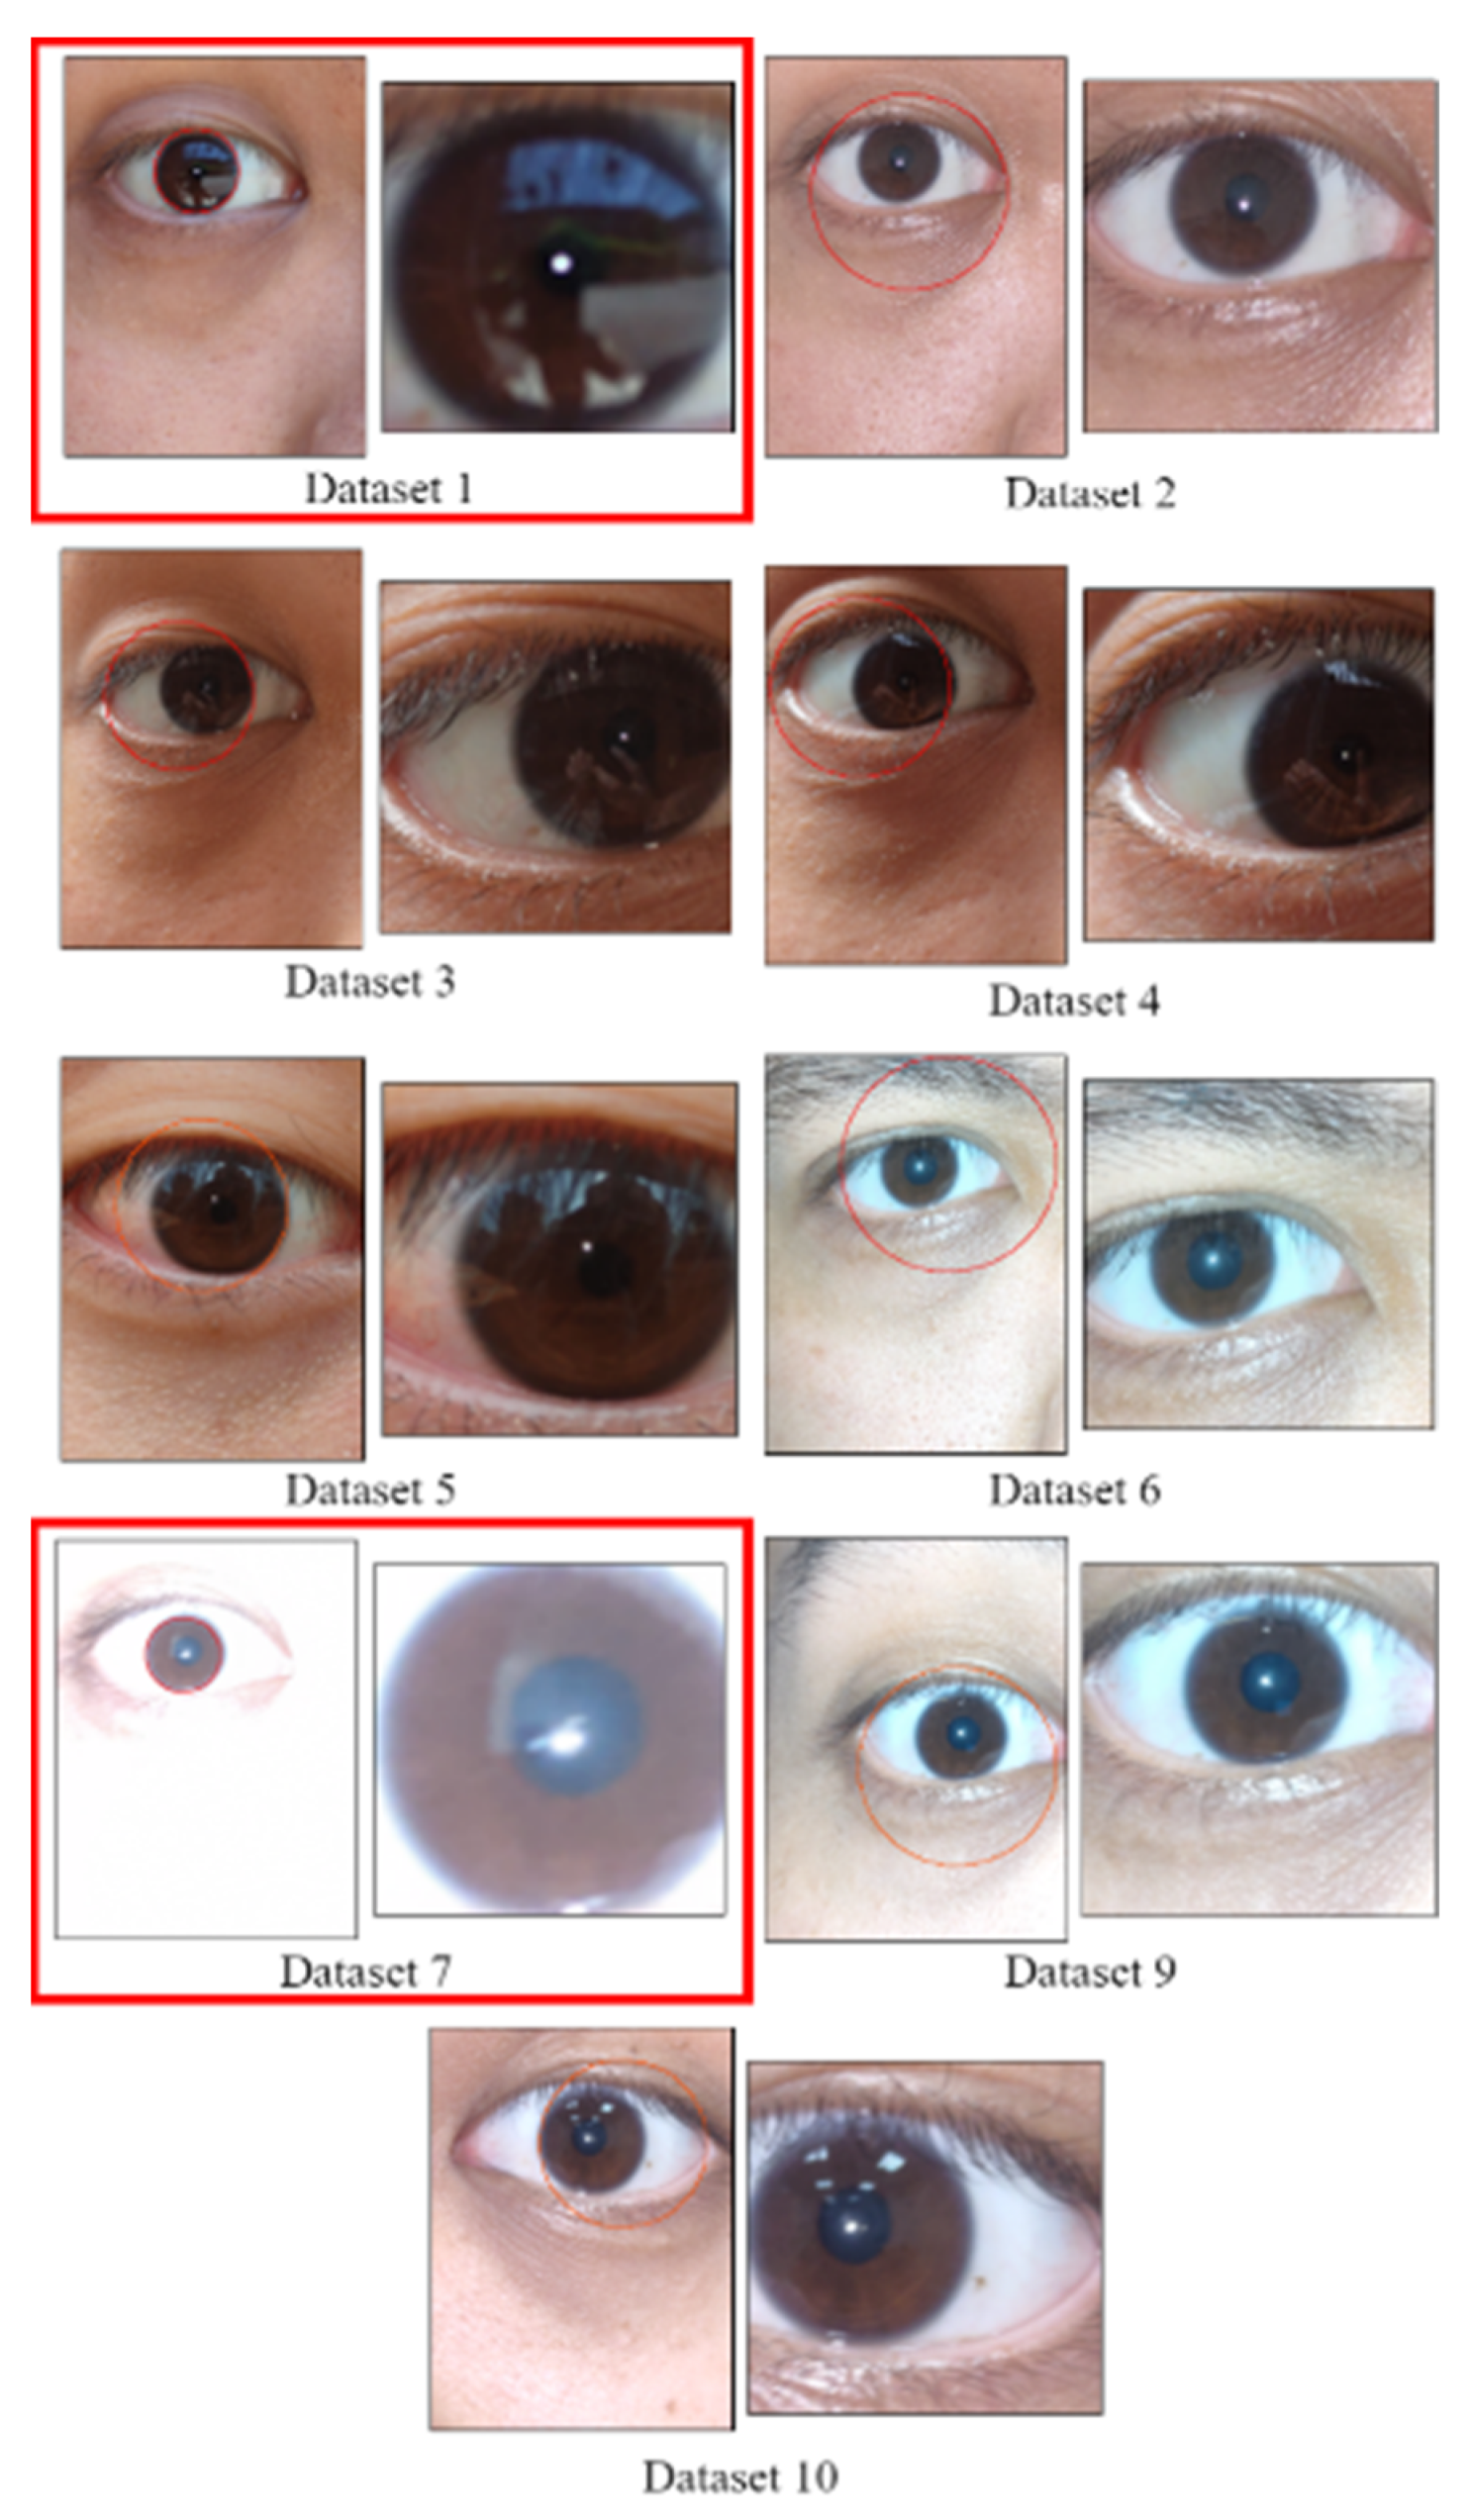
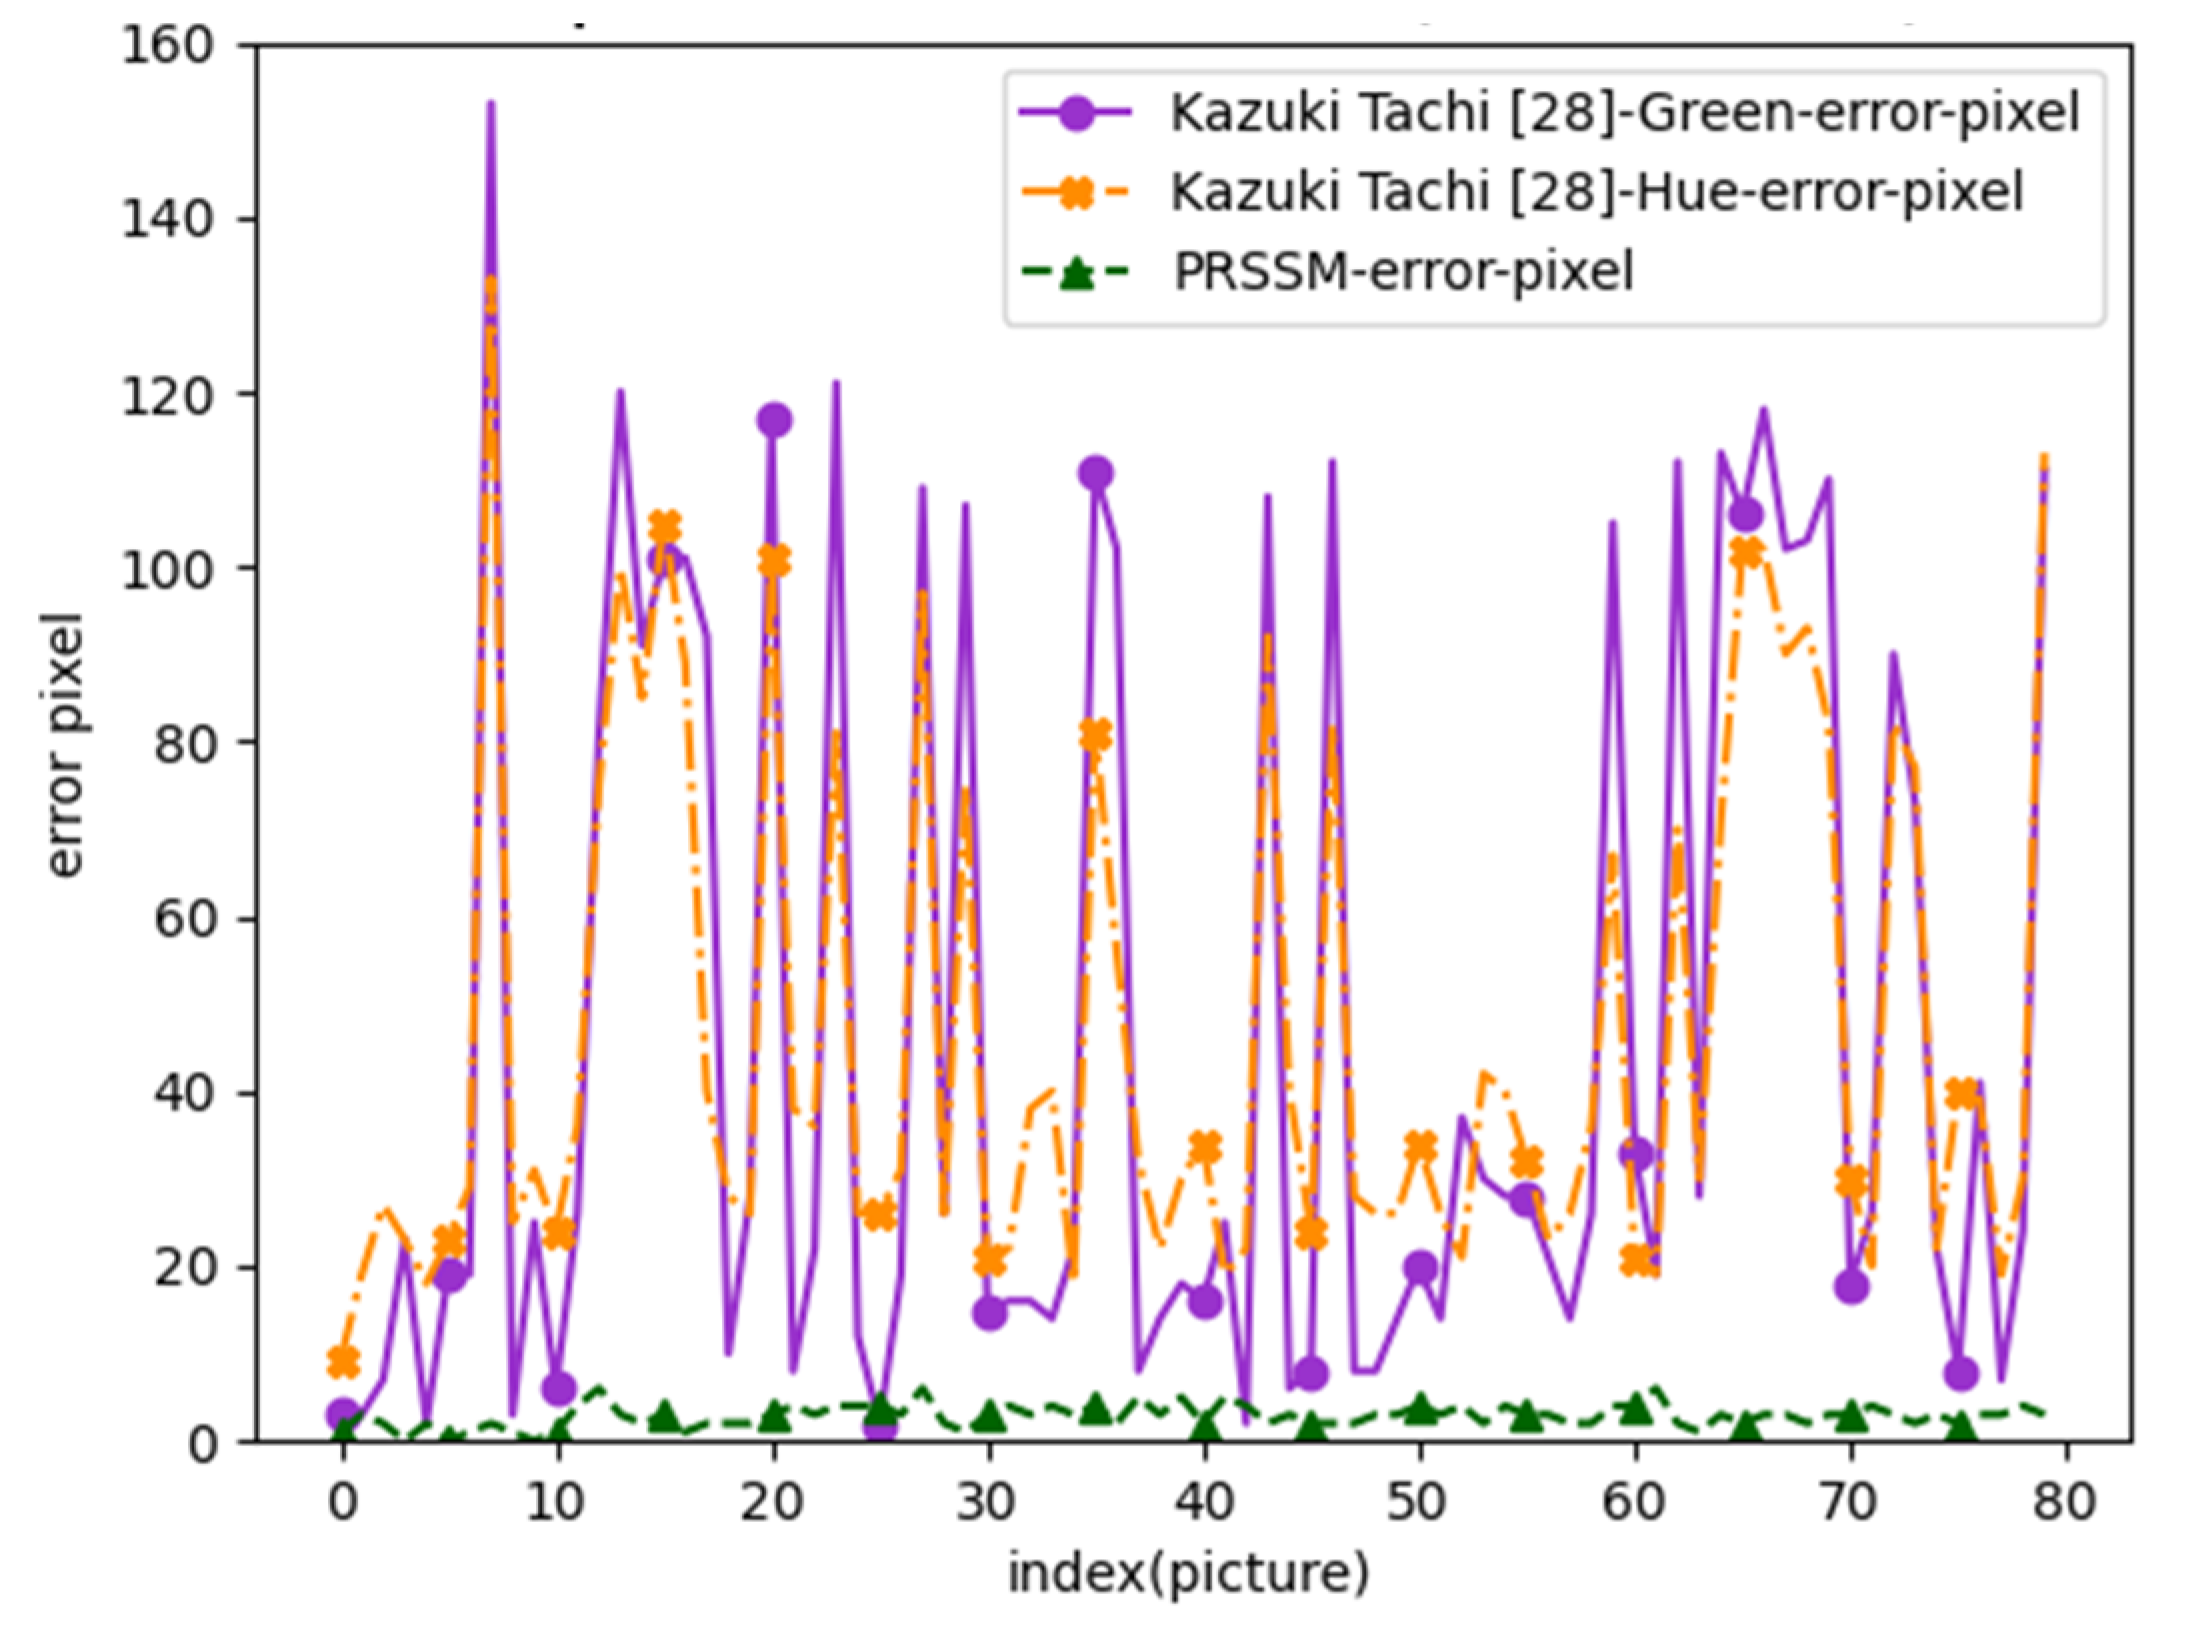
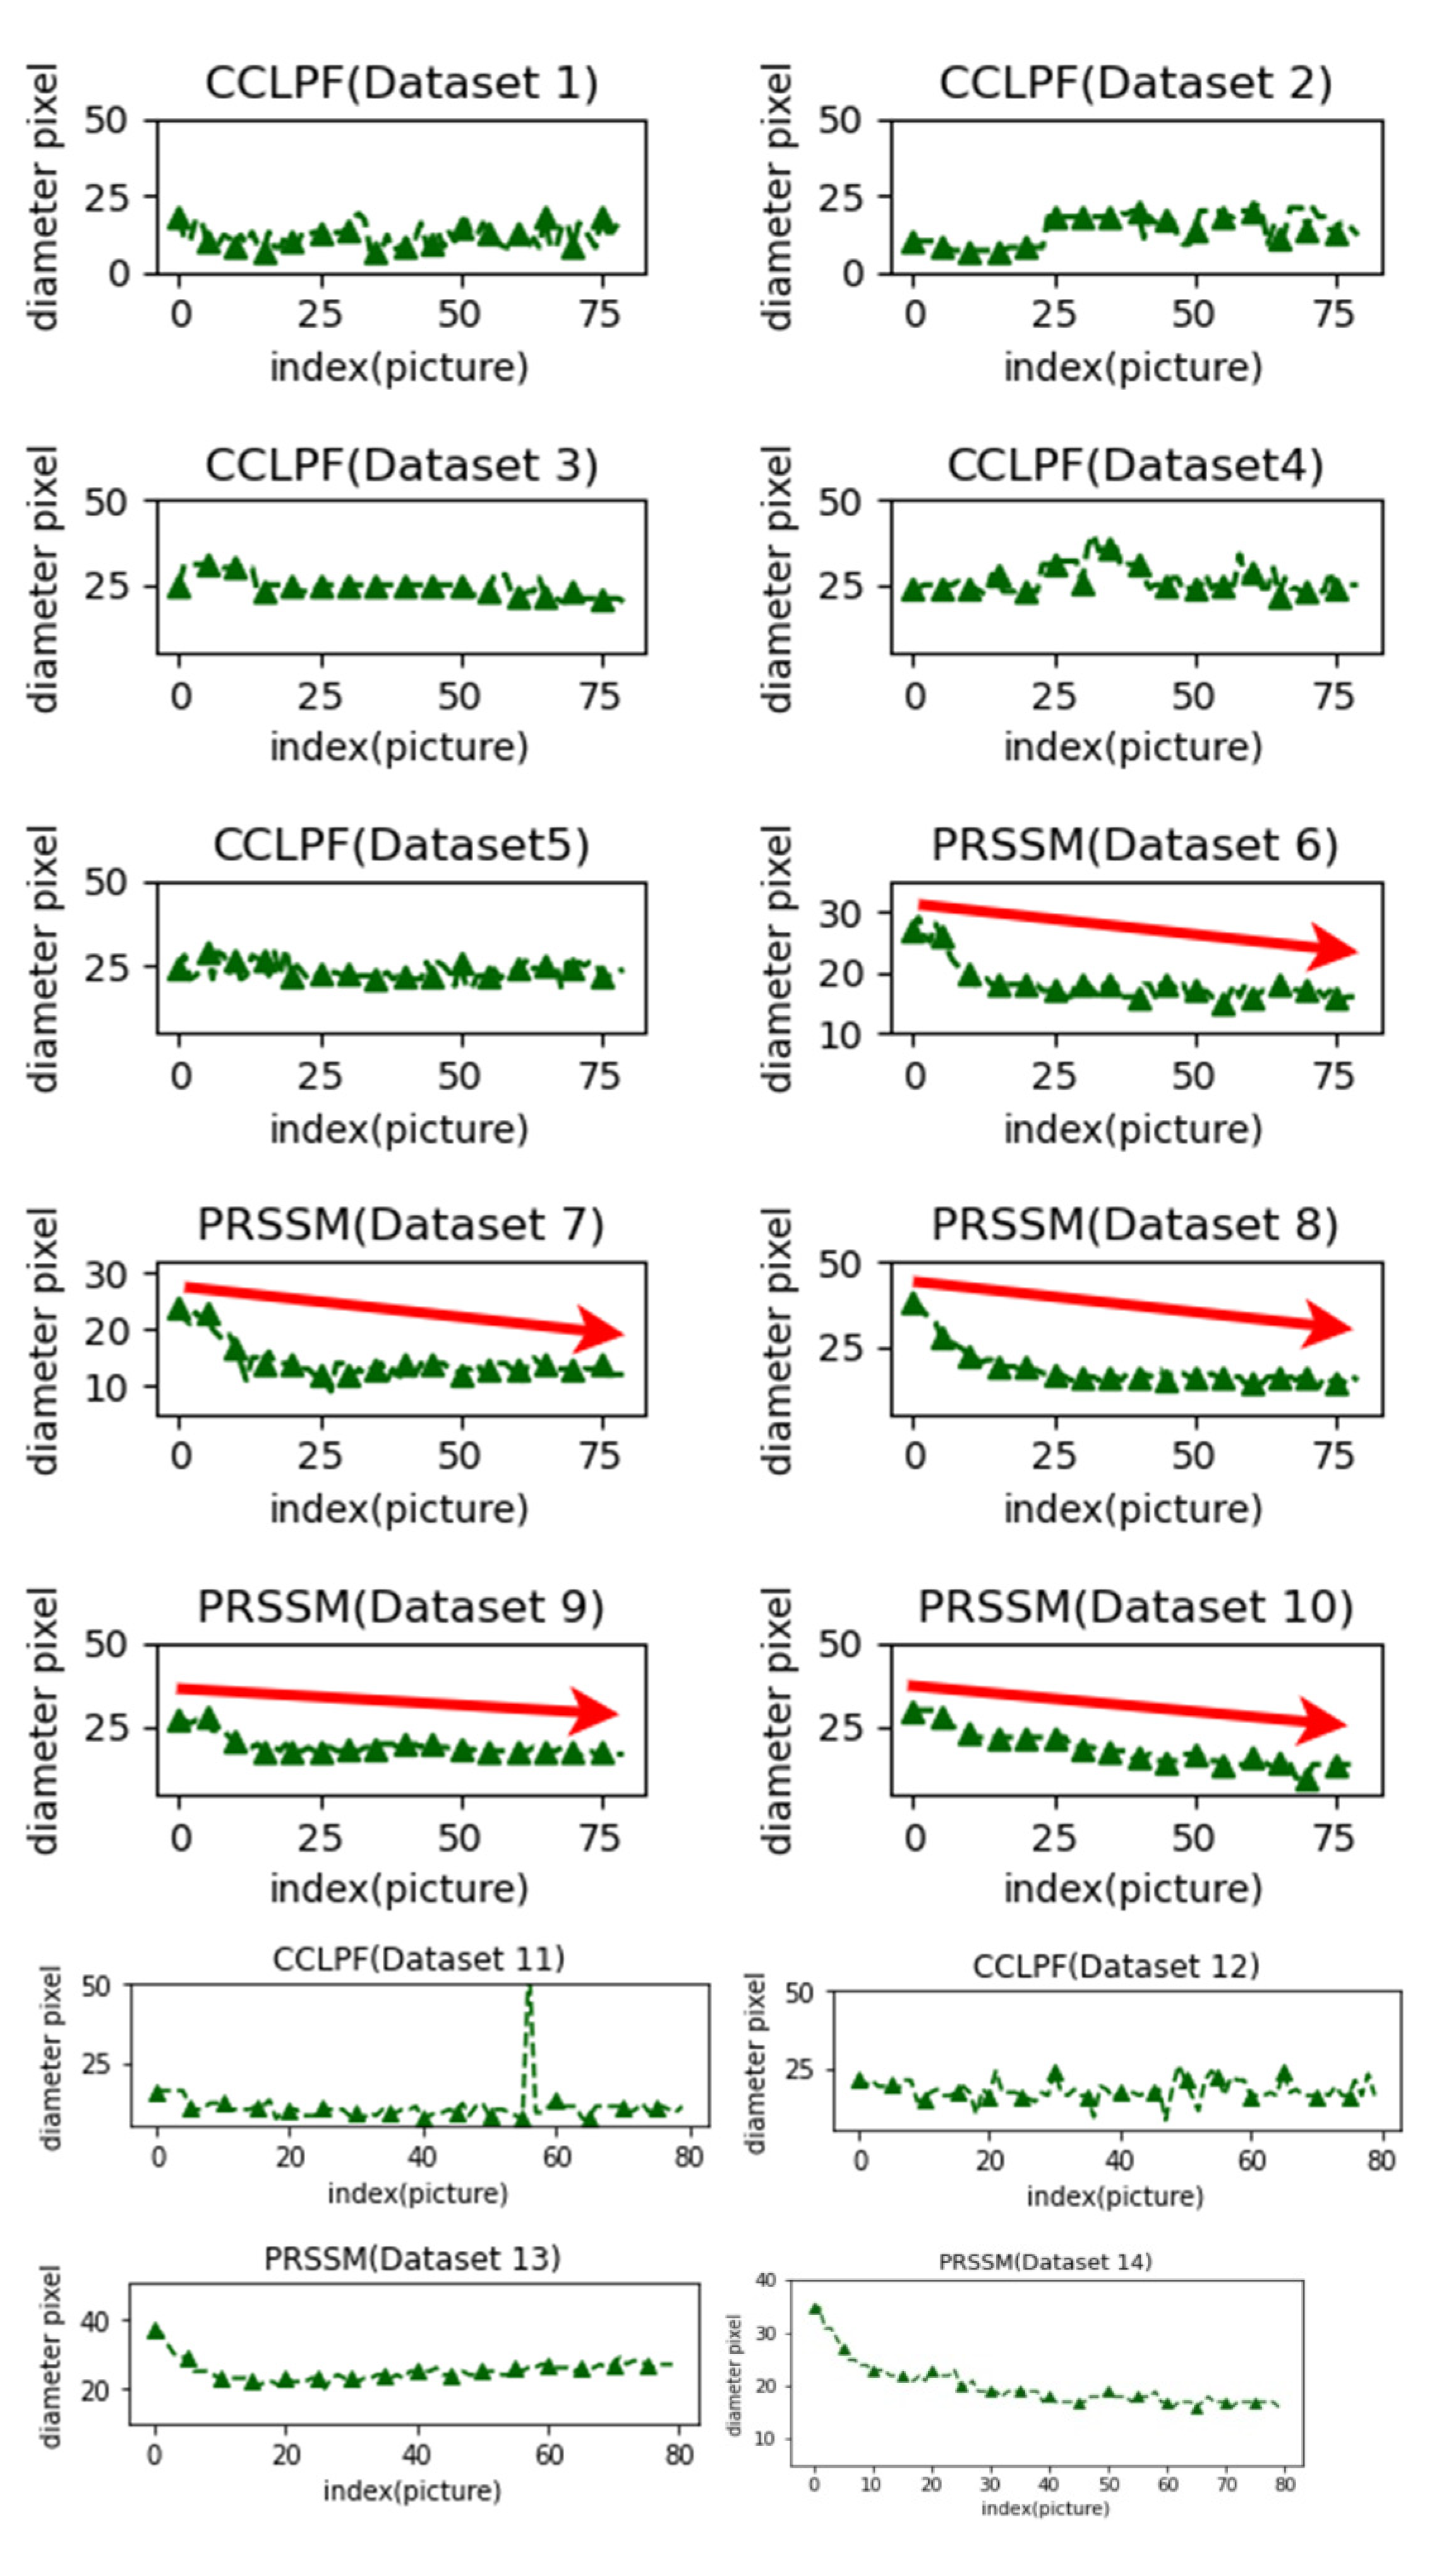
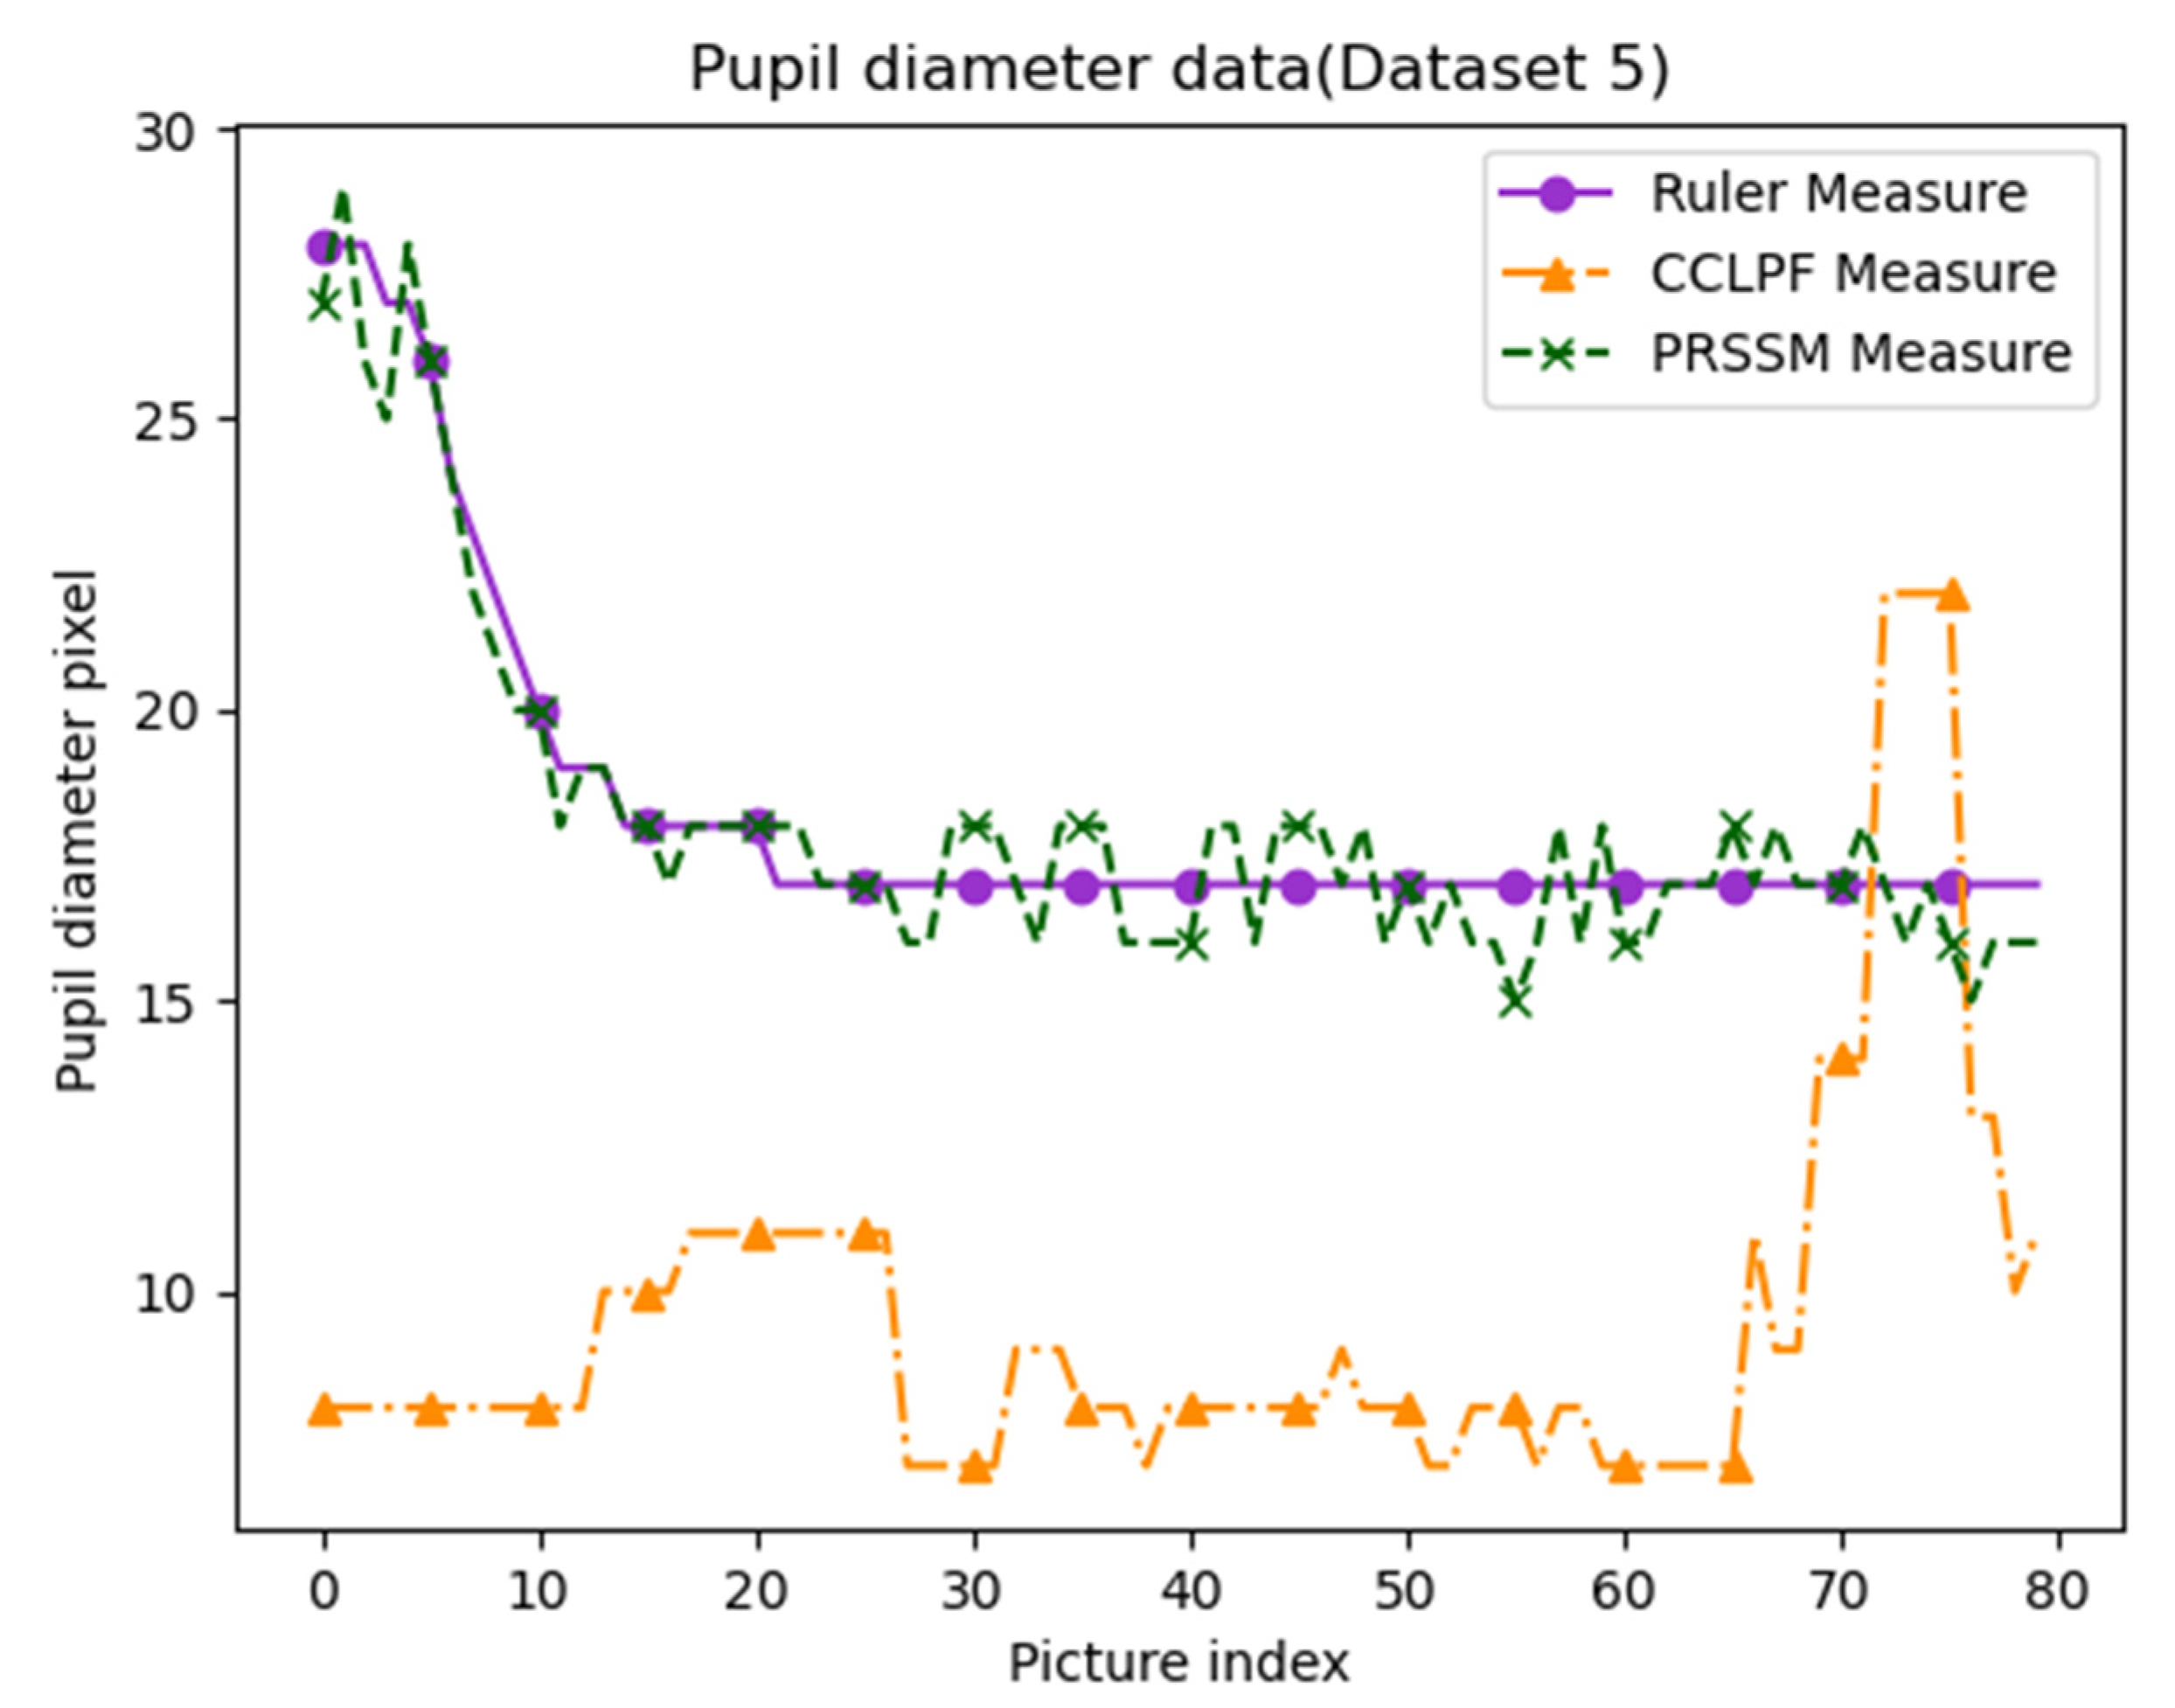
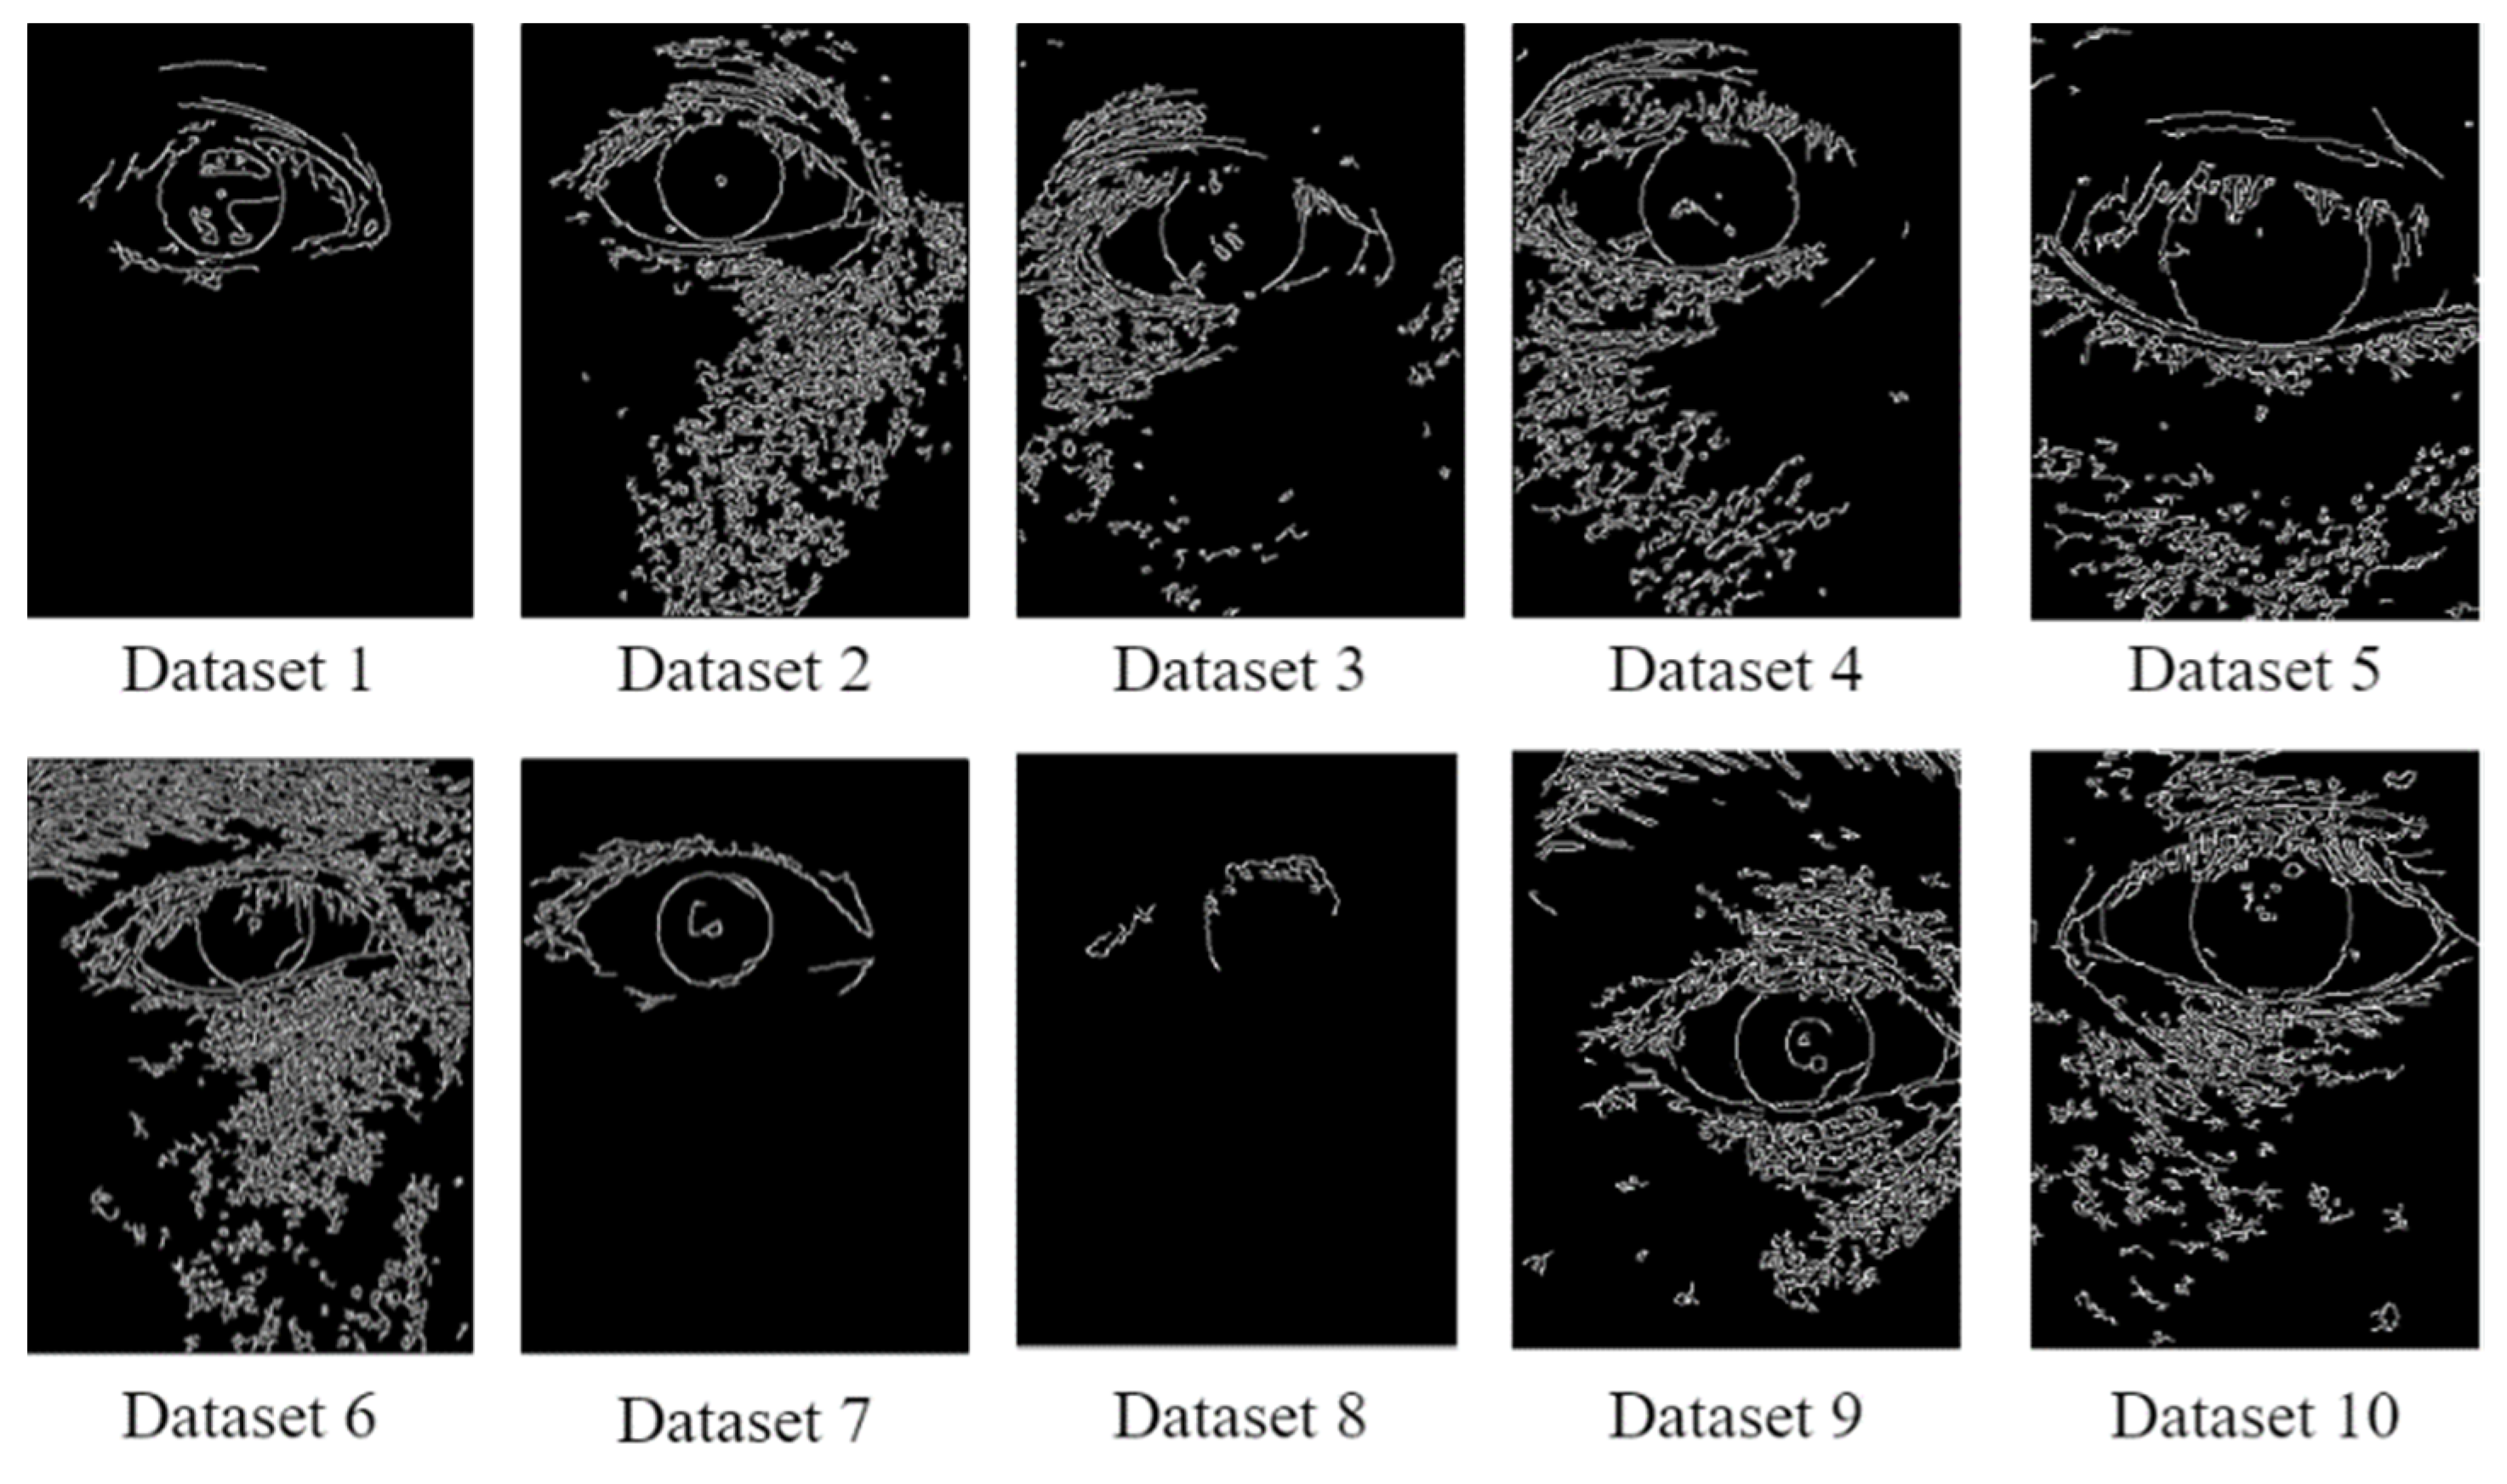
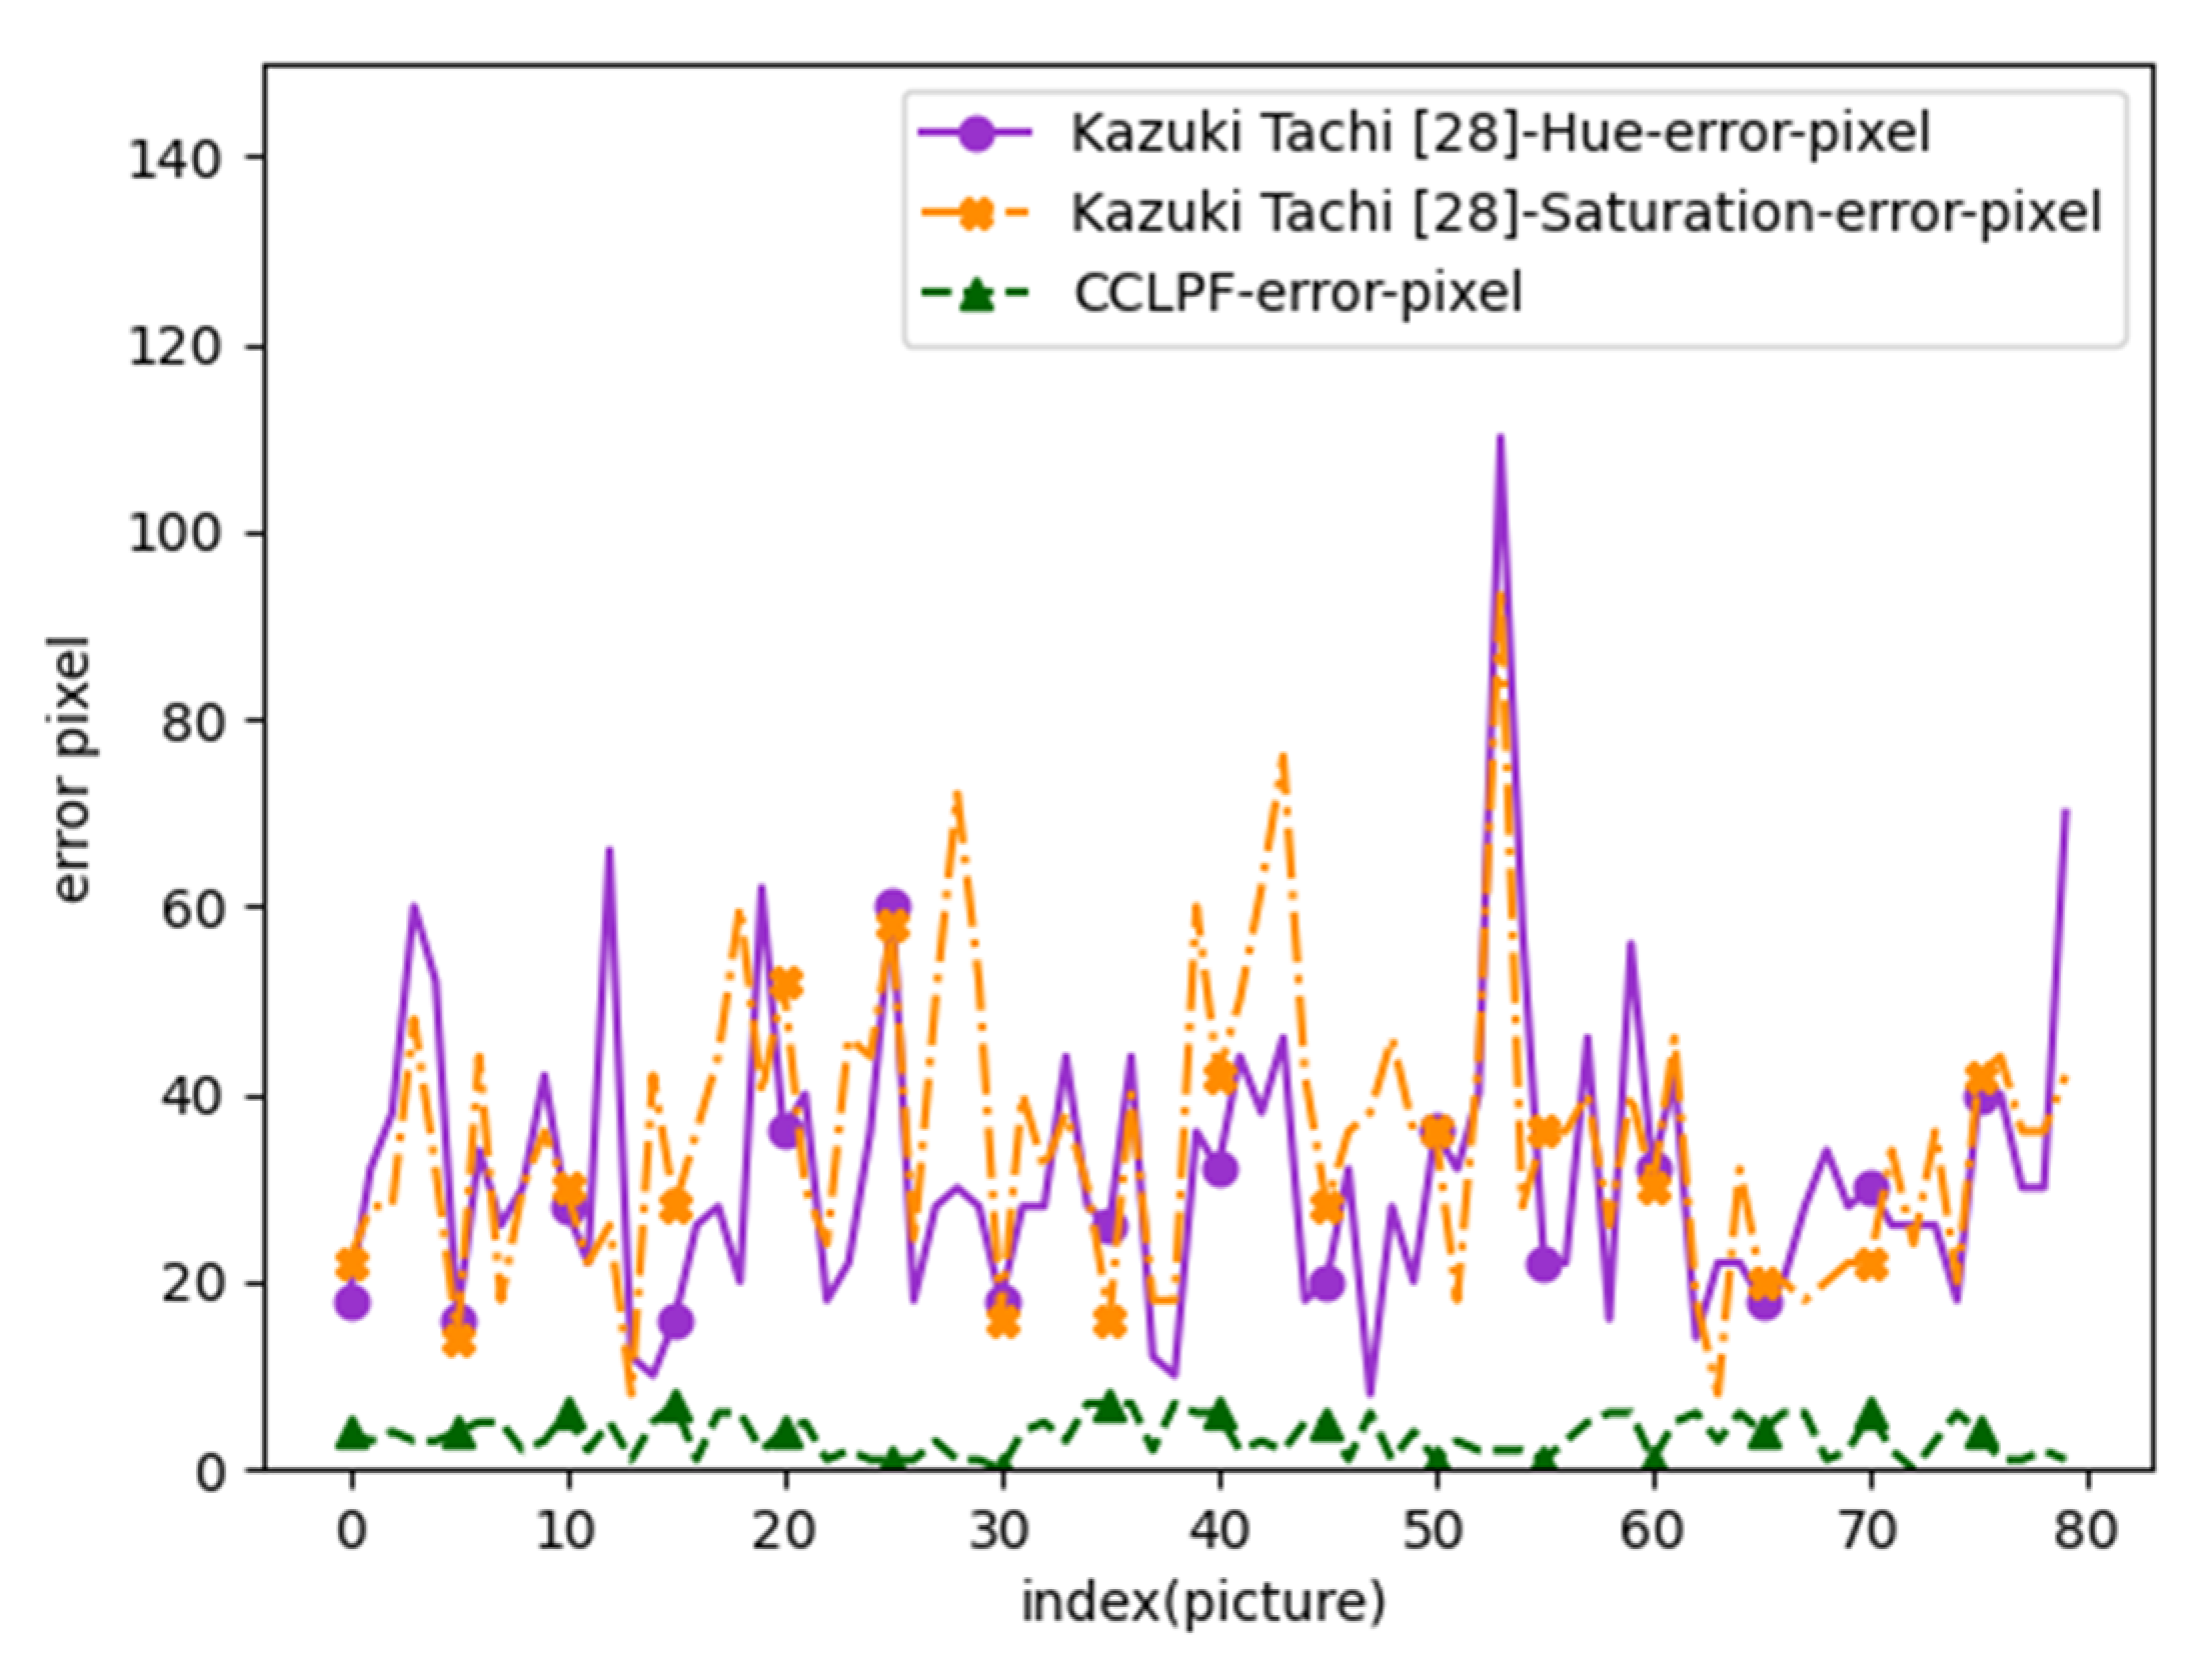
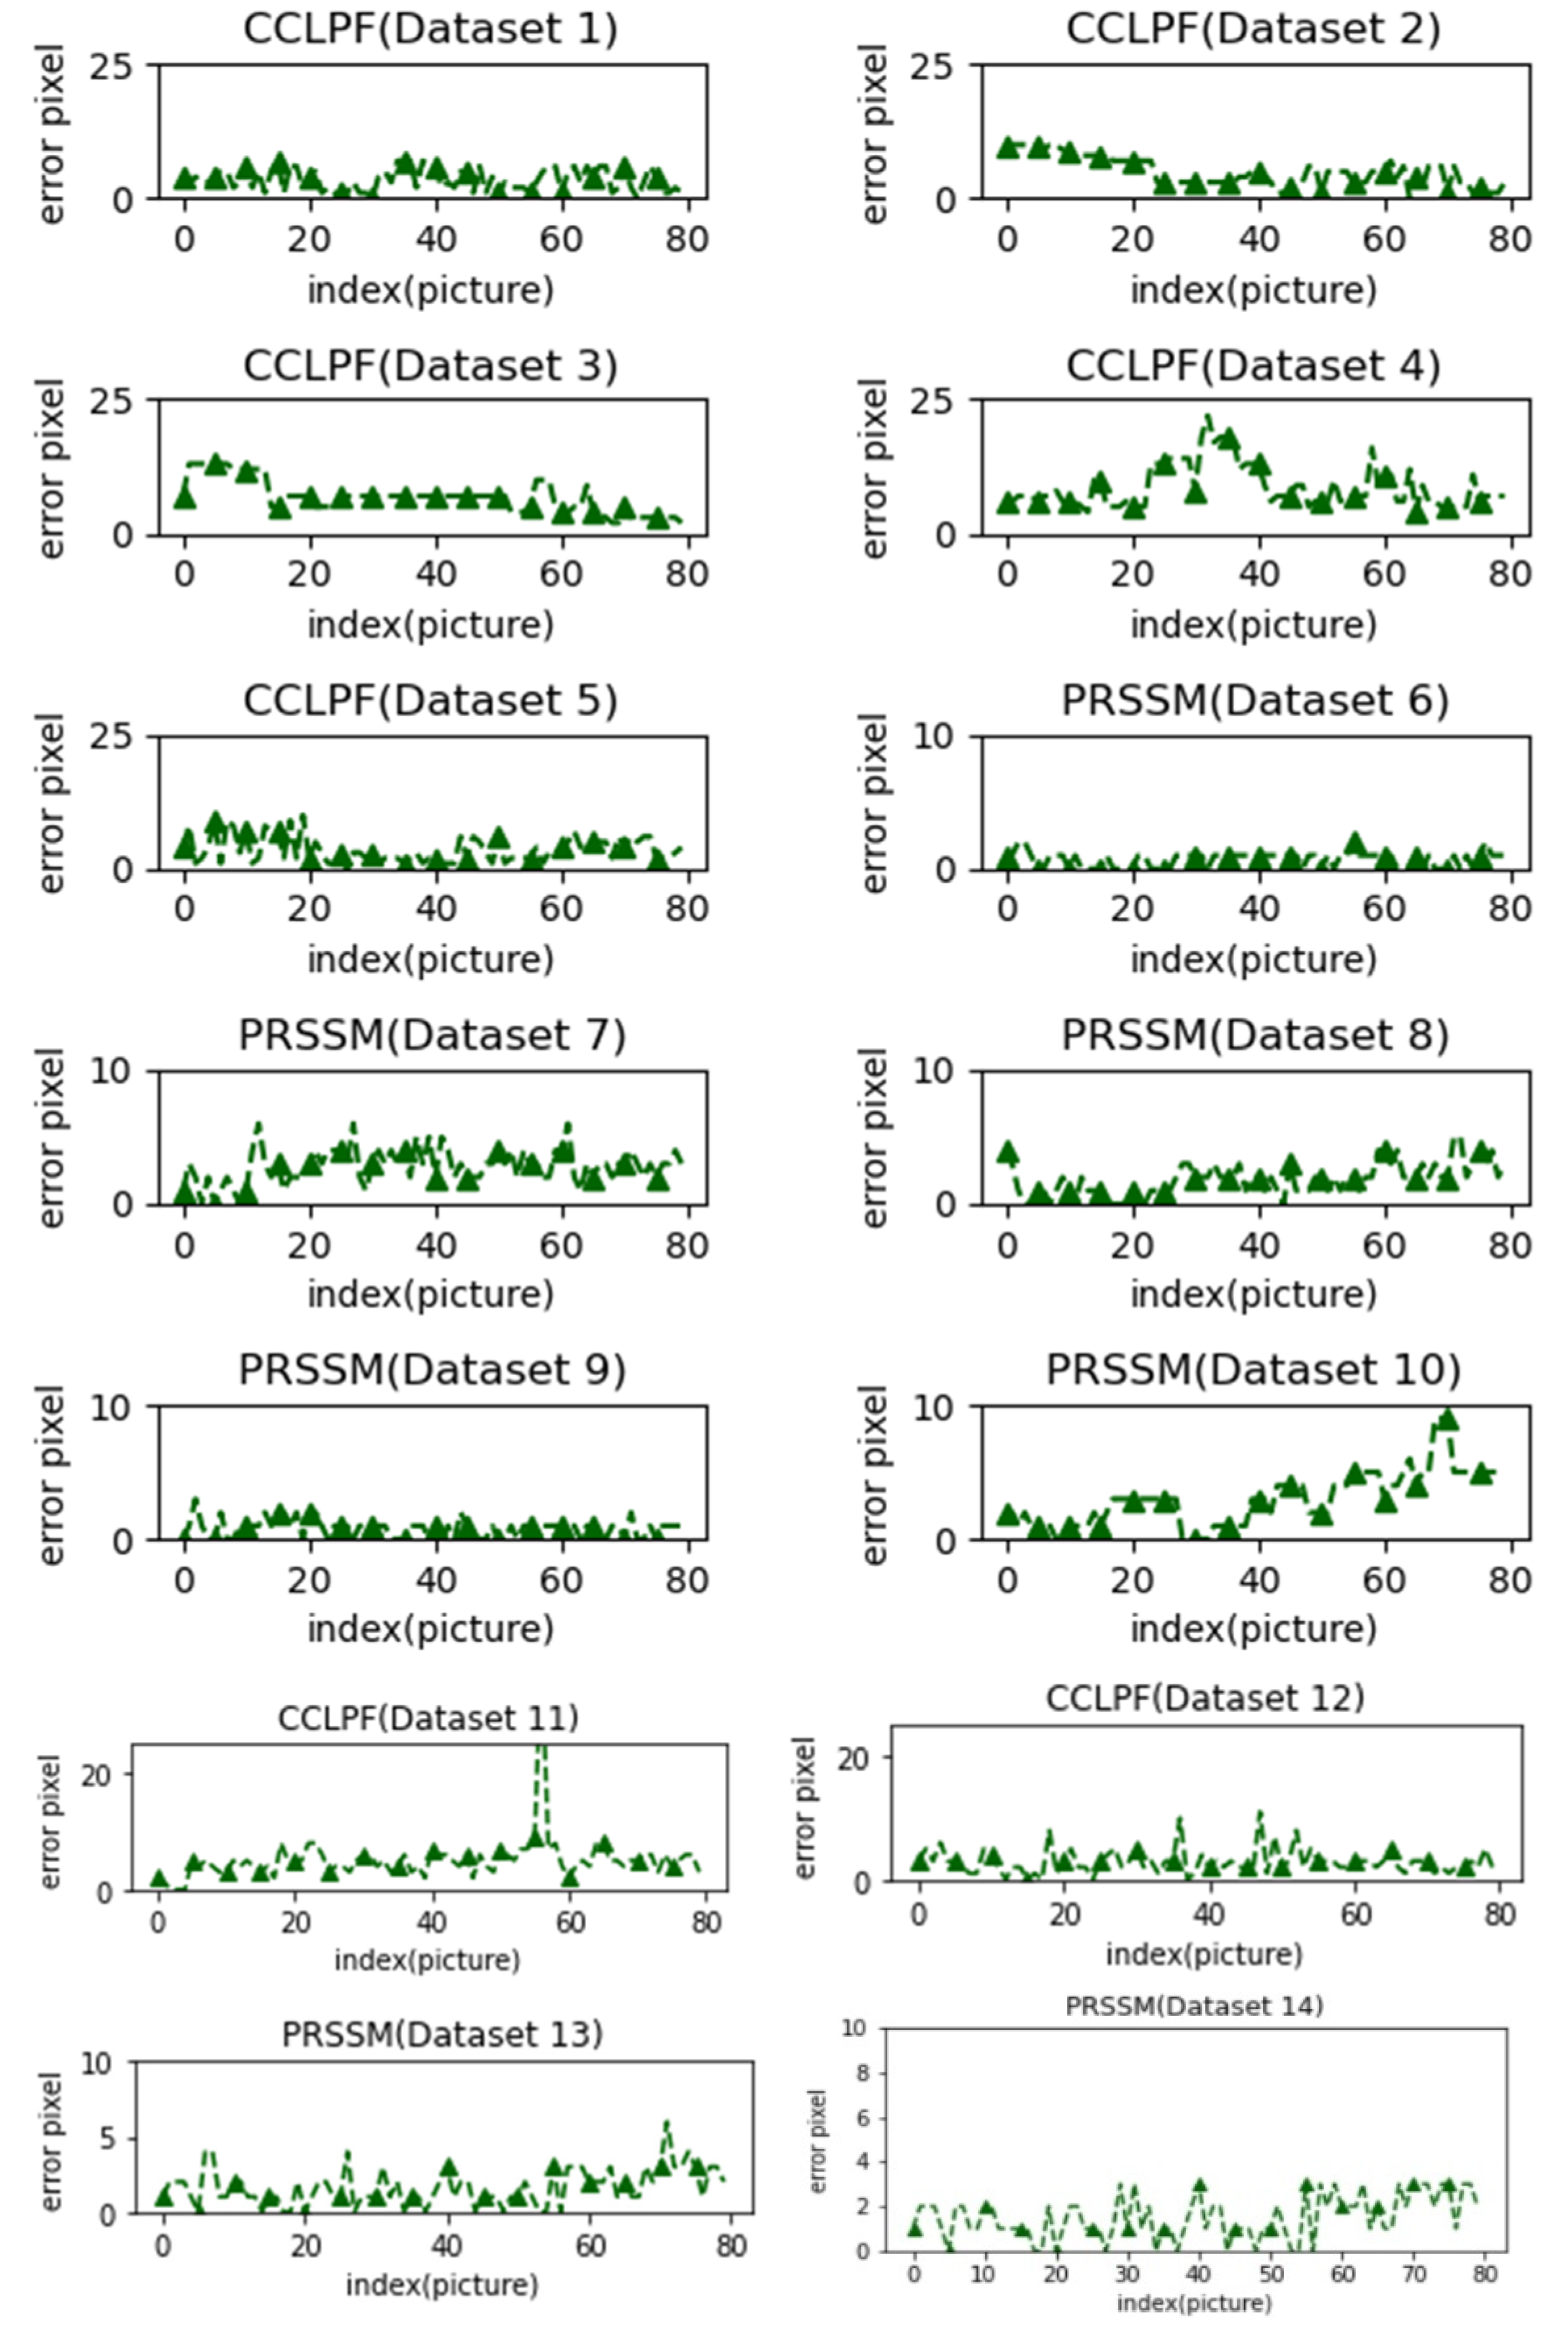
4. Results
5. Discussions
6. Conclusions
Author Contributions
Funding
Institutional Review Board Statement
Informed Consent Statement
Data Availability Statement
Acknowledgments
Conflicts of Interest
References
- Tachi, K.; Takano, H. Effective Color Components for Pupil Diameter Measurement of Brown Eye Using a Visible-Light Camera. In Proceedings of the 2018 IEEE International Conference on Systems, Man, and Cybernetics (SMC), Miyazaki, Japan, 7–10 October 2018; pp. 850–855. [Google Scholar] [CrossRef]
- Chowdhury, D.; Das, S.K.; Nandy, S.; Chakraborty, A.; Goswami, R.; Chakraborty, A. An Atomic Technique For Removal Of Gaussian Noise From A Noisy Gray Scale Image Using LowPass-Convoluted Gaussian Filter. In Proceedings of the 2019 International Conference on Opto-Electronics and Applied Optics (Optronix), Kolkata, India, 18–20 March 2019; pp. 1–6. [Google Scholar] [CrossRef]
- Lyakhov, P.A.; Orazaev, A.R.; Chervyakov, N.I.; Kaplun, D.I. A New Method for Adaptive Median Filtering of Images. In Proceedings of the 2019 IEEE Conference of Russian Young Researchers in Electrical and Electronic Engineering (EIConRus), Moscow, Russia, 28–31 January 2019; pp. 1197–1201. [Google Scholar] [CrossRef]
- Tian, S. Grayscale Projection Image Stabilization Algorithm Based on Gray Bit-Plane for Moving Object. In Proceedings of the 2018 Eighth International Conference on Instrumentation & Measurement, Computer, Communication and Control (IMCCC), Harbin, China, 19–21 July 2018; pp. 610–613. [Google Scholar] [CrossRef]
- Hasan, T.; Khan, E. Contrast Enhancement using Efficient Gray-Level Grouping. In Proceedings of the 2019 International Conference on Electrical, Electronics and Computer Engineering (UPCON), Aligarh, India, 8–10 November 2019; pp. 1–5. [Google Scholar] [CrossRef]
- Bonteanu, P.; Cracan, A.; Bozomitu, R.G.; Bonteanu, G. A Robust Pupil Detection Algorithm based on a New Adaptive Thresholding Procedure. In Proceedings of the 2019 E-Health and Bioengineering Conference (EHB), Iasi, Romania, 21–23 November 2019; pp. 1–4. [Google Scholar] [CrossRef]
- Hu, W.; Zhao, Y. The Threshold Optimization of Track Image Under Strong Sunlight. In Proceedings of the 2020 5th International Conference on Smart Grid and Electrical Automation (ICSGEA), Zhangjiajie, China, 13–14 June 2020; pp. 236–239. [Google Scholar] [CrossRef]
- Cao, Z.; Li, J.; Hu, B. Robust Hazy QR Code Recognition based on Dehazing and Improved Adaptive Thresholding Method. In Proceedings of the 2019 IEEE 15th International Conference on Automation Science and Engineering (CASE), Vancouver, BC, Canada, 22–26 August 2019; pp. 1112–1117. [Google Scholar] [CrossRef]
- Sahagun, M.A.M. Determination of Sweetness level of Muntingia Calabura using HSV Colorspace. In Proceedings of the 2020 International Conference on Data Analytics for Business and Industry: Way Towards a Sustainable Economy (ICDABI), Sakheer, Bahrain, 26–27 October 2020; pp. 1–5. [Google Scholar] [CrossRef]
- Sari, Y.; Alkaff, M.; Maulida, M. Classification of Rice Leaf using Fuzzy Logic and Hue Saturation Value (HSV) to Determine Fertilizer Dosage. In Proceedings of the 2020 Fifth International Conference on Informatics and Computing (ICIC), Gorontalo, Indonesia, 3–4 November 2020; pp. 1–6. [Google Scholar] [CrossRef]
- Nugroho, H.A.; Tantowi, F.L.; Anggara, R.; Aldibra, T.D.; Nurfauzi, R.; Frannita, E.L.; Prananda, A.R. Segmentation of Plasmodium using Saturation Channel of HSV Color Space. In Proceedings of the 2019 International Conference on Information and Communications Technology (ICOIACT), Yogyakarta, Indonesia, 24–25 July 2019; pp. 91–94. [Google Scholar] [CrossRef]
- Matsuo, Y.; Iguchi, K.; Kanda, K. Pre-processing equipment of 8K video codec with low-pass filtering and noise reduction functions. In Proceedings of the 2018 IEEE International Symposium on Signal Processing and Information Technology (ISSPIT), Louisville, KY, USA, 6–8 December 2018; pp. 1–6. [Google Scholar] [CrossRef]
- Liu, M.; Wei, Y. Image Denoising Using Graph-Based Frequency Domain Low-pass Filtering. In Proceedings of the 2019 IEEE 4th International Conference on Image, Vision and Computing (ICIVC), Xiamen, China, 5–7 July 2019; pp. 118–122. [Google Scholar] [CrossRef]
- Youn, Y.; Kim, K.; Kim, B. A Rule-of-thumb Condition to Avoid Large HRS Current in ReRAM Crossbar Array Design. In Proceedings of the 2018 International SoC Design Conference (ISOCC), Daegu, Korea, 12–15 November 2018; pp. 17–18. [Google Scholar] [CrossRef]
- Gao, M.; Nikolayev, D.; Bosiljevac, M.; Sipus, Z.; Skrivervik, A.K. Rules of Thumb to Assess Losses of Implanted Antennas. In Proceedings of the 2021 15th European Conference on Antennas and Propagation (EuCAP), Dusseldorf, Germany, 22–26 March 2021; pp. 1–5. [Google Scholar] [CrossRef]
- Suzuki, S. Topological Structural Analysis of Digitized Binary Images by Border Following. Comput. Vis. Graph. Image Process. 1985, 30, 32–46. [Google Scholar] [CrossRef]
- Khan, W.; Hussain, A.; Kuru, K.; Al-askar, H. Pupil Localisation and Eye Centre Estimation Using Machine Learning and Computer Vision. Sensors 2020, 20, 3785. [Google Scholar] [CrossRef] [PubMed]
- Khan, W.; Ansell, D.; Kuru, K.; Amina, M. Automated aircraft instrument reading using real time video analysis. In Proceedings of the 2016 IEEE 8th International Conference on Intelligent Systems (IS), Sofia, Bulgaria, 4–6 September 2016; pp. 416–420. [Google Scholar] [CrossRef] [Green Version]
- Exposure-value-measurements. Available online: https://www.pixelsham.com/2020/12/26/exposure-value-measurements/ (accessed on 26 December 2020).


| Full Title | Abbreviations |
|---|---|
| Pupil stateful recognition service mechanism | PRSSM |
| Color component low-pass filtering | CCLPF |
| Hue Saturation Value | HSV |
| Low pass filtering | LPF |
| Environment | Exposure value (EV) |
|---|---|
| Under the hot sun | 16 |
| Under a cloudy sky | 15 |
| Mappings | 14 |
| In a reading room | 13 |
| In a baseball field at night | 12 |
| In an office or a classroom | 12 |
| Under street lights | 8–11 |
| Under a full moon | 8–9 |
| Under starlight | 8 |
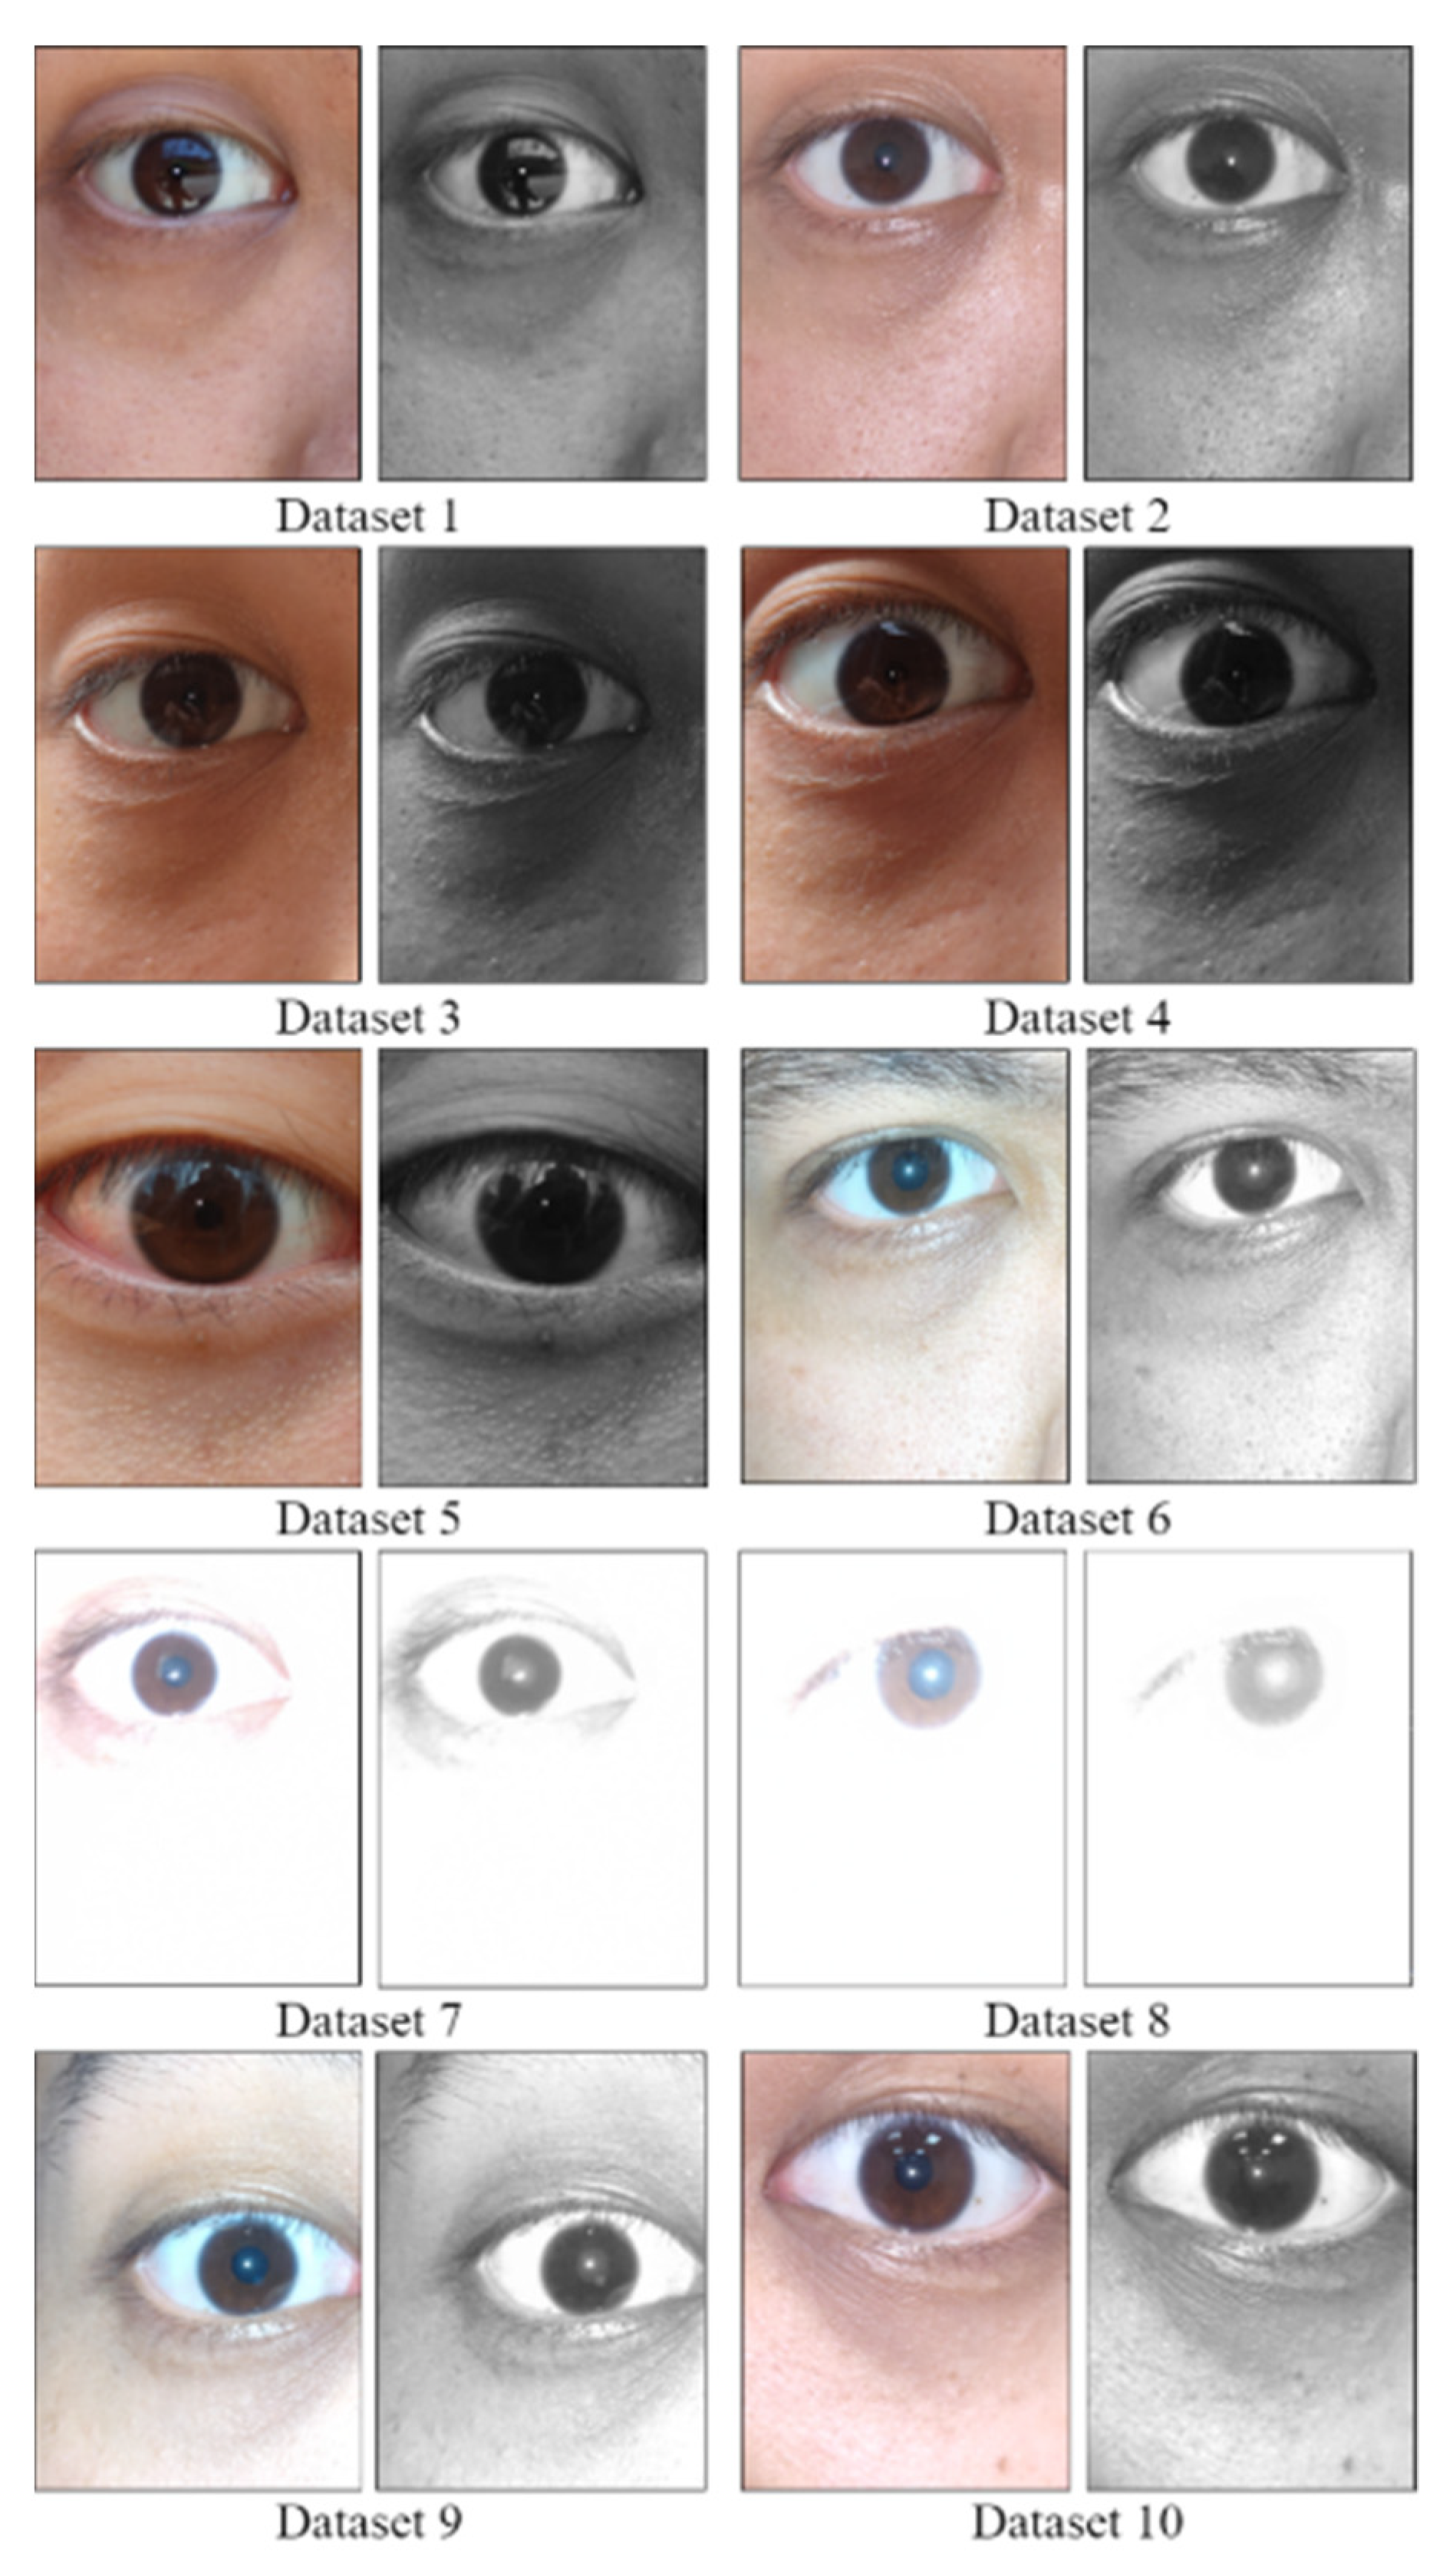
| Data set | Participant | Age (Years) | Gender | Occupation |
|---|---|---|---|---|
| Data Set 1 | A | 18 | Female | Student |
| Data Set 2 | B | 21 | Female | Student |
| Data Set 3 | C | 17 | Female | Student |
| Data Set 4 | D | 24 | Male | Student |
| Data Set 5 | E | 23 | Male | Student |
| Data Set 6 | F | 30 | Male | Technology industry |
| Data Set 7 | G | 22 | Female | Student |
| Data Set 8 | H | 18 | Male | Student |
| Data Set 9 | I | 20 | Male | Student |
| Data Set 10 | J | 28 | Female | Service industry |
| Data Set 11 | K | 53 | Male | woodworker |
| Data Set 12 | L | 51 | Female | hairdresser |
| Data Set 13 | M | 21 | Female | Student |
| Data Set 14 | N | 40 | Male | IT Engineer |
| Data Set | Source Of The Data Set |
|---|---|
| Data Set 1 | Outdoor sunshine riding downstairs shooting (1) |
| Data Set 2 | Outdoor sunshine riding downstairs shooting (2) |
| Data Set 3 | Captured outdoor under natural sunlight (1) |
| Data Set 4 | Captured outdoor under natural sunlight (2) |
| Data Set 5 | Captured outdoor under natural sunlight (3) |
| Data Set 6 | Captured in an office room |
| Data Set 7 | Captured in a shady warehouse |
| Data Set 8 | Captured under faint orange light in a washroom |
| Data Set 9 | Captured in a bedroom |
| Data Set 10 | Captured in a living room (1) |
| Data Set 11 | Captured outdoor under natural sunlight (4) |
| Data Set 12 | Captured outdoor under natural sunlight (5) |
| Data Set 13 | Captured in a living room (2) |
| Data Set 14 | Captured in a living room (3) |
Publisher’s Note: MDPI stays neutral with regard to jurisdictional claims in published maps and institutional affiliations. |
© 2022 by the authors. Licensee MDPI, Basel, Switzerland. This article is an open access article distributed under the terms and conditions of the Creative Commons Attribution (CC BY) license (https://creativecommons.org/licenses/by/4.0/).
Share and Cite
Ke, R.-S.; Horng, G.-J.; Chen, K.-T.; Lee, K.-C. Stateful-Service-Based Pupil Recognition in Natural Light Environments. Healthcare 2022, 10, 789. https://doi.org/10.3390/healthcare10050789
Ke R-S, Horng G-J, Chen K-T, Lee K-C. Stateful-Service-Based Pupil Recognition in Natural Light Environments. Healthcare. 2022; 10(5):789. https://doi.org/10.3390/healthcare10050789
Chicago/Turabian StyleKe, Rih-Shen, Gwo-Jiun Horng, Kuo-Tai Chen, and Kuo-Chang Lee. 2022. "Stateful-Service-Based Pupil Recognition in Natural Light Environments" Healthcare 10, no. 5: 789. https://doi.org/10.3390/healthcare10050789
APA StyleKe, R.-S., Horng, G.-J., Chen, K.-T., & Lee, K.-C. (2022). Stateful-Service-Based Pupil Recognition in Natural Light Environments. Healthcare, 10(5), 789. https://doi.org/10.3390/healthcare10050789