
Information Usage and Compliance with Preventive Behaviors for COVID-19: A Longitudinal Study with Data from the JACSIS 2020/JASTIS 2021

 , , ,
, , , 
Abstract
:1. Introduction
2. Materials and Methods
2.1. Study Design and Participants
2.2. Outcome Variables: Compliance with Preventive Behaviors for COVID-19
2.3. Predictors: Information Usage to Obtain Information about COVID-19
2.4. Covariates
2.5. Statistical Analysis
2.6. Ethical Issues
3. Results
4. Discussion
5. Conclusions
Supplementary Materials
Author Contributions
Funding
Institutional Review Board Statement
Informed Consent Statement
Data Availability Statement
Conflicts of Interest
References
- Tsang, H.F.; Chan, L.W.C.; Cho, W.C.S.; Yu, A.C.S.; Yim, A.K.Y.; Chan, A.K.C.; Ng, L.P.W.; Wong, Y.K.E.; Pei, X.M.; Li, M.J.W.; et al. An update on COVID-19 pandemic: The epidemiology, pathogenesis, prevention and treatment strategies. Expert Rev. Anti Infect. Ther. 2021, 19, 877–888. [Google Scholar] [CrossRef]
- Kow, C.S.; Hasan, S.S. Real-world effectiveness of BNT162b2 mRNA vaccine: A meta-analysis of large observational studies. Inflammopharmacology 2021, 29, 1075–1090. [Google Scholar] [CrossRef] [PubMed]
- Doroshenko, A. The Combined Effect of Vaccination and Nonpharmaceutical Public Health Interventions-Ending the COVID-19 Pandemic. JAMA Netw. Open 2021, 4, e2111675. [Google Scholar] [CrossRef]
- Chu, D.K.; Akl, E.A.; Duda, S.; Solo, K.; Yaacoub, S.; Schünemann, H.J. Physical distancing, face masks, and eye protection to prevent person-to-person transmission of SARS-CoV-2 and COVID-19: A systematic review and meta-analysis. Lancet 2020, 395, 1973–1987. [Google Scholar] [CrossRef]
- Nembhard, M.D.; Burton, D.J.; Cohen, J.M. Ventilation use in nonmedical settings during COVID-19: Cleaning protocol, maintenance, and recommendations. Toxicol. Ind. Health 2020, 36, 644–653. [Google Scholar] [CrossRef]
- Prevention Centers for Disease Control. Science Brief: COVID-19 Vaccines and Vaccination. Available online: https://www.cdc.gov/coronavirus/2019-ncov/science/science-briefs/fully-vaccinated-people.html (accessed on 25 January 2021).
- Ortiz, R.R.; Smith, A.; Coyne-Beasley, T. A systematic literature review to examine the potential for social media to impact HPV vaccine uptake and awareness, knowledge, and attitudes about HPV and HPV vaccination. Hum. Vaccin. Immunother. 2019, 15, 1465–1475. [Google Scholar] [CrossRef]
- Tasnim, S.; Hossain, M.M.; Mazumder, H. Impact of Rumors and Misinformation on COVID-19 in Social Media. J. Prev. Med. Public Health 2020, 53, 171–174. [Google Scholar] [CrossRef] [Green Version]
- Islam, M.S.; Sarkar, T.; Khan, S.H.; Mostofa Kamal, A.-H.; Hasan, S.M.M.; Kabir, A.; Yeasmin, D.; Islam, M.A.; Amin Chowdhury, K.I.; Anwar, K.S.; et al. COVID-19-Related Infodemic and Its Impact on Public Health: A Global Social Media Analysis. Am. J. Trop. Med. Hyg. 2020, 103, 1621–1629. [Google Scholar] [CrossRef]
- Batra, K.; Urankar, Y.; Batra, R.; Gomes, A.F.; Meru, S.; Kaurani, P. Knowledge, Protective Behaviors and Risk Perception of COVID-19 among Dental Students in India: A Cross-Sectional Analysis. Healthcare 2021, 9, 574. [Google Scholar] [CrossRef]
- Wu, Y.; Shen, F. Exploring the impacts of media use and media trust on health behaviors during the COVID-19 pandemic in China. J. Health Psychol. 2021, 1359105321995964. [Google Scholar] [CrossRef]
- Hernández-García, I.; Giménez-Júlvez, T. Assessment of Health Information about COVID-19 Prevention on the Internet: Infodemiological Study. JMIR Public Health Surveill. 2020, 6, e18717. [Google Scholar] [CrossRef] [Green Version]
- Liu, L.; Xie, J.; Li, K.; Ji, S. Exploring How Media Influence Preventive Behavior and Excessive Preventive Intention during the COVID-19 Pandemic in China. Int. J. Environ. Res. Public Health 2020, 17, 7990. [Google Scholar] [CrossRef]
- Li, S.; Feng, B.; Liao, W.; Pan, W. Internet Use, Risk Awareness, and Demographic Characteristics Associated With Engagement in Preventive Behaviors and Testing: Cross-Sectional Survey on COVID-19 in the United States. J. Med. Internet Res. 2020, 22, e19782. [Google Scholar] [CrossRef]
- The Government of Japan Avoiding the Three Cs: A Key to Preventing the Spread of COVID-19. Available online: https://www.japan.go.jp/kizuna/2020/avoiding_the_three_cs.html (accessed on 8 September 2021).
- Siebenhaar, K.U.; Köther, A.K.; Alpers, G.W. Dealing with the COVID-19 Infodemic: Distress by Information, Information Avoidance, and Compliance with Preventive Measures. Front. Psychol. 2020, 11, 567905. [Google Scholar] [CrossRef]
- Melki, J.; Tamim, H.; Hadid, D.; Farhat, S.; Makki, M.; Ghandour, L.; Hitti, E. Media Exposure and Health Behavior during Pandemics: The Mediating Effect of Perceived Knowledge and Fear on Compliance with COVID-19 Prevention Measures. Health Commun. 2020, 37, 586–596. [Google Scholar] [CrossRef]
- Li, X.; Liu, Q. Social Media Use, eHealth Literacy, Disease Knowledge, and Preventive Behaviors in the COVID-19 Pandemic: Cross-Sectional Study on Chinese Netizens. J. Med. Internet Res. 2020, 22, e19684. [Google Scholar] [CrossRef]
- Ishikawa, H.; Nomura, K.; Sato, M.; Yano, E. Developing a measure of communicative and critical health literacy: A pilot study of Japanese office workers. Health Promot. Int. 2008, 23, 269–274. [Google Scholar] [CrossRef] [Green Version]
- Naimi, A.I.; Whitcomb, B.W. Estimating Risk Ratios and Risk Differences Using Regression. Am. J. Epidemiol. 2020, 189, 508–510. [Google Scholar] [CrossRef]
- Tabuchi, T.; Gallus, S.; Shinozaki, T.; Nakaya, T.; Kunugita, N.; Colwell, B. Heat-not-burn tobacco product use in Japan: Its prevalence, predictors and perceived symptoms from exposure to secondhand heat-not-burn tobacco aerosol. Tob. Control 2018, 27, e25–e33. [Google Scholar] [CrossRef] [Green Version]
- Austin, P.C. An Introduction to Propensity Score Methods for Reducing the Effects of Confounding in Observational Studies. Multivar. Behav. Res. 2011, 46, 399–424. [Google Scholar] [CrossRef] [Green Version]
- Fridman, I.; Lucas, N.; Henke, D.; Zigler, C.K. Association Between Public Knowledge about COVID-19, Trust in Information Sources, and Adherence to Social Distancing: Cross-Sectional Survey. JMIR Public Health Surveill. 2020, 6, e22060. [Google Scholar] [CrossRef]
- Wakefield, M.A.; Loken, B.; Hornik, R.C. Use of mass media campaigns to change health behaviour. Lancet 2010, 376, 1261–1271. [Google Scholar] [CrossRef] [Green Version]
- Glanz, K.; Bishop, D.B. The role of behavioral science theory in development and implementation of public health interventions. Annu. Rev. Public Health 2010, 31, 399–418. [Google Scholar] [CrossRef] [PubMed] [Green Version]
- Arguel, A.; Perez-Concha, O.; Li, S.Y.W.; Lau, A.Y.S. Theoretical approaches of online social network interventions and implications for behavioral change: A systematic review. J. Eval. Clin. Pract. 2018, 24, 212–221. [Google Scholar] [CrossRef] [PubMed]
- Xie, T.; Tang, M.; Zhang, R.J.; Liu, J.H. The Active Role of the Internet and Social Media Use in Nonpharmaceutical and Pharmaceutical Preventive Measures against COVID-19. Healthcare 2022, 10, 113. [Google Scholar] [CrossRef]
- The Lancet Infectious Disease. The COVID-19 Infodemic. Available online: https://www.thelancet.com/journals/laninf/article/PIIS1473-3099(20)30565-X/fulltext (accessed on 25 January 2021).
- Duong, D. Information overload challenges pandemic control. CMAJ 2021, 193, E1222–E1223. [Google Scholar] [CrossRef] [PubMed]
- Valika, T.S.; Maurrasse, S.E.; Reichert, L. A Second Pandemic? Perspective on Information Overload in the COVID-19 Era. Otolaryngol. Head Neck Surg. 2020, 163, 931–933. [Google Scholar] [CrossRef] [PubMed]
- Nohr, E.A.; Liew, Z. How to investigate and adjust for selection bias in cohort studies. Acta Obstet. Gynecol. Scand. 2018, 97, 407–416. [Google Scholar] [CrossRef] [PubMed] [Green Version]
- Höfler, M. The effect of misclassification on the estimation of association: A review. Int. J. Methods Psychiatr. Res. 2005, 14, 92–101. [Google Scholar] [CrossRef] [PubMed]
- Kusama, T.; Aida, J.; Tsuboya, T.; Sugiyama, K.; Yamamoto, T.; Igarashi, A.; Osaka, K. The association between socioeconomic status and reactions to radiation exposure: A cross-sectional study after the Fukushima Daiichi nuclear power station accident. PLoS ONE 2018, 13, e0205531. [Google Scholar] [CrossRef]
- AlAmodi, A.A.; Al-Kattan, K.; Shareef, M.A. The current global perspective of the knowledge-attitude-behavior of the general public towards the corona virus disease-19 pandemic: Systematic review and meta-analysis on 67,143 participants. PLoS ONE 2021, 16, e0260240. [Google Scholar] [CrossRef] [PubMed]


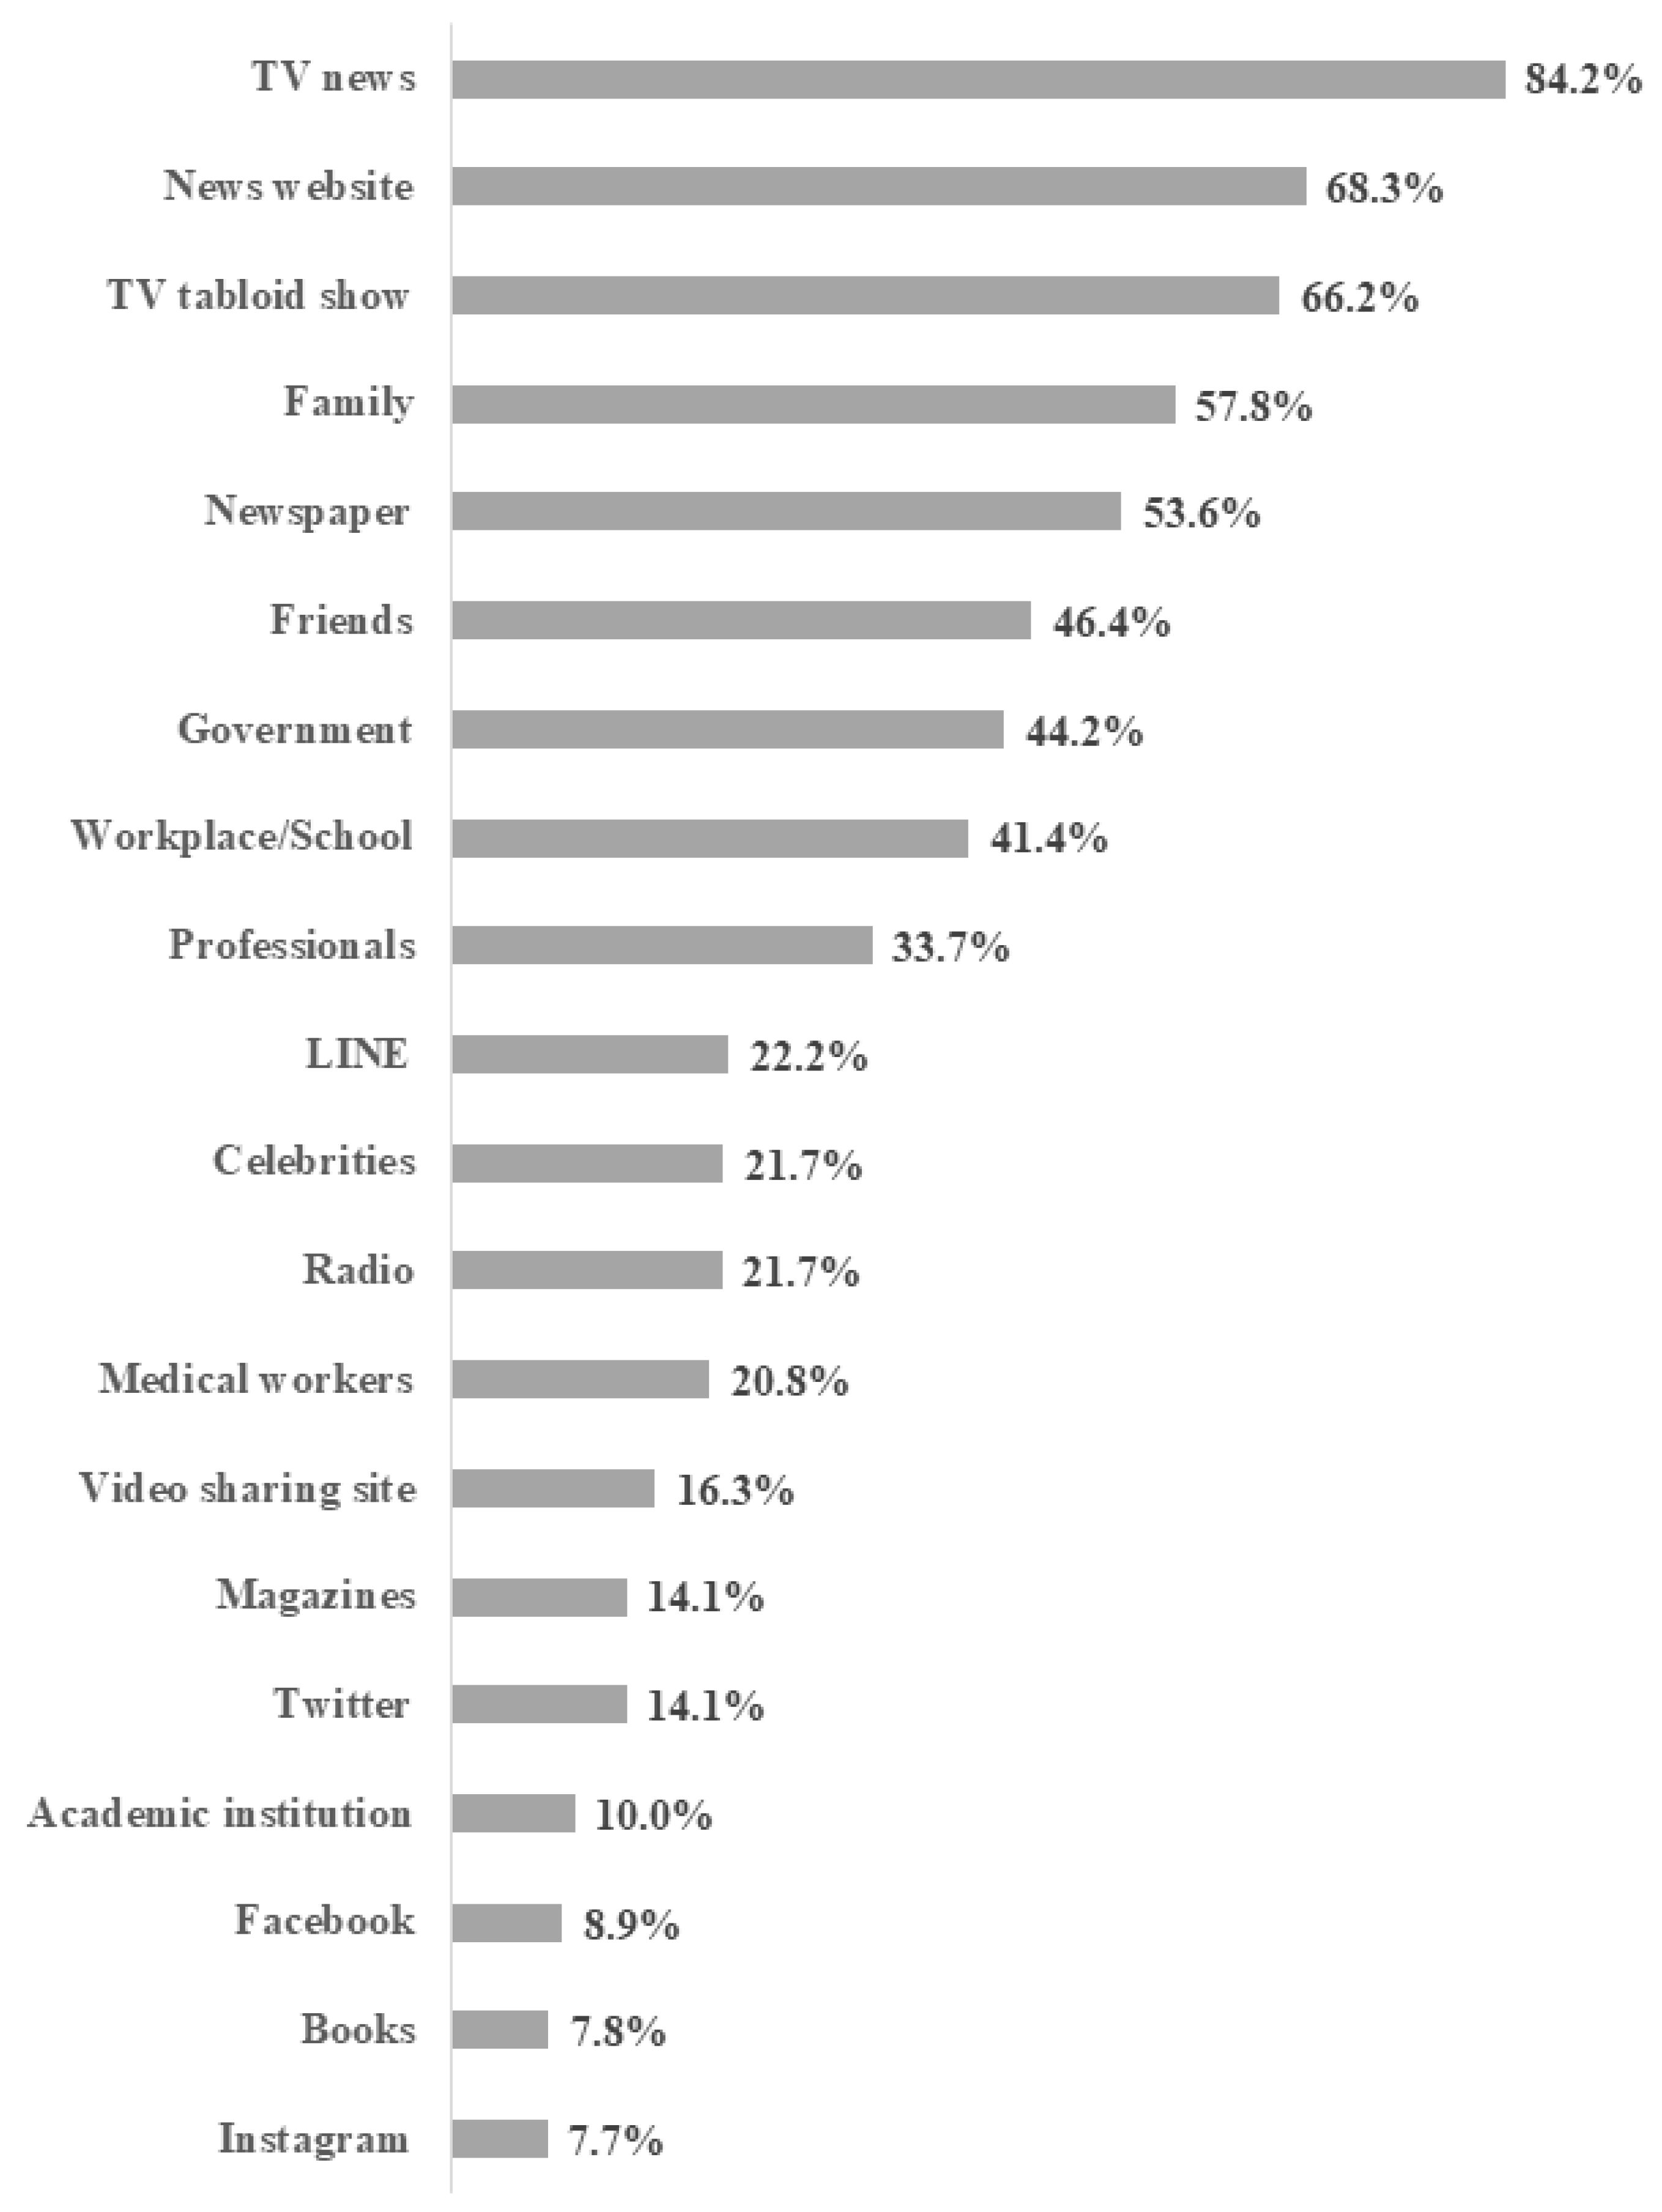
| Characteristics | 2020 | 2021 | |||
|---|---|---|---|---|---|
| n | % | n | % | ||
| Preventive behaviors | |||||
| Wearing a mask | Yes | 15,641 | 86.2 | 16,218 | 89.3 |
| No | 2510 | 13.8 | 1933 | 10.7 | |
| Ventilation | Yes | 8513 | 46.9 | 6927 | 38.2 |
| No | 9638 | 53.1 | 11,224 | 61.8 | |
| Social distancing | Yes | 8231 | 45.4 | 8569 | 47.2 |
| No | 9920 | 54.6 | 9582 | 52.8 | |
| Avoiding crowds | Yes | 11,356 | 62.6 | 11,187 | 61.6 |
| No | 6795 | 37.4 | 6694 | 38.4 | |
| Information sources | |||||
| Family | Yes | 10,488 | 57.8 | — | — |
| No | 7663 | 42.2 | — | — | |
| Friends | Yes | 8486 | 46.8 | — | — |
| No | 9665 | 53.2 | — | — | |
| Workplace/School | Yes | 7448 | 41.0 | — | — |
| No | 10,703 | 59.0 | — | — | |
| Medical workers | Yes | 3603 | 19.9 | — | — |
| No | 14,548 | 80.1 | — | — | |
| Celebrities | Yes | 3847 | 21.2 | — | — |
| No | 14,304 | 78.8 | — | — | |
| Professionals | Yes | 6293 | 34.7 | — | — |
| No | 11,858 | 65.3 | — | — | |
| Government | Yes | 8000 | 44.1 | — | — |
| No | 10,151 | 55.9 | — | — | |
| Academic institution | Yes | 1939 | 10.7 | — | — |
| No | 16,212 | 89.3 | — | — | |
| Video sharing site | Yes | 2952 | 16.3 | — | — |
| No | 15,199 | 83.7 | — | — | |
| LINE | Yes | 3852 | 21.2 | — | — |
| No | 14,299 | 78.8 | — | — | |
| Yes | 2775 | 15.3 | — | — | |
| No | 15,376 | 84.7 | — | — | |
| Yes | 1271 | 7.0 | — | — | |
| No | 16,880 | 93.0 | — | — | |
| Yes | 975 | 5.4 | — | — | |
| No | 17,176 | 94.6 | — | — | |
| News website | Yes | 12,833 | 70.7 | — | — |
| No | 5318 | 29.3 | — | — | |
| Newspaper | Yes | 9288 | 51.2 | — | — |
| No | 8863 | 48.8 | — | — | |
| Magazines | Yes | 2202 | 12.1 | — | — |
| No | 15,949 | 87.9 | — | — | |
| Books | Yes | 1234 | 6.8 | — | — |
| No | 16,917 | 93.2 | — | — | |
| TV news | Yes | 15,336 | 84.5 | — | — |
| No | 2815 | 15.5 | — | — | |
| TV tabloid show | Yes | 12,055 | 66.4 | — | — |
| No | 6096 | 33.6 | — | — | |
| Radio | Yes | 3695 | 20.4 | — | — |
| No | 14,456 | 79.6 | — | — | |
| Gender | Male | 9306 | 51.3 | — | — |
| Female | 8845 | 48.7 | — | — | |
| Age | 20–29 | 1963 | 10.8 | — | — |
| 30–39 | 2554 | 14.1 | — | — | |
| 40–49 | 3713 | 20.5 | — | — | |
| 50–59 | 3312 | 18.2 | — | — | |
| 60–69 | 3476 | 19.1 | — | — | |
| 70–79 | 3133 | 17.3 | — | — | |
| Income | Q1 (Lowest) | 3440 | 19.0 | — | — |
| Q2 | 4026 | 22.2 | — | — | |
| Q3 | 3421 | 18.8 | — | — | |
| Q4 (Highest) | 3747 | 20.6 | — | — | |
| Not answered | 3517 | 19.4 | — | — | |
| Education | Junior high school/High school | 5208 | 28.7 | — | — |
| Vocational school/Junior college | 4046 | 22.3 | — | — | |
| University/Graduate-school | 8897 | 49.0 | — | — | |
| Family structure | Living with others | 14,664 | 80.8 | — | — |
| Living alone | 3487 | 19.2 | — | — | |
| Health literacy measured by CCHL | Mean | SD | |||
| 3.5 | 0.7 | — | — | ||
| Wearing a Mask (Yes: %) | Ventilation (Yes: %) | Social Distancing (Yes: %) | Avoiding Crowds (Yes: %) | ||||||
|---|---|---|---|---|---|---|---|---|---|
| 2020 | 2021 | 2020 | 2021 | 2020 | 2021 | 2020 | 2021 | ||
| Information sources | |||||||||
| Family | Yes | 90.3 | 92.5 | 50.5 | 41.7 | 47.9 | 49.4 | 67.1 | 65.4 |
| No | 80.5 | 85.0 | 41.9 | 33.4 | 41.9 | 44.3 | 56.3 | 56.5 | |
| Friends | Yes | 90.3 | 92.3 | 52.0 | 43.0 | 46.1 | 47.9 | 65.8 | 64.1 |
| No | 82.5 | 86.7 | 42.4 | 33.9 | 44.7 | 46.6 | 59.7 | 59.5 | |
| Workplace/School | Yes | 88.7 | 90.8 | 48.6 | 42.0 | 42.8 | 44.8 | 62.2 | 61.1 |
| No | 84.4 | 88.3 | 45.7 | 35.5 | 47.1 | 48.9 | 62.9 | 62.0 | |
| Medical workers | Yes | 90.0 | 91.3 | 56.2 | 47.5 | 55.2 | 55.8 | 70.9 | 69.0 |
| No | 85.2 | 88.9 | 44.6 | 35.9 | 42.9 | 45.1 | 60.5 | 59.8 | |
| Celebrities | Yes | 90.3 | 92.0 | 52.8 | 43.7 | 48.7 | 49.1 | 66.1 | 63.8 |
| No | 85.1 | 88.7 | 45.3 | 36.7 | 44.5 | 46.7 | 61.6 | 61.0 | |
| Professionals | Yes | 92.3 | 93.8 | 53.7 | 43.2 | 50.3 | 51.6 | 69.2 | 67.1 |
| No | 82.9 | 87.0 | 43.3 | 35.5 | 42.7 | 44.9 | 59.0 | 58.7 | |
| Government | Yes | 91.8 | 93.5 | 52.2 | 42.9 | 50.1 | 51.8 | 68.7 | 67.3 |
| No | 81.7 | 86.1 | 42.7 | 34.4 | 41.6 | 43.6 | 57.8 | 57.2 | |
| Academic institution | Yes | 87.6 | 89.1 | 54.9 | 47.5 | 54.1 | 54.6 | 67.5 | 66.9 |
| No | 86.0 | 89.4 | 45.9 | 37.1 | 44.3 | 46.3 | 62.0 | 61.0 | |
| Video sharing site | Yes | 88.1 | 89.4 | 52.3 | 44.3 | 50.3 | 50.6 | 65.6 | 64.3 |
| No | 85.8 | 89.3 | 45.9 | 37.0 | 44.4 | 46.6 | 62.0 | 61.1 | |
| LINE | Yes | 89.6 | 91.1 | 53.5 | 45.5 | 48.6 | 49.4 | 65.9 | 64.1 |
| No | 85.3 | 88.9 | 45.1 | 36.2 | 44.5 | 46.6 | 61.7 | 61.0 | |
| Yes | 86.6 | 87.7 | 50.4 | 44.4 | 46.3 | 47.5 | 61.1 | 60.9 | |
| No | 86.1 | 89.7 | 46.3 | 37.0 | 45.2 | 47.2 | 62.8 | 61.8 | |
| Yes | 82.7 | 85.8 | 52.7 | 45.9 | 48.9 | 48.5 | 60.4 | 60.0 | |
| No | 86.4 | 89.6 | 46.5 | 37.6 | 45.1 | 47.1 | 62.7 | 61.8 | |
| Yes | 81.0 | 82.3 | 55.4 | 51.1 | 49.4 | 49.3 | 60.6 | 61.9 | |
| No | 86.5 | 89.8 | 46.4 | 37.4 | 45.1 | 47.1 | 62.7 | 61.6 | |
| News website | Yes | 90.2 | 92.7 | 48.7 | 39.4 | 46.7 | 48.3 | 65.4 | 63.8 |
| No | 76.5 | 81.4 | 42.7 | 35.2 | 42.1 | 44.7 | 55.8 | 56.5 | |
| Newspaper | Yes | 90.3 | 92.5 | 49.8 | 38.7 | 48.4 | 50.2 | 65.7 | 64.5 |
| No | 81.9 | 86.0 | 43.9 | 37.6 | 42.2 | 44.1 | 59.3 | 58.6 | |
| Magazines | Yes | 88.4 | 89.7 | 53.5 | 46.1 | 52.8 | 53.7 | 65.8 | 64.5 |
| No | 85.9 | 89.3 | 46.0 | 37.1 | 44.3 | 46.3 | 62.1 | 61.2 | |
| Books | Yes | 84.6 | 86.4 | 57.1 | 49.8 | 57.3 | 57.9 | 66.5 | 66.1 |
| No | 86.3 | 89.6 | 46.2 | 37.3 | 44.5 | 46.4 | 62.3 | 61.3 | |
| TV news | Yes | 90.0 | 92.4 | 48.1 | 38.6 | 46.7 | 48.5 | 65.2 | 64.0 |
| No | 65.6 | 73.0 | 40.4 | 35.9 | 37.8 | 40.2 | 48.0 | 48.6 | |
| TV tabloid show | Yes | 90.7 | 92.8 | 48.4 | 38.5 | 47.1 | 48.7 | 65.6 | 64.8 |
| No | 77.3 | 82.5 | 44.0 | 37.4 | 42.0 | 44.3 | 56.5 | 55.4 | |
| Radio | Yes | 88.7 | 90.9 | 52.9 | 41.1 | 51.5 | 52.1 | 67.3 | 64.9 |
| No | 85.5 | 89.0 | 45.4 | 37.4 | 43.8 | 46.0 | 61.4 | 60.8 | |
| Gender | |||||||||
| Male | 79.7 | 84.8 | 38.2 | 30.9 | 40.9 | 43.5 | 56.3 | 55.6 | |
| Female | 93.0 | 94.1 | 56.1 | 45.6 | 50.0 | 51.1 | 69.1 | 68.0 | |
| Age | |||||||||
| 20–29 | 75.4 | 76.5 | 42.9 | 39.4 | 36.5 | 37.0 | 52.2 | 51.1 | |
| 30–39 | 81.6 | 85.3 | 44.4 | 40.3 | 37.1 | 40.2 | 57.1 | 56.9 | |
| 40–49 | 85.3 | 89.1 | 46.6 | 39.5 | 41.8 | 44.6 | 59.4 | 60.0 | |
| 50–59 | 87.9 | 91.9 | 47.7 | 38.9 | 46.5 | 47.9 | 62.1 | 60.3 | |
| 60–69 | 90.5 | 93.6 | 46.1 | 35.4 | 51.8 | 53.5 | 67.4 | 65.9 | |
| 70–79 | 91.1 | 93.6 | 51.8 | 36.4 | 53.4 | 54.6 | 72.4 | 70.8 | |
| Income | |||||||||
| Q1 (Lowest) | 84.8 | 87.6 | 47.7 | 36.2 | 45.0 | 46.6 | 62.0 | 61.5 | |
| Q2 | 88.0 | 91.1 | 46.9 | 38.1 | 45.0 | 47.1 | 63.9 | 62.9 | |
| Q3 | 84.7 | 88.7 | 44.3 | 36.2 | 41.0 | 44.0 | 60.5 | 59.0 | |
| Q4 (Highest) | 86.0 | 89.1 | 45.1 | 39.1 | 46.2 | 47.1 | 60.3 | 60.4 | |
| Not answered | 87.0 | 90.0 | 50.6 | 41.1 | 49.4 | 51.2 | 64.9 | 64.2 | |
| Education | |||||||||
| Junior high school/High school | 86.5 | 89.6 | 47.2 | 36.1 | 44.5 | 46.8 | 61.7 | 61.7 | |
| Vocational school/Junior college | 89.5 | 92.1 | 52.9 | 44.1 | 47.4 | 50.2 | 66.3 | 66.0 | |
| University/Graduate-school | 84.5 | 88.0 | 44.0 | 36.7 | 45.0 | 46.1 | 61.2 | 59.6 | |
| Family structure | |||||||||
| Living with others | 87.2 | 90.3 | 47.3 | 39.0 | 46.4 | 48.4 | 63.8 | 63.0 | |
| Living alone | 81.9 | 85.5 | 45.1 | 34.5 | 41.0 | 42.3 | 57.5 | 56.0 | |
| Health literacy measured by CCHL (Rounded) | |||||||||
| 1 | 69.6 | 75.9 | 44.8 | 36.3 | 44.4 | 45.9 | 54.1 | 54.1 | |
| 2 | 81.9 | 83.4 | 45.5 | 37.7 | 39.5 | 42.8 | 58.3 | 55.7 | |
| 3 | 80.8 | 85.2 | 43.2 | 36.3 | 40.8 | 42.9 | 57.3 | 56.6 | |
| 4 | 91.5 | 93.9 | 49.2 | 38.9 | 48.9 | 50.5 | 66.9 | 66.2 | |
| 5 | 91.9 | 93.2 | 60.5 | 49.1 | 60.0 | 60.4 | 74.5 | 71.8 | |
| Absolute Difference in % [95%CI] † | Wearing a Mask | Ventilation | Social Distancing | Avoiding Crowds | ||||
|---|---|---|---|---|---|---|---|---|
| Model 1 ‡ | Model 2 § | Model 1 ‡ | Model 2 § | Model 1 ‡ | Model 2 § | Model 1 ‡ | Model 2 § | |
| Time (2020→2021) | 1.8 [−0.6, 4.2] | 1.8 [−0.6, 4.2] | −9.3 [−11.2, −7.5] *** | −9.3 [−11.2, −7.5] *** | 3.0 [1.2, 4.8] ** | 3.0 [1.2, 4.8] ** | −1.2 [−3.7, 1.2] | −1.2 [−3.7, 1.2] |
| People/institution | ||||||||
| Family | 5.3 [2.5, 8.1] *** | 1.9 [−1.4, 4.2] | 6.0 [3.0, 9.1] *** | 2.4 [−1.8, 6.6] | 1.5 [−1.5, 4.4] | 1.4 [−2.9, 5.6] | 8.1 [5.3, 10.9] *** | 6.7 [2.7, 10.7] ** |
| Friends | 5.4 [2.9, 7.9] *** | 1.8 [−0.5, 4.1] | 6.4 [3.1, 9.6] *** | 2.1 [−2.1, 6.3] | −0.7 [−3.6, 2.2] | −3.7 [−7.7, 0.2] | 4.2 [1.3, 7.0] ** | −0.9 [−4.6, 2.8] |
| Workplace/School | 6.7 [3.8, 9.6] *** | 4.4 [1.7, 7.2] ** | 4.9 [2.0, 7.8] ** | 0.2 [−3.1, 3.4] | 0.3 [−2.4, 2.9] | −1.7 [−4.8, 1.3] | 3.7 [0.8, 6.6] * | −0.5 [−3.7, 2.7] |
| Medical workers | 2.0 [−1.6, 5.6] | −1.0 [−3.5, 1.4] | 9.6 [4.7, 14.5] *** | 5.9 [1.2, 10.6] * | 11.2 [7.1, 15.4] *** | 10.8 [6.3, 15.2] *** | 6.5 [2.2, 10.7] ** | 3.7 [−0.5, 7.8] |
| Celebrities | 2.1 [−1.4, 5.7] | −2.7 [−6.2, 0.8] | 7.0 [3.2, 10.9] *** | 0.8 [−3.8, 5.3] | 1.9 [−1.2, 5.1] | −2.2 [−6.4, 2.0] | 1.6 [−1.8, 5.0] | −4.7 [−9.0, −0.3] ** |
| Professionals | 6.6 [4.6, 8.6] *** | 5.7 [2.1, 9.3] ** | 8.6 [4.8, 12.4] *** | 5.0 [0.1, 10.0] * | 4.8 [1.2, 8.4] ** | 3.0 [−1.7, 7.7] | 6.8 [3.3, 10.2] *** | 4.7 [−0.1, 9.4] |
| Government | 5.5 [2.4, 8.7] ** | 3.9 [1.3, 6.5] ** | 5.3 [2.0, 8.6] ** | 1.0 [−2.6, 4.5] | 5.1 [1.9, 8.3] ** | 2.9 [−0.4, 6.3] | 8.9 [5.4, 12.4] *** | 6.7 [3.4, 9.9] *** |
| Academic institution | −1.3 [−7.8, 5.2] | −5.5 [−11.0, 0.0] | 9.4 [1.9, 16.9] * | 4.2 [−3.3, 11.7] | 7.8 [0.2, 15.4] * | 3.8 [−4.3, 11.8] | 4.8 [−1.0, 10.6] | −0.3 [−6.1, 5.5] |
| Media | ||||||||
| Video sharing site | 4.1 [1.8, 6.4] ** | 2.4 [−0.6, 4.2] | 6.3 [2.3, 10.3] ** | 2.9 [−0.7, 6.6] | 5.4 [1.6, 9.2] ** | 4.5 [0.7, 8.3] * | 4.4 [0.4, 8.3] * | 2.4 [−1.4, 6.2] |
| LINE | 3.7 [0.7, 6.8] * | 1.6 [−0.7, 4.0] | 4.4 [0.6, 8.1] * | 0.9 [−2.3, 4.2] | 2.2 [−0.9, 5.2] | −0.2 [−2.9, 2.6] | 1.9 [−1.6, 5.5] | −1.4 [−4.6, 1.8] |
| 4.1 [−0.6, 8.7] | 3.8 [0.6, 7.0] * | 7.6 [3.5, 11.6] *** | 4.7 [1.0, 8.3] * | 6.3 [2.8, 9.9] *** | 6.4 [3.0, 9.8] *** | 3.5 [−0.9, 7.9] | 1.3 [−3.9, 6.5] | |
| −2.6 [−9.0, 3.7] | 0.9 [−6.4, 8.3] | 2.1 [−5.3, 9.5] | −3.3 [−10.8, 4.1] | −1.6 [−6.7, 3.5] | −6.8 [−12.2, −1.3] * | 0.4 [−6.7, 7.6] | −0.3 [−8.3, 7.6] | |
| −10.9 [−19.7, −2.0] * | −18.9 [−28.8, −8.9] *** | 2.6 [−3.0, 8.1] | −3.8 [−11.2, 3.6] | −0.5 [−5.9, 4.8] | −5.4 [−12.1, 1.3] | −0.6 [−8.6, 7.5] | −5.0 [−14.9, 4.8] | |
| News website | 11.7 [8.5, 14.8] *** | 7.3 [5.1, 9.5] *** | 7.2 [3.2, 11.1] *** | 5.5 [1.5, 9.5] * | −0.1 [−3.3, 3.2] | −2.5 [−6.2, 1.2] | 8.3 [5.0, 11.6] *** | 5.5 [2.1, 8.8] ** |
| Newspaper | 6.3 [3.5, 9.1] *** | 3.1 [0.9, 5.3] * | 0.7 [−2.2, 3.7] | −2.8 [−5.9, −0.3] * | 2.6 [−0.7, 5.9] | 0.6 [−2.8, 3.9] | 3.3 [−0.4, 7.0] | 0.2 [−3.2, 3.6] |
| Magazines | 0.7 [−4.3, 5.7] | −4.5 [−10.6, 1.6] | 9.0 [2.1, 15.8] * | 5.5 [−2.7, 13.6] | 9.1 [3.6, 14.7] ** | 6.4 [0.1, 12.6] * | 5.3 [0.1, 10.4] * | 2.4 [−4.4, 9.1] |
| Books | 1.7 [−2.1, 5.6] | 4.5 [−2.4, 11.4] | 8.0 [−1.2, 17.2] | 1.3 [−9.0, 11.6] | 9.7 [2.1, 17.4] * | 5.6 [−2.2, 13.5] | 3.8 [−3.9, 11.5] | 0.8 [−7.9, 9.4] |
| TV news | 17.9 [13.6, 22.3] *** | 12.3 [8.2, 16.3] *** | 3.3 [−0.4, 7.0] | −0.5 [−5.2, 4.2] | 2.1 [−0.9, 5.1] | 1.7 [−2.8, 6.1] | 10.4 [6.2, 14.5] *** | 5.6 [0.4, 10.7] * |
| TV tabloid show | 9.1 [5.9, 12.4] *** | 2.3 [−0.4, 5.0] | 2.8 [−0.9, 6.4] | −0.3 [−4.8, 4.2] | 1.3 [−2.6, 5.1] | −0.6 [−5.6, 4.3] | 6.7 [3.0, 10.3] *** | 2.4 [−1.9, 6.7] |
| Radio | 3.7 [1.4, 5.9] ** | 1.0 [−1.4, 3.3] | 9.3 [5.0, 13.6] *** | 7.8 [3.7, 11.8] *** | 4.3 [0.0, 8.7] | 2.0 [−2.3, 6.4] | 4.7 [1.0, 8.5] * | 2.5 [−0.6, 5.7] |
Publisher’s Note: MDPI stays neutral with regard to jurisdictional claims in published maps and institutional affiliations. |
© 2022 by the authors. Licensee MDPI, Basel, Switzerland. This article is an open access article distributed under the terms and conditions of the Creative Commons Attribution (CC BY) license (https://creativecommons.org/licenses/by/4.0/).
Share and Cite
Kusama, T.; Kiuchi, S.; Takeuchi, K.; Ikeda, T.; Nakazawa, N.; Kinugawa, A.; Osaka, K.; Tabuchi, T. Information Usage and Compliance with Preventive Behaviors for COVID-19: A Longitudinal Study with Data from the JACSIS 2020/JASTIS 2021. Healthcare 2022, 10, 521. https://doi.org/10.3390/healthcare10030521
Kusama T, Kiuchi S, Takeuchi K, Ikeda T, Nakazawa N, Kinugawa A, Osaka K, Tabuchi T. Information Usage and Compliance with Preventive Behaviors for COVID-19: A Longitudinal Study with Data from the JACSIS 2020/JASTIS 2021. Healthcare. 2022; 10(3):521. https://doi.org/10.3390/healthcare10030521
Chicago/Turabian StyleKusama, Taro, Sakura Kiuchi, Kenji Takeuchi, Takaaki Ikeda, Noriko Nakazawa, Anna Kinugawa, Ken Osaka, and Takahiro Tabuchi. 2022. "Information Usage and Compliance with Preventive Behaviors for COVID-19: A Longitudinal Study with Data from the JACSIS 2020/JASTIS 2021" Healthcare 10, no. 3: 521. https://doi.org/10.3390/healthcare10030521
APA StyleKusama, T., Kiuchi, S., Takeuchi, K., Ikeda, T., Nakazawa, N., Kinugawa, A., Osaka, K., & Tabuchi, T. (2022). Information Usage and Compliance with Preventive Behaviors for COVID-19: A Longitudinal Study with Data from the JACSIS 2020/JASTIS 2021. Healthcare, 10(3), 521. https://doi.org/10.3390/healthcare10030521