1. Introduction
A number of different countries have used bundled payments as a form of health care payment [
1,
2,
3,
4,
5]. In the US, one of the largest national efforts to date has been the Bundled Payments for Care Improvement (BPCI) Initiative, a five-year program that engaged over 1000 organizations to accept bundled payments via participation options (called “models”) for up to 48 different clinical episodes [
6]. This program was implemented within Medicare, the national public insurance scheme for older Americans (65 years of age and older) and those with certain disabilities (e.g., end stage renal disease).
Participation in Medicare’s BPCI program was the highest for Model 2, in which bundles were defined for episodes spanning from hospitalization for a given condition or procedure through up to 90 days of post-discharge care. Traditionally (i.e., outside of the BPCI program context), hospital and post-discharge services in the US have been paid separately, with no designated accountable clinical groups or entities for episode spending quality or spending.
BPCI sought to change these dynamics by designating participating hospitals as accountable entities for total spending and quality outcomes across the episode of care. In exchange for accepting this accountability, participating hospitals were eligible for additional financial bonuses or penalties based on their ability to maintain or improve quality, as well as contain spending compared to historical amounts. Ultimately, the goal of BPCI was to increase the value of care by containing health care spending while maintaining or improving the quality of care.
Hospital participation in BPCI has been associated with stable quality and cost savings driven by shorter length of stay at skilled nursing facilities (SNFs) among patients hospitalized for common medical conditions [
7]. However, it remains unknown how the changes that hospitals implemented under BPCI may have affected patients that are at high-risk for poor outcomes due to clinical risk factors.
It Is important to understand how high-risk patients fared in medical condition episodes. Patients may be excluded from bundled payment-driven care redesign because of clinical risk factors such as frailty or advanced age. Conversely, bundled payment participants may seek greater opportunities for financial savings by targeting high-risk groups as those with larger care process improvement opportunities. In the absence of exclusion or targeting, indiscriminate use of certain strategies across all patients (e.g., reducing SNF length of stay) may not meet the needs of high-risk patients and could also create harm (e.g., increased readmissions).
Despite these potential dynamics, unfortunately little is known about how high-risk patients were affected by BPCI-driven practice redesign for medical condition episodes. Only one study has evaluated clinically high-risk patients in the program, finding that it did not appear to adversely affect outcomes among individuals with dementia and prior institutional care [
8]. However, while somewhat reassuring, that study did not compare how high-risk and non-risk patients fared with respect to each other, i.e., whether care patterns or outcomes changed differentially for high-risk and non-high-risk patients under bundled payments.
Evaluating these relationships is critical for understanding the practice and policy benefits of bundled payments—particularly amid other ongoing programs in the US and beyond [
9]. Therefore, to address these knowledge gaps, we evaluated changes in care patterns and outcomes for high-risk versus non-high risk patients admitted to BPCI participant hospitals for medical condition episodes.
2. Methods
2.1. Data & Study Sample
Publicly available data from the Centers for Medicare and Medicaid Services (CMS) were used to identify hospital enrollment in BPCI Model 2. 100% 2011–2016 Medicare claims data were used for patients hospitalized at hospitals participating in BPCI Model 2 for one of four medical condition episodes: chronic obstructive pulmonary disease (COPD), pneumonia, acute myocardial infarction (AMI), and congestive heart failure (CHF). A 20% 2011–2016 random national sample of Medicare claims data was used for patients hospitalized at non-participant hospitals.
Hospital characteristics were obtained from American Hospital Association Annual Survey data, while market and additional hospital characteristics were obtained through data from the Medicare Provider of Service, Beneficiary Summary, and Accountable Care Organization (ACO) files. The Medicare Provider Enrollment, Chain, and Ownership System file was used to identify BPCI episodes from physician group practice participants. Markets were defined using hospital referral regions drawn from the Dartmouth Atlas.
The study sample Ided Medicare fee-for-service beneficiaries admitted to hospitals for any of the four episodes of interest. Episode types were identified based on Medicare Severity-Diagnosis Related Group (MS-DRG) codes as set forth in BPCI program rules: 280–282 for AMI; 291–293 for CHF; 190–192, 202, and 203 for COPD; and 177–179 and 193–195 for pneumonia. Beneficiaries with end stage renal disease or insurance coverage through Medicare Advantage were excluded, as were beneficiaries who died during the index hospital admission, or lacked continuous primary Medicare fee-for-service coverage either during the episode or in the 12 months preceding the beginning of it.
2.2. Study Period
The study period ranged from 1 January 2011 through 31 December 2016. This period was separated into a pre-bundled payment period (January 2011–September 2013) prior to the start of BPCI and a bundled payment period (October 2013–December 2016).
2.3. Hospitals
Hospitals participating in BPCI Model 2 during the study period for any of the four episodes of interest were defined as BPCI hospitals. This designation was time-varying, reflecting hospital-condition level entry into or exit from BPCI over time. Once hospitals began BPCI participation for a given episode type, all subsequent episodes considered to be in BPCI hospital group regardless of any subsequent program dropout.
Non-BPCI hospitals were defined as those that (a) never participated in the program across the study and (b) were also located in markets—as defined by hospital referral regions—with no BPCI hospitals across the study period [
10]. This approach for defining non-BPCI hospitals was used in order to minimize potential bias arising from BPCI entry and exit over time and unobservable changes at non-BPCI hospitals as a result of “spillover” effects from BPCI hospitals (changes in characteristics of patients receiving care at non-BPCI hospitals due to changes at BPCI hospitals, but that were unobservable from study data). Non-BPCI hospitals with fewer than 10 admissions in the BPCI period for the included medical condition episodes were also excluded.
2.4. Episode Construction
Following prior work and BPCI Model 2 rules, 90-day episodes were constructed beginning with hospital admission and spanned 90 days after hospital discharge. To avoid bias arising from Medicare rules related to precedence—rules for handling how overlapping episodes are assigned to hospitals—this analysis also followed prior methods and constructed naturally occurring episodes by assigning overlapping ones to the earlier hospital admission [
7,
11]. All episodes associated with physician group practice, rather than hospital, BPCI Model 2 participants were removed.
2.5. High-Risk Patient Groups
Five high-risk patient groups were used in this analysis: advanced age (patients over the age of 85 years), high case-mix (defined as individuals in the top quintile of Elixhauser mortality scores among patients nationwide), disabled, frail (based on diagnoses from claims data), and prior institutional post-acute care provider utilization (inpatient rehabilitation facilities [IRFs] and SNFs) [
12,
13].
2.6. Variables
Study exposures corresponded to the five high-risk patient groups. In particular, for each group, the exposure was the interaction between membership in that high-risk group and hospitalization at a BPCI hospital. The analysis used a time-varying indicator of BPCI participation by defining it as 1 for episodes occurring during the BPCI period at BPCI hospitals after they started participation, and 0 otherwise. This design reflected the time-varying nature of BPCI participation.
There were two pre-specified primary outcomes: SNF length of stay measured in days, meant to reflect the care redesign driven by BPCI Model 2 for medical condition episodes1; and 90-day unplanned readmission rate, meant to capture potential unintended harms of SNF length of stay reductions. Secondary outcomes included 90-day post-discharge mortality rate, 90-day post-discharge spending standardized and adjusted to 2016 dollars, and several measures of post-acute care utilization: discharge to institutional post-acute care providers (SNFs or IRFs), discharge home with home health agency (HHA) services).
Based on prior studies, covariates were included at the patient-level, such as age, sex, Elixhauser comorbidities, and market-level, such as population size and Medicare Advantage penetration [
14,
15,
16,
17,
18].
2.7. Statistical Analysis
Following prior studies, for each of the four episode types, propensity scores with replacement were used to match BPCI hospitals and non-BPCI hospitals using hospital and market characteristics from 2011 (
Supplementary Methods) [
16,
19]. Each BPCI hospital was allowed to be matched with up to 3 non-BPCI hospitals, within a caliper of 0.2 of the standard deviation of the log-odds propensity score [
20]. Characteristics of propensity-matched BPCI and non-BPCI hospitals were compared using standardized differences of means and proportions [
21].
Adjusted analyses were conducted using a series of difference-in-differences (DID) generalized linear models with identity links and normal distributions to evaluate the relationship between BPCI participation and medical condition episode outcomes. An interaction term between an indicator of membership in each high-risk group and the time-varying BPCI participation term was used to examine differential changes in outcomes for high-risk versus non-high-risk patients. All models included hospital, MS-DRG, and time (quarter-year) fixed effects and controlled for patient and time-varying hospital and market characteristics, with standard errors clustered at the hospital level. These variables and models were applied to data from the baseline period to examine consistency with the parallel trends assumption. Wald tests did not indicate divergent baseline period trends in outcomes (
Table S1).
We tested the robustness of main analysis findings. via a “stayers only” sensitivity analysis in which we compared outcomes between BPCI hospitals that stayed in the program through the end of the study period (2016 Quarter 3) and propensity-matched non-BPCI hospitals. Statistical tests were two-tailed and considered significant at alpha = 0.05 for the primary outcome. All analyses were conducted using SAS (version 9.4, SAS Institute, Inc., Cary, NC, USA).
The University of PennsylIania Institutional Review Board approved this study with a waiver of informed consent.
3. Results
The study sample consisted of 471,421 patients hospitalized at 226 BPCI and 700 propensity-matched non-BPCI Hospitals. BPCI and non-BPCI hospitals differed with respect to in hospital, market, and episode characteristics at the start of the pre-bundled payment period (
Table 1 and
Table S2). Compared to non-BPCI hospitals, BPCI hospitals tended to be larger, non-profit, teaching hospitals located in urban areas and markets with larger populations and smaller proportions of low-income individuals.
Differences between hospital groups decreased after propensity score matching, with standardized mean differences less than or equal to 0.2 for all variables with the exception of geographic distribution, which had a post-match standardized difference of 0.6 and was not included in the propensity matching model (
Supplementary Methods). Medicare Advantage and accountable care organization penetration tended to be higher in markets with BPCI hospitals than markets without any BPCI hospitals.
Some patient characteristics differed between BPCI versus non-BPCI hospitals (
Table 2). Compared to those admitted to non-BPCI hospitals, more patients admitted to BPCI hospitals had advanced age and prior IRF/SNF utilization and fewer were disabled. In contrast, the average age, and gender distribution were similar for patients admitted to BPCI versus non-BPCI hospitals. The proportion of patients in other high-risk groups were comparable between the two hospital groups.
3.1. Primary Outcomes
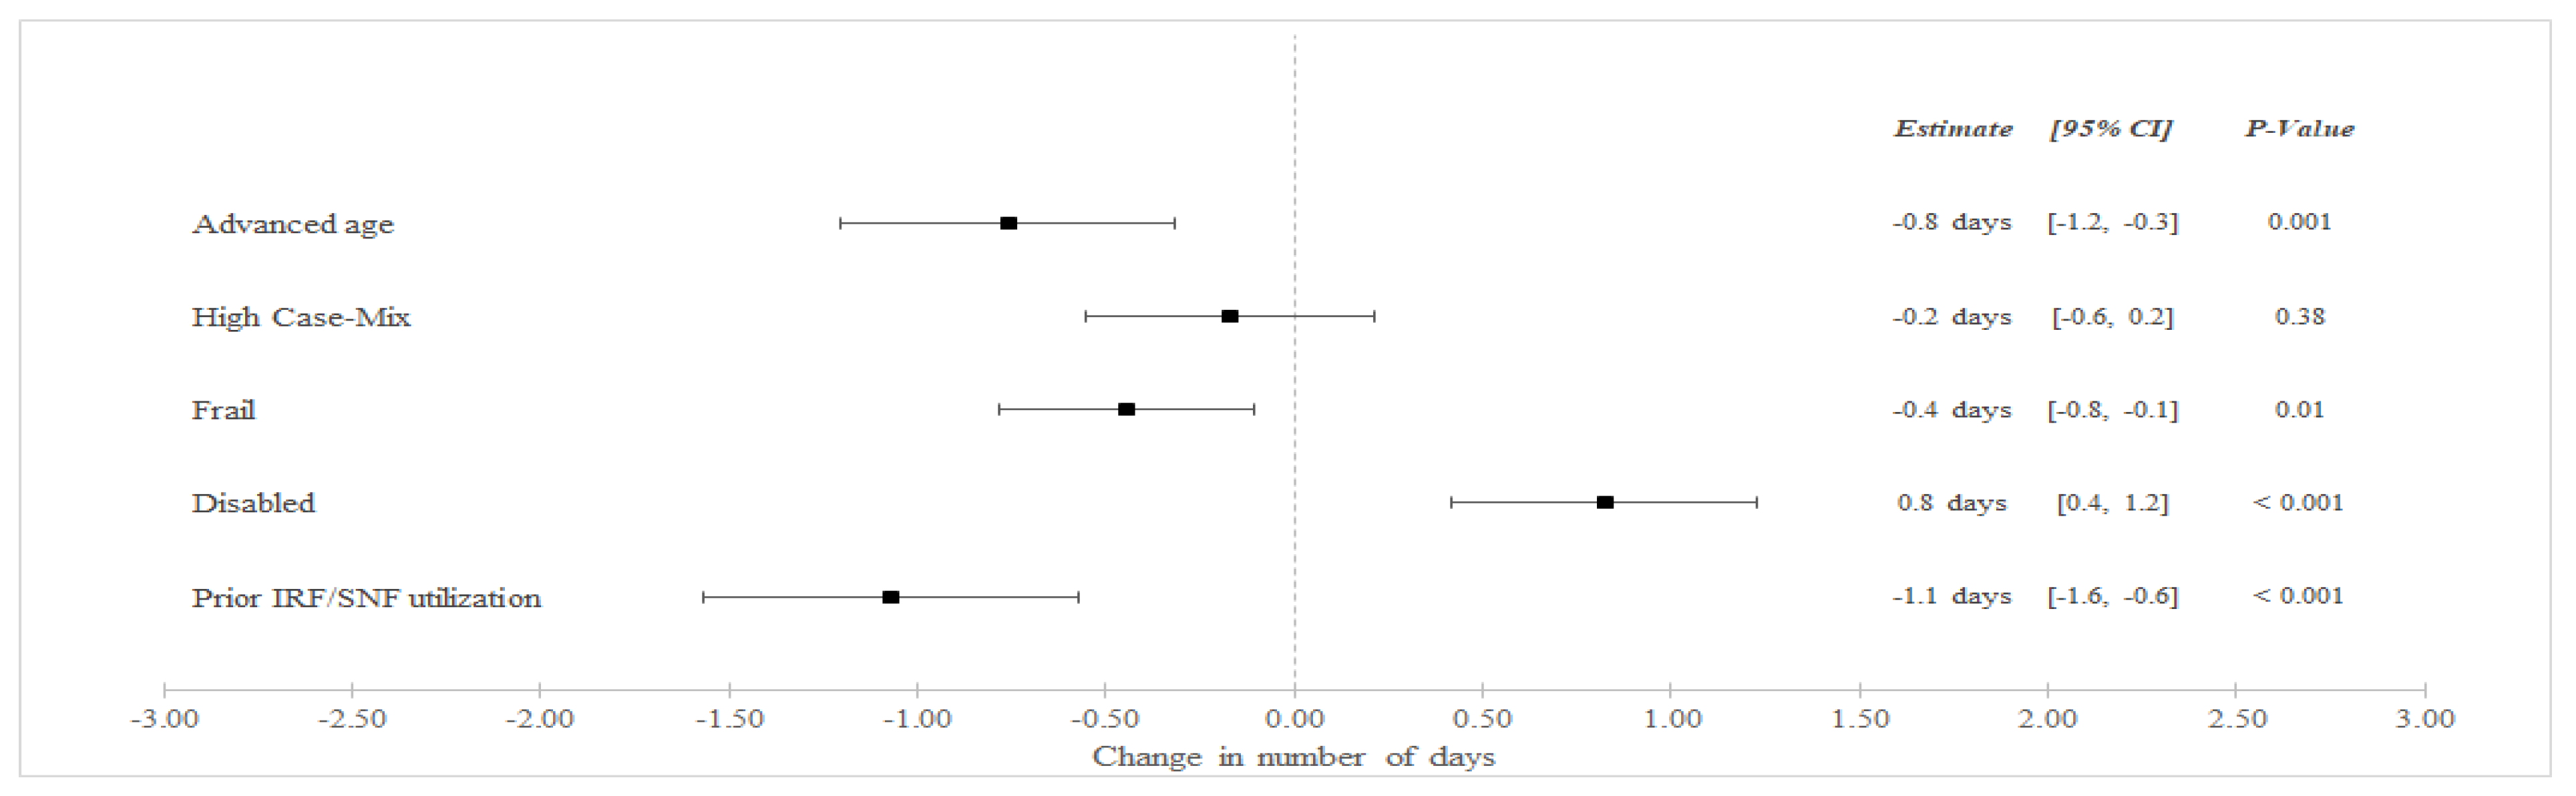
In unadjusted analyses (
Table 3), SNF LOS decreased among BPCI hospitals from an average of 8.9 days in the pre-bundled payment period to 8.4 in the bundled payment but increased among non-BPCI Hospitals from an average of 7.6 to 7.8 days between the pre-bundled payment and bundled payment periods, respectively. In adjusted difference-in-differences (aDID) analysis (
Figure 1), BPCI participation was associated with a differentially lower in SNF LOS among frail patients (aDID −0.4 days versus non-frail patients, 95% CI −0.8 to −0.1 days,
p = 0.01), patients with advanced age (aDID −0.8 days versus younger patients, 95% CI −1.2 to −0.3 days,
p = 0.001), and patients with prior SNF/IRF utilization (aDID −1.1 days versus patients without prior utilization, 95% CI −1.6 to −0.6 days,
p < 0.001). BPCI participation was also associated with differentially greater SNF LOS among disabled patients (aDID 0.8 days versus non-disabled patients, 95% CI 0.4 to 1.2 days,
p < 0.001).
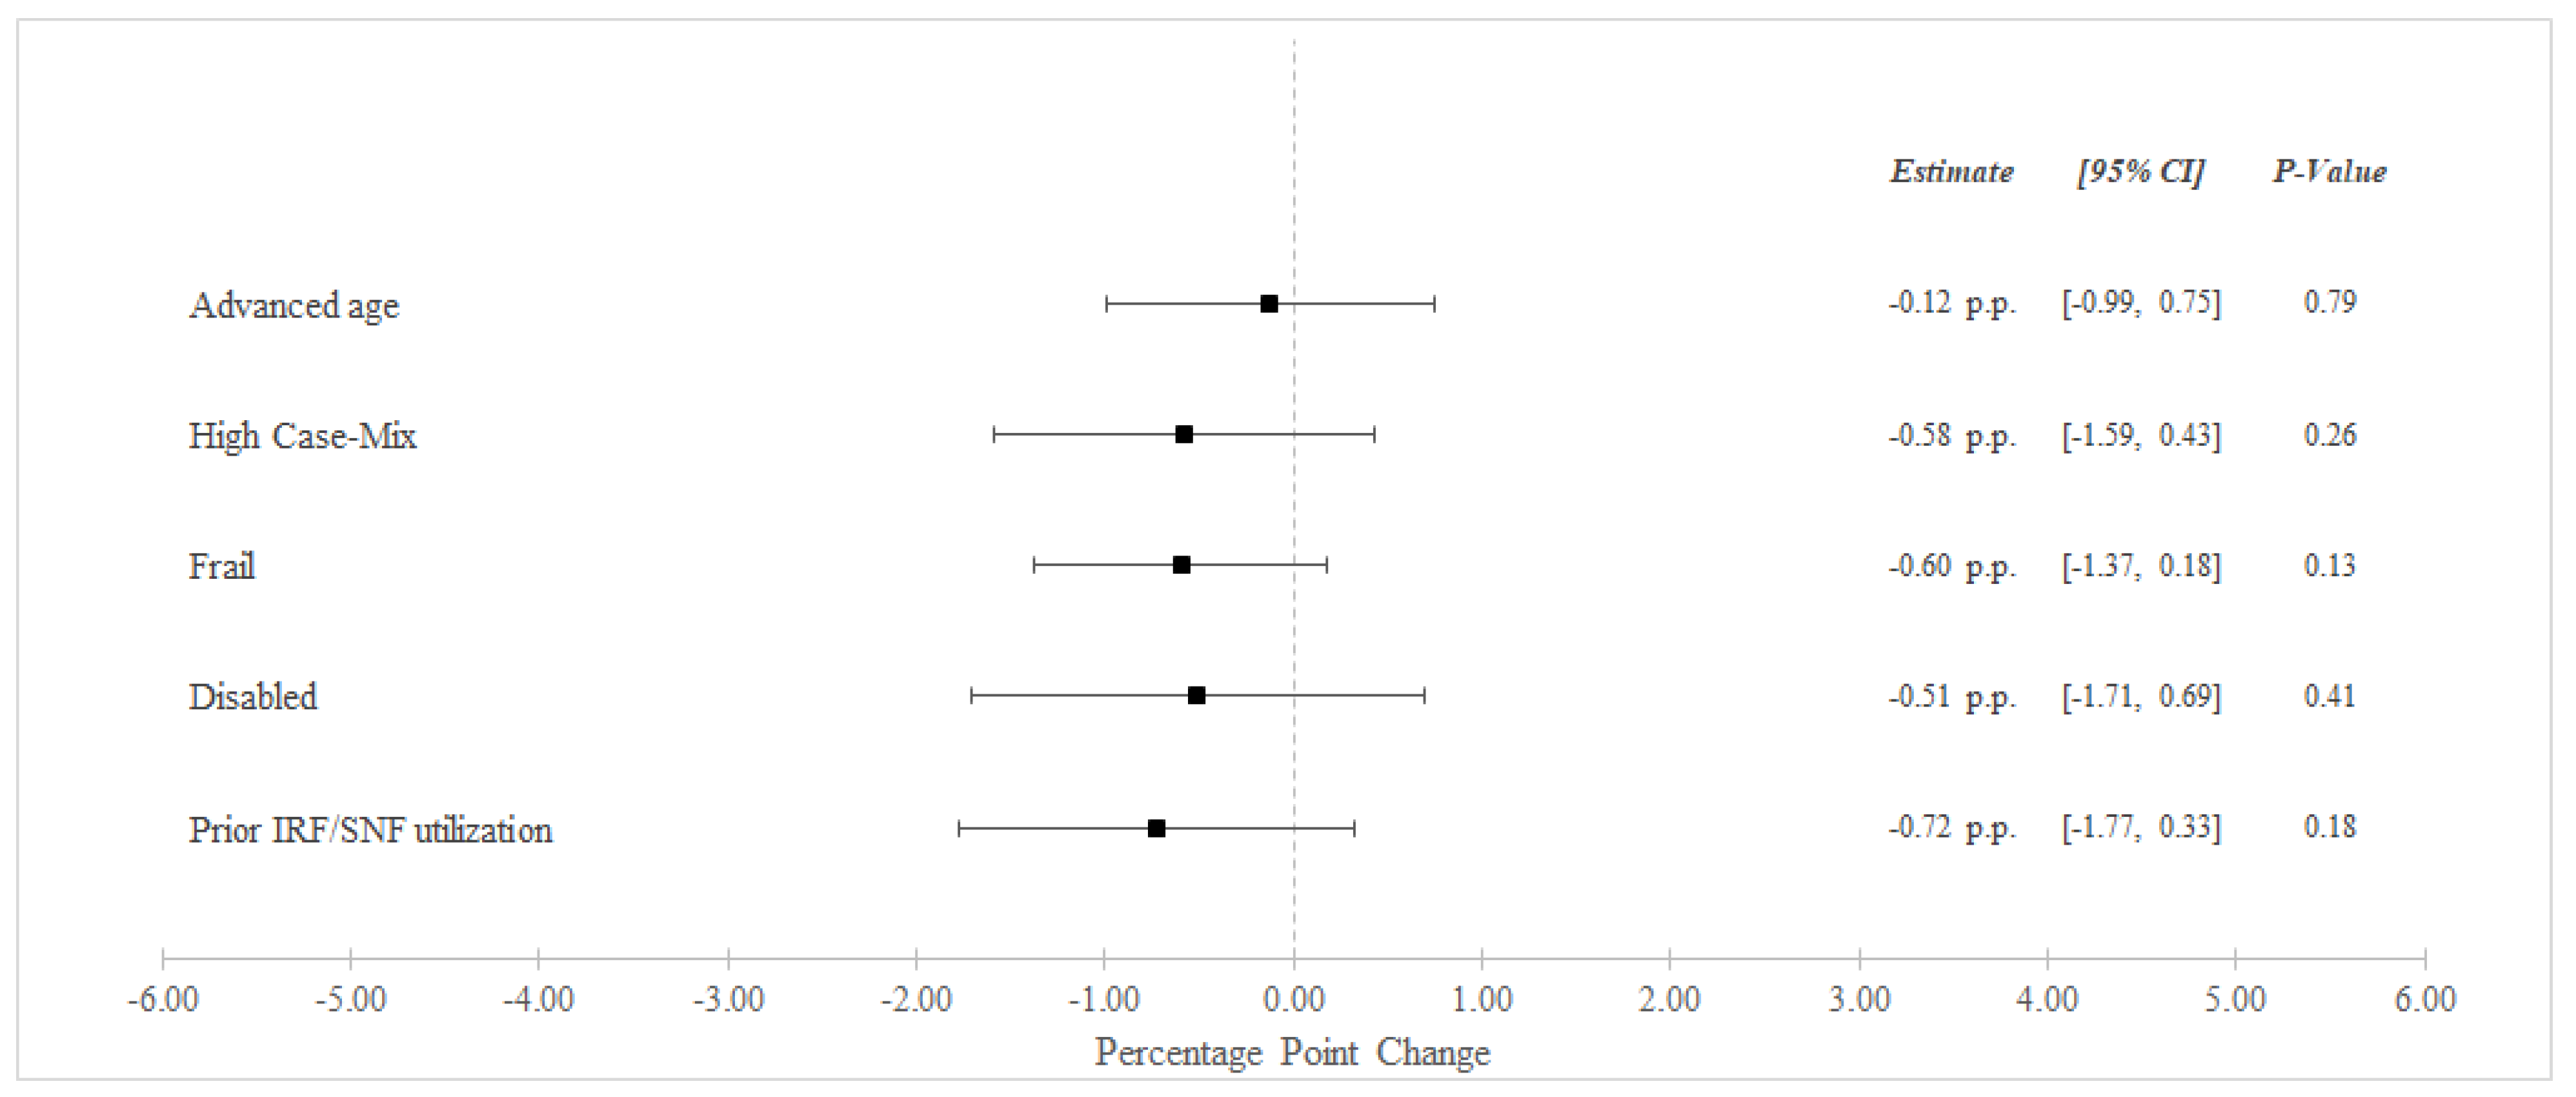
Between the pre-bundled payment and bundled payment periods, unadjusted 90-day readmissions decreased from 31.8% to 30.7% among BPCI Hospitals and from 32.5% to 31.9% among non-BPCI Hospitals (
Table 3). In adjusted analysis, BPCI participation was not associated with differential changes in 90-day readmissions for any high-risk versus non-high risk groups (
Figure 2).
3.2. Secondary Outcomes
In unadjusted analyses, there were changes in secondary outcomes between the pre-bundled payment and bundled payment periods (
Table S3). Differential changes were also observed for some outcomes in adjusted analyses (
Figures S1–S4). In particular, BPCI participation was also associated with differentially lower post-discharge spending for frail patients (aDID −
$401 versus non-frail patients, 95% CI −
$682 to −
$120,
p = 0.01) and patients with prior SNF/IRF utilization (aDID −
$534 versus patients without prior utilization, 95% CI −
$922 to −
$145,
p = 0.01). BPCI participation was associated with differentially lower mortality for disabled patients (aDID −0.66 percentage points [pp] versus non-disabled patients, 95% CI −1.27 to −0.06 pp,
p = 0.03) and differentially greater discharge to SNF/IRF for frail patients (aDID 1.05 pp versus non-frail patients, 95% CI 0.28 to 1.82 pp,
p = 0.01).
3.3. Sensitivity Analyses
Results from sensitivity analyses using hospitals with stayed through the end of the study period (
Figures S5–S10) were qualitatively similar overall to results from the main analyses.
4. Discussion
To our knowledge, this was the first analysis to directly evaluate outcomes for high-risk versus other patients under bundled payments. It demonstrated that hospital participation in bundled payments was associated with differentially greater changes in care patterns and certain outcomes for some clinically high-risk patient groups, including reduced SNF LOS, spending and mortality without increases in unplanned readmissions. This study poses several implications.
First, the analysis provides evidence that some changes of medical condition bundles disproportionately applied to high-risk patients. In particular, both SNF LOS and unplanned readmissions decreased to a greater degree at BPCI versus non-BPCI hospitals among several patient groups, i.e., the gaps in both outcomes narrowed for these patients under bundled payments. While these findings were not uniformly observed across groups, they suggest BPCI participants may have focused on, rather than excluded, some high-risk individuals from bundled payment-driven care redesign.
Second, results from this study offer some reassurance against potentially indiscriminate use of strategies in medical bundles and harms to high-risk individuals. For instance, though SNF length of stay decreased overall for individuals receiving medical condition episode care through BPCI [
7], length of stay was differentially greater for disabled patients—perhaps reflecting that they were protected from quicker, and potentially premature, discharges. Though a well-known strategy in bundled payments has been shifting discharge location away from SNFs or IRFs toward home, this analysis demonstrated that discharge to these institutional PAC providers was differentially greater among frail patients. No high-risk groups exhibited differentially greater readmissions. Though these findings should be further investigated in future work, they are nonetheless reassuring when taken together as policy and practice leaders continue to implement medical bundles.
Third, study findings underscore the need for additional work evaluating how bundled payments and other value-based payment models affect equity among different vulnerable groups. In particular, future studies could build on insights from the variation observed in this analysis and assess how other payment models influence patient access and quality outcomes for clinically high-risk individuals. Such evaluations should be conducted for all payment models to ensure that payment reforms are tool for reducing rather than perpetuating health care disparities [
22].
This analysis has limitations. First, as with all observational analyses, findings are subject to residual confounding. However, the analysis utilized a quasi-experimental methodology that addressed these risks by directly accounting for multiple patient, hospital, and market characteristics and also hospital and quarter-year fixed effects. Second, this analysis evaluated one model within one bundled payment program. However, BPCI Model 2 is a critical model to understand as the direct basis for all subsequent CMS bundled payment programs. Third, while this analysis evaluated multiple aspects of patients’ clinical complexity, individuals may be “high risk” due to a number of social or other clinical determinants. Future work should evaluate different high-risk features under voluntary bundled payments.
Nonetheless, this study suggests that bundled payment strategies were not applied indiscriminately to all patients and were instead associated with differential changes in the care of some high-risk groups. Together, these findings offer insight into how high these groups were affected by medical bundles, help allay concerns about harm, and underscores the need to conduct similar studies for other value-based payment models.
Supplementary Materials
The following supporting information can be downloaded at:
https://www.mdpi.com/article/10.3390/healthcare10122510/s1, Supplementary Methods. Propensity Score Matching. Table S1. Examination of Parallel Trends Assumption in the Pre-Bundled Payment Period. Table S2. Characteristics of Markets with and without BPCI Hospitals (2011–2016). Table S3. Unadjusted Secondary Outcomes for Medical Condition Episodes among High-Risk Patients (2011–2016). Figure S1. Adjusted CIanges in Post-Discharge Spending for Medical Condition Episodes Among High-Risk Patients (2011–2016). Figure S2. Adjusted Changes in 90-Day Mortality Rate† for Medical Condition Episodes Among High-Risk Patients (2011–2016). Figure S3. Adjusted Changes in Discharge to Institutional PAC Providers for Medical Condition Episodes Among High-Risk Patients (2011–2016). Figure S4. Adjusted Changes in Discharge Home with HHA for Medical Condition Episodes Among High-Risk Patients (2011–2016). Figure S5. Adjusted Changes in SNF LOS for Medical Condition Episodes Among High-Risk Patients (2011–2016) Among Stayer-Hospitals Only. Figure S6. Adjusted Changes in 90-Day Unplanned Readmission Rate‡ for Medical Condition Episodes Among High-Risk Patients (2011–2016) Among Stayer-Hospitals Only. Figure S7. Adjusted Changes in Post-Discharge Spending for Medical Condition Episodes Among High-Risk Patients (2011–2016) Among Stayer-Hospitals Only. Figure S8. Adjusted Changes in 90-Day Mortality Rate† for Medical Condition Episodes Among High-Risk Patients (2011–2016) Among Stayer-Hospitals Only. Figure S9. Adjusted Changes in Discharge to Institutional PAC Providers for Medical Condition Episodes Among High-Risk Patients (2011–2016) Among Stayer-Hospitals Only. Figure S10. Adjusted Changes in Discharge Home with HHA for Medical Condition Episodes Among High-Risk Patients (2011–2016) Among Stayer-Hospitals Only. Reference [
23] is cited in the supplementary materials.
Author Contributions
Concept and Design, J.M.L. and A.S.N.; Acquisition, analysis, or interpretation of data, J.M.L., E.W., U.I., J.Z., D.S.C. and A.S.N.; Drafting of manuscript, J.M.L., E.W., D.S.C. and A.S.N.; Critical revision of the manuscript for important intellectual content, J.M.L., E.W., U.I., J.Z., D.S.C. and A.S.N.; Statistical analysis, J.M.L., E.W., J.Z. and A.S.N.; Obtained funding: J.M.L., D.S.C. and A.S.N.; Administrative, technical or material support; J.M.L., U.I., D.S.C. and A.S.N.; Supervision, J.M.L. and A.S.N. All authors have read and agreed to the published version of the manuscript.
Funding
This study was funded in part by the National Institute on Minority Health and Health Disparities (R01MD013859, R01MD015055) and the Agency for Healthcare Research and Quality (R01HS027595). Sponsors did not have any role in the research.
Institutional Review Board Statement
This study was reviewed and approved by the University of Pennsylvania Institutional Review Board under protocols 833439 and 848498.
Informed Consent Statement
Informed consent was waived because only historical data with minimal risk of harm were used.
Data Availability Statement
Data presented in this study are unable to be shared because of identifiability and cell size limitations by The Centers for Medicare & Medicaid Services.
Acknowledgments
This article does not necessarily represent the views of the US government or the Department of Veterans Affairs.
Conflicts of Interest
Liao reports honoraria from Comagine Health, Marcus Evans, and Brown University outside the submitted work. Navathe reports grants from Hawaii Medical Service Association, grants from Commonwealth Fund, grants from Robert Wood Johnson Foundation, grants from Donaghue Foundation, grants from Pennsylvania Department of Health*, grants from the Veterans Affairs Administration*, grants from Ochsner Health System, grants from United Healthcare, grants from Blue Cross Blue Shield of NC, grants from Blue Shield of CA, grants from Humana, personal fees from Navvis Healthcare, personal fees and equity from Navahealth, personal fees from YNHHSC/CORE, personal fees from Maine Health Accountable Care Organization, personal fees from Singapore Ministry of Health, personal fees from Elsevier Press, personal fees from Medicare Payment Advisory Commission, personal fees from Cleveland Clinic, personal fees from Analysis Group, personal fees from VBID Health, personal fees from Advocate Physician Partners, personal fees from the Federal Trade Commission, personal fees from Catholic Health Services Long Island, and equity from Clarify Health, and non-compensated board membership for Integrated Services, Inc. outside the submitted work in the past 3 years.
References
- Ellis, R.P.; Chen, T.; Luscombe, C. Comparisons of Health Insurance Systems in Developed Countries. Boston University Department of Economics Working Paper Series. Encycl. Health Econ. 2014, 1, 1–22. [Google Scholar]
- Struijs, J.N.; Baan, C.A. Integrating Care through Bundled Payments—Lessons from the Netherlands. New Engl. J. Med. 2011, 364, 990–991. [Google Scholar] [CrossRef] [PubMed]
- de Bakker, D.H.; Struijs, J.N.; Baan, C.A.; Raams, J.; de Wildt, J.-E.; Vrijhoef, H.J.M.; Schut, F.T. Early Results From Adoption of Bundled Payment For Diabetes Care In The Netherlands Show Improvement In Care Coordination. Health Aff. 2012, 31, 426–433. [Google Scholar] [CrossRef] [PubMed]
- Pross, C.; Geissler, A.; Busse, R. Measuring, Reporting, and Rewarding Quality of Care in 5 Nations: 5 Policy Levers to Enhance Hospital Quality Accountability. Milbank Q. 2017, 95, 136–183. [Google Scholar] [CrossRef] [PubMed]
- Porter, M.E.; Marks, C.M.; Landman, Z.C. OrthoChoice: Bundled Payments in the County of Stockholm (B). Harv. Bus. Sch. Suppl. 2014, 714–515. [Google Scholar]
- Centers for Medicare & Medicaid Services. Bundled Payments for Care Improvement (BPCI) Initiative: General Information. Available online: https://innovation.cms.gov/initiatives/bundled-payments/ (accessed on 29 November 2022).
- Rolnick, J.A.; Liao, J.M.; Emanuel, E.J.; Huang, Q.; Ma, X.; Shan, E.Z.; Dinh, C.; Zhu, J.; Wang, E.; Cousins, D.; et al. Spending and quality after three years of Medicare’s bundled payments for medical conditions: Quasi-experimental difference-in-differences study. BMJ 2020, 369, m1780. [Google Scholar] [CrossRef]
- Maughan, B.C.; Kahvecioglu, D.C.; Marrufo, G.; Gerding, G.M.; Dennen, S.; Marshall, J.K.; Cooper, D.M.; Kummet, C.M.; Dummit, L.A. Medicare’s Bundled Payments For Care Improvement Initiative Maintained Quality of Care for Vulnerable Patients. Health Aff. 2019, 38, 561–568. [Google Scholar] [CrossRef]
- Centers for Medicare & Medicaid Services. BPCI-Advanced. Available online: https://innovation.cms.gov/innovation-models/bpci-advanced (accessed on 27 August 2021).
- The Dartmouth Atlas. Supplemental Data. Available online: https://data.dartmouthatlas.org/supplemental/ (accessed on 27 August 2021).
- Rolnick, J.A.; Liao, J.M.; Navathe, A.S. Programme design matters—Lessons from bundled payments in the US. Thebmjopinion. 2020. Available online: https://blogs.bmj.com/bmj/2020/06/17/programme-design-matters-lessons-from-bundled-payments-in-the-us/ (accessed on 27 August 2021).
- Kim, D.H.; Schneeweiss, S. Measuring frailty using claims data for pharmacoepidemiologic studies of mortality in older adults: Evidence and recommendations. Pharmacoepidemiol. Drug Saf. 2014, 23, 891–901. [Google Scholar] [CrossRef] [PubMed]
- Joynt, K.E.; Figueroa, J.F.; Beaulieu, N.; Wild, R.C.; Orav, E.J.; Jha, A.K. Segmenting high-cost Medicare patients into potentially actionable cohorts. Healthcare 2017, 5, 62–67. [Google Scholar] [CrossRef] [PubMed]
- Dummit, L.A.; Kahvecioglu, D.; Marrufo, G.; Rajkumar, R.; Marshall, J.; Tan, E.; Press, M.J.; Flood, S.; Muldoon, L.D.; Gu, Q.; et al. Association between hospital participation in a Medicare bundled payment initiative and payments and quality outcomes for lower extremity joint replacement episodes. JAMA 2016, 316, 1267–1278. [Google Scholar] [CrossRef] [PubMed]
- Navathe, A.S.; Liao, J.M.; Dykstra, S.E.; Wang, E.; Lyon, Z.M.; Shah, Y.; Martinez, J.; Small, D.S.; Werner, R.M.; Dinh, C.; et al. Association of hospital participation in a Medicare bundled payment program with volume and case mix of lower extremity joint replacement episodes. JAMA 2018, 320, 901–910. [Google Scholar] [CrossRef] [PubMed]
- Joynt Maddox, K.E.; Orav, E.J.; Zheng, J.; Epstein, A.M. Evaluation of Medicare’s bundled payments initiative for medical conditions. N. Engl. J. Med. 2018, 379, 260–269. [Google Scholar] [CrossRef] [PubMed]
- Navathe, A.S.; Emanuel, E.J.; Venkataramani, A.S.; Huang, Q.; Gupta, A.; Dinh, C.T.; Shan, E.Z.; Small, D.; Coe, N.B.; Wang, E.; et al. Spending and quality after three years of Medicare’s voluntary bundled payment for joint replacement surgery: The spending and quality effects of Medicare’s bundled payments for care improvement initiative among patients undergoing lower extremity joint-replacement. Health Aff. 2020, 39, 58–66. [Google Scholar]
- Liao, J.M.; Emanuel, E.J.; Venkataramani, A.S.; Huang, Q.; Dinh, C.T.; Shan, E.Z.; Wang, E.; Zhu, J.; Cousins, D.S.; Navathe, A.S. Association of bundled payments for joint replacement surgery and patient outcomes with simultaneous hospital participation in accountable care organizations. JAMA Netw Open 2019, 2, e1912270. [Google Scholar] [CrossRef] [PubMed]
- The Lewin Group. CMS Bundled Payments for Care Improvement (BPCI) Initiative Models 2-4: Year 5 Evaluation & Monitoring Annual Report. 2018. Available online: https://downloads.cms.gov/files/cmmi/bpci-models2-4-yr5evalrpt.pdf (accessed on 27 August 2021).
- Austin, P.C. Optimal Caliper Widths for Propensity-Score Matching When Estimating Differences In Means And Differences In Proportions In Observational Studies. Pharm. Stat. 2011, 10, 150–161. [Google Scholar] [CrossRef] [PubMed]
- Yang, D.; Dalton, J.E. A Unified Approach to Measuring the Effect Size Between Two Groups Using SAS®. SAS Glob. Forum 2012, 335, 1–6. [Google Scholar]
- Liao, J.M.; Lavizzo-Mourey, R.J.; Navathe, A.S. A National Goal to Advance Health Equity through Value-Based Payment. JAMA 2021, 325, 2439–2440. [Google Scholar] [CrossRef] [PubMed]
- Gu, X.S.; Rosenbaum, P.R. Comparison of Multivariate Matching Methods: Structures, Distances, and Algorithms. J. Comput. Graph. Stat. 1993, 2, 405–420. [Google Scholar] [CrossRef]
| Publisher’s Note: MDPI stays neutral with regard to jurisdictional claims in published maps and institutional affiliations. |
© 2022 by the authors. Licensee MDPI, Basel, Switzerland. This article is an open access article distributed under the terms and conditions of the Creative Commons Attribution (CC BY) license (https://creativecommons.org/licenses/by/4.0/).


