Abstract
(1) Background: AI-based solutions could become crucial for the prediction of pregnancy disorders and complications. This study investigated the evidence for applying artificial intelligence methods in obstetric pregnancy risk assessment and adverse pregnancy outcome prediction. (2) Methods: Authors screened the following databases: Pubmed/MEDLINE, Web of Science, Cochrane Library, EMBASE, and Google Scholar. This study included all the evaluative studies comparing artificial intelligence methods in predicting adverse pregnancy outcomes. The PROSPERO ID number is CRD42020178944, and the study protocol was published before this publication. (3) Results: AI application was found in nine groups: general pregnancy risk assessment, prenatal diagnosis, pregnancy hypertension disorders, fetal growth, stillbirth, gestational diabetes, preterm deliveries, delivery route, and others. According to this systematic review, the best artificial intelligence application for assessing medical conditions is ANN methods. The average accuracy of ANN methods was established to be around 80–90%. (4) Conclusions: The application of AI methods as a digital software can help medical practitioners in their everyday practice during pregnancy risk assessment. Based on published studies, models that used ANN methods could be applied in APO prediction. Nevertheless, further studies could identify new methods with an even better prediction potential.
1. Introduction
The first mentions of artificial intelligence (AI) appeared in ancient Greek mythology. In the 15th century, Leonardo Da Vinci crafted an impressive mechanical knight that could move its arms, sit, and twist its head. However, the actual field of artificial intelligence research was founded in 1956 [1].
Artificial intelligence is a science and engineering field that deals with computer-driven mechanisms or machines that use computer power, memory, and large amounts of data. It has been handling learning tasks by creating models of intelligent behavior with the lowest possible human interruption. The appliance of artificial intelligence in medicine can be divided into two main branches: virtual and physical. The virtual branch is represented by machine learning (ML) which is characterized by computer algorithms that can enhance learning through experience [1]. In contrast, the physical branch consists of mechanical devices such as medical equipment or highly advanced robots [2].
Many complications of pregnancy cannot be directly treated once they occur. Therefore, perinatal medicine predicts high-risk groups and applies interventions to minimize adverse perinatal outcomes [3]. Examples of such interventions are aspirin for preeclampsia, progesterone for preterm birth, diet and insulin for diabetes, and growth assessment for stillbirth [4,5,6,7,8,9]. Incorporating AI in risk assessment and adverse pregnancy outcome (APO) prediction is an opportunity for present-day perinatal medicine. The development of prediction models and effective screening methods for APO could improve diagnostic and therapeutic decisions and significantly impact women’s and children’s well-being. The routine implementation of AI could even further improve medical care [10,11,12,13].
Factors such as BMI, maternal hypertension, CTG, and gestational diabetes mellitus can help predict fetal disorders, the route of delivery, preterm birth, and other risk factors for pregnant women and fetuses. In addition, maternal biochemical markers, such as β-human chorionic gonadotrophin (β-hCG), pregnancy-associated plasma protein A (PAPP-A), and placental growth factor (PLGF), are used to predict aneuploidies or other fetal and placental dysfunctions [14,15]. Artificial neural networks (ANNs) are the most popular form of AI applied in medicine. ANNs are computer analytic models inspired by the animal nervous system. An ANN is composed of interconnected computer processors called ‘neurons’ which can simultaneously perform data calculations to assess the occurrence of an outcome based on given factors. ANNs can learn and analyze imprecise pieces of information, nonlinear data, and previous examples. These abilities allow for the analysis of large amounts of medical data and help in diagnostic and treatment decisions. They progressively move towards plastic neural systems capable of learning through evolution by interacting with the environment [16]. The other most popular AI techniques are ML, the decision tree (DT), the support vector machine (SVM), and the random forest (RF) [17,18,19,20,21,22]. Every AI method should be compared to the best prediction statistic method which is named logistic regression (LR), or, to be precise, a distinguished form of multiple linear regression—multivariate logistic regression (MLR). MLR has the same aim as all model-building techniques: to describe the relationship between predictors and outcomes [23,24,25].
There are no published studies comparing the usage of artificial intelligence methods to predict perinatology complication occurrences. This study investigated the evidence for applying artificial intelligence methods in obstetric pregnancy risk assessment and adverse pregnancy outcome prediction.
2. Materials and Methods
2.1. Study Design
The current systematic review was performed according to the systematic reviews and meta-analyses (PRISMA) guidelines and was presented in Table S1 [26]. The systematic review protocol was registered in PROSPERO with ID-number CRD42020178944 and was published beforehand [27].
2.2. Search Strategy
Authors screened the following databases using the search strategy presented in Box 1: Pubmed/MEDLINE, Web of Science, Cochrane Library, and EMBASE. In addition, the electronic database search was supplemented by searching Google Scholar.
Box 1. Search strategy.
(pregnant OR pregnancy OR prepartum OR prenatal OR gestation OR prelabor OR maternal) AND (artificial neural networks OR artificial intelligence OR machine learning) AND (pregnancy risk)
All searches were conducted on 27 May 2022, with languages restricted to English, German, or Polish and with no publication-time limits. Additionally, references of all included studies were hand-searched for additional relevant articles.
2.3. Inclusion Criteria
All types of evaluative study designs were included and assessed. Two reviewers (SF and MP) independently screened the studies by the title, abstract, and full text. Studies that met the selection criteria were included. The reference lists of the included studies were additionally screened. Every included study was assessed (0 = not relevant, 1 = possibly relevant, and 2 = very relevant). Only publications that scored at least 1 point were included in the study. Any disagreement was discussed and resolved by the third researcher (AK).
2.4. Data Extraction
PI(E)CO question was “Artificial intelligence methods in the screening for pregnancy risk and adverse pregnancy outcomes in pregnant women.” Population (P) was pregnant women with high-risk pregnancies (with named complications of pregnancies). Intervention (E) applied artificial intelligence methods to evaluate pregnancy risk and to screen for APO. For comparison, (C) pregnant women with low-risk pregnancies were included. The outcome (O) was the prediction value of the studied artificial intelligence method. Studies (S) included in the analyses were retrospective or prospective trials with the unaffected population as a control.
The PRISMA diagram was made according to Reporting Items for Systematic Reviews and Meta-Analyses. The PRISMA flow chart is shown in Figure 1 [28].
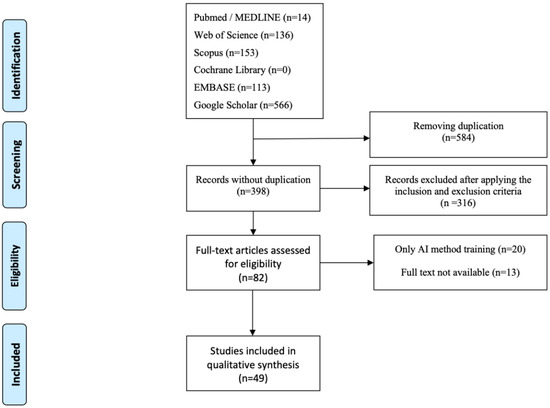
Figure 1.
PRISMA systematic-review flow diagram.
2.5. Quality Assessment and Risk of Bias
The risk of bias was assessed independently by two authors (SF and MP) using the Newcastle–Ottawa scale [29]. The third reviewer (AK) resolved apparent discrepancies in the selection process. In general, the studies included were of moderate to high quality. The selection process is shown in Table 1.
2.6. Synthesis of Results
Due to the heterogeneity of the included studies, there was no possibility of performing a quantitative synthesis. Nevertheless, all prediction values of the included studies’ AI methods were divided into groups according to pregnancy outcomes and were assessed. Results were summarized in Table 2, Table 3, Table 4, Table 5, Table 6, Table 7, Table 8, Table 9 and Table 10.

Table 1.
The Newcastle–Ottawa scale for quality assessment of included studies.
Table 1.
The Newcastle–Ottawa scale for quality assessment of included studies.
| Authors | ||||||||||||||||||||||||||||||||||||||||||||||||||
|---|---|---|---|---|---|---|---|---|---|---|---|---|---|---|---|---|---|---|---|---|---|---|---|---|---|---|---|---|---|---|---|---|---|---|---|---|---|---|---|---|---|---|---|---|---|---|---|---|---|---|
| Item | Gorthi et al. (2009) | Umoh and Nyoho (2015) | Fernandes et al. (2017) | Chaminda and Sharmilan (2016) | Moreira et al. (2018) | Neocleous et al. (2017) | Neocleous et al. (2016) | Neocleous et al. (2018) | Akbulut et al. (2018) | Robinson et al. (2010) | Moreira et al. (2018) | Nair et al. (2018) | Jhee et al. (2019) | Mello et al. (2001) | Li et al. (2016) | Kuhle et al. (2018) | Moreira et al. (2019) | Naimi et al. (2018) | Kayode et al. (2016) | Harihara et al. (2019) | Koivu et al. (2020) | Malacov et al. (2020) | Shanker et al. (1996) | Polak and Mendyk (2004) | Artzi et al. (2020) | Moreira et al. (2018) | Nanda et al. (2011) | Kang et al. (2019) | Pourahmad et al. (2017) | Weber et al. (2018) | Idowu et al. (2015) | Woolery and Jerzy (1994) | Fergus et al. (2013) | Courtney et al. (2008) | Nodelman et al. (2020) | Moreira et al. (2018) | Bahado-Singh et al. (2019) | Lee and Ahn (2019) | Goodwin et al. (2001) | Prema and Pushpalatha (2019) | Elaveyini et al. (2011) | Catley et al. (2006) | Beksac et al. (1996) | Caruana et al. (2003) | Paydar et al. (2017) | Li et al. (2017) | Grossi et al. (2016) | Valensise et al. (2006) | Gao et al. (2019) | |
| A | Selection | |||||||||||||||||||||||||||||||||||||||||||||||||
| Exposed were truly representative of average | 1 | 0 | 1 | 1 | 1 | 1 | 1 | 1 | 0 | 1 | 1 | 0 | 1 | 1 | 1 | 1 | 1 | 1 | 1 | 1 | 1 | 1 | 1 | 1 | 1 | 1 | 1 | 1 | 1 | 1 | 1 | 1 | 1 | 1 | 1 | 1 | 0 | 1 | 1 | 1 | 0 | 1 | 1 | 1 | 1 | 1 | 0 | 1 | 1 | |
| Selection of nonexposed from the same community | 1 | 0 | 1 | 1 | 1 | 1 | 1 | 1 | 0 | 1 | 1 | 0 | 1 | 1 | 1 | 1 | 1 | 1 | 1 | 1 | 1 | 1 | 1 | 1 | 1 | 1 | 1 | 1 | 1 | 1 | 1 | 1 | 1 | 1 | 1 | 1 | 0 | 1 | 1 | 1 | 1 | 1 | 1 | 1 | 1 | 1 | 0 | 1 | 1 | |
| Exposure of ascertained by secure record or interview | 0 | 0 | 1 | 1 | 1 | 1 | 1 | 1 | 1 | 1 | 1 | 1 | 1 | 1 | 1 | 1 | 1 | 1 | 1 | 1 | 1 | 1 | 1 | 1 | 1 | 1 | 1 | 1 | 1 | 1 | 1 | 1 | 1 | 1 | 1 | 1 | 1 | 1 | 1 | 1 | 1 | 1 | 0 | 1 | 1 | 1 | 1 | 1 | 1 | |
| Demonstration of outcome of interest not present at the start of the study | 1 | 1 | 1 | 1 | 1 | 1 | 1 | 1 | 1 | 1 | 1 | 1 | 1 | 1 | 1 | 1 | 1 | 1 | 1 | 1 | 1 | 1 | 1 | 1 | 1 | 1 | 1 | 1 | 1 | 1 | 1 | 1 | 1 | 1 | 1 | 1 | 1 | 1 | 1 | 1 | 1 | 1 | 1 | 1 | 1 | 1 | 1 | 1 | 1 | |
| B | Comparability | |||||||||||||||||||||||||||||||||||||||||||||||||
| Study controls for other variables | 1 | 1 | 1 | 1 | 1 | 1 | 1 | 1 | 1 | 1 | 1 | 1 | 1 | 1 | 1 | 1 | 1 | 1 | 1 | 1 | 1 | 1 | 1 | 1 | 1 | 1 | 1 | 1 | 1 | 1 | 1 | 1 | 1 | 1 | 1 | 1 | 1 | 1 | 1 | 1 | 1 | 1 | 1 | 1 | 1 | 1 | 1 | 1 | 1 | |
| C | Outcome | |||||||||||||||||||||||||||||||||||||||||||||||||
| Follow up long enough for outcome to occur | 1 | 0 | 0 | 0 | 1 | 0 | 0 | 0 | 0 | 0 | 0 | 0 | 0 | 0 | 0 | 0 | 0 | 0 | 0 | 0 | 0 | 0 | 0 | 0 | 0 | 0 | 0 | 0 | 0 | 0 | 0 | 0 | 0 | 0 | 0 | 0 | 0 | 0 | 0 | 0 | 0 | 1 | 0 | 0 | 1 | 1 | 0 | 0 | 0 | |
| Complete follow up of all subjects accounted for | 1 | 0 | 0 | 0 | 1 | 0 | 0 | 0 | 0 | 0 | 0 | 0 | 0 | 0 | 0 | 0 | 0 | 0 | 0 | 0 | 0 | 0 | 0 | 0 | 0 | 0 | 0 | 0 | 0 | 0 | 0 | 0 | 0 | 0 | 0 | 0 | 0 | 0 | 0 | 0 | 0 | 1 | 0 | 0 | 1 | 1 | 0 | 0 | 0 | |
| Subject to follow up, unlikely to introduce biases | 1 | 0 | 0 | 0 | 1 | 0 | 0 | 0 | 0 | 0 | 0 | 0 | 0 | 0 | 0 | 0 | 0 | 0 | 0 | 0 | 0 | 0 | 0 | 0 | 0 | 0 | 0 | 0 | 0 | 0 | 0 | 0 | 0 | 0 | 0 | 0 | 0 | 0 | 0 | 0 | 0 | 1 | 0 | 0 | 1 | 1 | 0 | 0 | 0 | |
| Assessment of outcomes | 0 | 0 | 0 | 0 | 1 | 0 | 0 | 0 | 1 | 1 | 1 | 0 | 1 | 0 | 1 | 1 | 1 | 1 | 0 | 0 | 1 | 1 | 1 | 0 | 0 | 1 | 0 | 1 | 0 | 0 | 1 | 0 | 1 | 1 | 0 | 0 | 0 | 1 | 0 | 0 | 0 | 0 | 0 | 0 | 0 | 0 | 0 | 0 | 0 | |
| Score | 7 | 2 | 5 | 5 | 9 | 5 | 5 | 5 | 4 | 6 | 6 | 3 | 6 | 5 | 6 | 6 | 6 | 6 | 5 | 5 | 6 | 6 | 6 | 5 | 5 | 6 | 5 | 6 | 5 | 5 | 6 | 5 | 6 | 6 | 5 | 5 | 3 | 6 | 5 | 5 | 4 | 8 | 4 | 5 | 8 | 8 | 3 | 5 | 5 | |
Table 2.
Characteristics of included studies on general pregnancy risk assessment.
Table 2.
Characteristics of included studies on general pregnancy risk assessment.
| Study | Country | Sample Size | Population | Model | Knowledge Source for AI | Type of Risk | Prediction Value of AI/AUC | Prediction Value of LR |
|---|---|---|---|---|---|---|---|---|
| Gorthi et al. (2009) [30] | India | 240 | A prospectively collected sample of pregnant women was used to assess the practical model. There were 200 training cases and 40 test cases. | Knowledge-based system | Literature | Risk classification | Training 93.4 %, test 82.5% | NA |
| Umoh and Nyoho (2015) [31] | Nigeria | 30 | Pregnant women (aged 25–40) were selected to test the theoretical model. | Intelligent fuzzy framework | Literature | High-risk pregnancy | Not assessed | NA |
| Fernandes et al. (2017) [32] | Brazil | 1380 | Retrospective validation of the documentation of pregnant women from the High-Risk Prenatal sector at MEJC was used to test the theoretical model. | Knowledge-based system | Predefined risk factors | Risk reclassification | Not assessed | NA |
| Chaminda and Sharmilan (2016) [33] | Sri Lanka | 117 | Pregnant women of different ages and lifestyles were used. (Unclear if retrospective or prospective.) There were 93 training cases and 24 testing cases. | Hybrid system: neuronal network and naïve Bayes algorithm | Predefined risk factors | Pregnancy risk assessment | ANN 80%, naïve Bayes 70%, novel hybrid approach 86% | NA |
| Moreira et al. (2018) [34] | Brazil, Portugal, Saudi Arabia, India, Russia | 100 | Parturient women diagnosed with a hypertensive disorder during pregnancy were used. All prospectively collected cases were used to test the model. | Artificial neural networks (ANN) | Patient’s history | Hypertensive disorder during pregnancy | Hybrid algorithm 93% | NA |
3. Results
AI has been applied to many different aspects of perinatal medicine. The included studies described AI applications in predicting general pregnancy risk characteristics, prenatal diagnoses, pregnancy hypertension disorder, fetal growth, stillbirth, gestational diabetes, preterm deliveries, the delivery route, and other conditions [30,31,32,33,34,35,36,37,38,39,40,41,42,43,44,45,46,47,48,49,50,51,52,53,54,55,56,57,58,59,60,61,62,63,64,65,66,67,68,69,69,70,71,72,73,74,75,76,77,78,79]. The studies were divided into nine groups using the predictive value of the AI methods. Table 3, Table 4, Table 5, Table 6, Table 7, Table 8, Table 9 and Table 10 present the main characteristics of the included studies. For each group, the most robust method was identified.
The first group included five prediction studies assessing the general pregnancy risk (Table 2) [30,31,32,33,34].
There were various predictors used in the model construction. The most relevant were the clinical parameters and existing health conditions of the mother (maternal and gestational age; gravidity and parity; BMI, weight gain; and life parameters such as blood pressure, lifestyle, nutrition, etc.), pregnancy-related complications (threatened preterm delivery, bleeding in pregnancy, prepregnancy and gestational diabetes, hypertensive disorder spectrum, HELLP syndrome, cholestasis and other liver disorders in pregnancy, thrombophilia, autoimmune diseases, an age higher than 35 years, multiple pregnancies, and an interval of 10 years or more between pregnancies), laboratory parameters (albuminuria, hyperglycemia, leucocythemia, etc.), fetal monitoring parameters (basal fetal heart rate, variability, and the occurrence of accelerations or decelerations), and Ultrasound and Doppler parameters (fetal movement; the growth of the fetus; uterine, cerebral, and umbilical fetal Doppler signals; and the amniotic fluid index). However, many other variables might be used in order to measure the overall risk of a pregnancy. This would increase the model’s representativeness and accuracy, but it could be difficult to determine how effective the model would be.
Classification and regression trees (CART) [30], fuzzy logic [31], the teletech architecture ILITIA [32], ANNs, and naïve Bayes were used [34]. CART had the best predictive value (accuracy of 93.4% in the training group and 82.5% in the tested group), and naïve Bayes had the worst accuracy with a score of 70% [34]. Nevertheless, the observed differences between all the methods were minimal.
The second group included four articles about the prenatal diagnosis of chromosomal abnormalities using ANNs and binary classification models such as the averaged perceptron, the boosted DT, the Bayes point machine, the decision forest, the decision jungle, the locally deep SVM, LR, ANNs, and the SVM (Table 3) [35,36,37,38].
Table 3.
Characteristics of included studies on prenatal diagnosis of chromosomal abnormalities.
Table 3.
Characteristics of included studies on prenatal diagnosis of chromosomal abnormalities.
| Study | Country | Sample Size | Population | Model | Knowledge Source for AI | Type of Risk | Prediction Value of AI/AUC | Prediction Value of LR |
|---|---|---|---|---|---|---|---|---|
| Neocleous et al. (2016) [36] | United Kingdom, Netherlands, Cyprus | 51,208 | Pregnant women with euploid and aneuploid fetuses were used. There was a 3-fold cross validation of the system. This was done by randomly dividing cases into training and evaluation groups. | ANN | Patient’s history | Aneuploidies | 21st trisomy 100%, euploidy 96.1% | NA |
| Neocleous et al. (2017) [35] | United Kingdom, Netherlands, Cyprus | 123,329 | There were 122362 euploid cases and 967 aneuploid cases. There were retrospective cases of pregnant women. They were split into 70% training cases and 30% validation cases. | ANN | Patient’s history | Aneuploidies | 21st trisomy 100%, other aneuploidies > 80% | NA |
| Neocleous et al. (2018) [37] | United Kingdom, Netherlands, Cyprus | 72,654 | There was a prospective sample of pregnant women at 11–13 weeks gestation. An amount of 70% of training sets and 30% of test sets were randomly chosen. | ANN | Patient’s history | Aneuploidies | 21st trisomy 94.2%, other aneuploidies 79.5% | NA |
| Akbulut et al. (2018) [38] | Turkey, United States | 97 | There was a prospective analysis of pregnant women (96 singletons and 1 twin). There were 97 training cases and 16 testing cases. | Decision Forest (DF) | Maternal questionnaire, specialist, and patient’s history. | Congenital anomalies | DF during training 89.5%, DF during testing 87.5% | NA |
A well-known chromosomal abnormality prediction was built in the AI model using ultrasound indicators (nuchal translucency, crown-rump length, and the presence of the nasal bone) and pregnancy-associated plasma protein A (PAPP-A) with free β-hCG. All were obtained between the 9th + 3 and the 11th week + 6 days of gestation.
The best method was the Decision Forest model, which achieved the highest accuracy of 89.5%, with an almost 100% detection rate of 21st trisomy [38].
The third group included five articles about pregnancy hypertension characteristics (Table 4) [39,40,41,42,43]. The methods used in this group were ANNs [41], neuro-fuzzy machine learning techniques [40], MLR [39,43], and other ML techniques such as LR, the DT model, the naïve Bayes classification, the SVM, the RF algorithm, and the stochastic gradient boosting method [42].
Table 4.
Characteristics of included studies on hypertension.
Table 4.
Characteristics of included studies on hypertension.
| Study | Country | Sample Size | Population | Model | Knowledge Source for AI | Type of Risk | Prediction Value of AI/AUC | Prediction Value of LR |
|---|---|---|---|---|---|---|---|---|
| Robinson et al. (2010) [39] | United States | 608 | There was a retrospective analysis of patients with preeclampsia (after induction of labor, 1997–2007, 195 cesarean sections, 413 vaginal deliveries). There was training of 304 patients (50%) and testing of 152 patients (25%). | ANN | Patient’s history | Preeclampsia | AUC (area under the ROC curve) 0.75 | AUC 0.74 |
| Moreira et al. (2018) [40] | Brazil, Portugal, Russia, Saudi Arabia | 205 | There were 205 women with a hypertensive disorder during pregnancy and 7 women with HELLP syndrome. All records were used to test the model. | Neuro-fuzzy model | Patient’s history, experts | HELLP syndrome | AUC 0.685 | NA |
| Nair et al. (2018) [41] | United States | 38 | There were 38 pregnant women (19 with PE and 19 normotensives) It was split into 85 training cases and 15% testing cases. | ANN | Patient’s history | Preeclampsia | AUC 0.908 | NA |
| Jhee et al. (2019) [42] | Korea | 11,006 | There was a prospective analysis of pregnant women. It was split into 70% (n = 10 058) training cases and 30% (n = 474) testing cases. | ML—decision tree (DT), naïve Bayes classification (NBC), support vector machine (SVM), RF, stochastic gradient boosting (SGB) | Patient’s history | Preeclampsia | DT 84.7%, NBC 89.9%, SVM 89.2%, RF 92.3%, SGB 97.3% | 86.2% |
| Mello et al. (2001) [43] | Italy | 303 | There was a prospective analysis of preconception enrollment and, consequently, pregnant women (spontaneous conception, single pregnancies, 76–25.1% with pregnancy hypertension in III trimester)—patients were postpartum controlled. There were 187 training cases and 116 testing cases. | ANN and multivariate logistic regression (MLR) | Patient’s history | Preeclampsia and FGR | AUC 0.952, positive predictive value 86.2%, negative predictive value 95.5% | AUC 0.962, positive predictive value 92%, negative predictive value 93.4% |
For pregnancy hypertension prediction, the following risk factors were assessed: maternal age at the time of delivery, gestational age at delivery; maternal race; parity; neonatal birth weight; prepregnancy BMI; cervical ripening during induction; fetal growth restriction; blood pressure; maternal medical history of hypertension, diabetes, and previous preeclampsia; obstetrical and social histories; medications prescribed during pregnancy; and laboratory data (blood urea nitrogen, serum creatinine, spot urine protein-to-creatinine ratio, urine albumin-to-creatinine ratio, hemoglobin, fasting blood glucose, serum albumin, uric acid, total bilirubin, aspartate transaminase, alanine transaminase, total cholesterol, triglycerides, high-density lipoprotein cholesterol, and low-density lipoprotein cholesterol).
ML techniques showed remarkable results. The stochastic gradient boosting model had the best prediction performance, with an accuracy of 97.3% and a false-positive rate of 0.9%. ANNs and MLR showed an area under the ROC curve of 0.952 as well as 86.2% sensitivity and 95.4% specificity for ANNs.
The fourth group included four articles about the prediction of fetal growth restriction (FGR) (Table 5) [44,45,46,47].
Table 5.
Characteristics of included studies on fetal growth.
Table 5.
Characteristics of included studies on fetal growth.
| Study | Country | Sample Size | Population | Model | Knowledge Source for AI | Type of Risk | Prediction Value of AI/AUC | Prediction Value of LR |
|---|---|---|---|---|---|---|---|---|
| Li et al. (2016) [44] | China | 215,568 | There was a prospective analysis of pregnant women (13,258 cases of SGA and 202310 cases of non-SGA). It was split into 90% training cases and 10% testing cases. It was unclear if they were prospective or retrospective. | ML—support vector machine (SVM), random forest (RF), logistic regression (LR), and sparse LR | Patient’s history | Fetal growth abnormalities | SVM 92.4%, C4.5 43.7%, RF 61.2%, LR Sparse 94.5%, AUC 0.6 | 93%, AUC 0.6 |
| Kuhle et al. (2018) [45] | Canada | 30,705 | There was a retrospective analysis of pregnant women after 26 gestation weeks (SGA 7.9%, LGA 13.5%). It was split into 80% training cases and 20% testing cases. | Neural network models: NNET package | Patient’s history | Fetal growth abnormalities | AUC 0.60–0.75 | 84.7%, 0.66 |
| Moreira et al. (2019) [46] | Brazil | NA | There was a prospective analysis of pregnant women (Fetal birth-weight estimation in high-risk pregnancies). It was not possible to assess the size of the training and test groups. | Machine learning (ML)—bagged tree | NA | Fetal Growth | 84.9%, AUC 0.636 | NA |
| Naimi et al. (2018) [47] | United States | 18,757 | There was a retrospective analysis of pregnant women (240 high-risk pregnancies). All cases were used to test the model. | ML | Patient’s history | Fetal Growth | Not assessed | NA |
The three most important factors for SGA prediction were gestational weight gain, maternal smoking, and prior low birth weight (LBW) infants. Prepregnancy BMI, gestational weight growth, and a history of deliveries of infants weighing more than 4080 g were the primary predictors of LGA.
Methods such as the SVM, the RF, LR, sparse LR models, linear and quantile regression, Bayesian additive regression trees, generalized boosted models, and the ML technique called the bagged tree were used [44,45,46,47]. The SGA bagged tree case had a prediction value of 84.9% and an area under the receiver operating characteristic curve of 0.636 [46]. The highest accuracy was achieved by the SVM, with a prediction score of 90.7% and an AUC of 0.588 [44].
The next group of examined articles included four studies about stillbirth prediction (Table 6) [48,49,50,51]. MLR [48], artificial intelligence analysis of time-lapse (TLM) embryo images [49], LR, ANNs, the gradient boosting DT [50], regularized logistic regression, the DT based on classification and regression trees, the RF, extreme gradient boosting (XGBoost), and the multilayer perceptron neural network were used in those studies [51].
Table 6.
Characteristics of included studies on stillbirth.
Table 6.
Characteristics of included studies on stillbirth.
| Study | Country | Sample Size | Population | Model | Knowledge Source for AI | Type of Risk | Prediction Value of AI/AUC | Prediction Value of LR |
|---|---|---|---|---|---|---|---|---|
| Kayode et al. (2016) [48] | Nigeria, Netherlands, Ghana, South Africa | 6956 | There was a retrospective analysis of pregnant women (6573 well-ended pregnancies and 443 stillbirths). All cases were used as testing cases. | Multivariable logistic regression | Patient’s history | Stillbirth | C-statistic basic model 80% Extended model 82% | NA |
| Harihara et al. (2019) [49] | United Kingdom, Spain, Italy, Brazil, United States | 3412 | Images of the embryos (1756 newborns, 1656 miscarriages) were used. A total of 63% (n = 2140) of retrospective lapse images of blastocysts with known live-birth outcomes following a single embryo transfer were used to train the model. An amount of 15.5% (n = 536) of the images were used in validation. A total of 21.5% (n = 736) of prospective cases were used to test the model. | Convolutional neural network (CNN) | Patient’s history | Miscarriage | 77% | NA |
| Koivu et al. (2020) [50] | Finland | 16,340 661 | Prospectively collected normal pregnancies (965,504 preterm births, 8061 early stillbirths, and 8420 late stillbirths) were used. There were 9,004,902 training cases and 1,292,847 testing cases. | LR, ANNs, deep NN (neuronal network), SELU N (scaled exponential linear units network), LGBM (The lightgun gradient boosting decision tree) | Patient’s history | Early and late stillbirth, preterm delivery | Early stillbirth AUC Deep NN 0.73, SELU N 0.75, LGBM 0.75; Late stillbirth AUC Deep NN 0.57, SELU N 0.59, LGBM 0.6; Preterm delivery AUC Deep NN 0.66, SELU N 0.67, LGBM 0.67 | Early stillbirth AUC 0.73, Late stillbirth AUC 0.58, Preterm delivery AUC 0.64 |
| Malacova et al. (2020) [51] | Australia, Norway, United States | 467,365 | There was a retrospective analysis of pregnant women (7788 stillbirths). All cases were used for testing the existing models. | LR, decision trees (DT) and regression trees, random forest (RF), extreme gradient boosting (XGBoost), and a multilayer perceptron neural network | Patient’s history | Stillbirth | AUCs 0.59–0.84, DT 0.59–0.82, RF 0.594–0.84, XGBoost 0.596–0.84, multilayer perceptron 0.595–0.84 | AUCs 0.602–0.83 |
Social predictors (maternal age, parity, education, occupation, ethnicity, place of residence, previous fetal loss, bleeding during pregnancy, maternal BMI, number of prior caesarean sections, multiple pregnancies, child’s gender, and fetal growth rate) and comorbid conditions (hypertension disorder spectrum, diabetes, sickle cell disease, renal disorders, thyroid dysfunction, and venereal diseases) were used to estimate the risk of miscarriages. MLR showed excellent results with a C-statistic basic model of 80% of stillbirth predictions.
The sixth group included seven articles about gestational diabetes prediction (Table 7) [52,53,54,55,56,57,58]. The methods used were ANNs, LR, ML methods, the radial basis function network (RBFNetwork), the MLP, the DT, and the SVM [52,53,54,55,56,57,58].
Other factors such as the mother’s age, BMI, triceps skin-fold thickness, plasma glucose concentration at 2 h in an oral glucose tolerance test, 2 h serum insulin level, and diabetes degree function were particularly effective in predicting gestational diabetes. The ML method resulted in a high accuracy even at pregnancy initiation with 0.85 ROC, substantially outperforming a baseline risk score of 0.68 ROC [52]. The usage of the RBFNetwork also showed great results with a precision of 78.5%, an F-Measure of 78.6%, an ROC area of 0.839, and a Kappa statistic of 0.509 [53]. Therefore, these two models seem to be the best fit for the prediction of GDM [52,53].
Table 7.
Characteristics of included studies on gestational diabetes.
Table 7.
Characteristics of included studies on gestational diabetes.
| Study | Country | Sample Size | Population | Model | Knowledge Source for AI | Type of Risk | Prediction Value of AI/AUC | Prediction Value of LR |
|---|---|---|---|---|---|---|---|---|
| Shanker et al. (1996) [55] | United States | 768 | Pima Indian pregnant women (268 with diabetes) were used. There were 576 training cases (378 patients without diabetes and 198 patients with diabetes) and 192 test cases. | ANN | Patient’s history | GDM | 77.6% | 79.2% |
| Polak and Mendyk (2004) [56] | Poland | 2551 | There was a retrospective analysis of pregnant women (2460 without GDM, 91 with GDM) The randomly chosen 90% were used for training, and the remaining 10% were used to test the model. | ANN | Patient’s history | GDM | 70% | 56.3% |
| Artzi et al. (2020) [52]. | Israel | 588,622 | A retrospectively collected cohort of pregnant women (I group—46,002 women from Jerusalem; II group—8540 women from the aforementioned area) was used. There were 2355 training cases (295 at the start of the pregnancy, 2060 generated by different processes). The hold-out/external validation n = 82678. | ML | Patient’s history | GDM | AUC 0.85, AUC 0.80 (simpler model) | NA |
| Moreira et al. (2018) [53] | USA (Gila and Salt rivers) | 394 | A prospectively collected cohort of pregnant women (the Pima Indians) was used. All cases were used to test the model. | ANN—multilayer perceptron (MLP) | Literature, patient’s history | GDM | Precision 0.785, F-measure 0.786, AUC 0.839 | NA |
| Nanda et al. (2011) [58] | United States | 11,464 | There was a retrospective analysis of pregnant women (297 (2.6%) with GDM and 11,167 without GDM). All cases were used to test the model. | Knowledge-based system | Patient’s history | GDM | 61.6% | NA |
| Kang et al. (2019) [57] | China, United States | 1891 | There was a retrospective analysis of pregnant women with GDM (14.2%, n = 268) that had macrosomia. There were 1702 training cases and 189 test cases. | Decision tree (DT), support vector machine (SVM), and ANN | Patient’s history | Macrosomia in patients with GDM | DT training 87.14, DT test 86.25, ANN training 86.54, ANN test 85.52, SMV training 86.23, SMV test 86.09 | Training 86.44, test 86.20 |
The seventh group included fourteen studies about preterm delivery prediction (Table 8) [59,60,61,62,63,64,65,66,67,68,69,70,71,72]. ANNs [59], cross-validated regressions [60], the RF classifier, the rule-based classifier, penalized logistic regression [61], the synthetic minority oversampling technique [63], LR, classification and regression trees (CART), the SVM, the Bayesian classifier [64], the back-propagation neural network [65], the system for mobile health SVM [72], deep learning [66], data mining, and the feed-forward back-propagation network were used in all of these studies [67,68,69,70,71].
Table 8.
Characteristics of included studies on preterm delivery.
Table 8.
Characteristics of included studies on preterm delivery.
| Study | Country | Sample Size | Population | Model | Knowledge Source for AI | Type of Risk | Prediction Value of AI/AUC | Prediction Value of LR |
|---|---|---|---|---|---|---|---|---|
| Pourahmad et al. (2017) [59] | Iran | 1102 | There was a retrospective analysis of pregnant women (1047 (95%) singleton pregnancies, 52 (4.7%) employed women, 24.3% of fetuses with PTB). All cases were used to test the model. | ANN | Patient’s history | Preterm delivery (PTB), low birth weight (LBW) | For PTB 81.4% (AUC 0.78), for LBW 87.8% (AUC 0.79) | NA |
| Weber et al. (2018) [60] | United States | 336,214 | There was a retrospective analysis of pregnant women (singleton pregnancies, nulliparous, NH black (54,084), and NH white (282,130)). The original sample was partitioned into a training set to fit the model and a testing set to evaluate the goodness of the fit. | ML | Patient’s history | Preterm delivery | AUC 0.67 | NA |
| Idowu et al. (2015) [61] | United Kingdom | 300 | There was an analysis of pregnant women (262 delivered at term and 38 prematurely). (NA if retrospective or prospective.) All cases were used as a testing group. | ML—RF | Patient’s history | Preterm delivery | AUC 0.94 | NA |
| Woolery and Jerzy (1994) [62] | United States | 9419 | A population of pregnant women was used for testing the model. (NA if retrospective or prospective.) | ML | Patient’s history (database) | Preterm delivery | 53–88% | NA |
| Fergus et al. (2013) [63] | United Kingdom | 300 | There was a retrospective analysis of pregnancies (38 ended preterm, and 262 were term deliveries). A total of 80% of the whole dataset was designated for training, and the remaining 20% was for testing. | ML | Patient’s history | Preterm delivery | AUC 0.95 | NA |
| Courtney et al. (2008) [64] | United States | 73,040 | There was a retrospective analysis of pregnant women. All cases were used to test the method. | Matlab® Neuronal Networks package and the support vector machine (SVM) classifier | Patient’s history, medical records | Preterm delivery, low birth weight | AUC neural networks 0.57, AUC SVM 0.57, AUC Bayesian classifiers 0.59, AUC CART 0.56 | AUC 0.605 |
| Nodelman et al. (2020) [65] | United States | 3001 | There was a retrospective analysis of pregnant women (10.3% preterm deliveries). There was a total of 2038 training cases and 963 testing cases. | ANN | Patient’s history | Preterm delivery | 87.3% (95%CI: 85.1–89.4%) | NA |
| Moreira et al. (2018) [72] | Brazil, Portugal, Spain | 205 | Pregnant women with a hypertensive disorder during pregnancy were collected retrospectively (12% PTB). Patients were divided into ten subsets of equal sizes. Then, each subset was used once for testing, and the remaining were used for training. (NA if retrospective or prospective.) | Data mining, ML—support vector machine (SVM). | Patient’s history | Preterm delivery in patients with hypertensive disorder | 82.1% (AUC 0.785) | NA |
| Bahado-Singh et al. (2019) [66] | United States | 32 | We retrospectively collected a cohort of pregnant women (42.3% (n = 11) patients delivered ≥ 34 weeks, 57.7% (n = 15) delivered < 34 weeks). We randomly split the combined omics sample data into 80% training set and a 20% test set. | ML | Patient’s history | Preterm delivery | AUC 0.875 | NA |
| Lee and Ahn (2019) [67] | Korea | 596 | A cohort of pregnant women was collected retrospectively. There were 298 training cases and 298 validation cases. | ANN | Patient’s history | Preterm delivery | MLR 0.918, Decision Tree 0.8328, naïve Bayes 0.1115 RF 0.8918 SVM 0.9148 | NA |
| Goodwin et al. (2001) [68] | United States | 19,970 | Pregnant women (105 (1%) American Indian or Alaskan native; 116 (1%) Asian or Pacific Islander; 10,901 (55%) Black not of Hispanic Origin; 519 (3%) Hispanic; 7837 (39%) White not of Hispanic origin; 492 (2%) Unknown) were used (probably retrospectively collected). All cases were used to test the model. | Data Mining | Patient’s history | Preterm delivery | ROC neural net 0.64, custom classifier software 0.72 | 0.66 |
| Prema and Pushpalatha (2019) [69] | India | 124 | Preterm birth in pregnant women with diabetes mellitus or gestational diabetes mellitus was used. All cases were used to test the model. | ML, support vector machine (SVM) | Patient’s history | Preterm delivery, DM, GDM | 86% | NA |
| Elaveyini et al. (2011) [70] | India | 50 | A prospective cohort of pregnant women was used. There were 40 training cases and 10 testing cases. | Neural networks | Patient’s history | Preterm delivery | 70% | NA |
| Catley et al. (2006) [71] | Canada | 19710 | A prospective cohort of pregnant women, collected before 23 weeks of gestation, was used. They were split into 2/3 training cases and 1/3 test cases. | ANNs | Patient’s history | Preterm delivery | Eight-node high-risk PTB model 0.73 four-node high-risk PTB model with free-flow oxygen cases removed 0.72 | NA |
Predictors such as first trimester bleeding, preterm rupture of the membranes, polyhydramnios, oligohydramnios, the occurrence of infections, close spacing between pregnancies, histories of preterm delivery, and miscarriages played a crucial role in preterm delivery despite the frequently used clinical evaluation of patients and their comorbidities.
Out of all AI methods used, the RF performed well, with a sensitivity of 97%, a specificity of 85%, an area under the ROC curve of 94%, and a mean square error rate of 14% [61]. Prediction values for most of the studies were similar.
The eighth group includes two articles about predicting the delivery route (Table 9) [73,74]. The DT [73] and the backpropagation learning algorithm (ANN method) [74] were used.
Table 9.
Characteristics of included studies on delivery routes.
Table 9.
Characteristics of included studies on delivery routes.
| Study | Country | Sample Size | Population | Model | Knowledge Source for AI | Type of Risk | Prediction Value of AI/AUC | Prediction Value of LR |
|---|---|---|---|---|---|---|---|---|
| Beksac et al. (1996) [74] | Turkey | 7398 | There were retrospective analyses of pregnancies. There were 4451 (40.2%) training cases and 2947 (39.8%) testing cases. | ANN | Literature | Caesarian section rate | Positive predictive value 81.8%, negative predictive value 93.1% | NA |
| Caruana et al. (2003) [73] | United States | 22,175 | A sample of pregnant women was used to test the model (probably retrospective). | MML decision trees | Patient’s history | Caesarian Section | Test 87% (AUC 0.9233) | NA |
The predictors included maternal age, gravida, parity, gestational age at delivery, need for and kind of labor induction, baby’s presentation at birth, and maternal comorbidities. Again, ANNs performed better than ML, with a 97.5% specificity and a sensitivity of 60.9% [74].
The last group consists of five studies predicting other aspects of perinatal care (Table 10) [75,76,77,78,79].
Table 10.
Characteristics of other included studies.
Table 10.
Characteristics of other included studies.
| Study | Country | Sample Size | Population | Model | Knowledge Source for AI | Type of Risk | Prediction Value of AI/AUC | Prediction Value of LR |
|---|---|---|---|---|---|---|---|---|
| Paydar et al. (2017) [75] | Iran | 149 | There was a retrospective analysis across pregnant women with systemic lupus erythematosus. For MLP (neuronal network-multi-layer perceptron), 70% were training cases, 15% were validation cases, and 15% were testing data. For RBF (radial basis function), 70% were training cases and 30% were testing data. | CDSS (MLP, RBF) | Literature, specialist, patient’s history | High-risk pregnancy- (with SLE) | RBF 75.16%, MLP 90.6% | NA |
| Li et al. (2017) [76] | China | 358 | There was a case-control study of pregnant women (119 fetuses with congenital heart disease and 239 controls). It was split into 85%, or n = 300 (101 cases and 199 controls), training cases and 15%, or n = 58 (18 cases and 40 controls), test cases. | ANN − ANN + BPNN (backpropagation neural network) | Patient’s history, specialist | Congenital heart disease | Training 91%, testing 86% | NA |
| Grossi et al. (2016) [77] | Italy | 137 | There was a retrospective analysis of pregnant women (45 mothers of autistic children and 68 mothers of typically developing children). A total of 24 siblings of 19 autistic children were an internal control group. All cases were used to test the model. | Specialized ANNs (ANNs) | Interview of the mothers, literature, patient’s history | Autism | 80.2% | 46% |
| Valensise et al. (2006) [78] | Italy | 302 | There was a retrospective analysis of healthy post-term pregnancies (42 fetuses with labor distress and 260 without). All cases were used to test the model | ANN | Patient’s history | Fetal distress | Accuracy 86%, positive predictive value 53%, negative predictive value 92% | NA |
| Gao et al. (2019) [79] | United States | 45,858 | Electronic health record data of pregnant women were collected retrospectively. All cases were used to test the model. (NA if retrospectively or prospectively collected). | Observational medical outcomes partnership | Patient’s history, internet | Severe maternal morbidity. | M0 AUC 0.790, M1 AUC 0.919, M3 AUC 0.937 | NA |
Despite the group’s heterogeneity, the previous groups’ predictors were also used. For example, the studies described the prediction of pregnancy outcomes among women affected by SLE using a binary logistic regression model [75], and they described the prediction of congenital heart disease (CHD) among pregnant women [44], the frequency of 27 potential risk factors related to pregnancy and the perinatal period [77], and the identification of patients with the risk of fetal distress in labor using ANNs [78]. The application of ML was used to identify severe maternal morbidity (SMM) and relevant risk factors from electronic health records (EHRs) [79].
There were only a few of the most relevant prospective AI models tested on the representative samples [35,36,37,42,44,50,71]. Therefore, Neocleous et al. conducted three prospective studies on the prediction of fetal aneuploidy [35,36,37]. In those studies, the sample sizes were 51,208; 72,654; and 123,329, respectively. The most widely used ANN model (fully connected multilayer feed-forward structure—FCMLFF) was subsequently trained and tested to predict trisomy 21 and other aneuploidies. The model’s accuracy was assessed to be between 94 and 100% for trisomy 21 and 80–96% for other aneuploidies [35,36,37].
For preeclampsia assessment, Jhee et al. conducted a prospective study of 11,006 pregnant patients [42]. The machine learning model—decision trees (DTs), the naïve Bayes classification (NBC), the support vector machine (SVM), the random forest (RF), and stochastic gradient boosting (SGB) were subsequently trained and used. The predictive value of the DT was 84.7%, and it was 89.9% for the NBC, 89.2% for the SVM, 92.3% for the RF, and 97.3% for SGB [42].
Li et al. conducted a prospective study to predict the fetal growth restriction on a sample of 215568 pregnant women. The ML technique—the support vector machine (SVM)—and the random forest (RF) were trained and tested in comparison to logistic regression (LR) and sparse LR. The accuracy of the SVM was 92.4%, and it was 43.7% for C4.5, 61.2% for RF; 94.5% for sparse LR; the AUC for LR was 0.6 with 93% accuracy of the model [44].
Koivu et al. conducted a prospective study by including 16,340,661 pregnant women to predict early and late stillbirth as well as preterm delivery. The ANN models, deep NN (neuronal network), SELU N (scaled exponential linear units network), and LGBM (the light GBM—gradient boosting decision tree), were subsequently trained and tested in comparison to LR. The predictive values of those models measured with an AUC in early stillbirth prediction were 0.73 for deep NN, 0.75 for SELU N, and 0.75 for LGBM compared to 0.73 for LR. In late stillbirth prediction, the AUC values were 0.57 for deep NN, 0.59 for SELU N, and 0.6 for LGBM compared to 0.58 for LR. The values of preterm delivery prediction measured with AUC were 0.66 for deep NN, 0.67 for SELU N, and 0.67 for LGBM compared to 0.64 for LR [50]. In their study, Catley et al. showed the predictive accuracy of PTB occurrence (AUC 0.73) in a prospective cohort (N = 19710) using the Neural Network Toolkit [71].
4. Discussion
All of the presented works showed the potential of AI methods for improving risk assessment and predicting adverse perinatal outcomes. We found that AI techniques had high prediction values established at around 80–90%, which were better in comparison to logistic regression methods. However, this systematic review did not distinguish the best AI method, and further prospective studies should be performed. We suppose that there are two reasons for this. First, every perinatal complication has different risk factors and occurrences [80,81,82,83], and a comparison of each led to biases of the heterogeneity of the results. The other reason is that most of models were tested on small groups or were not proven prospectively.
Risk factors for PTO, primarily sociological and clinical indicators, the mother’s health, problems during pregnancy, comorbidities, laboratory values, and fetal monitoring parameters, were considered. However, many more characteristics might be taken into account to measure the overall risk of a pregnancy. Doing so would increase the model’s representativeness and accuracy, but it can be difficult to judge how beneficial this would be. Immunohistochemical and genetic predictors are two of the components that are typically not taken into account. Medical specialties like immunology and genetics have advanced extremely quickly, and these fields of study have produced the orphan molecules responsible for many illnesses. Therefore, combining genetic and immunohistochemistry predictors with the previously discussed socioeconomic, laboratory, and medical history components in AI models may improve their ability to predict outcomes.
Study construction and sample size are the most significant sources of bias in the included studies. There is a majority of retrospective studies or studies where the prospective or retrospective character is not indicated. Moreover, studies where the prospective analysis of patient records was made were often conducted on small samples. As a result, only a few studies provide robust evidence of AI accuracy [35,36,37,42,44,50,71]. Based on those studies, ANN models seem appropriate for extensive patient data in APO prediction.
The usage of AI in obstetrics is not close to being a gold standard. Therefore, this summary of AI application opportunities seems crucial to show the unused potential of these methods. The authors see the opportunity for AI application in daily routine medical challenges. For example, the AI techniques’ predictive value could be used during the first assessment of a pregnant woman or even when planning the pregnancy or on the perinatology department to determine the delivery timing. Gathering the potential risk factors and using trained and validated software could lead to very early diagnosis of complications or even their prevention, for example, in patients with GDM during pregnancy [52,53]. Today’s decisions are made according to the experience and knowledge of the medical practitioners whose input in medical diagnoses and procedures is not questionable. Nevertheless, human brains are not able to proceed large prospective study data to calculate the exact risk factor in every medical case. We supposed that the digital software could help to increase medical condition prediction.
There are reports of AI applications using mobile software [84,85]. Telemedicine was applied to inform patients about their condition and gestational diabetes state. AI tools for patient examination, hospital monitoring, or everyday clinical routine could improve healthcare results. Pregnant women often underestimate their health status and do not report everything to their medical care providers [86,87]. Combining AI and telemedicine software could help medical care providers assess real-time risks and threats to pregnant women, as it works, for example, in cardiology or diabetology [88,89,90]. As previously mentioned, such information could avoid many unwanted adverse medical conditions.
This study had several limitations. One of them was a problem with synthesis because of the heterogeneity of the reported results. Therefore, several deviations into the groups were made to approximate the similar outcomes of the assessed studies. Unfortunately, this was insufficient because of methodological differences and significantly different AI methods. As a result, only AI applications with a calculated LR were quantitively synthesized. Moreover, the heterogeneity of the APO prediction reporting could have an impact on reported results. The detailed assessment of each AI method could provide the readers with the information needed to apply the AI methods in praxis. Nevertheless, there were not enough studies on the same quality level (prospective with large patient groups) according to the same complication. Therefore, more prospective studies could conclude the best AI method.
The strength of this study was its novel character. There are no published studies comparing the usage of artificial intelligence methods to predict perinatology complication occurrences.
This systematic review described AI’s application in predicting pregnancy complications, which is one of this study’s biggest strengths. It gave a broad overview of the different factors and diseases to which AI can be applied [1,16].
5. Conclusions
The application of AI methods as a digital software can help medical practitioners in their everyday practice in pregnancy risk assessment. Decision making supported by technology could eliminate the mistakes made because of the imperfect human brain. Based on published studies, models that used ANNs and were tested on large prospective data could be applied in APO prediction. Nevertheless, further studies could identify new methods with even better prediction potential.
Supplementary Materials
The following supporting information can be downloaded at: https://www.mdpi.com/article/10.3390/healthcare10112164/s1, Table S1. PRISMA checklist.
Funding
This research did not receive any specific grant from public, commercial, or not-for-profit funding agencies.
Institutional Review Board Statement
This study was conducted in accordance with the Declaration of Helsinki.
Informed Consent Statement
Not applicable.
Data Availability Statement
Not applicable.
Conflicts of Interest
The authors declare that they have no known competing financial interests or personal relationships that could have appeared to influence the work reported in this paper.
References
- Hamet, P.; Tremblay, J. Artificial Intelligence in Medicine. Metabolism 2017, 69, S36–S40. [Google Scholar] [CrossRef] [PubMed]
- Cornet, G. Chapter 4. Robot companions and ethics: A pragmatic approach of ethical design. J. Int. De Bioéthique 2013, 24, 49. [Google Scholar] [CrossRef] [PubMed]
- Nicolaides, K.H. Turning the Pyramid of Prenatal Care. Fetal Diagn. Ther. 2011, 29, 183–196. [Google Scholar] [CrossRef] [PubMed]
- Kwiatkowski, S.; Borowski, D.; Kajdy, A.; Poon, L.C.; Rokita, W.; Wielgos, M. Why We Should Not Stop Giving Aspirin to Pregnant Women during the COVID-19 Pandemic. Ultrasound Obstet. Gynecol. 2020, 55, 841–843. [Google Scholar] [CrossRef] [PubMed]
- Ginsberg, N.A.; Levine, E.M. Impact of Aspirin on Preeclampsia. Am. J. Obstet. Gynecol. 2020, 224, 544–545. [Google Scholar] [CrossRef]
- Huai, J.; Lin, L.; Juan, J.; Chen, J.; Li, B.; Zhu, Y.; Yu, M.; Yang, H. Preventive Effect of Aspirin on Preeclampsia in High-Risk Pregnant Women with Stage 1 Hypertension. J. Clin. Hypertens 2021, 23, 1060–1067. [Google Scholar] [CrossRef]
- Norman, J.E. Progesterone and Preterm Birth. Int. J. Gynaecol. Obstet. 2020, 150, 24–30. [Google Scholar] [CrossRef]
- Mohsenzadeh-Ledari, F.; Taghizadeh, Z.; Keramat, A.; Moosazadeh, M.; Yazdani, S.; Najafi, A.; Motaghi, Z. The Effect of Caring Intervention (Physical Activity, Diet and Counseling) on Gestational Diabetes for Pregnant Women with Metabolic Syndrome. J. Matern. Fetal. Neonatal Med. 2020, 35, 4168–4174. [Google Scholar] [CrossRef]
- Gardosi, J.; Giddings, S.; Clifford, S.; Wood, L.; Francis, A. Association between Reduced Stillbirth Rates in England and Regional Uptake of Accreditation Training in Customised Fetal Growth Assessment. BMJ Open 2013, 3, e003942. [Google Scholar] [CrossRef]
- Jones, O.T.; Calanzani, N.; Saji, S.; Duffy, S.W.; Emery, J.; Hamilton, W.; Singh, H.; de Wit, N.J.; Walter, F.M. Artificial Intelligence Techniques That May Be Applied to Primary Care Data to Facilitate Earlier Diagnosis of Cancer: Systematic Review. J. Med. Internet Res. 2021, 23, e23483. [Google Scholar] [CrossRef]
- Maassen, O.; Fritsch, S.; Palm, J.; Deffge, S.; Kunze, J.; Marx, G.; Riedel, M.; Schuppert, A.; Bickenbach, J. Future Medical Artificial Intelligence Application Requirements and Expectations of Physicians in German University Hospitals: Web-Based Survey. J. Med. Internet Res. 2021, 23, e26646. [Google Scholar] [CrossRef] [PubMed]
- Tsoi, K.; Yiu, K.; Lee, H.; Cheng, H.-M.; Wang, T.-D.; Tay, J.-C.; Teo, B.W.; Turana, Y.; Soenarta, A.A.; Sogunuru, G.P.; et al. Applications of Artificial Intelligence for Hypertension Management. J. Clin. Hypertens 2021, 23, 568–574. [Google Scholar] [CrossRef] [PubMed]
- Cui, M.; Zhang, D.Y. Artificial Intelligence and Computational Pathology. Lab. Investig. 2021, 101, 412–422. [Google Scholar] [CrossRef] [PubMed]
- Nicolaides, K.H. Screening for Fetal Aneuploidies at 11 to 13 Weeks. Prenat. Diagn. 2011, 31, 7–15. [Google Scholar] [CrossRef]
- Boutin, A.; Demers, S.; Gasse, C.; Giguère, Y.; Tétu, A.; Laforest, G.; Bujold, E. First Trimester Screening for Fetal Aneuploidies Using Placental Growth Factor: The Great Obstetrical Syndrome (GOS) Study. J. Obstet. Gynaecol. Can. 2018, 40, 1044–1049. [Google Scholar] [CrossRef]
- Ramesh, A.N.; Kambhampati, C.; Monson, J.R.T.; Drew, P.J. Artificial Intelligence in Medicine. Ann. R. Coll. Surg. Engl. 2004, 86, 334–338. [Google Scholar] [CrossRef]
- Lee, S.S.F.; Sun, L.; Kustra, R.; Bull, S.B. EM-Random Forest and New Measures of Variable Importance for Multi-Locus Quantitative Trait Linkage Analysis. Bioinformatics 2008, 24, 1603–1610. [Google Scholar] [CrossRef]
- Kwok, J.Y. Moderating the Outputs of Support Vector Machine Classifiers. IEEE Trans. Neural Netw. 1999, 10, 1018–1031. [Google Scholar] [CrossRef]
- Dattatreya, G.R.; Sarma, V.V. Bayesian and Decision Tree Approaches for Pattern Recognition Including Feature Measurement Costs. IEEE Trans. Pattern Anal. Mach. Intell. 1981, 3, 293–298. [Google Scholar] [CrossRef]
- Amari, S.; Wu, S. Improving Support Vector Machine Classifiers by Modifying Kernel Functions. Neural Netw. 1999, 12, 783–789. [Google Scholar] [CrossRef]
- Aspinall, M.J. Use of a Decision Tree to Improve Accuracy of Diagnosis. Nurs. Res. 1979, 28, 182–185. [Google Scholar] [CrossRef]
- Neto, M.P.; Paulovich, F.V. Explainable Matrix—Visualization for Global and Local Interpretability of Random Forest Classification Ensembles. IEEE Trans. Vis. Comput. Graph. 2021, 27, 1427–1437. [Google Scholar] [CrossRef] [PubMed]
- Nikoloulopoulos, A.K. A Multivariate Logistic Regression. Biostatistics 2012, 13, 1–3. [Google Scholar] [CrossRef]
- Brunner, H.I.; Giannini, E.H. Chapter 7—Trial Design, Measurement, and Analysis of Clinical Investigations. In Textbook of Pediatric Rheumatology, 6th ed.; Cassidy, J.T., Laxer, R.M., Petty, R.E., Lindsley, C.B., Eds.; W.B. Saunders: Philadelphia, Pennsylvania, 2011; pp. 127–156. ISBN 978-1-4160-6581-4. [Google Scholar]
- O’Brien, S.M.; Dunson, D.B. Bayesian Multivariate Logistic Regression. Biometrics 2004, 60, 739–746. [Google Scholar] [CrossRef] [PubMed]
- Moher, D.; Liberati, A.; Tetzlaff, J.; Altman, D.G.; PRISMA Group. Preferred Reporting Items for Systematic Reviews and Meta-Analyses: The PRISMA Statement. PLoS Med. 2009, 6, e1000097. [Google Scholar] [CrossRef] [PubMed]
- Feduniw, S.; Sys, D.; Kwiatkowski, S.; Kajdy, A. Application of Artificial Intelligence in Screening for Adverse Perinatal Outcomes: A Protocol for Systematic Review. Medicine 2020, 99, e23681. [Google Scholar] [CrossRef]
- Liberati, A.; Altman, D.G.; Tetzlaff, J.; Mulrow, C.; Gøtzsche, P.C.; Ioannidis, J.P.A.; Clarke, M.; Devereaux, P.J.; Kleijnen, J.; Moher, D. The PRISMA Statement for Reporting Systematic Reviews and Meta-Analyses of Studies That Evaluate Health Care Interventions: Explanation and Elaboration. PLOS Med. 2009, 6, e1000100. [Google Scholar] [CrossRef]
- Margulis, A.V.; Pladevall, M.; Riera-Guardia, N.; Varas-Lorenzo, C.; Hazell, L.; Berkman, N.D.; Viswanathan, M.; Perez-Gutthann, S. Quality Assessment of Observational Studies in a Drug-Safety Systematic Review, Comparison of Two Tools: The Newcastle-Ottawa Scale and the RTI Item Bank. Clin. Epidemiol. 2014, 6, 359–368. [Google Scholar] [CrossRef]
- Gorthi, A.; Firtion, C.; Vepa, J. Automated Risk Assessment Tool for Pregnancy Care. In Proceedings of the EMBC 2009: 31st Annual International Conference of the IEEE Engineering in Medicine and Biology Society: Engineering the Future of Biomedicine, Minneapolis, MN, USA, 3–6 September 2009; pp. 6222–6225. [Google Scholar] [CrossRef]
- Umoh, U.; Nyoho, E. A Fuzzy Intelligent Framework for Healthcare Diagnosis and Monitoring of Pregnancy Risk Factor in Women. J. Health. Med. Nurs. 2015, 18, 97–113. [Google Scholar]
- Fernandes, Y.Y.M.P.; De Araújo, G.T.; De Araújo, B.G.; Dantas, M.D.C.R.; De Carvalho, D.R.; Valentim, R.A.D.M. ILITIA: Telehealth Architecture for High-Risk Gestation Classification. Res. Biomed. Eng. 2017, 33, 237–246. [Google Scholar] [CrossRef][Green Version]
- Sharmilan, S.; Chaminda, H.T. Pregnancy Complications Diagnosis Using Predictive Data Mining. In Proceedings of the International Conference on Innovations in Info-business and Technology, Colombo, Sri Lanka, 4 March 2016; p. 5. [Google Scholar]
- Moreira, M.W.L.; Rodrigues, J.J.P.C.; Kumar, N.; Al-Muhtadi, J.; Korotaev, V. Nature-Inspired Algorithm for Training Multilayer Perceptron Networks in e-Health Environments for High-Risk Pregnancy Care. J. Med. Syst. 2018, 42, 51. [Google Scholar] [CrossRef] [PubMed]
- Neocleous, A.C.; Nicolaides, K.H.; Schizas, C.N. Intelligent Noninvasive Diagnosis of Aneuploidy: Raw Values and Highly Imbalanced Dataset. IEEE J. Biomed. Health Inform. 2017, 21, 1271–1279. [Google Scholar] [CrossRef] [PubMed]
- Neocleous, A.C.; Nicolaides, K.H.; Schizas, C.N. First Trimester Noninvasive Prenatal Diagnosis: A Computational Intelligence Approach. IEEE J. Biomed. Health Inform. 2016, 20, 1427–1438. [Google Scholar] [CrossRef]
- Neocleous, A.C.; Syngelaki, A.; Nicolaides, K.H.; Schizas, C.N. Two-Stage Approach for Risk Estimation of Fetal Trisomy 21 and Other Aneuploidies Using Computational Intelligence Systems. Ultrasound Obstet. Gynecol. 2018, 51, 503–508. [Google Scholar] [CrossRef]
- Akbulut, A.; Ertugrul, E.; Topcu, V. Fetal Health Status Prediction Based on Maternal Clinical History Using Machine Learning Techniques. Comput. Methods Programs Biomed. 2018, 163, 87–100. [Google Scholar] [CrossRef] [PubMed]
- Robinson, C.J.; Hill, E.G.; Alanis, M.C.; Chang, E.Y.; Johnson, D.D.; Almeida, J.S. Examining the Effect of Maternal Obesity on Outcome of Labor Induction in Patients with Preeclampsia. Hypertens. Pregnancy 2010, 29, 446–456. [Google Scholar] [CrossRef] [PubMed][Green Version]
- Moreira, M.W.L.; Rodrigues, J.J.P.C.; Al-Muhtadi, J.; Korotaev, V.V.; de Albuquerque, V.H.C. Neuro-Fuzzy Model for HELLP Syndrome Prediction in Mobile Cloud Computing Environments. Concurr. Comput. 2018, 33, 1-1. [Google Scholar] [CrossRef]
- Nair, T.M. Statistical and Artificial Neural Network-Based Analysis to Understand Complexity and Heterogeneity in Preeclampsia. Comput. Biol. Chem. 2018, 75, 222–230. [Google Scholar] [CrossRef]
- Jhee, J.H.; Lee, S.; Park, Y.; Lee, S.E.; Kim, Y.A.; Kang, S.W.; Kwon, J.Y.; Park, J.T. Prediction Model Development of Late-Onset Preeclampsia Using Machine Learning-Based Methods. PLoS ONE 2019, 14, e0221202. [Google Scholar] [CrossRef]
- Mello, G.; Parretti, E.; Ognibene, A.; Mecacci, F.; Cioni, R.; Scarselli, G.; Messeri, G. Prediction of the Development of Pregnancy-Induced Hypertensive Disorders in High-Risk Pregnant Women by Artificial Neural Networks. Clin. Chem. Lab. Med. 2001, 39, 801–805. [Google Scholar] [CrossRef]
- Li, J.; Liu, L.; Sun, J.-J.; Haowen, M.; Yang, J.-J.; Chen, S.; Liu, H.; Wang, Q.; Pan, H. Comparison of Different Machine Learning Approaches to Predict Small for Gestational Age Infants. IEEE Trans. Big Data 2016, 6, 334–346. [Google Scholar] [CrossRef]
- Kuhle, S.; Maguire, B.; Zhang, H.; Hamilton, D.; Allen, A.C.; Joseph, K.S.; Allen, V.M. Comparison of Logistic Regression with Machine Learning Methods for the Prediction of Fetal Growth Abnormalities: A Retrospective Cohort Study. BMC Pregnancy Childbirth 2018, 18, 333. [Google Scholar] [CrossRef] [PubMed]
- Moreira, M.W.L.; Rodrigues, J.J.P.C.; Furtado, V.; Mavromoustakis, C.X.; Kumar, N.; Woungang, I. Fetal Birth Weight Estimation in High-Risk Pregnancies Through Machine Learning Techniques. In Proceedings of the IEEE International Conference on Communications, Shanghai, China, 20–24 May 2019; Institute of Electrical and Electronics Engineers Inc.: Interlaken, Switzerland. [Google Scholar]
- Naimi, A.I.; Platt, R.W.; Larkin, J.C. Machine Learning for Fetal Growth Prediction. Epidemiology 2018, 29, 290–298. [Google Scholar] [CrossRef] [PubMed]
- Kayode, G.A.; Grobbee, D.E.; Amoakoh-Coleman, M.; Adeleke, I.T.; Ansah, E.; de Groot, J.A.H.; Klipstein-Grobusch, K. Predicting Stillbirth in a Low Resource Setting. BMC Pregnancy Childbirth 2016, 16, 274. [Google Scholar] [CrossRef] [PubMed]
- Hariharan, R.; He, P.; Meseguer, M.; Toschi, M.; Rocha, J.C.; Zaninovic, N.; Malmsten, J.; Zhan, Q.; Hickman, C. Artificial Intelligence Assessment of Time-Lapse Images Can Predict with 77% Accuracy Whether a Human Embryo Capable of Achieving a Pregnancy Will Miscarry. Fertil. Steril. 2019, 112, e38–e39. [Google Scholar] [CrossRef]
- Koivu, A.; Sairanen, M. Predicting Risk of Stillbirth and Preterm Pregnancies with Machine Learning. Health Inf. Sci. Syst. 2020, 8, 14. [Google Scholar] [CrossRef]
- Malacova, E.; Tippaya, S.; Bailey, H.D.; Chai, K.; Farrant, B.M.; Gebremedhin, A.T.; Leonard, H.; Marinovich, M.L.; Nassar, N.; Phatak, A.; et al. Stillbirth Risk Prediction Using Machine Learning for a Large Cohort of Births from Western Australia, 1980–2015. Sci. Rep. 2020, 10, 5354. [Google Scholar] [CrossRef] [PubMed]
- Artzi, N.S.; Shilo, S.; Hadar, E.; Rossman, H.; Barbash-Hazan, S.; Ben-Haroush, A.; Balicer, R.D.; Feldman, B.; Wiznitzer, A.; Segal, E. Prediction of Gestational Diabetes Based on Nationwide Electronic Health Records. Nat. Med. 2020, 26, 71–76. [Google Scholar] [CrossRef]
- Moreira, M.W.L.; Rodrigues, J.J.P.C.; Kumar, N.; Al-Muhtadi, J.; Korotaev, V. Evolutionary Radial Basis Function Network for Gestational Diabetes Data Analytics. J. Comput. Sci. 2018, 27, 410–417. [Google Scholar] [CrossRef]
- Moreira, M.W.L.; Rodrigues, J.J.P.C.; Kumar, N.; Niu, J.; Sangaiah, A.K. Multilayer Perceptron Application for Diabetes Mellitus Prediction in Pregnancy Care. In Lecture Notes in Electrical Engineering; Springer: Berlin, Germany, 2018; Volume 464, pp. 200–209. [Google Scholar]
- Shanker, M.S. Using Neural Networks to Predict the Onset of Diabetes Mellitus. J. Chem. Inf. Comput. Sci. 1996, 36, 35–41. [Google Scholar] [CrossRef]
- Polak, S.; Mendyk, A. Artificial Intelligence Technology as a Tool for Initial GDM Screening. Expert Syst. Appl. 2004, 26, 455–460. [Google Scholar] [CrossRef]
- Kang, X.; Liang, Y.; Wang, S.; Hua, T.; Cui, J.; Zhang, M.; Ding, Y.; Chen, L.; Xiao, J. Prediction Model Comparison for Gestational Diabetes Mellitus with Macrosomia Based on Risk Factor Investigation. J. Matern.-Fetal Neonatal Med. 2019, 34, 2481–2490. [Google Scholar] [CrossRef]
- Nanda, S.; Savvidou, M.; Syngelaki, A.; Akolekar, R.; Nicolaides, K.H. Prediction of Gestational Diabetes Mellitus by Maternal Factors and Biomarkers at 11 to 13 Weeks. Prenat. Diagn. 2011, 31, 135–141. [Google Scholar] [CrossRef] [PubMed]
- Pourahmad, S.; Hamdami, E.; Vaziri, F.; Bazrafshan, K. A Comparison of the Effective Factors of Preterm Birth versus Low Birth Weight in Southern Iran Using Artificial Neural Network. Int. J. Womens Health Reprod. Sci. 2017, 5, 55–59. [Google Scholar] [CrossRef]
- Weber, A.; Darmstadt, G.L.; Gruber, S.; Foeller, M.E.; Carmichael, S.L.; Stevenson, D.K.; Shaw, G.M. Application of Machine-Learning to Predict Early Spontaneous Preterm Birth among Nulliparous Non-Hispanic Black and White Women. Ann. Epidemiol. 2018, 28, 783–789.e1. [Google Scholar] [CrossRef] [PubMed]
- Idowu, I.O.; Fergus, P.; Hussain, A.; Dobbins, C.; Khalaf, M.; Eslava, R.V.C.; Keight, R. Artificial Intelligence for Detecting Preterm Uterine Activity in Gynacology and Obstertric Care. In Proceedings of the 2015 IEEE International Conference on Computer and Information Technology; Ubiquitous Computing and Communications; Dependable, Autonomic and Secure Computing; Pervasive Intelligence and Computing, Liverpool, UK, 26–28 October 2015; pp. 215–220. [Google Scholar] [CrossRef]
- Woolery, L.K.; Jerzy, G.B. Machine Learning for an Expert System to Predict Preterm Birth Risk. J. Am. Med. Inform. Assoc. 1994, 1, 439–446. [Google Scholar] [CrossRef]
- Fergus, P.; Cheung, P.; Hussain, A.; Al-Jumeily, D.; Dobbins, C.; Iram, S. Prediction of Preterm Deliveries from EHG Signals Using Machine Learning. PLoS ONE 2013, 8, e77154. [Google Scholar] [CrossRef]
- Courtney, K.L.; Stewart, S.; Popescu, M.; Goodwin, L.K. Predictors of Preterm Birth in Birth Certificate Data. Stud. Health Technol. Inform. 2008, 136, 555–560. [Google Scholar]
- Nodelman, E.; Molitoris, J.; Holbert, M. 543: Using Artificial Intelligence to Predict Spontaneous Preterm Delivery. Am. J. Obstet. Gynecol. 2020, 222, S350. [Google Scholar] [CrossRef]
- Bahado-Singh, R.O.; Sonek, J.; McKenna, D.; Cool, D.; Aydas, B.; Turkoglu, O.; Bjorndahl, T.; Mandal, R.; Wishart, D.; Friedman, P.; et al. Artificial Intelligence and Amniotic Fluid Multiomics: Prediction of Perinatal Outcome in Asymptomatic Women with Short Cervix. Ultrasound Obstet. Gynecol. 2019, 54, 110–118. [Google Scholar] [CrossRef]
- Lee, K.S.; Ahn, K.H. Artificial Neural Network Analysis of Spontaneous Preterm Labor and Birth and Its Major Determinants. J. Korean Med. Sci. 2019, 34, e128. [Google Scholar] [CrossRef]
- Goodwin, L.K.; Iannacchione, M.A.; Hammond, W.E.; Crockett, P.; Maher, S.; Schlitz, K. Data Mining Methods Find Demographic Predictors of Preterm Birth. Nurs. Res. 2001, 50, 340–345. [Google Scholar] [CrossRef] [PubMed]
- Prema, N.S.; Pushpalatha, M.P. Machine Learning Approach for Preterm Birth Prediction Based on Maternal Chronic Conditions. In Lecture Notes in Electrical Engineering; Springer: Berlin, Germany, 2019; Volume 545, pp. 581–588. [Google Scholar]
- Elaveyini, U.; Devi, S.P.; Rao, K.S. Neural Networks Prediction of Preterm Delivery with First Trimester Bleeding. Arch. Gynecol. Obstet. 2011, 283, 971–979. [Google Scholar] [CrossRef]
- Catley, C.; Frize, M.; Walker, C.R.; Petriu, D.C. Predicting High-Risk Preterm Birth Using Artificial Neural Networks. IEEE Trans. Inf. Technol. Biomed. 2006, 10, 540–549. [Google Scholar] [CrossRef] [PubMed]
- Moreira, M.W.L.; Rodrigues, J.J.P.C.; Marcondes, G.A.B.; Neto, A.J.V.; Kumar, N.; Diez, I.D.L.T. A Preterm Birth Risk Prediction System for Mobile Health Applications Based on the Support Vector Machine Algorithm. In Proceedings of the IEEE International Conference on Communications, Shanghai, China, 20–24 May 2018; Institute of Electrical and Electronics Engineers Inc.: Interlaken, Switzerland. [Google Scholar]
- Caruana, R.; Niculescu, R.S.; Rao, R.B.; Simms, C. Evaluating the C-Section Rate of Different Physician Practices: Using Machine Learning to Model Standard Practice. AMIA Symp. 2003, 2003, 135–139. [Google Scholar]
- Beksac, M.S.; Tanacan, A.; Bacak, H.O.; Leblebicioglu, K. Computerized Prediction System for the Route of Delivery (Vaginal Birth versus Cesarean Section). J. Perinat. Med. 2018, 46, 881–884. [Google Scholar] [CrossRef]
- Paydar, K.; Niakan Kalhori, S.R.; Akbarian, M.; Sheikhtaheri, A. A Clinical Decision Support System for Prediction of Pregnancy Outcome in Pregnant Women with Systemic Lupus Erythematosus. Int. J. Med. Inform. 2017, 97, 239–246. [Google Scholar] [CrossRef] [PubMed]
- Li, H.; Luo, M.; Zheng, J.; Luo, J.; Zeng, R.; Feng, N.; Du, Q.; Fang, J. An Artificial Neural Network Prediction Model of Congenital Heart Disease Based on Risk Factors A Hospital-Based Case-Control Study. Medicine 2017, 96, e6090. [Google Scholar] [CrossRef]
- Grossi, E.; Veggo, F.; Narzisi, A.; Compare, A.; Muratori, F. Pregnancy Risk Factors in Autism: A Pilot Study with Artificial Neural Networks. Pediatric Res. 2016, 79, 339–347. [Google Scholar] [CrossRef]
- Valensise, H.; Facchinetti, F.; Vasapollo, B.; Giannini, F.; Monte, I.D.; Arduini, D. The Computerized Fetal Heart Rate Analysis in Post-Term Pregnancy Identifies Patients at Risk for Fetal Distress in Labour. Eur. J. Obstet. Gynecol. Reprod. Biol. 2006, 125, 185–192. [Google Scholar] [CrossRef]
- Gao, C.; Osmundson, S.; Yan, X.; Edwards, D.V.; Malin, B.A.; Chen, Y. Learning to Identify Severe Maternal Morbidity from Electronic Health Records. In Studies in Health Technology and Informatics; IOS Press: Amsterdam, The Netherlands, 2019; Volume 264, pp. 143–147. [Google Scholar]
- Zhao, D.; Yuan, S.; Ma, Y.; An, Y.X.; Yang, Y.X.; Yang, J.K. Associations of Maternal Hyperglycemia in the Second and Third Trimesters of Pregnancy with Prematurity. Medicine 2020, 99, e19663. [Google Scholar] [CrossRef] [PubMed]
- Kajdy, A.; Modzelewski, J.; Herman, K.; Muzyka-Placzynska, K.; Rabijewski, M. Growth Charts and Prediction of Abnormal Growth—What Is Known, What Is Not Known and What Is Misunderstood. Ginekol. Polska 2019, 90, 717–721. [Google Scholar] [CrossRef] [PubMed]
- Dumitrascu-Biris, D.; Nzelu, D.; Dassios, T.; Nicolaides, K.; Kametas, N.A. Chronic Hypertension in Pregnancy Stratified by First Trimester Blood Pressure Control and Adverse Perinatal Outcomes: A Prospective Observational Study. Acta Obstet. Gynecol. Scand. 2021, 100, 1297–1304. [Google Scholar] [CrossRef] [PubMed]
- Porto, L.; Aviram, A.; Jackson, R.; Carson, M.; Melamed, N.; Barrett, J.; Mei-Dan, E. Lateral Placentation and Adverse Perinatal Outcomes. Placenta 2020, 101, 1–3. [Google Scholar] [CrossRef] [PubMed]
- Kruk, M.E.; Kujawski, S.; Moyer, C.A.; Adanu, R.M.; Afsana, K.; Cohen, J.; Glassman, A.; Labrique, A.; Reddy, K.S.; Yamey, G. Next Generation Maternal Health: External Shocks and Health-System Innovations. Lancet 2016, 388, 2296–2306. [Google Scholar] [CrossRef]
- Davidson, L.; Boland, M.R. Towards Deep Phenotyping Pregnancy: A Systematic Review on Artificial Intelligence and Machine Learning Methods to Improve Pregnancy Outcomes. Brief. Bioinform. 2021, 22, bbaa369. [Google Scholar] [CrossRef]
- Kosan, Z.; Kavuncuoglu, D.; Calıkoglu, E.O.; Aras, A. Delivery Preferences of Pregnant Women: Do Not Underestimate the Effect of Friends and Relatives. J. Gynecol. Obstet. Hum. Reprod. 2019, 48, 395–400. [Google Scholar] [CrossRef]
- Londeree, J.; Nguyen, N.; Nguyen, L.H.; Tran, D.H.; Gallo, M.F. Underestimation of Pregnancy Risk among Women in Vietnam. BMC Womens Health 2020, 20, 159. [Google Scholar] [CrossRef]
- Bayoumy, K.; Gaber, M.; Elshafeey, A.; Mhaimeed, O.; Dineen, E.H.; Marvel, F.A.; Martin, S.S.; Muse, E.D.; Turakhia, M.P.; Tarakji, K.G.; et al. Smart Wearable Devices in Cardiovascular Care: Where We Are and How to Move Forward. Nat. Rev. Cardiol. 2021, 18, 581–599. [Google Scholar] [CrossRef]
- Zhang, W.; Cheng, B.; Zhu, W.; Huang, X.; Shen, C. Effect of Telemedicine on Quality of Care in Patients with Coexisting Hypertension and Diabetes: A Systematic Review and Meta-Analysis. Telemed. e-Health 2020, 27, 603–614. [Google Scholar] [CrossRef]
- Eberle, C.; Stichling, S. Clinical Improvements by Telemedicine Interventions Managing Type 1 and Type 2 Diabetes: Systematic Meta-Review. J. Med. Internet Res. 2021, 23, e23244. [Google Scholar] [CrossRef] [PubMed]
Publisher’s Note: MDPI stays neutral with regard to jurisdictional claims in published maps and institutional affiliations. |
© 2022 by the authors. Licensee MDPI, Basel, Switzerland. This article is an open access article distributed under the terms and conditions of the Creative Commons Attribution (CC BY) license (https://creativecommons.org/licenses/by/4.0/).