
Cervical Cancer Diagnosis Using an Integrated System of Principal Component Analysis, Genetic Algorithm, and Multilayer Perceptron

Abstract
:1. Introduction
2. Related Literature
3. Contribution
4. Research Methodology
4.1. Dataset Description and Data Preprocessing
4.2. Feature Selection and Principal Component Analysis
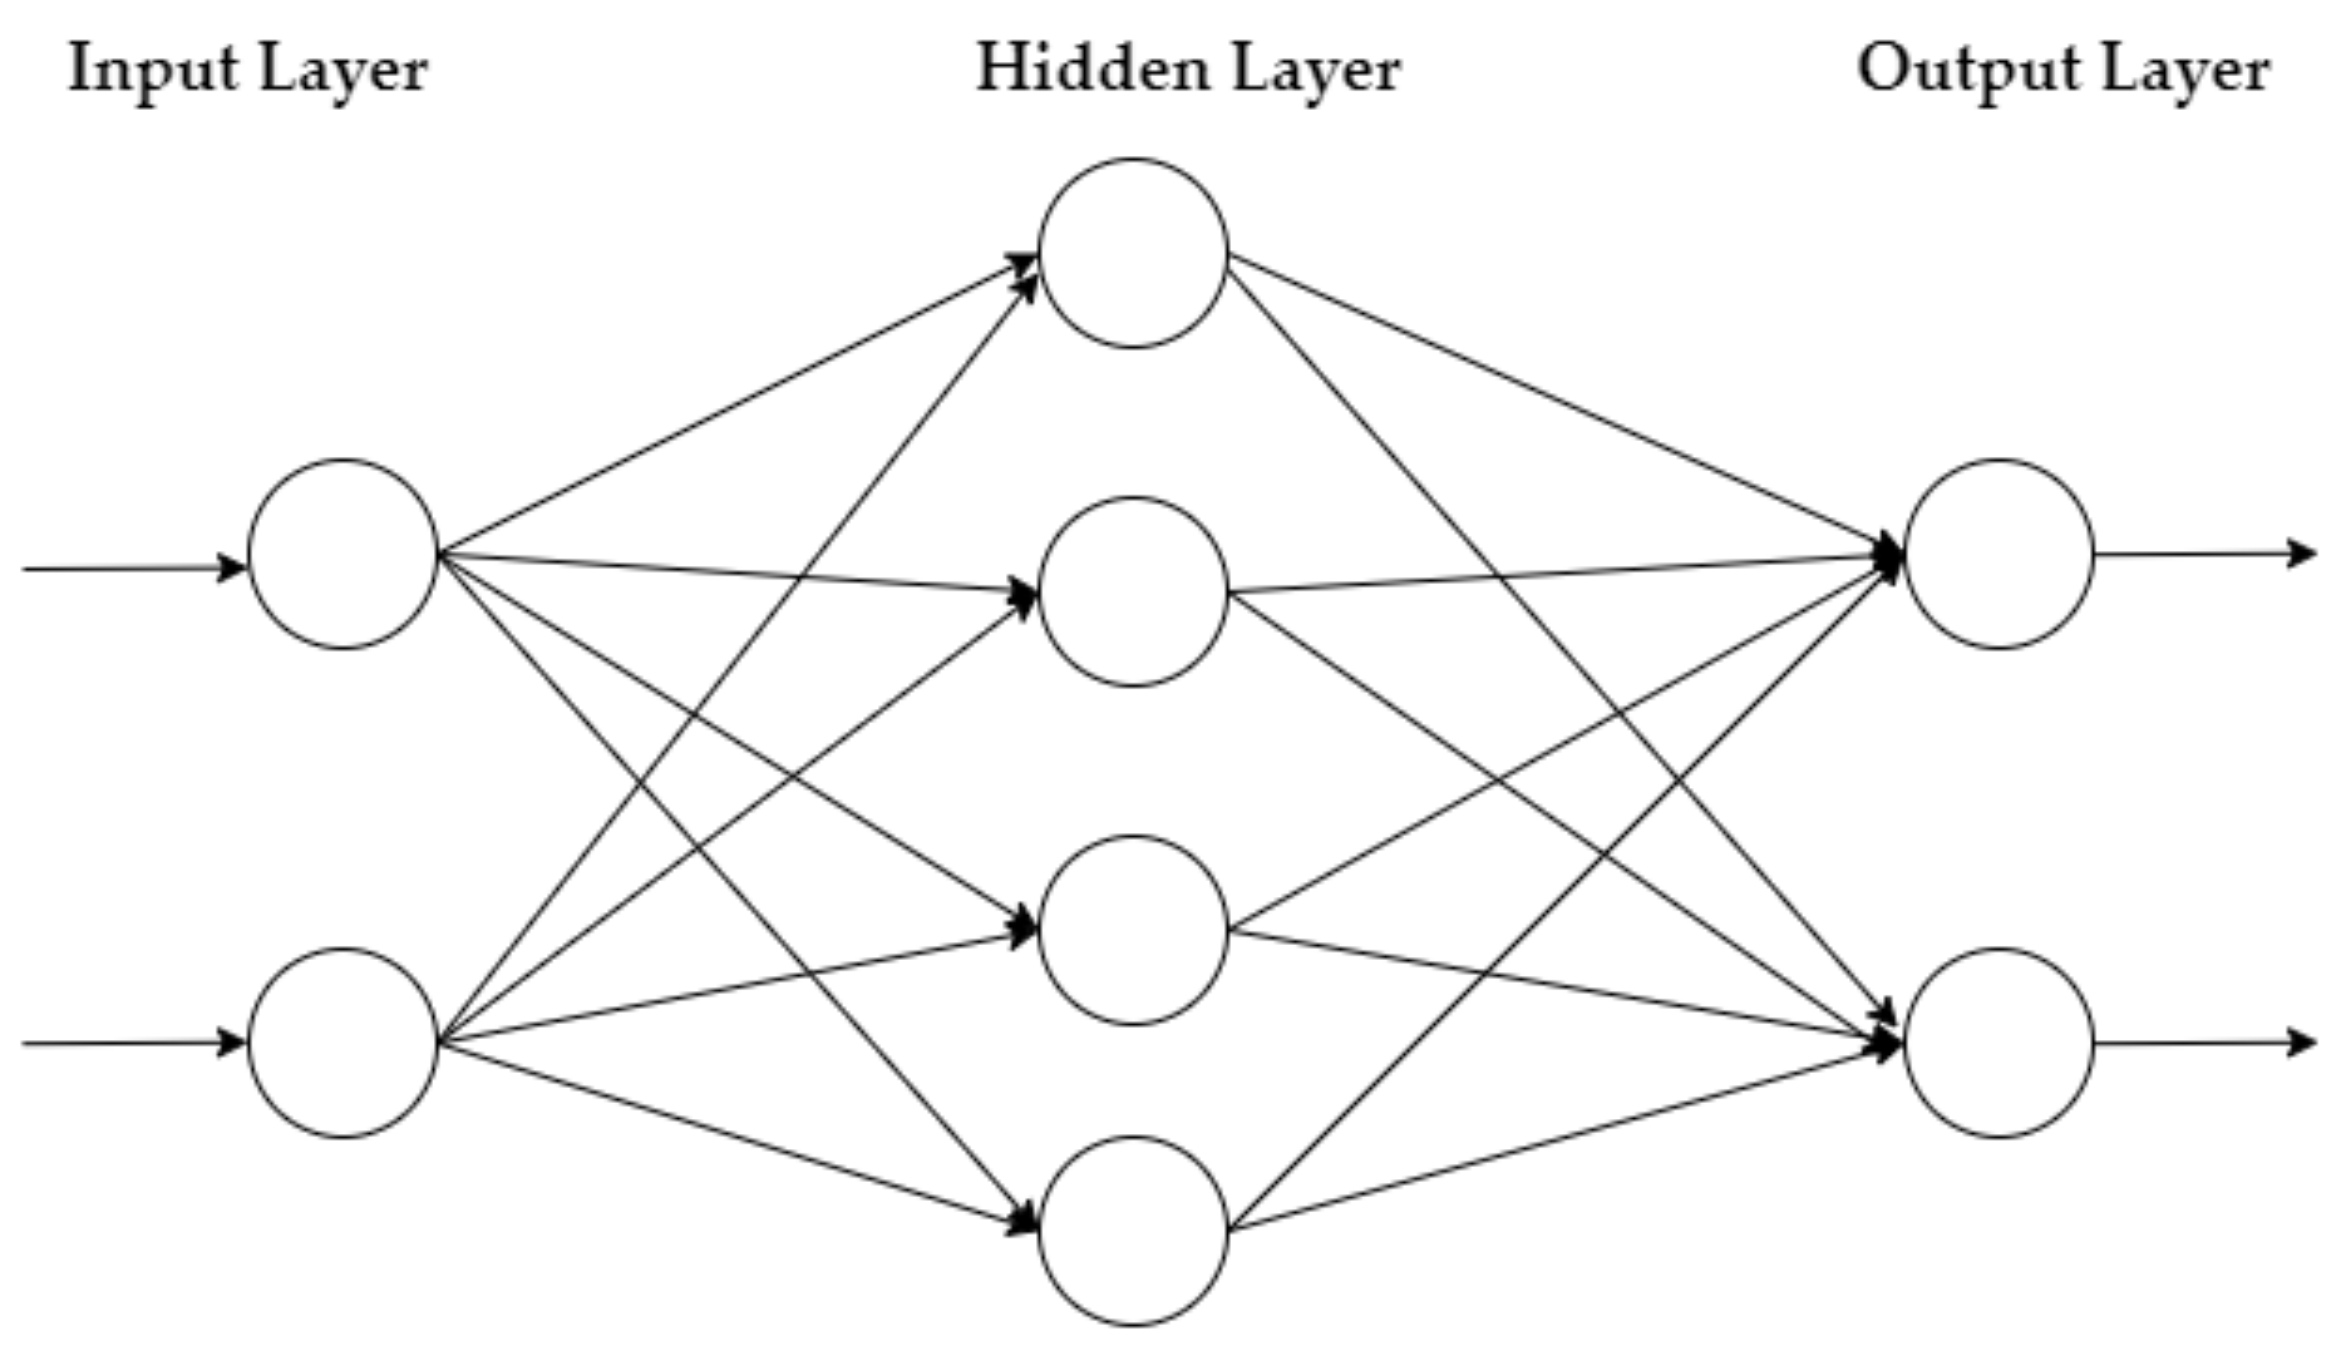
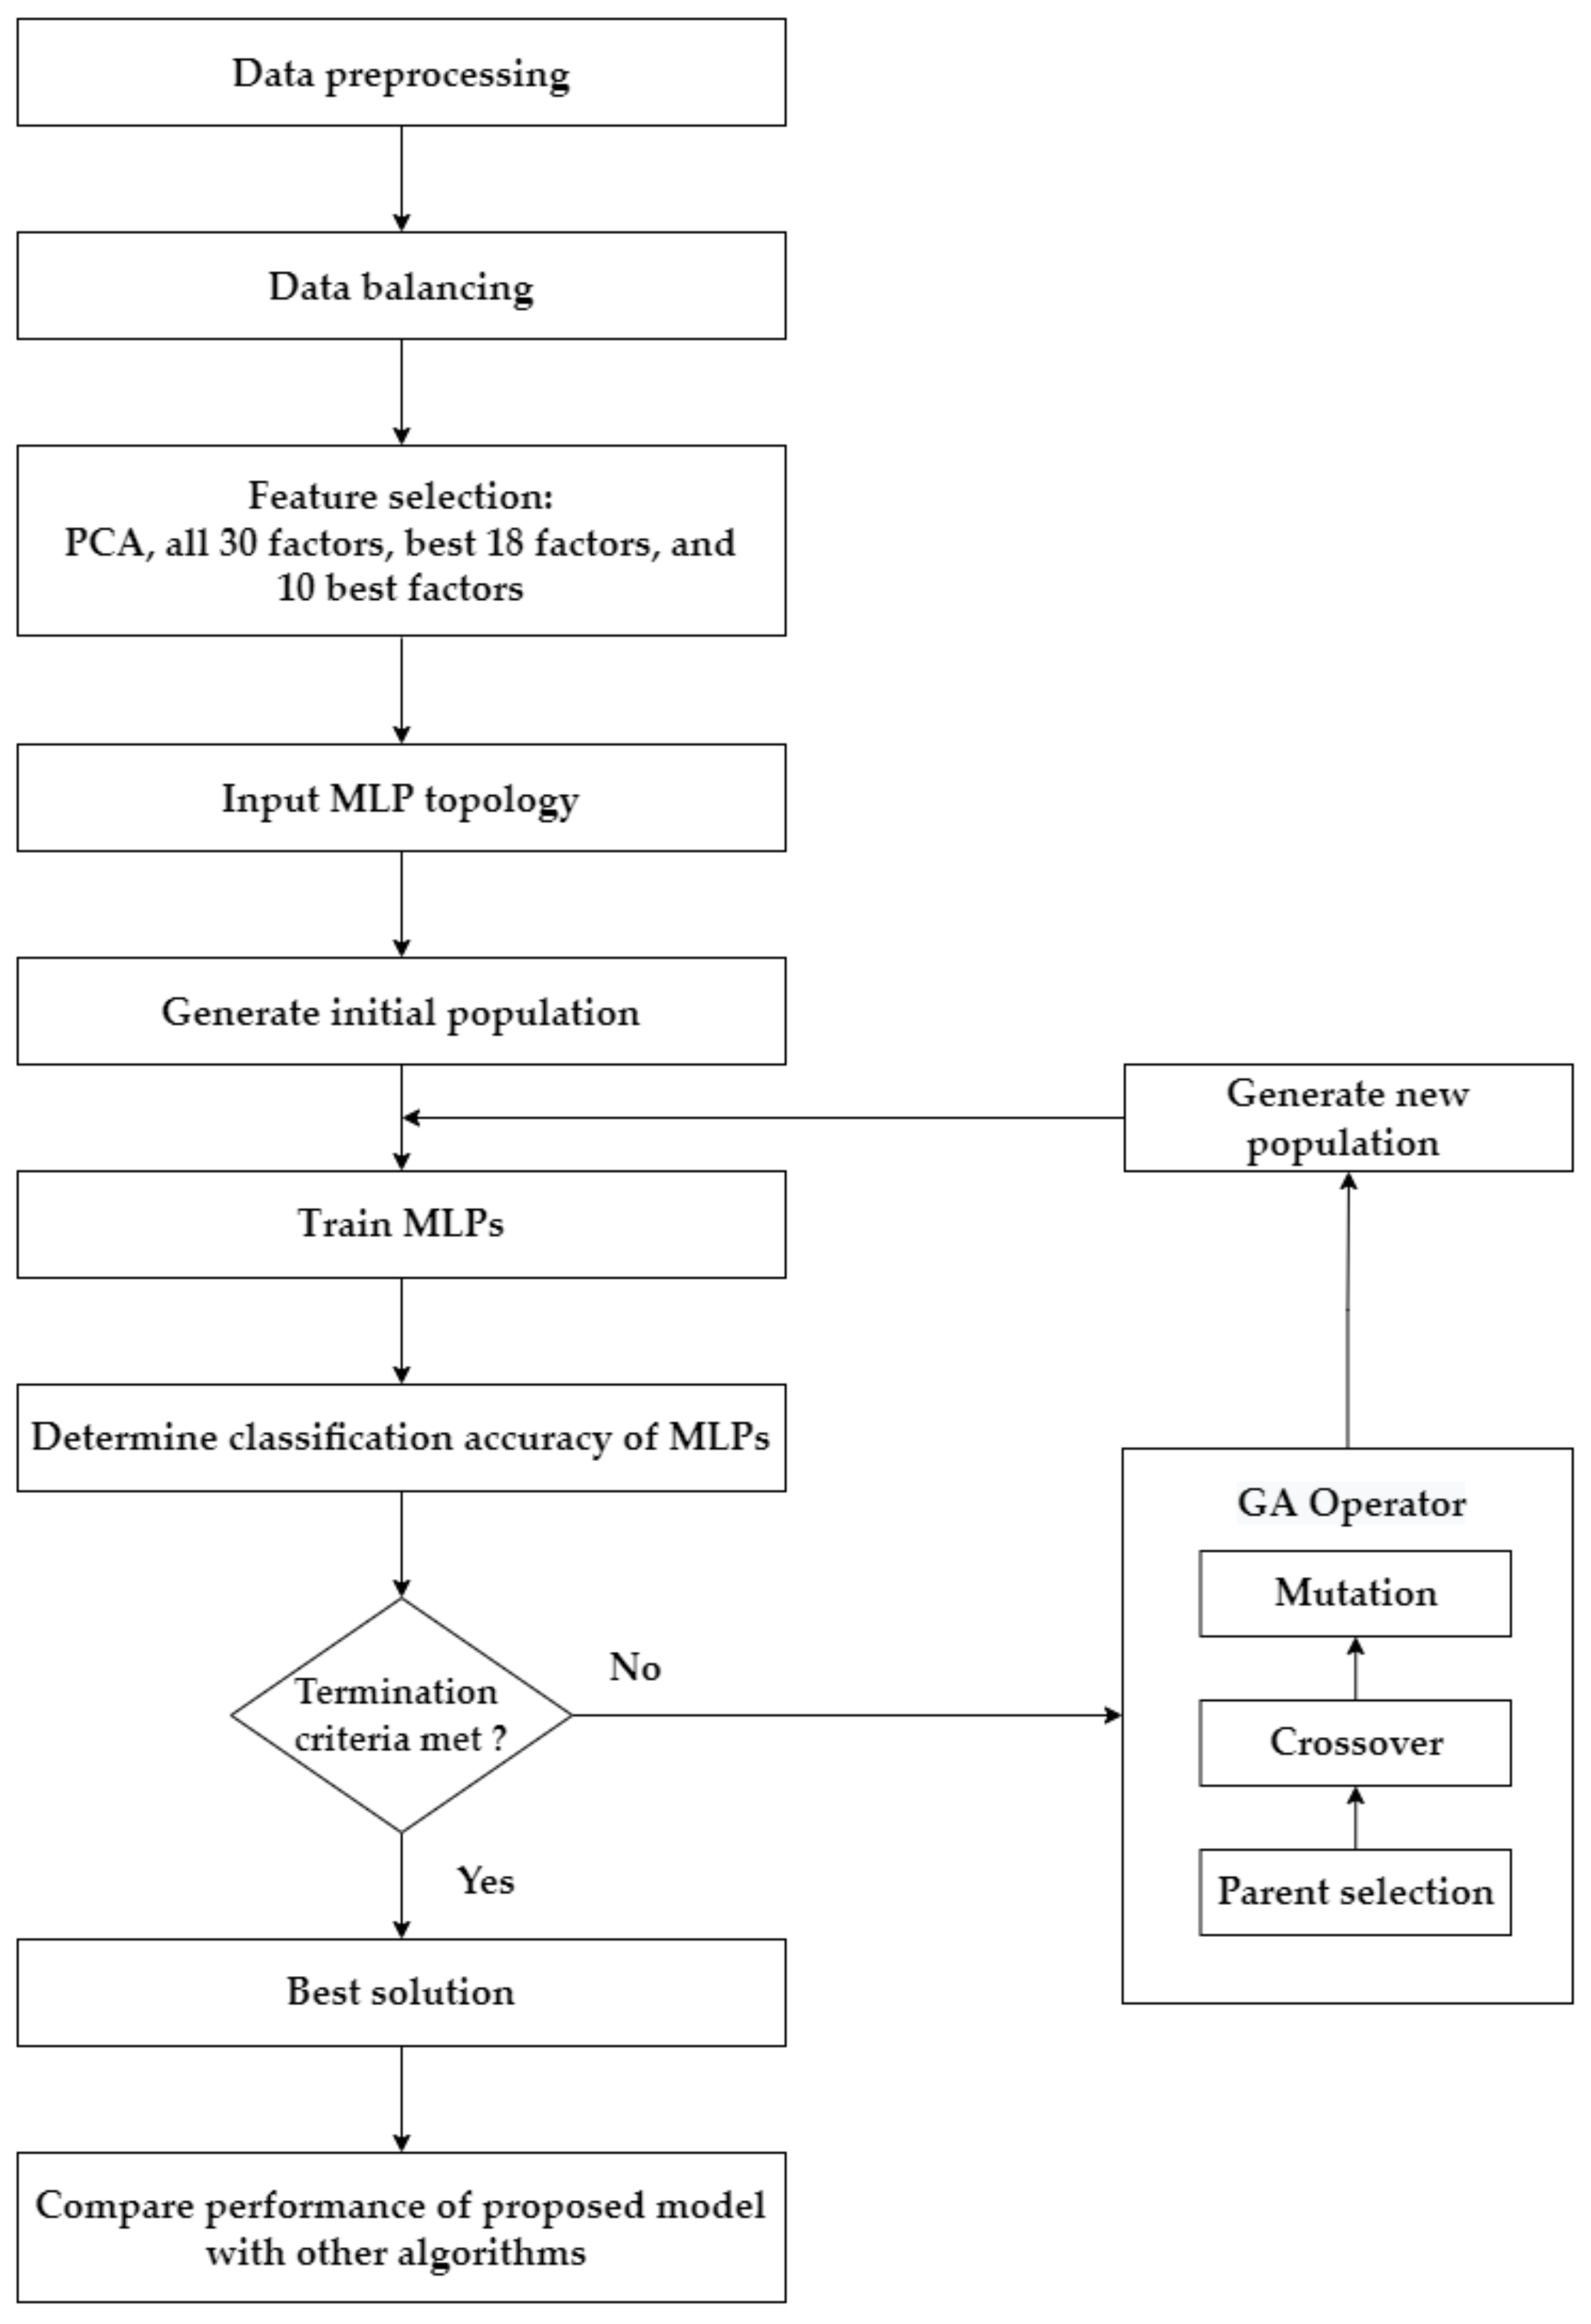
4.3. Combination of GA–MLP
| Algorithm 1. Hybrid GA–MLP for optimizing MLP parameters |
| 1: Set GA parameters (Pc, Pm, n, gmax) |
| 2: Encode solutions (MLP parameters) using real value encoding |
| 3: Randomly generate n solutions |
| 4: Calculate the fitness value of each solution by the trained MLPs |
| 5: for i = 1, until gmax do |
| 6: for i = 1, until n/2 do |
| 7: Select two parents |
| 8: Crossover to create two children with Pc |
| 9: Mutate children with Pm |
| 10: end for 11: Replace parents with children |
| 12: end for |
| 13: Return the best solution |
4.4. Main Operators and MLP Hyperparameters
4.5. Performance Metrics
5. Results and Discussion
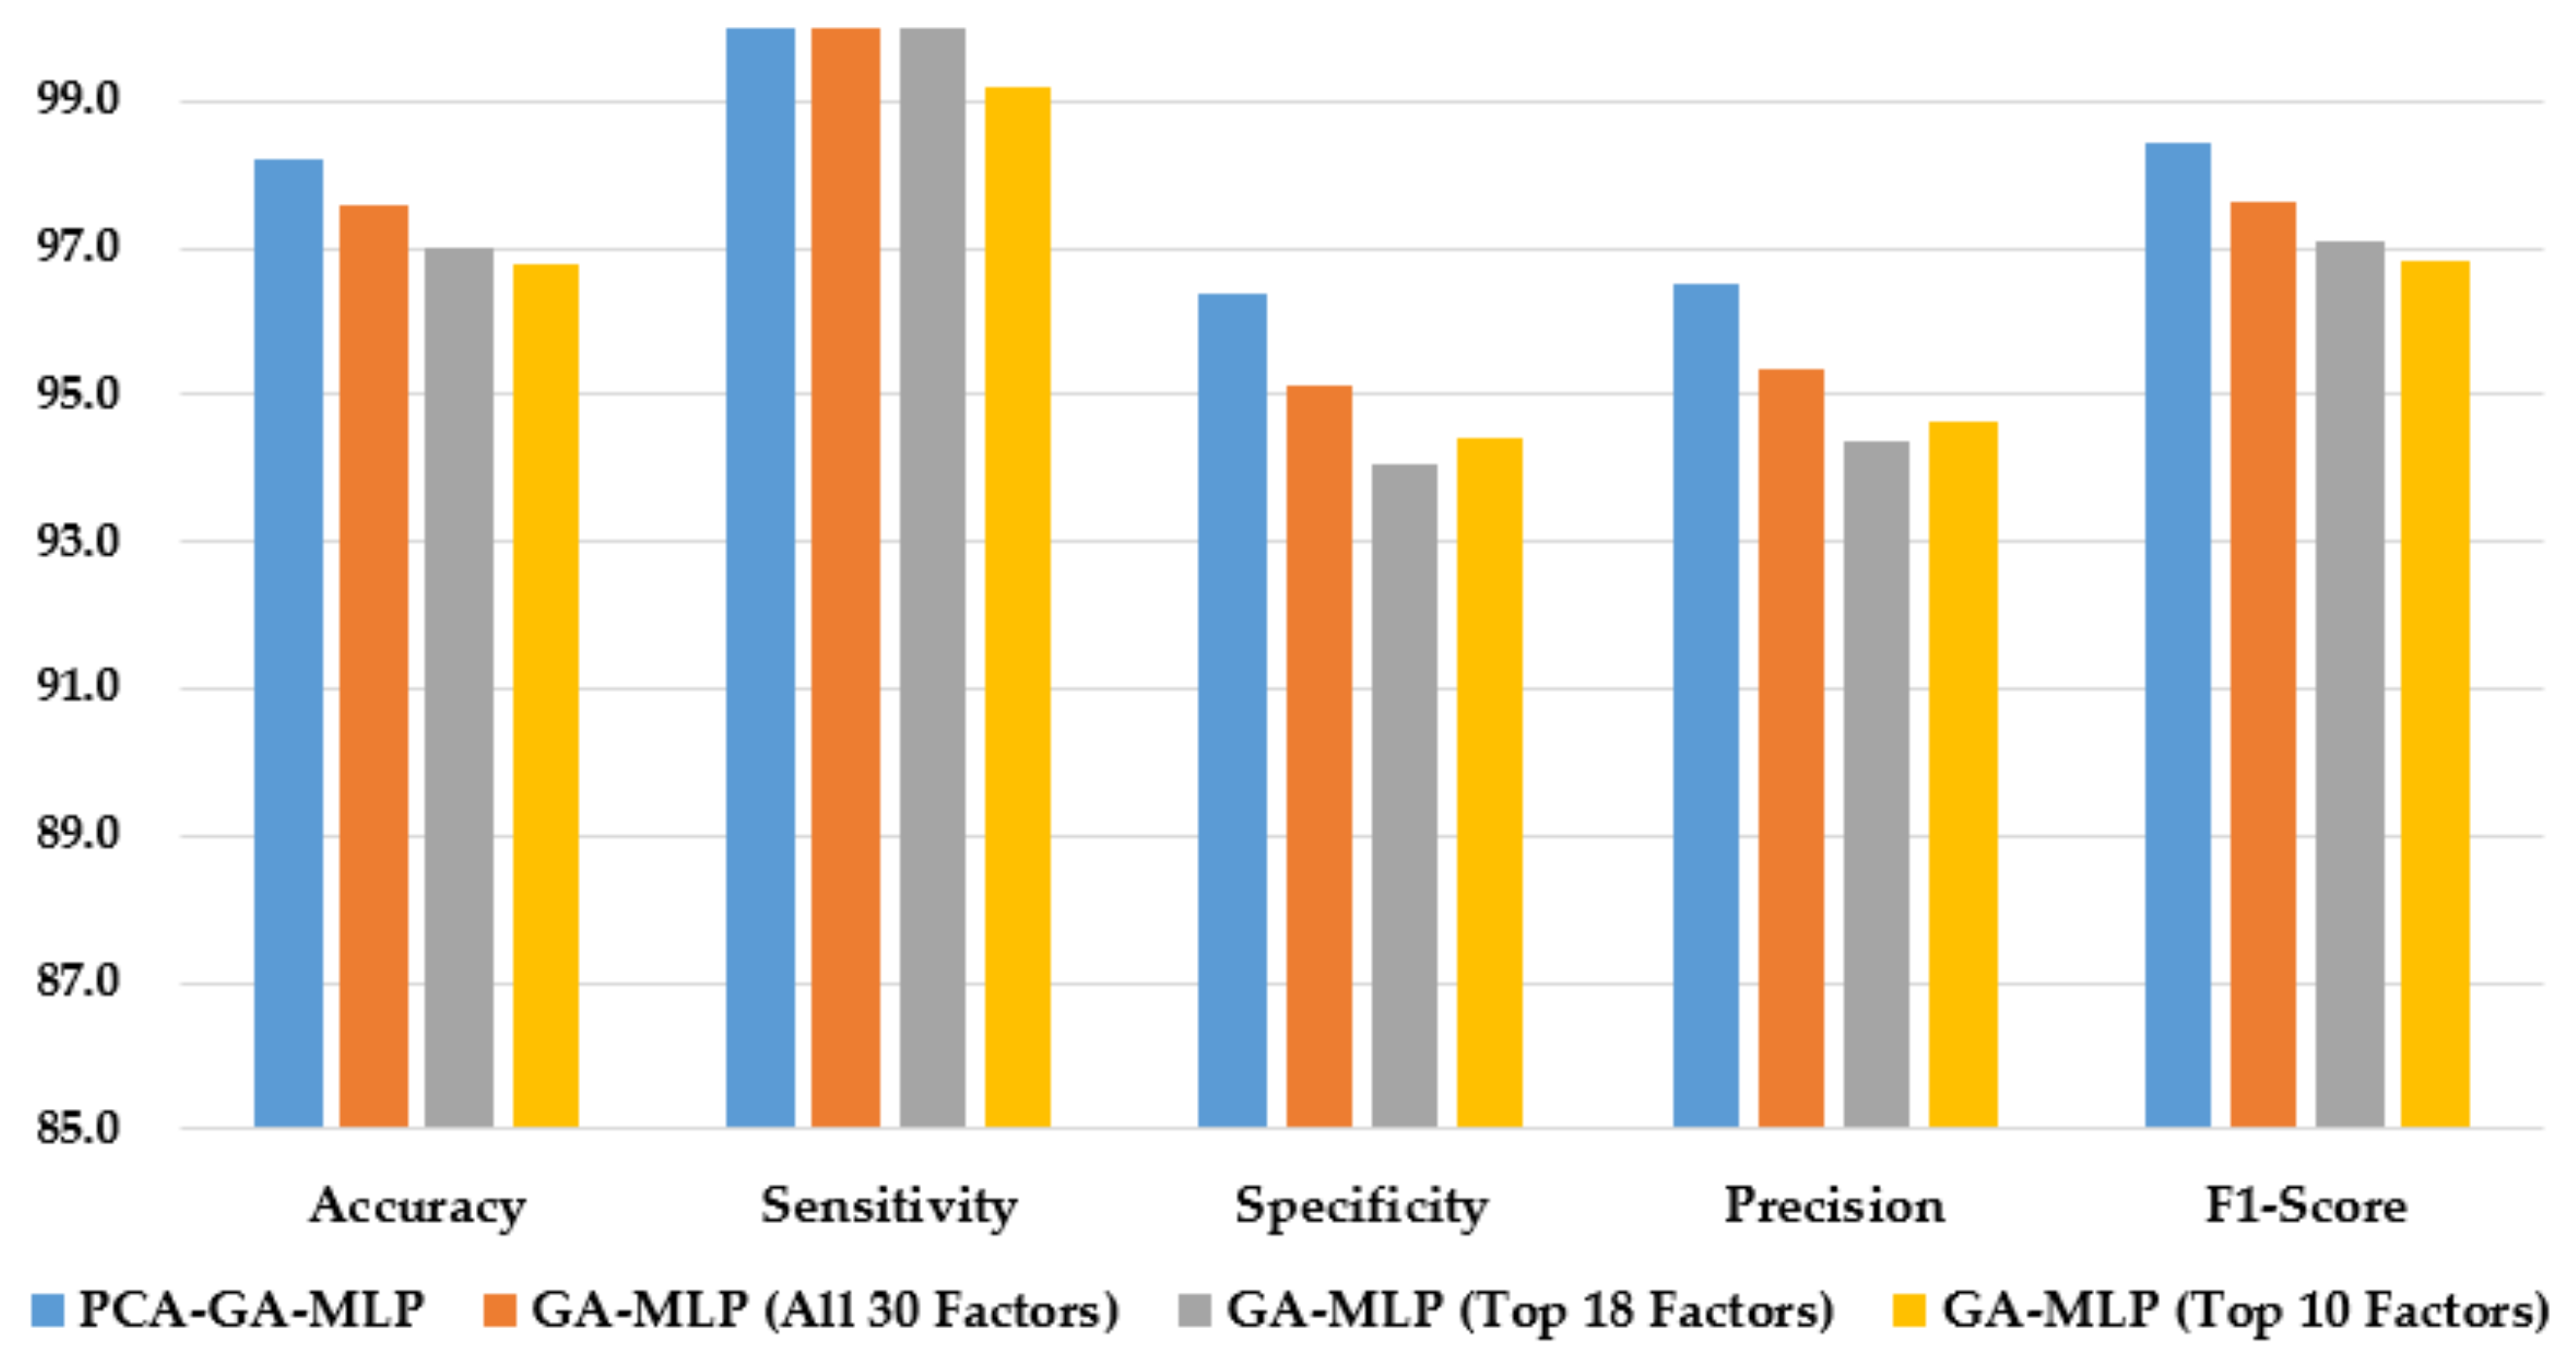
5.1. Target Variable: Hinselmann
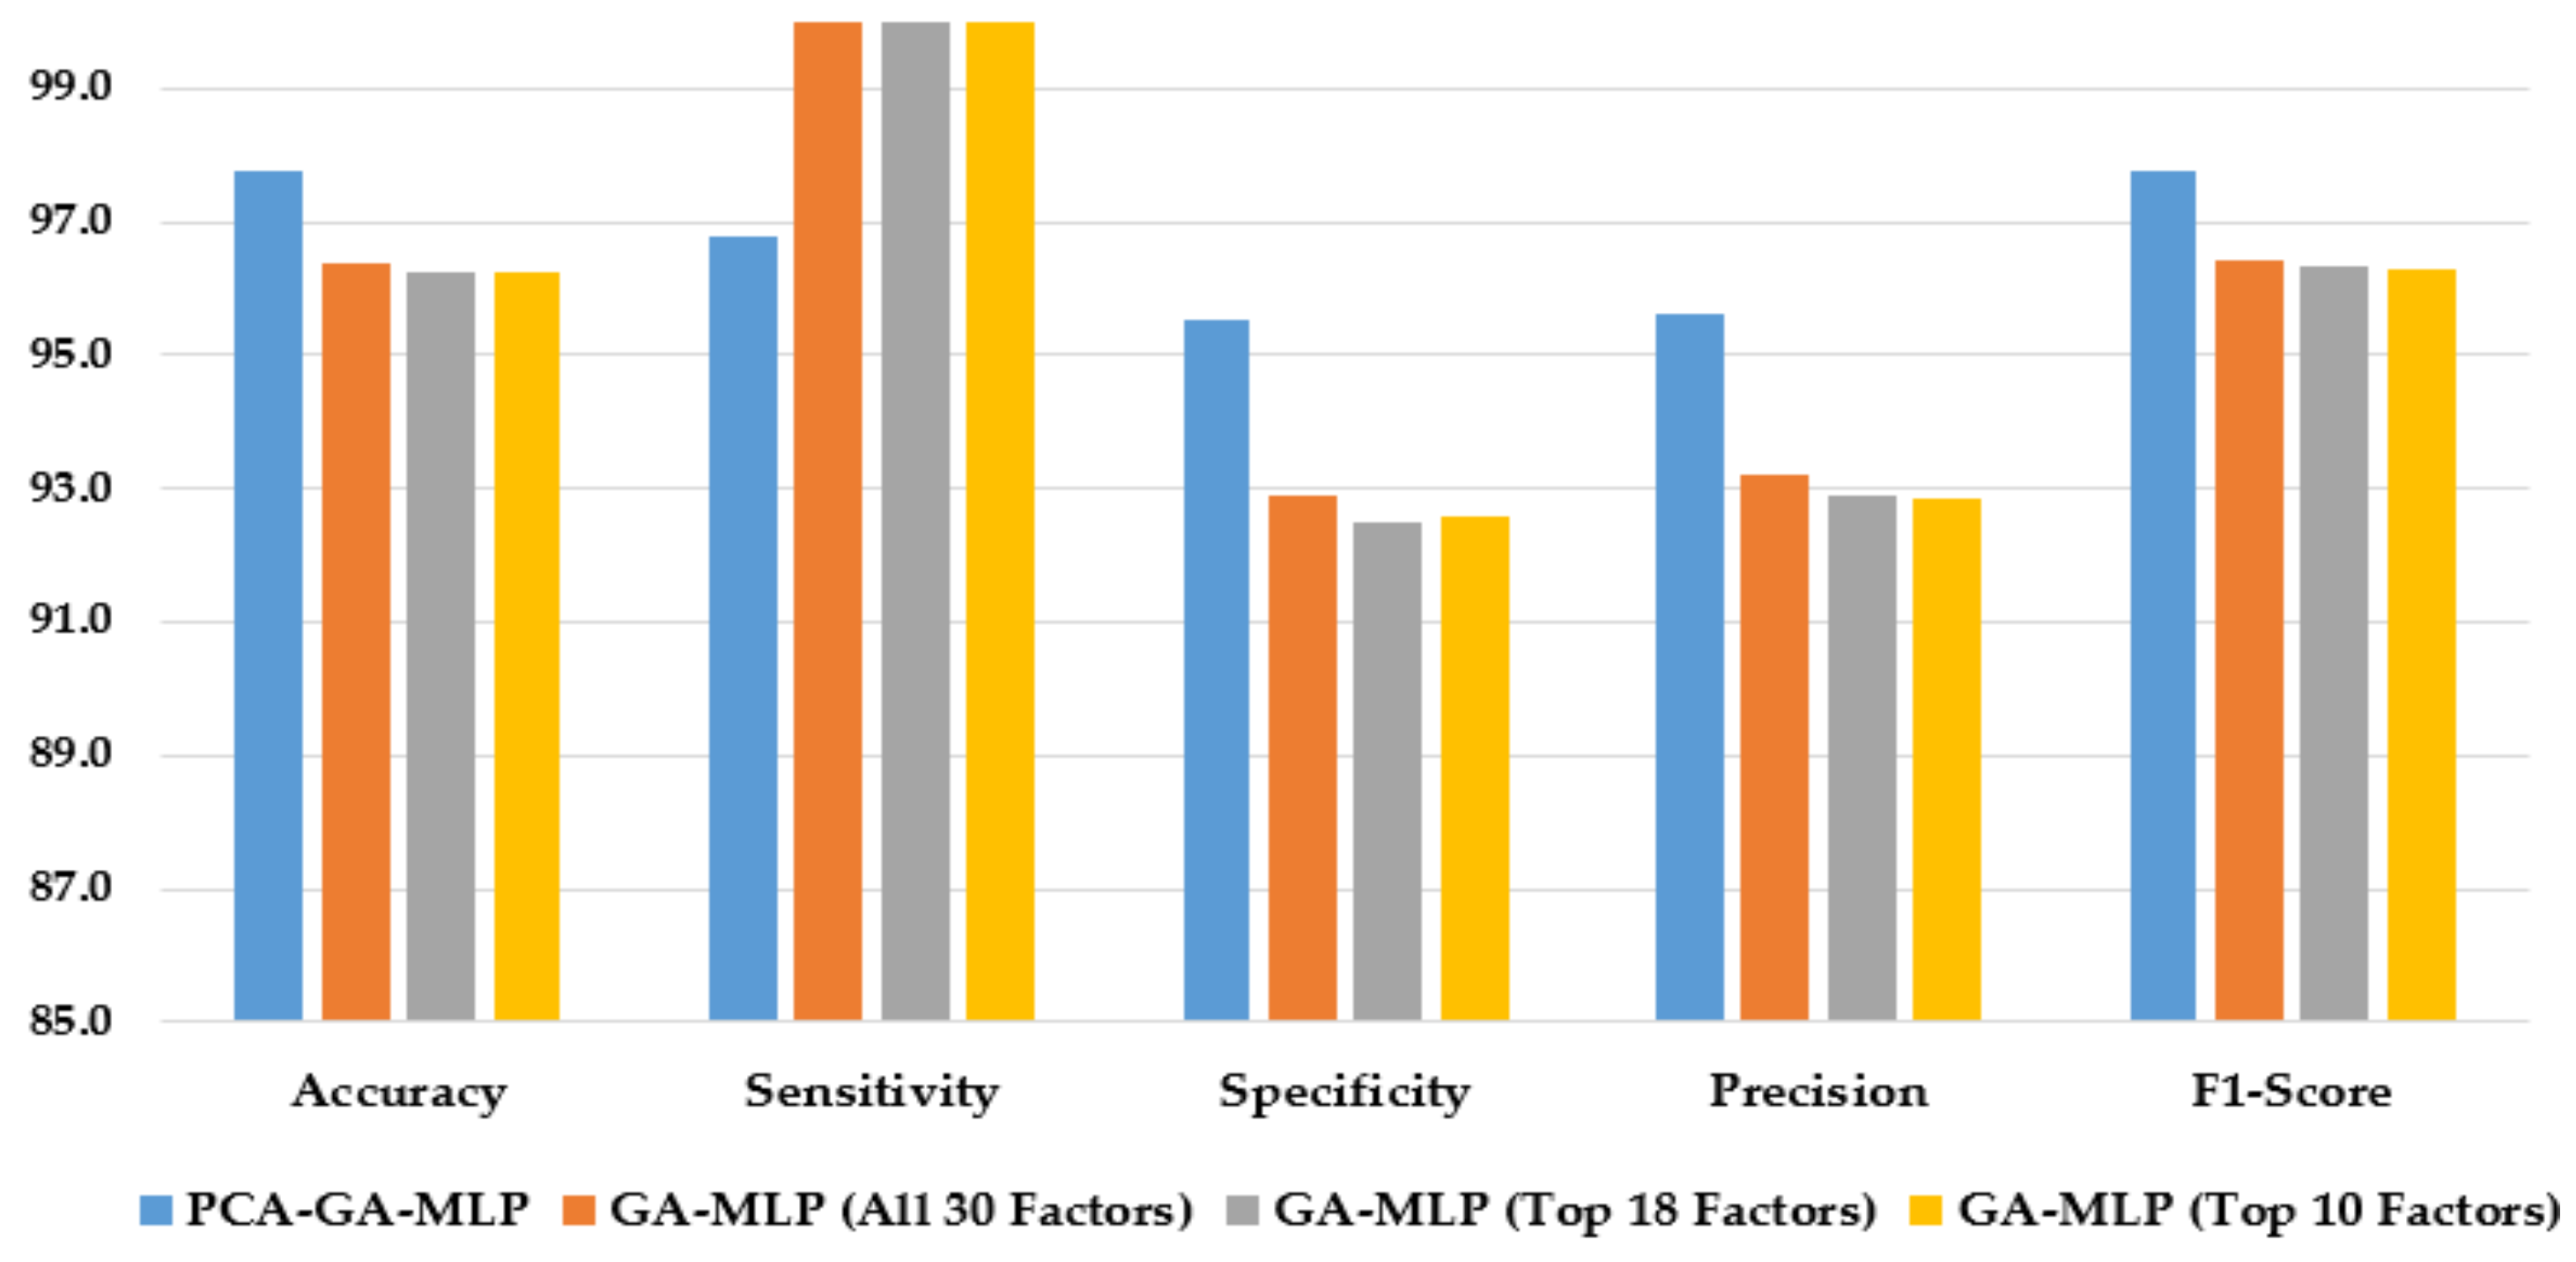
5.2. Target Variable: Schiller
5.3. Target Variable: Cytology
5.4. Target Variable: Biopsy
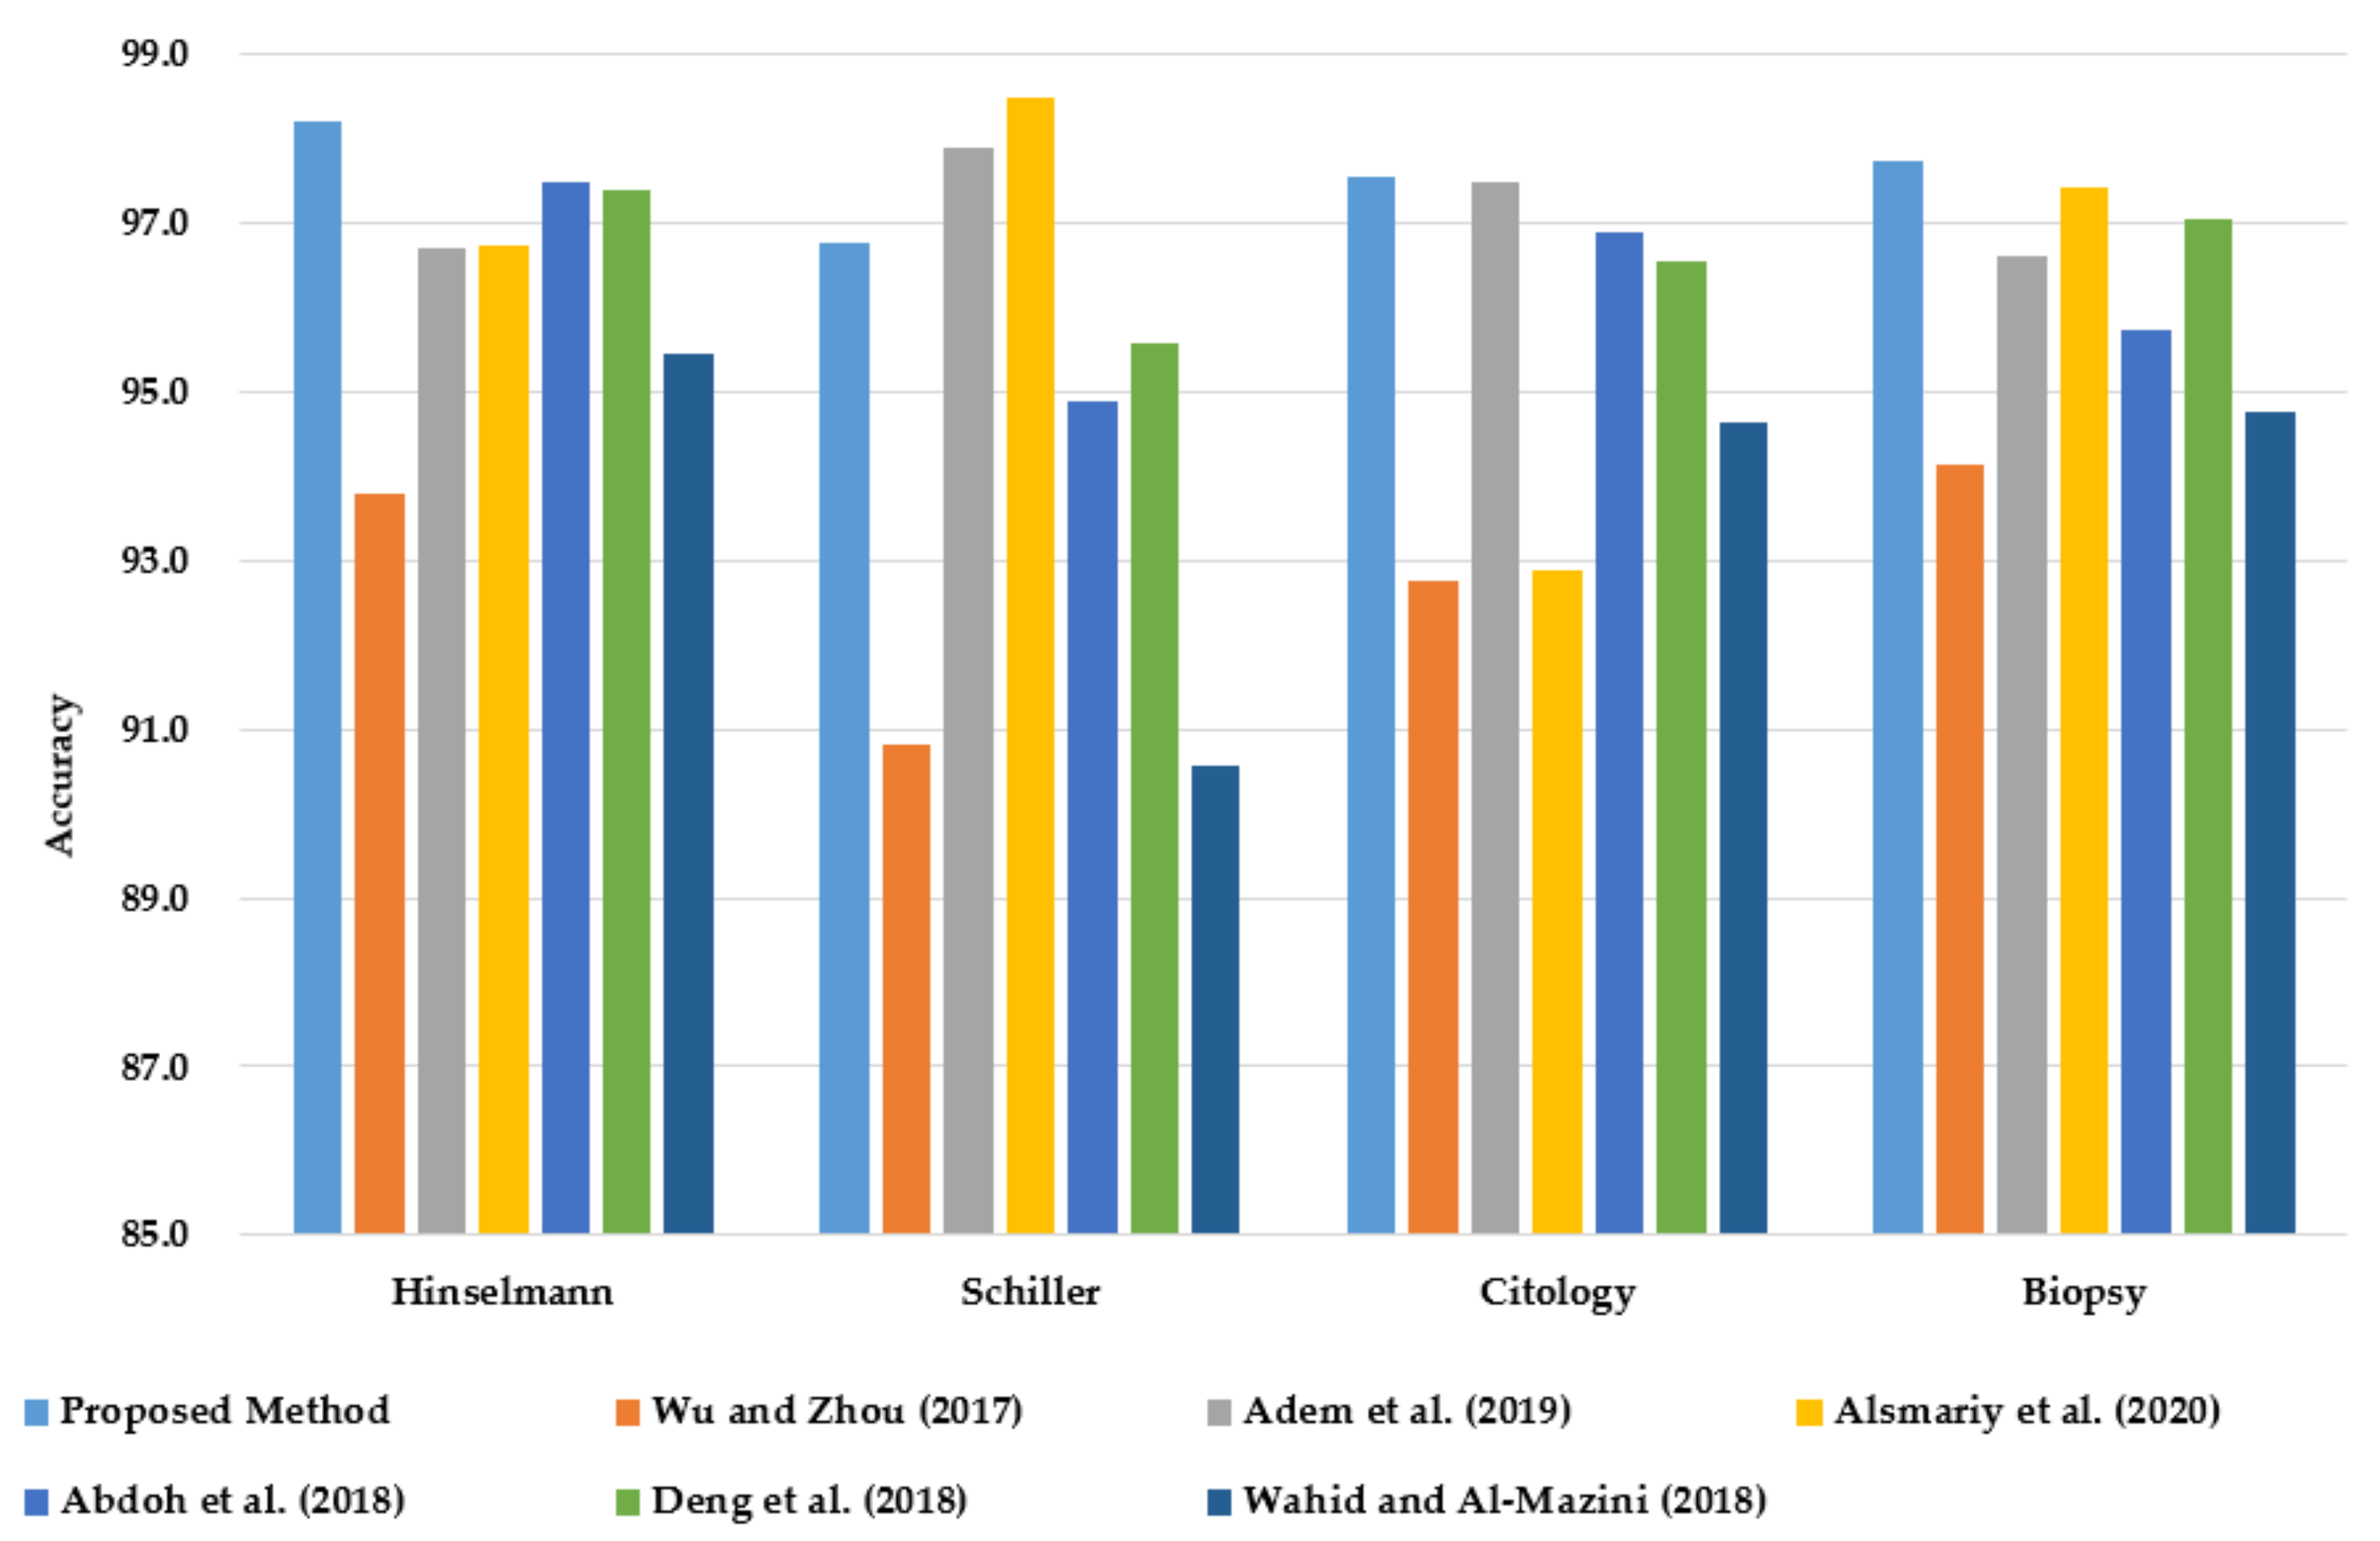
5.5. Four Target Variables
6. Conclusions and Future Work
Author Contributions
Funding
Data Availability Statement
Conflicts of Interest
References
- Sung, H.; Ferlay, J.; Ferlay, J.; Siegel, R.L.; Laversanne, M.; Soerjomataram, I.; Jemal, A.; Bray, F. Global Cancer Statistics 2020: GLOBOCAN Estimates of Incidence and Mortality Worldwide for 36 Cancers in 185 Countries. CA Cancer J. Clin. 2021, 71, 209–249. [Google Scholar] [CrossRef]
- Luhn, P.; Walker, J.; Schiffman, M.; Zuna, R.E.; Dunn, S.T.; Gold, M.A.; Smith, K.; Mathews, C.; Allen, R.A.; Zhang, R.; et al. The Role of Co-Factors in the Progression from Human Papillomavirus Infection to Cervical Cancer. Gynecol. Oncol. 2013, 128, 265–270. [Google Scholar] [CrossRef] [Green Version]
- Nour, N.M. Cervical Cancer: A Preventable Death. Rev. Obs. Gynecol. 2009, 2, 240–244. [Google Scholar]
- Wu, W.; Zhou, H. Data-Driven Diagnosis of Cervical Cancer with Support Vector Machine-Based Approaches. IEEE Access 2017, 5, 25189–25195. [Google Scholar] [CrossRef]
- Wahid, J.; Al-Mazini, H.F.A. Classification of Cervical Cancer Using Ant-Miner for Medical Expertise Knowledge Management. In Proceedings of the Knowledge Management International Conference (KMICe), Miri Sarawak, Malaysia, 25–27 July 2018; pp. 25–27. [Google Scholar]
- Ramdhani, Y.; Riana, D. Hierarchical Decision Approach Based on Neural Network and Genetic Algorithm Method for Single Image Classification of Pap Smear. In Proceedings of the 2017 Second International Conference on Informatics and Computing (ICIC), Jayapura-Papua, Indonesia, 2–4 November 2017; pp. 1–6. [Google Scholar]
- Athinarayanan, S.; Srinath, M.V.; Kavitha, R. Detection and Classification of Cervical Cancer in Pap Smear Images Using EETCM, EEETCM & CFE Methods Based Texture Features and Various Classification Techniques. Int. J. Sci. Res. Sci. Eng. Technol. 2016, 2, 533–549. [Google Scholar]
- Khan, F.S.; Maqbool, F.; Razzaq, S.; Irfan, K.; Zia, T. The Role of Medical Expert Systems in Pakistan. In Proceedings of the World Academy of Science, Engineering and Technology. Int. J. Soc. Behav. Educ. Econ. Bus. Ind. Eng. 2008, 2, 12–14. [Google Scholar]
- Lokanayaki, K.; Malathi, A. Exploring on Various Prediction Model in Data Mining Techniques for Disease Diagnosis. Int. J. Comput. Appl. 2013, 77, 26–29. [Google Scholar] [CrossRef]
- Devi, M.A.; Ravi, S.; Vaishnavi, J. Classification of Cervical Cancer Using Artificial Neural Networks. Procedia Comput. Sci. 2016, 89, 465–472. [Google Scholar] [CrossRef] [Green Version]
- Sharma, M.; Singh, S.K.; Agrawal, P.; Madaan, V. Classification of Clinical Dataset of Cervical Cancer Using KNN. Indian J. Sci. Technol. 2016, 10, 1–5. [Google Scholar] [CrossRef] [Green Version]
- Ghoneim, A.; Muhammad, G.; Hossain, M.S. Cervical Cancer Classification Using Convolutional Neural Networks and Extreme Learning Machines. Future Gener. Comput. Syst. 2020, 102, 643–649. [Google Scholar] [CrossRef]
- Lu, J.; Song, E.; Ghoneim, A.; Alrashoud, M. Machine Learning for Assisting Cervical Cancer Diagnosis: An Ensemble Approach. Future Generation Computer Systems. Future Gener. Comput. Syst. 2020, 106, 199–205. [Google Scholar] [CrossRef]
- Fernandes, K.; Chicco, D.; Cardoso, J.S.; Fernandes, J. Supervised Deep Learning Embeddings for the Prediction of Cervical Cancer Diagnosis. PeerJ. Comput. Sci. 2018, 4, e154. [Google Scholar] [CrossRef] [Green Version]
- Adem, K.; Kiliçarslan, S.; Cömert, O. Classification and Diagnosis of Cervical Cancer with Stacked Autoencoder and Softmax Classification. Expert Syst. Appl. 2019, 115, 557–564. [Google Scholar] [CrossRef]
- Ma, Y.; Liang, F.; Zhu, M.; Chen, C.; Chen, C.; Lv, X. FT-IR Combined with PSO-CNN Algorithm for Rapid Screening of Cervical Tumors. Photodiagn. Photodyn. Ther. 2022, 39, 103023. [Google Scholar] [CrossRef]
- Park, Y.R.; Kim, Y.J.; Ju, W.; Nam, K.; Kim, S.; Kim, K.G. Comparison of Machine and Deep Learning for the Classification of Cervical Cancer Based on Cervicography Images. Sci. Rep. 2021, 11, 16143. [Google Scholar] [CrossRef] [PubMed]
- Driss, S.B.; Soua, M.; Kachouri, R.; Akil, M. A Comparison Study between MLP and Convolutional Neural Network Models for Character Recognition. In Proceedings of the Real-Time Image and Video Processing, San Diego, CA, USA, 6–10 August 2017; International Society for Optics and Photonics SPIE: Anaheim, CA, USA, 2017; p. 1022306. [Google Scholar]
- Mirjalili, S. Evolutionary Algorithms and Neural Networks; Springer: Cham, Switzerland, 2019; Volume 780. [Google Scholar]
- Sokouti, B.; Haghipour, S.; Tabrizi, A.D. A Framework for Diagnosing Cervical Cancer Disease Based on Feedforward MLP Neural Network and ThinPrep Histopathological Cell Image Features. Neural Comput. Appl. 2014, 24, 221–232. [Google Scholar] [CrossRef]
- Katoch, S.; Chauhan, S.S.; Kumar, V. A Review on Genetic Algorithm: Past, Present, and Future. Multimed. Tools Appl. 2021, 80, 8091–8126. [Google Scholar] [CrossRef]
- Abdoh, S.F.; Abo Rizka, M.; Maghraby, F.A. Cervical Cancer Diagnosis Using Random Forest Classifier with SMOTE and Feature Reduction Techniques. IEEE Access 2018, 6, 59475–59485. [Google Scholar] [CrossRef]
- Deng, X.; Luo, Y.; Wang, C. Analysis of Risk Factors for Cervical Cancer Based on Machine Learning Methods. In Proceedings of the 2018 5th IEEE International Conference on Cloud Computing and Intelligence Systems (CCIS), Nanjing, China, 23–25 November 2018; IEEE: New York, NY, USA, 2018; pp. 631–635. [Google Scholar]
- Alsmariy, R.; Healy, G.; Abdelhafez, H. Predicting Cervical Cancer Using Machine Learning Methods. Int. J. Adv. Comput. Sci. Appl. 2020, 11, 173–184. [Google Scholar] [CrossRef]
- Brawijaya, H.; Widodo, S.; Samudi. Improving the Accuracy of Neural Network Technique with Genetic Algorithm for Cervical Cancer Prediction. In Proceedings of the 2018 6th International Conference on Cyber and IT Service Management, CITSM 2018, Parapat, Indonesia, 7–9 August 2018; IEEE: New York, NY, USA, 2018. [Google Scholar] [CrossRef]
- Hu, Y.; Sharma, A.; Dhiman, G.; Shabaz, M. The Identification Nanoparticle Sensor Using Back Propagation Neural Network Optimized by Genetic Algorithm. J. Sens. 2021, 2021, 7548329. [Google Scholar] [CrossRef]
- Twomey, J.M.; Smith, A.E.; Member, S. Bias and Variance of Validation Methods for Function Approximation Neural Networks Under Conditions of Sparse Data. IEEE Trans. Syst. Man Cybern. Part C 1998, 28, 417–430. [Google Scholar]
- Nguyen, B.P.; Tay, W.L.; Chui, C.K. Robust Biometric Recognition from Palm Depth Images for Gloved Hands. IEEE Trans. Hum. Mach. Syst. 2015, 45, 799–804. [Google Scholar] [CrossRef]
- Fekri-Ershad, S.; Ramakrishnan, S. Cervical Cancer Diagnosis Based on Modified Uniform Local Ternary Patterns and Feed Forward Multilayer Network Optimized by Genetic Algorithm. Comput. Biol. Med. 2022, 144, 105392. [Google Scholar] [CrossRef]
- Tanimu, J.J.; Hamada, M.; Hassan, M.; Kakudi, H.A.; Abiodun, J.O. A Machine Learning Method for Classification of Cervical Cancer. Electronics 2022, 11, 463. [Google Scholar] [CrossRef]
- Sharma, M. Cervical Cancer Prognosis Using Genetic Algorithm and Adaptive Boosting Approach. Health Technol. 2019, 9, 877–886. [Google Scholar] [CrossRef]
- Chankong, T.; Theera-Umpon, N.; Auephanwiriyakul, S. Automatic Cervical Cell Segmentation and Classification in Pap Smears. Comput. Methods Programs Biomed. 2014, 113, 539–556. [Google Scholar] [CrossRef]
- Kruczkowski, M.; Drabik-Kruczkowska, A.; Marciniak, A.; Tarczewska, M.; Kosowska, M.; Szczerska, M. Predictions of Cervical Cancer Identification by Photonic Method Combined with Machine Learning. Sci. Rep. 2022, 12, 3762. [Google Scholar] [CrossRef]
- Remeseiro, B.; Bolon-Canedo, V. A Review of Feature Selection Methods in Medical Applications. Comput. Biol. Med. 2019, 112, 103375. [Google Scholar] [CrossRef]
- Kursa, M.B.; Rudnicki, W.R. Feature Selection with the Boruta Package. J. Stat. Softw. 2010, 36, i02. [Google Scholar] [CrossRef] [Green Version]
- Hasan, M.A.M.; Nasser, M.; Ahmad, S.; Molla, K.I. Feature Selection for Intrusion Detection Using Random Forest. J. Inf. Secur. 2016, 7, 129–140. [Google Scholar] [CrossRef] [Green Version]
- Bommert, A.; Sun, X.; Bischl, B.; Rahnenführer, J.; Lang, M. Benchmark for Filter Methods for Feature Selection in High-Dimensional Classification Data. Comput. Stat. Data Anal. 2020, 143, 106839. [Google Scholar] [CrossRef]
- Hasan, B.M.S.; Abdulazeez, A.M. A Review of Principal Component Analysis Algorithm for Dimensionality Reduction. J. Soft. Comput. Data. Min. 2021, 2, 20–30. [Google Scholar]
- Ballabio, D.; Grisoni, F.; Todeschini, R. Multivariate Comparison of Classification Performance Measures. Chemom. Intell. Lab. Syst. 2018, 174, 33–44. [Google Scholar] [CrossRef]
- Gu, Q.; Li, Z.; Zhihua, C. Evaluation Measures of the Classification Performance of Imbalanced Data Sets. In Proceedings of the International Symposium on Intelligence Computation and Applications, Huangshi, China, 23–25 October 2009; Springer: Berlin/Heidelberg, Germany, 2009; pp. 461–471. [Google Scholar]


| Factor Number | Factor Name | Factor Number | Factor Name |
|---|---|---|---|
| 1 | Age | 17 | STDs: vulvo-perineal condylomatosis |
| 2 | Number of sexual partners | 18 | STDs: syphilis |
| 3 | First sexual intercourse (age) | 19 | STDs: pelvic inflammatory disease |
| 4 | Number of pregnancies | 20 | STDs: genital herpes |
| 5 | Smokes | 21 | STDs: molluscum contagiosum |
| 6 | Smokes (years) | 22 | STDs: AIDS |
| 7 | Smokes (packs/year) | 23 | STDs: HIV |
| 8 | Hormonal contraceptives | 24 | STDs: Hepatitis B |
| 9 | Hormonal contraceptives (years) | 25 | STDs: HPV |
| 10 | Intrauterine Device (IUD) | 26 | STDs: Number of diagnoses |
| 11 | IUD (years) | 27 | STDs: Time since first diagnosis |
| 12 | Sexually Transmitted Diseases (STDs) | 28 | STDs: Time since last diagnosis |
| 13 | STDs (number) | 29 | Dx: Cancer |
| 14 | STDs: condylomatosis | 30 | Dx: CIN |
| 15 | STDs: cervical condylomatosis | 31 | Dx: HPV |
| 16 | STDs: vaginal condylomatosis | 32 | Diagnosis (Dx) |
| Hinselmann | Schiller | Cytology | Biopsy |
|---|---|---|---|
| 1 | 1 | 1 | 1 |
| 9 | 9 | 3 | 9 |
| 3 | 3 | 9 | 3 |
| 2 | 4 | 2 | 4 |
| 4 | 2 | 4 | 2 |
| 31 | 11 | 7 | 12 |
| 6 | 7 | 11 | 7 |
| 7 | 8 | 6 | 11 |
| 23 | 17 | 23 | 32 |
| 11 | 6 | 31 | 8 |
| 17 | 31 | 32 | 6 |
| 12 | 12 | 26 | 17 |
| 8 | 5 | 8 | 18 |
| 29 | 23 | 5 | 10 |
| 14 | 29 | 14 | 5 |
| 5 | 16 | 18 | 29 |
| 26 | 26 | 12 | 30 |
| 16 | 10 | 29 | 21 |
| Hinselmann | Schiller | Cytology | Biopsy |
|---|---|---|---|
| 1 | 1 | 1 | 1 |
| 9 | 9 | 3 | 9 |
| 3 | 3 | 9 | 3 |
| 2 | 4 | 2 | 4 |
| 4 | 2 | 4 | 2 |
| 31 | 11 | 7 | 12 |
| 6 | 7 | 11 | 7 |
| 7 | 8 | 6 | 11 |
| 23 | 17 | 23 | 32 |
| 11 | 6 | 31 | 8 |
| Predicted Class | |||
|---|---|---|---|
| Non-Cervical Cancer | Cervical Cancer | ||
| Actual Class | Non-Cervical Cancer | TN | FP |
| Cervical Cancer | FN | TP | |
| Feature Selection: PCA/Method | Performance Measures | ||||
|---|---|---|---|---|---|
| Accuracy | Sensitivity | Specificity | Precision | F1-Score | |
| PCA–GA–MLP | 98.20 | 100.00 | 96.37 | 96.54 | 98.24 |
| PCA–RF | 92.16 | 98.67 | 85.57 | 87.22 | 92.58 |
| PCA–LDA | 61.05 | 52.17 | 69.93 | 63.24 | 57.05 |
| PCA–SVM | 75.23 | 84.81 | 65.52 | 71.07 | 77.28 |
| PCA–LR | 64.11 | 60.65 | 67.56 | 64.95 | 62.67 |
| PCA–NB | 60.34 | 100.00 | 20.58 | 55.75 | 71.59 |
| PCA–KNN | 85.81 | 100.00 | 71.67 | 77.93 | 87.57 |
| PCA–DT | 83.39 | 95.69 | 71.31 | 76.98 | 85.21 |
| PCA–AdaBoost | 94.67 | 100.00 | 89.29 | 90.41 | 94.96 |
| PCA–CD-KNN | 84.40 | 99.55 | 69.29 | 76.53 | 86.49 |
| Feature Selection: All 30 Factors/Method | Performance Measures | ||||
| Accuracy | Sensitivity | Specificity | Precision | F1-Score | |
| GA–MLP | 97.57 | 100.00 | 95.15 | 95.36 | 97.62 |
| RF | 85.27 | 86.09 | 84.47 | 84.59 | 85.09 |
| LDA | 72.33 | 76.01 | 68.65 | 70.83 | 73.28 |
| SVM | 75.39 | 87.42 | 63.36 | 70.58 | 78.06 |
| LR | 72.33 | 75.14 | 69.43 | 71.07 | 72.96 |
| NB | 51.57 | 100.00 | 3.11 | 50.79 | 67.35 |
| KNN | 85.58 | 100.00 | 71.14 | 77.73 | 87.42 |
| DT | 71.40 | 95.71 | 47.24 | 64.69 | 77.06 |
| AdaBoost | 87.07 | 93.58 | 80.47 | 82.69 | 87.74 |
| CD-KNN | 85.66 | 99.39 | 71.90 | 78.07 | 87.42 |
| Feature Selection: Top 18 Factors/Method | Performance Measures | ||||
| Accuracy | Sensitivity | Specificity | Precision | F1-Score | |
| GA–MLP | 97.02 | 100.00 | 94.08 | 94.36 | 97.09 |
| RF | 85.11 | 88.04 | 82.23 | 83.17 | 85.32 |
| LDA | 70.92 | 73.24 | 68.46 | 69.91 | 71.48 |
| SVM | 71.71 | 84.75 | 58.63 | 67.27 | 74.95 |
| LR | 71.00 | 73.24 | 68.63 | 70.03 | 71.53 |
| NB | 55.25 | 100.00 | 10.39 | 52.76 | 69.07 |
| KNN | 85.42 | 100.00 | 70.82 | 77.50 | 87.29 |
| DT | 71.32 | 95.71 | 47.09 | 64.62 | 77.01 |
| AdaBoost | 87.07 | 93.58 | 80.47 | 82.69 | 87.74 |
| CD-KNN | 84.40 | 99.55 | 69.29 | 76.53 | 86.49 |
| Feature Selection: Top 10 Factors/Method | Performance Measures | ||||
| Accuracy | Sensitivity | Specificity | Precision | F1-Score | |
| GA–MLP | 96.79 | 99.21 | 94.40 | 94.65 | 96.84 |
| RF | 83.39 | 95.68 | 71.24 | 77.15 | 85.18 |
| LDA | 66.93 | 68.13 | 65.58 | 66.50 | 67.28 |
| SVM | 67.79 | 68.23 | 67.49 | 67.62 | 67.68 |
| LR | 66.46 | 68.15 | 64.66 | 65.97 | 66.95 |
| NB | 61.98 | 50.85 | 73.01 | 64.58 | 55.01 |
| KNN | 84.40 | 100.00 | 68.79 | 76.24 | 86.50 |
| DT | 70.61 | 97.25 | 44.04 | 63.62 | 76.83 |
| AdaBoost | 85.74 | 92.13 | 79.15 | 81.58 | 86.43 |
| CD-KNN | 83.86 | 99.39 | 68.40 | 75.86 | 86.01 |
| Study | Validation | Method | Accuracy | Sensitivity | Specificity | Precision | F1-Score |
|---|---|---|---|---|---|---|---|
| Proposed Method | 5-Fold Cross-Validation | PCA–GA–MLP | 98.20 | 100.00 | 96.37 | 96.54 | 98.24 |
| [4] | 5-fold cross-validation | SVM SVM–RFE SVM–PCA | 93.79 | 100.00 | 89.96 | N/A | N/A |
| [15] | 70% training and 30% testing | Deep Learning (stacked autoencoder and softmax) | 96.70 | N/A | N/A | N/A | N/A |
| [24] | 10-fold cross-validation | PCA, SMOTE with voting on LR, RF, DT | 96.73 | 96.50 | 97.69 | NA | 96.85 |
| [22] | 10-fold cross-validation | SMOTE–RF SMOTE–RF–RFE SMOTE–RF–PCA | 97.60 | 96.65 | 98.54 | N/A | N/A |
| [23] | 58% training and 42% testing | SMOTE with RF, SVM, and XGBoost | 97.39 | 95.14 | 99.49 | N/A | 96.50 |
| [5] | 5-fold cross-validation | ACO and Ant-Miner data classification rule | 95.45 | N/A | N/A | N/A | N/A |
| Feature Selection: PCA/Method | Performance Measures | ||||
|---|---|---|---|---|---|
| Accuracy | Sensitivity | Specificity | Precision | F1-Score | |
| PCA–GA–MLP | 96.78 | 100.00 | 93.61 | 93.97 | 96.87 |
| PCA–RF | 86.03 | 81.99 | 90.05 | 89.22 | 85.42 |
| PCA–LDA | 65.04 | 52.38 | 77.61 | 69.92 | 59.74 |
| PCA–SVM | 70.50 | 54.18 | 86.74 | 80.11 | 64.25 |
| PCA–LR | 63.88 | 51.62 | 76.13 | 68.17 | 58.70 |
| PCA–NB | 51.32 | 95.35 | 7.32 | 50.73 | 66.20 |
| PCA–KNN | 76.69 | 94.00 | 59.31 | 69.96 | 80.08 |
| PCA–DT | 75.04 | 68.31 | 81.65 | 80.68 | 72.60 |
| PCA–AdaBoost | 86.53 | 90.27 | 82.84 | 83.98 | 86.98 |
| PCA–CD-KNN | 87.52 | 99.15 | 75.88 | 80.50 | 88.83 |
| Feature Selection: All 30 Factors/Method | Performance Measures | ||||
| Accuracy | Sensitivity | Specificity | Precision | F1-Score | |
| GA–MLP | 94.13 | 99.67 | 88.68 | 89.82 | 94.45 |
| RF | 71.07 | 54.37 | 87.68 | 81.65 | 65.11 |
| LDA | 64.71 | 51.08 | 78.25 | 70.13 | 58.98 |
| SVM | 69.75 | 50.20 | 89.16 | 82.59 | 62.16 |
| LR | 63.80 | 51.08 | 76.45 | 68.32 | 58.36 |
| NB | 51.16 | 100.00 | 2.33 | 50.59 | 67.18 |
| KNN | 75.37 | 93.32 | 57.34 | 68.69 | 79.08 |
| DT | 67.69 | 55.13 | 80.49 | 75.45 | 62.17 |
| AdaBoost | 72.64 | 68.42 | 76.82 | 74.58 | 71.29 |
| CD-KNN | 85.29 | 95.86 | 74.70 | 79.19 | 86.72 |
| Feature Selection: Top 18 Factors/Method | Performance Measures | ||||
| Accuracy | Sensitivity | Specificity | Precision | F1-Score | |
| GA–MLP | 94.30 | 98.97 | 89.56 | 90.50 | 94.53 |
| RF | 71.40 | 54.18 | 88.48 | 82.92 | 65.35 |
| LDA | 64.79 | 51.08 | 78.44 | 70.19 | 59.02 |
| SVM | 68.60 | 51.33 | 85.70 | 78.34 | 61.79 |
| LR | 63.47 | 50.93 | 75.94 | 67.79 | 58.06 |
| NB | 50.41 | 97.03 | 3.84 | 50.22 | 66.17 |
| KNN | 75.37 | 93.32 | 57.33 | 68.71 | 79.08 |
| DT | 67.60 | 55.13 | 80.32 | 75.27 | 62.10 |
| AdaBoost | 85.74 | 92.13 | 79.15 | 81.58 | 86.43 |
| CD-KNN | 85.70 | 96.68 | 74.69 | 79.32 | 87.13 |
| Feature Selection: Top 10 Factors/Method | Performance Measures | ||||
| Accuracy | Sensitivity | Specificity | Precision | F1-Score | |
| GA–MLP | 93.39 | 99.17 | 87.53 | 88.98 | 93.79 |
| RF | 73.06 | 56.29 | 89.85 | 84.67 | 67.49 |
| LDA | 62.81 | 52.27 | 73.39 | 66.02 | 58.25 |
| SVM | 65.87 | 45.68 | 86.08 | 76.78 | 56.96 |
| LR | 62.40 | 52.58 | 72.21 | 65.33 | 58.20 |
| NB | 61.90 | 45.32 | 78.44 | 67.68 | 54.18 |
| KNN | 75.29 | 93.98 | 56.50 | 68.41 | 79.14 |
| DT | 69.01 | 63.72 | 74.52 | 72.03 | 66.89 |
| AdaBoost | 71.74 | 69.62 | 73.86 | 72.80 | 71.12 |
| CD-KNN | 86.28 | 96.68 | 75.83 | 80.09 | 87.60 |
| Study | Validation | Method | Accuracy | Sensitivity | Specificity | Precision | F1-Score |
|---|---|---|---|---|---|---|---|
| Proposed Method | 5-Fold Cross-Validation | PCA–GA–MLP | 96.78 | 100.00 | 93.61 | 93.97 | 96.87 |
| [4] | 5-fold cross-validation | SVM SVM–RFE SVM–PCA | 90.81 | 98.99 | 84.63 | N/A | N/A |
| [15] | 70% training and 30% testing | Deep Learning (stacked autoencoder and softmax) | 97.90 | N/A | N/A | N/A | N/A |
| [24] | 10-fold cross-validation | PCA, SMOTE with voting on LR, RF, DT | 98.49 | 98.60 | 98.60 | N/A | 98.37 |
| [22] | 10-fold cross-validation | SMOTE–RF SMOTE–RF–RFE SMOTE–RF–PCA | 95.01 | 93.24 | 96.68 | N/A | N/A |
| [23] | 58% training and 42% testing | SMOTE with RF, SVM, and XGBoost | 95.59 | 93.92 | 97.25 | N/A | 96.00 |
| [5] | 5-fold cross-validation | ACO and Ant-Miner data classification rule | 90.56 | N/A | N/A | N/A | N/A |
| Feature Selection: PCA/Method | Performance Measures | ||||
|---|---|---|---|---|---|
| Accuracy | Sensitivity | Specificity | Precision | F1-Score | |
| PCA–GA–MLP | 97.54 | 96.78 | 95.15 | 95.27 | 97.56 |
| PCA–RF | 91.58 | 95.30 | 88.06 | 88.73 | 91.83 |
| PCA–LDA | 62.04 | 47.56 | 76.89 | 67.69 | 55.24 |
| PCA–SVM | 71.01 | 64.86 | 77.01 | 73.83 | 69.01 |
| PCA–LR | 61.88 | 51.00 | 73.21 | 65.93 | 56.81 |
| PCA–NB | 53.53 | 94.93 | 12.18 | 51.99 | 67.10 |
| PCA–KNN | 83.56 | 100.00 | 67.08 | 75.33 | 85.87 |
| PCA–DT | 80.54 | 92.77 | 68.41 | 74.46 | 82.55 |
| PCA–AdaBoost | 89.83 | 96.25 | 83.50 | 85.36 | 90.41 |
| PCA–CD-KNN | 87.06 | 99.70 | 74.45 | 79.70 | 88.51 |
| Feature Selection: All 30 Factors/Method | Performance Measures | ||||
| Accuracy | Sensitivity | Specificity | Precision | F1-Score | |
| GA–MLP | 95.39 | 100.00 | 92.02 | 92.38 | 95.61 |
| RF | 74.27 | 66.32 | 82.61 | 79.20 | 71.96 |
| LDA | 63.62 | 56.07 | 71.10 | 66.06 | 60.47 |
| SVM | 65.05 | 60.61 | 69.06 | 68.31 | 62.72 |
| LR | 63.31 | 58.30 | 68.28 | 64.74 | 61.22 |
| NB | 52.90 | 100.00 | 5.74 | 51.52 | 67.94 |
| KNN | 83.24 | 100.00 | 66.43 | 74.89 | 85.61 |
| DT | 70.62 | 58.50 | 82.80 | 77.29 | 66.51 |
| AdaBoost | 77.05 | 84.33 | 70.07 | 73.65 | 78.45 |
| CD-KNN | 86.10 | 100.00 | 72.29 | 78.33 | 87.77 |
| Feature Selection: Top 18 Factors/Method | Performance Measures | ||||
| Accuracy | Sensitivity | Specificity | Precision | F1-Score | |
| GA–MLP | 94.92 | 100.00 | 89.92 | 90.75 | 95.12 |
| RF | 74.98 | 68.67 | 81.55 | 78.77 | 73.25 |
| LDA | 63.46 | 55.64 | 71.33 | 66.17 | 60.21 |
| SVM | 66.09 | 64.40 | 67.20 | 66.45 | 65.25 |
| LR | 63.15 | 57.27 | 69.08 | 64.99 | 60.68 |
| NB | 53.53 | 97.37 | 9.57 | 51.88 | 67.64 |
| KNN | 83.16 | 100.00 | 66.25 | 74.79 | 85.55 |
| DT | 70.54 | 58.50 | 82.63 | 77.17 | 66.46 |
| AdaBoost | 76.73 | 84.61 | 69.16 | 73.18 | 78.31 |
| CD-KNN | 85.94 | 100.00 | 71.88 | 78.11 | 87.65 |
| Feature Selection: Top 10 Factors/Method | Performance Measures | ||||
| Accuracy | Sensitivity | Specificity | Precision | F1-Score | |
| GA–MLP | 94.04 | 100.00 | 88.00 | 89.36 | 93.32 |
| RF | 80.06 | 82.03 | 78.12 | 78.78 | 80.30 |
| LDA | 60.61 | 55.31 | 66.68 | 62.63 | 58.14 |
| SVM | 68.79 | 72.79 | 65.08 | 67.58 | 69.95 |
| LR | 62.59 | 62.06 | 63.81 | 63.35 | 62.30 |
| NB | 55.76 | 77.63 | 34.24 | 54.37 | 63.71 |
| KNN | 82.76 | 100.00 | 65.57 | 74.34 | 85.24 |
| DT | 65.85 | 52.98 | 79.01 | 73.60 | 60.06 |
| AdaBoost | 74.82 | 80.97 | 68.85 | 72.12 | 76.13 |
| CD-KNN | 86.02 | 100.00 | 71.99 | 78.12 | 87.69 |
| Study | Validation | Method | Accuracy | Sensitivity | Specificity | Precision | F1-Score |
|---|---|---|---|---|---|---|---|
| Proposed Method | 5-Fold Cross-Validation | PCA–GA–MLP | 97.54 | 96.78 | 95.15 | 95.27 | 97.56 |
| [4] | 5-fold cross-validation | SVM SVM–RFE SVM–PCA | 92.75 | 100.00 | 87.92 | N/A | N/A |
| [15] | 70% training and 30% testing | Deep Learning (stacked autoencoder and softmax) | 97.50 | N/A | N/A | N/A | N/A |
| [24] | 10-fold cross-validation | PCA, SMOTE with voting on LR, RF, DT | 92.89 | 93.12 | 94.59 | N/A | 93.35 |
| [22] | 10-fold cross-validation | SMOTE–RF SMOTE–RF–RFE SMOTE–RF–PCA | 96.94 | 94.82 | 99.01 | N/A | N/A |
| [23] | 58% training and 42% testing | SMOTE with RF, SVM, and XGBoost | 96.56 | 94.32 | 98.51 | N/A | 97.00 |
| [5] | 5-fold cross-validation | ACO and Ant-Miner data classification rule | 94.64 | N/A | N/A | N/A | N/A |
| Feature Selection: PCA/Method | Performance Measures | ||||
|---|---|---|---|---|---|
| Accuracy | Sensitivity | Specificity | Precision | F1-Score | |
| PCA–GA–MLP | 97.75 | 96.78 | 95.54 | 95.63 | 97.76 |
| PCA–RF | 89.00 | 87.59 | 90.27 | 90.02 | 88.77 |
| PCA–LDA | 69.42 | 56.40 | 82.72 | 76.48 | 64.69 |
| PCA–SVM | 74.23 | 60.60 | 88.20 | 83.56 | 70.07 |
| PCA–LR | 67.82 | 55.73 | 80.26 | 73.84 | 63.20 |
| PCA–NB | 54.34 | 92.31 | 16.28 | 52.49 | 66.81 |
| PCA–KNN | 85.07 | 100.00 | 70.11 | 76.87 | 86.89 |
| PCA–DT | 84.75 | 98.50 | 71.10 | 77.33 | 86.51 |
| PCA–AdaBoost | 90.93 | 94.24 | 87.90 | 88.47 | 91.19 |
| PCA–CD-KNN | 88.60 | 100.00 | 77.22 | 81.31 | 89.66 |
| Feature Selection: All 30 Factors/Method | Performance Measures | ||||
| Accuracy | Sensitivity | Specificity | Precision | F1-Score | |
| GA–MLP | 96.39 | 100.00 | 92.90 | 93.19 | 96.45 |
| RF | 76.00 | 61.31 | 90.97 | 87.04 | 71.73 |
| LDA | 69.66 | 58.41 | 81.24 | 75.66 | 65.60 |
| SVM | 74.80 | 59.85 | 90.01 | 85.47 | 70.20 |
| LR | 69.98 | 59.41 | 80.86 | 75.60 | 66.27 |
| NB | 52.25 | 100.00 | 4.44 | 51.14 | 67.56 |
| KNN | 84.51 | 100.00 | 69.09 | 76.25 | 86.46 |
| DT | 73.11 | 57.51 | 89.35 | 84.84 | 68.05 |
| AdaBoost | 80.09 | 78.16 | 82.24 | 81.19 | 79.46 |
| CD-KNN | 89.49 | 100.00 | 79.21 | 82.54 | 90.35 |
| Feature Selection: Top 18 Factors/Method | Performance Measures | ||||
| Accuracy | Sensitivity | Specificity | Precision | F1-Score | |
| GA–MLP | 96.23 | 100.00 | 92.48 | 92.92 | 96.32 |
| RF | 77.69 | 62.99 | 92.58 | 89.35 | 73.74 |
| LDA | 69.02 | 57.36 | 81.07 | 75.00 | 64.72 |
| SVM | 71.11 | 58.97 | 83.76 | 78.18 | 66.95 |
| LR | 68.46 | 58.07 | 79.17 | 73.49 | 64.62 |
| NB | 51.61 | 99.14 | 4.17 | 50.85 | 67.09 |
| KNN | 83.87 | 100.00 | 67.77 | 75.52 | 85.99 |
| DT | 72.87 | 57.51 | 88.84 | 84.18 | 67.85 |
| AdaBoost | 81.62 | 81.05 | 82.10 | 81.90 | 81.39 |
| CD-KNN | 88.36 | 98.25 | 78.70 | 81.92 | 89.27 |
| Feature Selection: Top 10 Factors/Method | Performance Measures | ||||
| Accuracy | Sensitivity | Specificity | Precision | F1-Score | |
| GA–MLP | 96.23 | 100.00 | 92.59 | 92.86 | 96.28 |
| RF | 79.85 | 67.30 | 92.57 | 89.97 | 76.83 |
| LDA | 68.38 | 57.98 | 78.95 | 73.13 | 64.54 |
| SVM | 72.39 | 58.12 | 86.78 | 81.32 | 67.63 |
| LR | 68.22 | 58.15 | 78.47 | 72.77 | 64.49 |
| NB | 67.57 | 53.62 | 81.74 | 74.42 | 62.16 |
| KNN | 83.95 | 100.00 | 67.94 | 75.66 | 86.07 |
| DT | 73.11 | 61.81 | 83.45 | 81.37 | 69.48 |
| AdaBoost | 79.93 | 80.18 | 79.82 | 79.94 | 79.93 |
| CD-KNN | 89.97 | 100.00 | 79.95 | 83.17 | 90.78 |
| Study | Validation | Method | Accuracy | Sensitivity | Specificity | Precision | F1-Score |
|---|---|---|---|---|---|---|---|
| Proposed method | 5-fold cross-validation | PCA–GA–MLP | 97.75 | 96.78 | 95.54 | 95.63 | 97.76 |
| [4] | 5-fold cross-validation | SVM SVM–RFE SVM–PCA | 94.13 | 100.00 | 90.21 | N/A | N/A |
| [15] | 70% training and 30% testing | Deep Learning (stacked autoencoder and softmax) | 96.60 | N/A | N/A | N/A | N/A |
| [24] | 10-fold cross-validation | PCA, SMOTE with voting on LR, RF, DT | 97.44 | 97.79 | 98.01 | N/A | 97.44 |
| [22] | 10-fold cross-validation | SMOTE–RF SMOTE–RF–RFE SMOTE–RF–PCA | 96.06 | 94.55 | 97.51 | N/A | N/A |
| [23] | 58% training and 42% testing | SMOTE with RF, SVM, and XGBoost | 97.06 | 95.50 | 98.85 | N/A | 97.00 |
| [5] | 5-fold cross-validation | ACO and Ant-Miner data classification rule | 94.76 | N/A | N/A | N/A | N/A |
Publisher’s Note: MDPI stays neutral with regard to jurisdictional claims in published maps and institutional affiliations. |
© 2022 by the authors. Licensee MDPI, Basel, Switzerland. This article is an open access article distributed under the terms and conditions of the Creative Commons Attribution (CC BY) license (https://creativecommons.org/licenses/by/4.0/).
Share and Cite
Dweekat, O.Y.; Lam, S.S. Cervical Cancer Diagnosis Using an Integrated System of Principal Component Analysis, Genetic Algorithm, and Multilayer Perceptron. Healthcare 2022, 10, 2002. https://doi.org/10.3390/healthcare10102002
Dweekat OY, Lam SS. Cervical Cancer Diagnosis Using an Integrated System of Principal Component Analysis, Genetic Algorithm, and Multilayer Perceptron. Healthcare. 2022; 10(10):2002. https://doi.org/10.3390/healthcare10102002
Chicago/Turabian StyleDweekat, Odai Y., and Sarah S. Lam. 2022. "Cervical Cancer Diagnosis Using an Integrated System of Principal Component Analysis, Genetic Algorithm, and Multilayer Perceptron" Healthcare 10, no. 10: 2002. https://doi.org/10.3390/healthcare10102002
APA StyleDweekat, O. Y., & Lam, S. S. (2022). Cervical Cancer Diagnosis Using an Integrated System of Principal Component Analysis, Genetic Algorithm, and Multilayer Perceptron. Healthcare, 10(10), 2002. https://doi.org/10.3390/healthcare10102002