
Is Smoking Associated with Carpal Tunnel Syndrome? A Meta-Analysis


Abstract
:1. Introduction
2. Methods
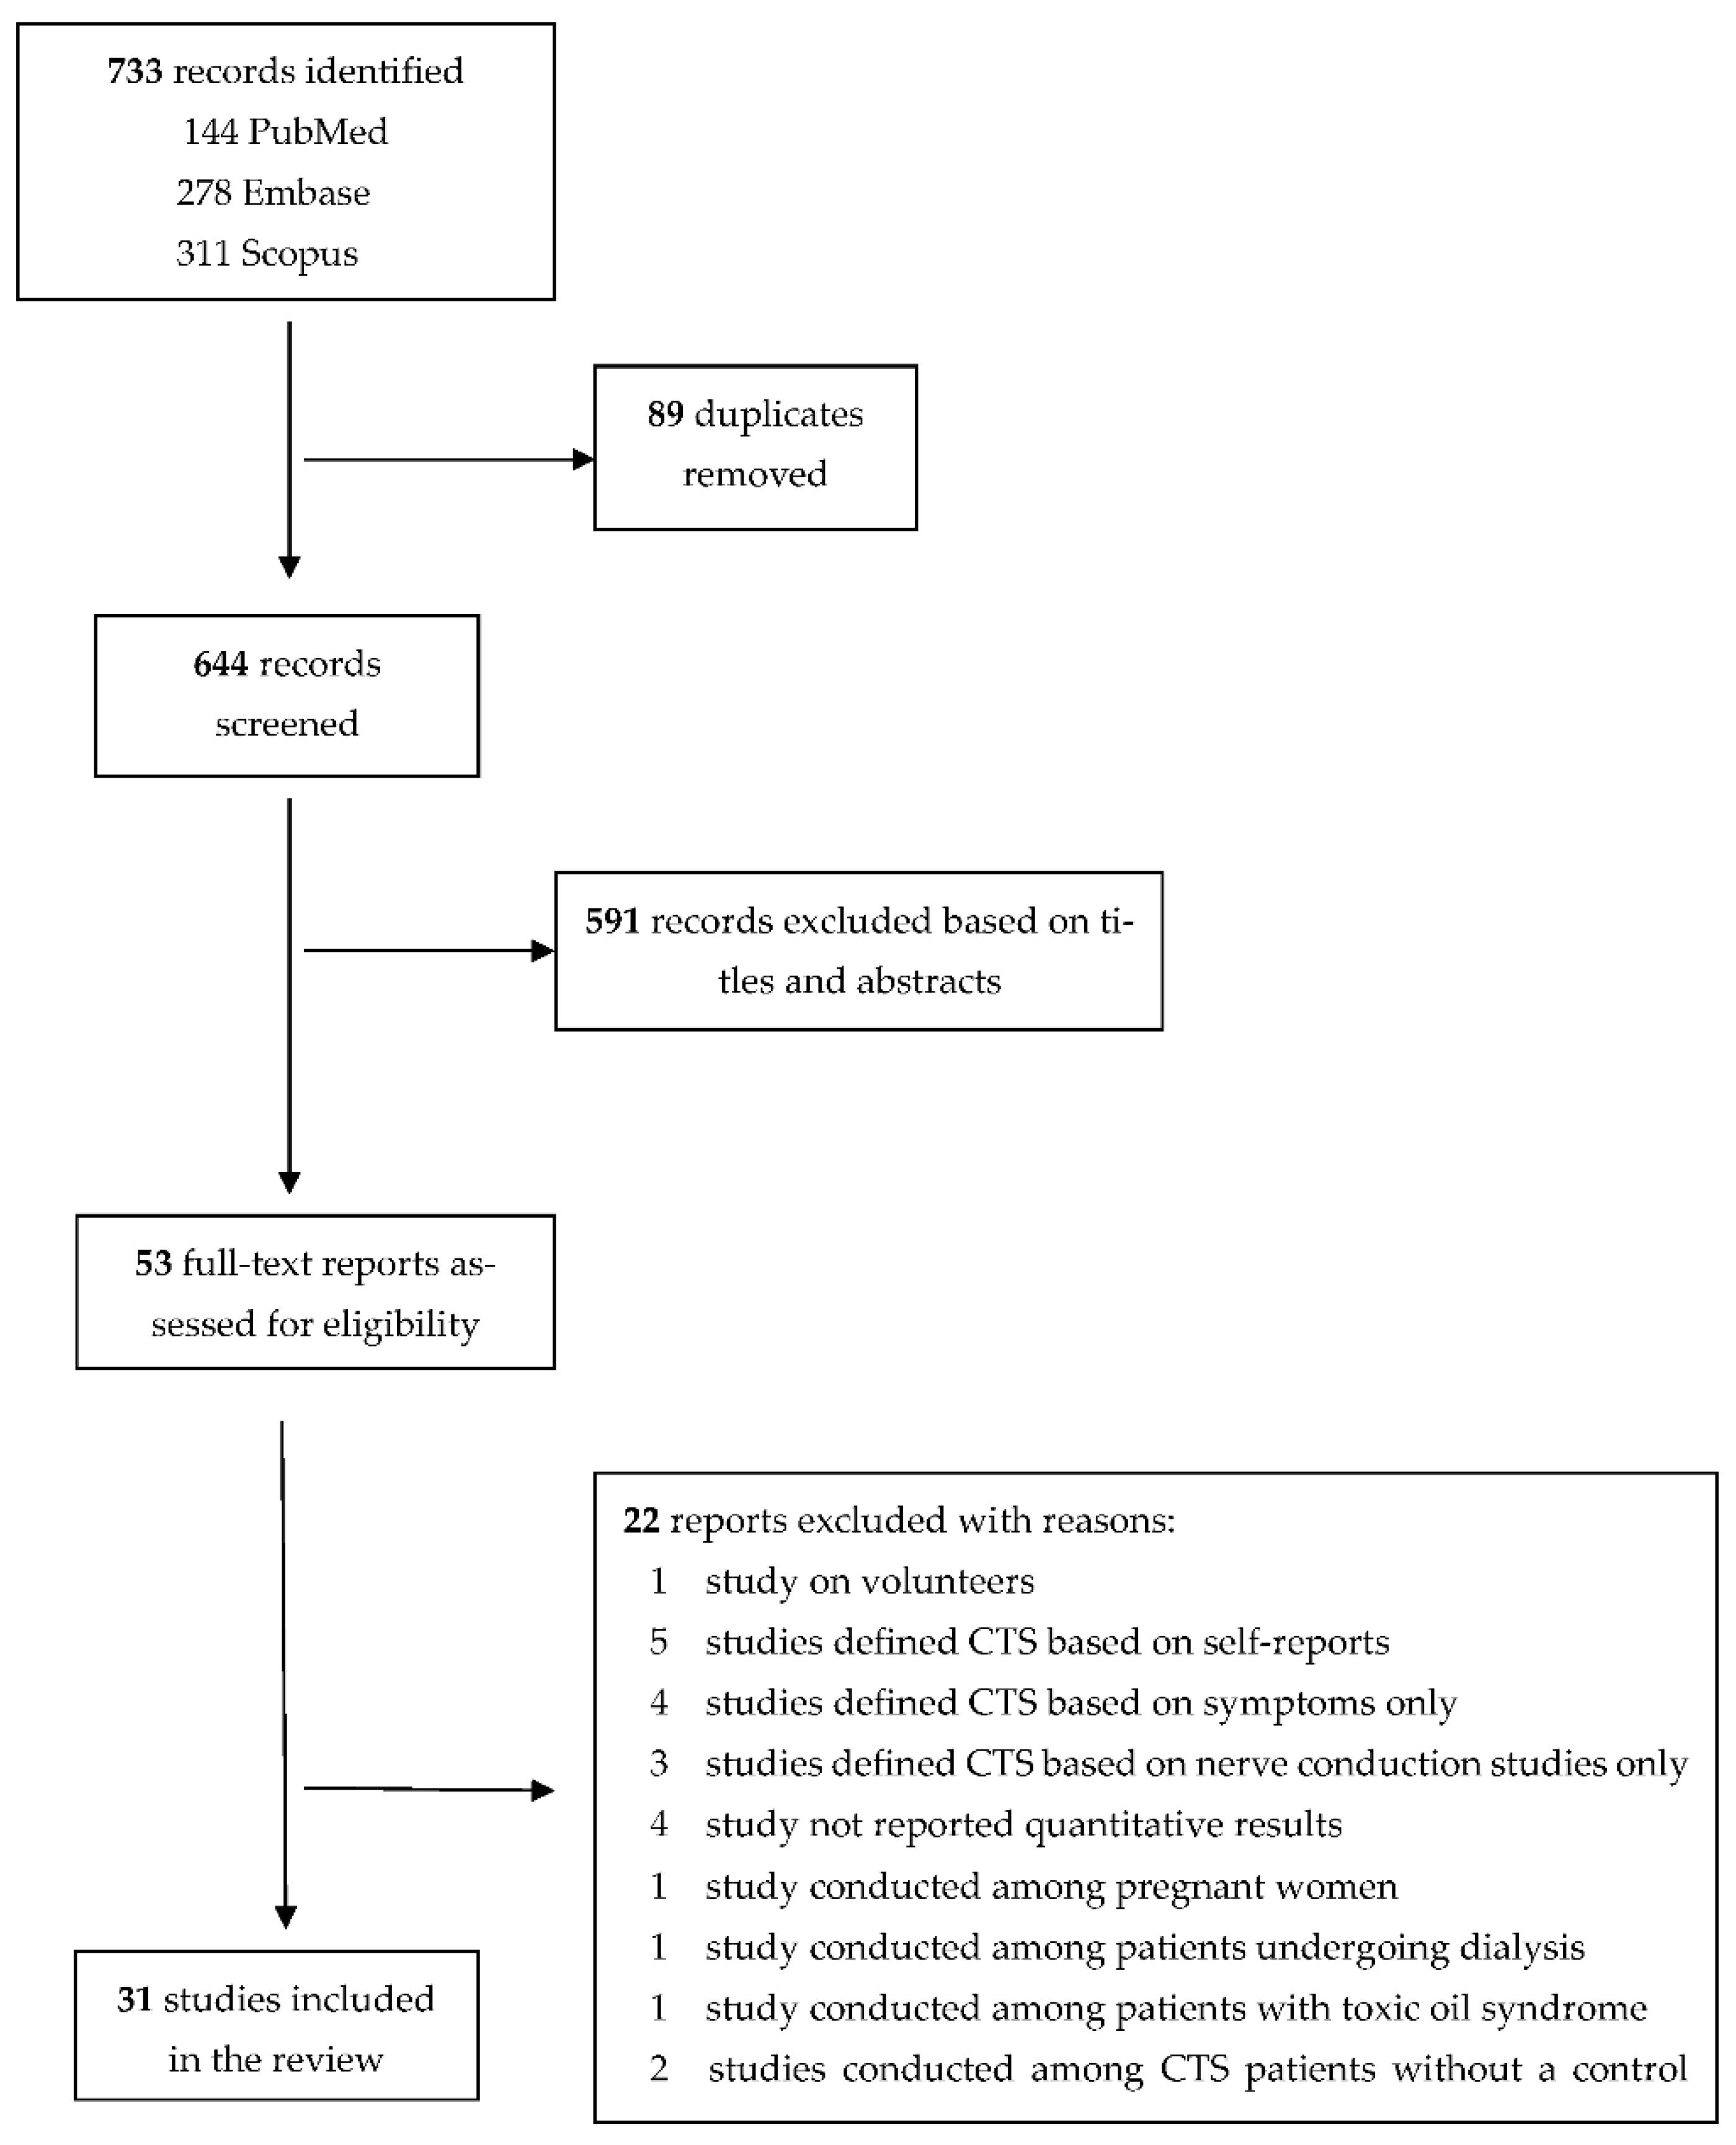
2.1. Search Strategy
2.2. Inclusion and Exclusion Criteria
2.2.1. Data Extraction
2.2.2. Quality Assessment
2.2.3. Statistical Analysis
3. Results
4. Discussion
5. Conclusions
Author Contributions
Funding
Institutional Review Board Statement
Informed Consent Statement
Data Availability Statement
Conflicts of Interest
Appendix A

| Type of Domain | Criteria Definition | Classification (Potential for Bias) |
|---|---|---|
| Selection bias | Sampling method of the study population, representativeness, response rate, difference between responders and non-responders, investigation, and control of variables, in case of difference between responders and non-responders | Weak: Target population defined as representative of the general population or subgroup of the general population (specific age group, women, men, specific geographic area, and specific occupational group), and response rate is above 80%. Moderate: Target population defined as somewhat representative of the general population, a restricted subgroup of the general population, response rate 60–79%. Strong: Target population defined as “self-referred”/volunteers, response rate less than 60%. |
| Performance bias | Valid and reliable assessment of exposure Assessors blinded for outcome status | Weak: Smoking status was defined as never, past, and current smokers. Information on the number of cigarettes smoked per day or number of pack-years smoked. The assessors of smoking status blinded towards the outcome. Moderate: Smoking status was defined as never, past, and current smokers. No information on the number of cigarettes smoked/day or number of pack-years smoked. Strong: A dichotomous question was used, and never-smokers or current smokers were not recognized from past smokers, assessors not blinded to outcome status. |
| Detection bias | Clear definition of outcome Standard method for outcome assessment Assessor of outcome blinded to exposure status | Weak: The outcome was defined by clinical diagnosis and nerve conduction studies. Moderate: The outcome was defined by clinical diagnosis only. Strong: Self-reported outcome, assessors not blinded to exposure status. |
| Confounding | Matching Stratification Statistical analysis | Weak: Considered confounders and controlled for 80–100% of confounders. Moderate: Considered confounders and controlled for 60–79%. Strong: Considered confounders and controlled for less than 60%. |
| Attrition bias | Withdrawal and drop-out rates Size of missing data | Weak: Follow up participation rate of more than 80% or missing data of less than 20%. Moderate: Follow up participation rate of 60–79% or missing data of 20–40%. Strong: Follow up participation rate of less than 60% or missing data of more than 40%. |
| Author, Year, and Country | Study Population | Age | Gender | Sample Size (in Analysis) | Smoking | Outcome | Risk of Bias | Results | Adjustment for Other Covariates | ||||
|---|---|---|---|---|---|---|---|---|---|---|---|---|---|
| Selection | Performance | Detection | Confounding | Attrition | |||||||||
| Low 2021, USA [40] | Part of the National Ambulatory Medical Care Survey between 2006 and 2015. A random sample of visits to non-federally employed, office-based physicians, community health centers, and advanced practice providers | 22.9% aged 18–39 years, 33.8% aged 40–59 years, and 43.3% aged 60 years or older | Both, 59.4% were females | 322,092 (191,397 females and 130,695 males) | Current smokers vs. never, past, or unknown smokers | CTS identified based on ICD codes | Moderate | Strong | Moderate | Moderate | Moderate | OR 1.32 (CI 1.07–1.63) | Age, sex, obesity, diabetes, hypothyroidism, and chronic kidney disease |
| Hashimoto 2020, Japan [44] | A random sample of public servants from town of Obuse | Mean age 69.4 (age range 50–89) | Both, 50% were females | 379 | Pack-years (+100 packs/year × number of years smoked) | Symptoms and nerve conduction study. Subjects with history of CTS diagnosis or surgery were also defined as prevalent cases | Strong | Moderate | Moderate | Strong | Weak | OR 1.0 (95% CI 1.0–1.0) | Unadjusted |
| Pramchoo 2020, Thailand [41] | Rubber tappers who were household members of the Pawong Rubber Fund Cooperative in Pawong subdistrict, Mueang district | Mean age 49.8 ± 9.0 for CTS cases and 49.1 ± 11.7 for non-CTS participants | Both, 47.6% were females | 534 | Smoking (no/yes) | CTS diagnosis based on symptoms + clinical examination | Moderate | Strong | Moderate | Strong | Weak | OR 0.8 (95% CI 0.5–1.3) | Unadjusted |
| El-Helaly 2017, Egypt [45] | Medical technicians of the King Fahd Hospital clinical laboratory | Mean age 37.2 ± 9.5 | Both, 67.4% were females | 279 | Current smoking (no/yes) | Diagnosis of CTS was based on Kamath and Stothard clinical questionnaire and nerve conduction study | Moderate | Strong | Weak | Moderate | Weak | 11.1% of 27 participants with CTS and 7.9% of 252 participants without CTS were current smokers. Estimated OR 1.45 (95% CI 0.40–5.24) | Unadjusted. Pregnant, those with diabetes, hypothyroidism, rheumatoid arthritis or with a history of hand trauma were excluded |
| Ricco & Signorelli 2017, Italy [34] | Consecutive patients referred to a single occupational health service from 31 meat processing plants | Mean age 37.0 ± 10.6 | Both, 45.6% were females | 434 | Current or past smokers vs. never-smokers | Diagnosis of CTS was based on symptoms, clinical signs, and ultrasonography and/or nerve conduction study | Strong | Strong | Weak | Strong | Weak | OR 1.909 (95% CI 1.107–3.293) | Unadjusted |
| Hegmann 2016, USA [35] | Employees of manufacturing and food processing, and office workers were recruited from 35 facilities, involving 25 diverse industries, located in the states of Illinois, Utah, Washington, and Wisconsin | Mean age 45.1 ± 9.8 years among CTS cases and 40.3 ± 11.5 years among those without CTS | Both, 59.6% were females | 1824 | Ever-smokers vs. never-smokers | CTS diagnosis was based on symptoms and nerve conduction study | Moderate | Strong | Weak | Moderate | Moderate | OR 1.24 (95% CI 0.96–1.60) | Sex, body mass index and job strain index |
| Jung 2016, Korea [39] | Healthy orchardists living in Gyeongsangnam-do who participated in the health promotion program | Mean age 58.9 ± 7.9 | Both, 53.8% were females | 377 | Never, past, and current smokers | Diagnosis of CTS was based on symptoms, clinical signs, and nerve conduction study | Moderate | Moderate | Weak | Strong | Weak | Prevalence of past smoking was 44.1% in participants with CTS and 55.9% in those without CTS. Prevalence of current smoking was 50.9% in participants with CTS and 49.1% in those without CTS. Estimated OR 0.69 (CI 0.40–1.17) for past smoking and 0.90 (CI 0.50–1.63) for current smoking | Unadjusted |
| Kiani 2014, Iran [42] | Convenience sample of patients with diabetes | Mean age 54.0 ± 13.2 for females and 51.6 ± 16.5 for males | Both, 69% were females | 432 | Current smoking (no/yes) | Symptoms and clinical examination | Strong | Strong | Moderate | Strong | Weak | 2.7% of patients with CTS (N = 37) and 6.6% of those without CTS (N = 395) were current smokers. Estimated OR 0.39 (95% CI 0.05–2.99) | Unadjusted |
| Eleftheriou 2012, Greece [36] | Occupational population (data entry and processing unit) | 45.2 ± 9.46 | Both, 83.6% females | 461 | Ever smokers vs. never smokers | Case definition A: history of CTS diagnosed by physician, including surgery due to CTS. Definition B: definition A + suggestive CTS at clinical examination | Moderate | Strong | Moderate | Moderate | Weak | OR of case definition A for ever smoking 1.99 (1.01–2.54). OR of case definition B for ever smoking 1.69 (1.03–2.76) | Age, sex, keyboard use, and physical activity |
| Shiri 2011, Finland [37] | General population | 30 years or older, mean age 52 years | Both, 48% males | 6254 | Home interview: (1) current smokers (2) past smokers (3) occasional smokers, (4) never smokers. | Clinical diagnosis. Probable, possible CTS, surgery due to CTS | Weak | Weak | Moderate | Weak | Moderate | OR of possible/probable CTS for current smoking 2.1 (1.4–3.1), for past smoking 1.2 (0.8–1.6) and for ever smoking 1.50 (1.1–2.0) OR of surgery due to CTS for current smoking 1.5 (0.7–3.2) | Age, sex, education, somatization, hand grip with high forces, and work using vibrating tools |
| Maghsoudipour 2008, Iran [43] | Occupational population (auto factories) | Mean age in CTS group 29.85, years mean age in healthy group 27.95 years | Both, 23% were females | 395 | Cigarette smokers vs. nonsmokers | Symptoms + clinical diagnosis + nerve conduction study | Moderate | Strong | Weak | Weak | Weak | OR 4.68 (95% CI 1.08–11.80) for current smoking | Age, gender, marital status, body mass index, education, job duration, workplace risk factors (force exertion > 1 kg, rapid hand movement, break time > 75 min, wrist bending/twisting, job rotation, using vibrating tools |
| Atroshi 2007, Sweden [10] | General population | 25–65 | Both, 53.8% females | 2003 (925 males and 1078 females) | Current smokers versus non-smokers | Symptoms + clinical diagnosis + nerve conduction study | Weak | Strong | Weak | Moderate | Weak | OR 1.79 (95% CI 1.10–2.90) | Sex, age ≥ 40 years, overweight and keyboard use ≥1 h/day |
| Frost 1998 Denmark [38] | Occupational population (slaughterhouse workers and chemical factory workers) | Mean age 40.5 years | Both, 84.7% were males | 1141 (966 males and 175 females) | Ever smokers | Symptoms, clinical diagnosis, nerve conduction study or previous surgery due to CTS | Moderate | Strong | Weak | Weak | Weak | OR for ever smoking 0.65 (95% CI 0.34–1.24) | Age (stratified), gender, occupational risk factor, wrist trauma, body mass index, and medical condition |
| Author, Year and Country | Study Population | Age | Sex | Sample Size (in Analysis) | Smoking | Outcome | Risk of Bias | Results | Adjustment for Other Covariates | ||||
|---|---|---|---|---|---|---|---|---|---|---|---|---|---|
| Selection | Performance | Detection | Confounding | Attrition | |||||||||
| Ulbrichtova 2020, Slovakia [46] | Cases were consecutive electrophysi- ologically confirmed CTS patients and controls were a randomly selected patients without any known systemic disease or symptoms of CTS who were treated at the Clinic of Occupational Medicine and Toxicology | Age range 27‒63 for cases and 21–63 for controls, mean age 52.5 ± 5.9 for cases and 49.6 ± 9 for controls | Both, 51.9% of cases and 54% of controls were females | 162 cases and 300 controls | Never/past/current. | Symptoms and nerve conduction study | Weak | Moderate | Weak | Moderate | Weak | OR 1.51 (95% CI 0.94–2.42) for smoking; It seems the OR is for ever vs. never smoking | Age, sex, body mass index, alcohol drinking, diabetes, and hypertension |
| Bhanderi 2017, India [47] | CTS cases were patients managed at K M Patel School of Physiotherapy, Gujarat. Controls were patients attending the same institute, patients attending other outpatient departments or relatives of patients | Mean age 47.6 ± 10.96 years (range, 18–80) for cases and 47.5 ± 10.89 (range, 20–80) for controls | both, 78.8% were females | 137 cases and 274 controls | Never, past, and current smokers | Symptoms, clinical, and nerve conduction study | Moderate | Moderate | Weak | Moderate | Weak | OR 0.37 (CI 0.02–6.17) for past smokers and 1.40 (CI 0.71–2.78) for current smokers | Education, family history, short stature, obesity, diabetes, rheumatoid arthritis, hypothyroidism, hypertension, and computer use |
| Guan 2018, China [48] | Cases were outpatient and surgical CTS cases free of other diseases recruited from a single medical center and controls were outpatients | 41–70 | Both, 82.5% of cases and 82.5% of controls were females | 1512 cases and 4536 controls | Current smokers vs. nonsmokers | Symptoms, clinical, and nerve conduction study | Moderate | Strong | Weak | Strong | Weak | OR 4.86 (95% CI 3.99–5.73) | Matched by sex |
| Coggon 2013, UK [49] | Cases were CTS patients and controls were patients attended the accident and emergency department | 20–64 | Both, 68% were females | 1230 (457 cases and 773 controls) | Never, past, and current smokers | Symptoms + nerve conduction study | High | Moderate | Low | Low | Low | OR 1.1 (CI 0.8–1.4) for past smokers and 0.6 (CI 0.4–0.8) for current smokers | Age, sex, ethnicity, body mass index, mental health, repeated movements of wrist or fingers, using hand-held vibrating tools, supervisor or colleagues support, and little choice in how or what work is done or in timetable and breaks |
| Mattioli 2009, Italy [50] | Cases: random sample of local hospitals. Controls: random sample of national health service registries | 18–65 years | Both, 84% were females | 191 cases and 286 controls. | Never-smokers, past smokers, current smokers, and pack-years | Surgery due to CTS (symptoms, clinical diagnosis, and nerve conduction study) | Weak | Weak | Weak | Moderate | Weak | OR 0.7 (95% CI 0.4–1.1) for past smoking and 1.1 (95% CI 0.7–1.7) for current smoking | Frequency matching by age and gender |
| Fung 2007, Hong Kong [51] | Outpatient CTS patienta and patient controls were recruited from three centers | Age range 18–60, mean age 46.3 ± 9.1 | Both, 84.5% were females | 166 cases and 111 controls | Current smokers vs. non-smokers | Symptoms + clinical assessment and nerve conduction study for atypical cases (51% of cases) | Moderate | Strong | Weak | Moderate | Weak | 4.2% of cases and 16.2% of controls were smokers; OR for smoking 0.23 (0.09–0.57) | Unadjusted Patients with rheumatoid arthritis, diabetes, hypothyroidism, cervical spondylosis, post-traumatic wrist deformities, and pregnant women were excluded from both cases and controls |
| Geoghegan 2004, UK [11] | General practice population, the West Midland section of The UK General Practice Research Database | 16–96, Mean age 46 | Both, 72% were females | 16955 (3391 cases and 13564 controls) | Current smokers vs. non-smokers | Registry data: diagnosis of CTS, surgery due to CTS | Weak | Strong | Moderate | Moderate | Strong | OR of CTS was 1.03 (CI 0.93–1.13) for smoking; OR of surgery due to CTS was 1.04 (CI 0.86–1.26) | Age, sex, general practice, date of diagnosis, and mean annual consultation rates |
| Karpitskaya 2002, USA [52] | Patient population. Patients who underwent CTR, control group formed of patient seen for general reconstructive surgery or those with acute hand diagnoses | Mean age 50 ± 15 for cases, 47 ± 14 for controls | Both, 59.6% were females | 514 cases and 100 hospital controls | Never, past, and current smoking, and pack-years, estimates reported for current smokers vs. non-smokers | Surgery, due to CTS based on hospital records | Moderate | Weak | Weak | Strong | Weak | 26.3% of cases and 33% of controls were smokers; OR 0.72 (95% CI 0.45–1.15) for current smoking | Unadjusted |
| Ferry 2000, UK [53] | General practice population. The Royal College of General Practitioners’ Oral Contraception Study attendees | Mean age 41.9 for both groups | Female | 1264 cases and 1264 controls | Smokers vs. non-smokers | General practitioner diagnosed CTS | Weak | Strong | Moderate | Moderate | Weak | OR 1.05 (95% CI 0.89–1.23) | Age |
| Wieslander 1989, Sweden [54] | Patients undergoing CTR as cases and other surgical patients as control group 1 and population sample as control group 2 | Age range 20–66 | Males | 177 (34 cases and 143 controls), two hospital controls and two population controls for each case | Current smokers vs. non-smokers | Surgery due to CTS (clinical diagnosis + nerve conduction study) | Moderate | Strong | Weak | Moderate | Weak | OR for current smoking 1.5 (0.7–3.5) for cases and all controls | Age and year of operation for hospital controls |
| Author, Year and Country | Study Population | Age | Gender | Sample Size (in Analysis) | Smoking | Outcome | Risk of Bias | Results | Adjustment for Other Covariates | ||||
|---|---|---|---|---|---|---|---|---|---|---|---|---|---|
| Selection | Performance | Detection | Confounding | Attrition | |||||||||
| Rydberg 2020, Sweden [25] | A population-based study of the Malmö Diet and Cancer Study, median follow-up 21.4 years | 46–73 mean 57 ± 7.6 | both, 60% were females | 30,323 | Current smoking, yes/no | Information on diagnosis of CTS was obtained from register data, surgical codes were not avail-able; only ICD codes for clinical, and hospital-based CTS were available | Weak | Strong | Moderate | Moderate | Weak | HR 1.06 (CI 0.92–1.23) | Age, sex, alcohol consumption, body mass index, hypertension, and the use of antihypertensive treatment |
| Hulkkonen 2020, Finland [26] | The Northern Finland Birth Cohort 1966 participants, mean follow-up time 18.3 years | 31 years | Both, 48.5% were females | 6326 (3260 males, 3066 females) | Past or current smokers vs. never smokers | Diagnosis of CTS was based on out- and inpatient specialist care register data | Moderate | Strong | Moderate | Weak | Weak | HR 1.48 1.12–1.96) for both sexes combined and 1.66 (1.19–2.32) for females. The HR was not significant for males | Sex, occupational class, body mass index, exposure to heat, exposure to temperature changes, and exposure to vibration (for both sexes combined only) |
| Hulkkonen 2019, Finland [58] | The Northern Finland Birth Cohort 1966 participants, mean follow-up time 18.3 years | 31 years | Both, 52.2% were females | 8703 (4156 males, 4547 females) | Number of pack-years | Diagnosis of CTS was based on register data on out- and inpatient specialist care | Weak | Moderate | Moderate | Moderate | Weak | HR was 0.94 (CI 0.52–1.71) for packyears ≤10 and was 1.89 (CI 1.14–3.12) for pack-years >10 for males. It was 1.54 (1.11–2.15) for packyears ≤10 and 1.90 (CI 1.20–3.01) for pack-years >10 for females | Body mass index, socioeconomic status, and diabetes |
| Pourmemari 2018, Finland [27] | Population-based study linked to the Hospital Discharge Register for specialist medical care, 11-year follow-up | 52 ± 14 years | Both, 54% were females | 6177 | Never/occasional/past/current smoking | Register data on carpal tunnel release | Weak | Moderate | Weak | Moderate | Weak | HR 1.2 (CI 0.5–2.9 for male current smokers, 1.0 (CI 0.6–1.7 for female current smokers and 1.1 (CI 0.7–1.7) for both sexes combined current smokers. HR 1.1 (0.5–2.7) for male past smokers, 1.3 (0.7–2.3) for female past smokers and 1.2 (0.8–1.9) for both sexes combined past smokers | Age and sex |
| Harris-Adamson 2013, USA [55] | Full-time workers in industries primarily engaged in manufacturing, production, service, and construction | 31% were <30 years, 24% were 30–39 years, 26% were 40–49 years and 19% were 50 years or older | Both, 47% were females | 3514 | Never, past, current | CTS diagnosis based on symptoms and nerve conduction study | Weak | Moderate | Weak | Strong | Weak | IRR 1.09 (0.78–1.51) for current smokers and 1.05 (0.70–1.54) for past smokers | Unadjusted |
| Gell 2005, USA [22] | Workers from four industrial and three clerical worksites, 5.4 years follow-up | 19–69 | Both, 71% females | 432 | Smokers vs. non-smokers | Symptoms, clinical diagnosis and nerve conduction study or self-reported surgery due to CTS, since the time of the initial screening | Moderate | Strong | Weak | Strong | Strong | OR for smoking 0.88 (0.37–2.03) | Unadjusted |
| Werner 2005, USA [56] | Workers from an automobile assembly plant, 1-year follow-up | Mean age 49.8 for participants with CTS and 47.5 for those without CTS | Both, 25.5% were females | 189 | Currently smoking (no/yes) | Symptoms + nerve conduction study or self-reported physician diagnosed CTS, since the time of the initial screening | Strong | Strong | Weak | Strong | Weak | 56% of 20 participants with CTS and 51% of 169 participants without CTS during the follow-up were smokers at baseline, estimated risk ratio 1.08 (95% CI 0.71- 1.65) | Unadjusted |
| Nathan 2002, USA [57] | Four industrial sites (a steel mill, meat/food packaging, electronics, and plastics), 11-year follow-up | Mean age 34.86 ± 9.96 | Both, 56.6% were males | 256 (145 males and 111 females) | Smokers vs. non-smokers, a retrospective data | Symptoms + nerve conduction study or surgery due to CTS since the last follow-up visit | Moderate | Strong | Weak | Weak | Strong | Smokers vs. non-smokers, OR = 2.42 (1.06–5.51) | Age, gender, body mass index, vibration, and endocrine condition |
| Nathan 2005, USA [23] | 17-year follow-up | 60% males | 148 | Sum of the ratings of current smoking in 1984, 1989, and 1994 to 1995, where smoking equalled 1 and non-smoking equalled 0 | As above | Current smoking vs. non-smoking OR = 1.22 p = 0.66. Confidence interval not reported. | Gender, age, body mass index, repetition, heavy lifting, keyboard use, vibration, and force | ||||||
| Roquelaure 2001 France [24] | Occupational population, five footwear factories | Mean age 40.7 ± 7.7 | Both, 61% were females | 134 | Current smokers vs. non-smokers | Clinical diagnosis | Moderate | Strong | Moderate | Strong | Moderate | OR for current smoking 0.5 (0.1–2.2) | Unadjusted |
References
- Atroshi, I.; Gummesson, C.; Johnsson, R.; Ornstein, E.; Ranstam, J.; Rosén, I. Prevalence of Carpal Tunnel Syndrome in a General Population. JAMA 1999, 282, 153–158. [Google Scholar] [CrossRef]
- Mondelli, M.; Giannini, F.; Giacchi, M. Carpal Tunnel Syndrome Incidence in a General Population. Neurology 2002, 58, 289–294. [Google Scholar] [CrossRef] [PubMed]
- Jain, N.B.; Higgins, L.D.; Losina, E.; Collins, J.; Blazar, P.E.; Katz, J.N. Epidemiology of Musculoskeletal Upper Extremity Ambulatory Surgery in the United States. BMC Musculoskelet. Disord. 2014, 15, 4. [Google Scholar] [CrossRef] [PubMed] [Green Version]
- Latinovic, R.; Gulliford, M.C.; Hughes, R.A.C. Incidence of Common Compressive Neuropathies in Primary Care. J. Neurol. Neurosurg. Psychiatry 2006, 77, 263–265. [Google Scholar] [CrossRef] [PubMed] [Green Version]
- Hulkkonen, S.; Lampainen, K.; Auvinen, J.; Miettunen, J.; Karppinen, J.; Ryhänen, J. Incidence and Operations of Median, Ulnar and Radial Entrapment Neuropathies in Finland: A Nationwide Register Study. J. Hand Surg. Eur. Vol. 2020, 45, 226–230. [Google Scholar] [CrossRef]
- Tadjerbashi, K.; Åkesson, A.; Atroshi, I. Incidence of Referred Carpal Tunnel Syndrome and Carpal Tunnel Release Surgery in the General Population: Increase over Time and Regional Variations. J. Orthop. Surg. 2019, 27, 1–5. [Google Scholar] [CrossRef] [Green Version]
- Shiri, R.; Pourmemari, M.H.; Falah-Hassani, K.; Viikari-Juntura, E. The Effect of Excess Body Mass on the Risk of Carpal Tunnel Syndrome: A Meta-Analysis of 58 Studies. Obes. Rev. 2015, 16, 1094–1104. [Google Scholar] [CrossRef]
- Werner, R.A.; Albers, J.W.; Franzblau, A.; Armstrong, T.J. The Relationship between Body Mass Index and the Diagnosis of Carpal Tunnel Syndrome. Muscle Nerve 1994, 17, 632–636. [Google Scholar] [CrossRef] [Green Version]
- Pourmemari, M.H.; Shiri, R. Diabetes as a Risk Factor for Carpal Tunnel Syndrome: A Systematic Review and Meta-Analysis. Diabet. Med. 2016, 33, 10–16. [Google Scholar] [CrossRef]
- Atroshi, I.; Gummesson, C.; Ornstein, E.; Johnsson, R.; Ranstam, J. Carpal Tunnel Syndrome and Keyboard Use at Work: A Population-Based Study. Arthritis Rheum. 2007, 56, 3620–3625. [Google Scholar] [CrossRef]
- Geoghegan, J.M.; Clark, D.I.; Bainbridge, L.C.; Smith, C.; Hubbard, R. Risk Factors in Carpal Tunnel Syndrome. J. Hand Surg. 2004, 29, 315–320. [Google Scholar] [CrossRef] [PubMed]
- Shiri, R. Arthritis as a Risk Factor for Carpal Tunnel Syndrome: A Meta-Analysis. Scand. J. Rheumatol. 2016, 45, 339–346. [Google Scholar] [CrossRef] [PubMed]
- Shiri, R. Hypothyroidism and Carpal Tunnel Syndrome: A Meta-Analysis. Muscle Nerve 2014, 50, 879–883. [Google Scholar] [CrossRef]
- Mattioli, S.; Baldasseroni, A.; Curti, S.; Cooke, R.M.T.; Mandes, A.; Zanardi, F.; Farioli, A.; Buiatti, E.; Campo, G.; Violante, F.S. Incidence Rates of Surgically Treated Idiopathic Carpal Tunnel Syndrome in Blue- and White-Collar Workers and Housewives in Tuscany, Italy. Occup. Environ. Med. 2009, 66, 299–304. [Google Scholar] [CrossRef] [PubMed] [Green Version]
- Hakim, A.J.; Cherkas, L.; El Zayat, S.; MacGregor, A.J.; Spector, T.D. The genetic contribution to carpal tunnel syndrome in women: A twin study. Arthritis Rheum. 2002, 47, 275–279. [Google Scholar] [CrossRef] [PubMed]
- Allender, S.; Balakrishnan, R.; Scarborough, P.; Webster, P.; Rayner, M. The Burden of Smoking-Related Ill Health in the UK. Tob. Control 2009, 18, 262–267. [Google Scholar] [CrossRef]
- Winkelmann, B.R.; Boehm, B.O.; Nauck, M.; Kleist, P.; März, W.; Verho, N.K.; Ranjith, N.; Kneissl, G. Cigarette Smoking Is Independently Associated with Markers of Endothelial Dysfunction and Hyperinsulinaemia in Nondiabetic Individuals with Coronary Artery Disease. Curr. Med. Res. Opin. 2001, 17, 132–141. [Google Scholar] [CrossRef]
- Burke, A.; FitzGerald, G.A. Oxidative Stress and Smoking-Induced Vascular Injury. Prog. Cardiovasc. Dis. 2003, 46, 79–90. [Google Scholar] [CrossRef]
- Amankwah, K.S.; Kaufmann, R.C.; Weberg, A.D. Ultrastructural Changes in Neonatal Sciatic Nerve Tissue: Effects of Passive Maternal Smoking. Gynecol. Obstet. Investig. 1985, 20, 186–193. [Google Scholar] [CrossRef]
- Mondelli, M.; Mattioli, S.; Vinciguerra, C.; Ciaramitaro, P.; Aretini, A.; Greco, G.; Sicurelli, F.; Giorgi, S.; Curti, S. Comorbidities, Anthropometric, Demographic, and Lifestyle Risk Factors for Ulnar Neuropathy at the Elbow: A Case Control Study. J. Peripher. Nerv. Syst. 2020, 25, 401–412. [Google Scholar] [CrossRef]
- Pourmemari, M.H.; Viikari-Juntura, E.; Shiri, R. Smoking and Carpal Tunnel Syndrome: A Meta-Analysis. Muscle Nerve 2014, 49, 345–350. [Google Scholar] [CrossRef] [PubMed]
- Gell, N.; Werner, R.A.; Franzblau, A.; Ulin, S.S.; Armstrong, T.J. A Longitudinal Study of Industrial and Clerical Workers: Incidence of Carpal Tunnel Syndrome and Assessment of Risk Factors. J. Occup. Rehabil. 2005, 15, 47–55. [Google Scholar] [CrossRef] [PubMed] [Green Version]
- Nathan, P.A.; Istvan, J.A.; Meadows, K.D. A Longitudinal Study of Predictors of Research-Defined Carpal Tunnel Syndrome in Industrial Workers: Findings at 17 Years. J. Hand Surg. Br. 2005, 30, 593–598. [Google Scholar] [CrossRef]
- Roquelaure, Y.; Mariel, J.; Dano, C.; Fanello, S.; Penneau-Fontbonne, D. Prevalence, Incidence and Risk Factors of Carpal Tunnel Syndrome in a Large Footwear Factory. Int. J. Occup. Med. Environ. Health 2001, 14, 357–367. [Google Scholar]
- Rydberg, M.; Zimmerman, M.; Gottsäter, A.; Nilsson, P.M.; Melander, O.; Dahlin, L.B. Diabetes Mellitus as a Risk Factor for Compression Neuropathy: A Longitudinal Cohort Study from Southern Sweden. BMJ Open Diabetes Res. Care 2020, 8, e001298. [Google Scholar] [CrossRef] [PubMed] [Green Version]
- Hulkkonen, S.; Shiri, R.; Auvinen, J.; Miettunen, J.; Karppinen, J.; Ryhänen, J. Risk Factors of Hospitalization for Carpal Tunnel Syndrome among the General Working Population. Scand. J. Work Environ. Health 2020, 46, 43–49. [Google Scholar] [CrossRef]
- Pourmemari, M.H.; Heliövaara, M.; Viikari-Juntura, E.; Shiri, R. Carpal Tunnel Release: Lifetime Prevalence, Annual Incidence, and Risk Factors. Muscle Nerve 2018, 58, 497–502. [Google Scholar] [CrossRef] [PubMed]
- Armijo-Olivo, S.; Stiles, C.R.; Hagen, N.A.; Biondo, P.D.; Cummings, G.G. Assessment of Study Quality for Systematic Reviews: A Comparison of the Cochrane Collaboration Risk of Bias Tool and the Effective Public Health Practice Project Quality Assessment Tool: Methodological Research. J. Eval. Clin. Pract. 2012, 18, 12–18. [Google Scholar] [CrossRef]
- WOOLF, B. On Estimating the Relation between Blood Group and Disease. Ann. Hum. Genet. 1955, 19, 251–253. [Google Scholar] [CrossRef]
- Cumpston, M.; Li, T.; Page, M.J.; Chandler, J.; Welch, V.A.; Higgins, J.P.; Thomas, J. Updated Guidance for Trusted Systematic Reviews: A New Edition of the Cochrane Handbook for Systematic Reviews of Interventions. Cochrane Database Syst. Rev. 2019, 10, ED000142. [Google Scholar] [CrossRef] [Green Version]
- Higgins, J.P.T.; Thompson, S.G. Quantifying Heterogeneity in a Meta-Analysis. Stat. Med. 2002, 21, 1539–1558. [Google Scholar] [CrossRef]
- Rothstein Hannah, S.A.B.M. Publication Bias in Meta-Analysis: Prevention, Assessment and Adjustments; Wiley: New York, NY, USA, 2005. [Google Scholar]
- Duval, S.; Tweedie, R. Trim and Fill: A Simple Funnel-Plot-Based Method of Testing and Adjusting for Publication Bias in Meta-Analysis. Biometrics 2000, 56, 455–463. [Google Scholar] [CrossRef] [PubMed]
- Ricco, M.; Signorelli, C. Personal and Occupational Risk Factors for Carpal Tunnel Syndrome in Meat Processing Industry Workers in Northern Italy. Med. Pr. 2017, 68, 199–209. [Google Scholar] [CrossRef]
- Hegmann, K.T.; Thiese, M.S.; Kapellusch, J.; Merryweather, A.S.; Bao, S.; Silverstein, B.; Wood, E.M.; Kendall, R.; Wertsch, J.; Foster, J.; et al. Association Between Cardiovascular Risk Factors and Carpal Tunnel Syndrome in Pooled Occupational Cohorts. J. Occup. Environ. Med. 2016, 58, 87–93. [Google Scholar] [CrossRef] [PubMed]
- Eleftheriou, A.; Rachiotis, G.; Varitimidis, S.E.; Koutis, C.; Malizos, K.N.; Hadjichristodoulou, C. Cumulative Keyboard Strokes: A Possible Risk Factor for Carpal Tunnel Syndrome. J. Occup. Med. Toxicol. 2012, 7, 16. [Google Scholar] [CrossRef] [PubMed] [Green Version]
- Shiri, R.; Heliövaara, M.; Moilanen, L.; Viikari, J.; Liira, H.; Viikari-Juntura, E. Associations of Cardiovascular Risk Factors, Carotid Intima-Media Thickness and Manifest Atherosclerotic Vascular Disease with Carpal Tunnel Syndrome. BMC Musculoskelet. Disord. 2011, 12, 80. [Google Scholar] [CrossRef] [PubMed]
- Frost, P.; Andersen, J.H.; Nielsen, V.K. Occurrence of Carpal Tunnel Syndrome among Slaughterhouse Workers. Scand. J. Work Environ. Health 1998, 24, 285–292. [Google Scholar] [CrossRef] [PubMed] [Green Version]
- Jung, H.Y.; Kong, M.S.; Lee, S.H.; Lee, C.H.; Oh, M.K.; Lee, E.S.; Shin, H.; Yoon, C.H. Prevalence and Related Characteristics of Carpal Tunnel Syndrome Among Orchardists in the Gyeongsangnam-Do Region. Ann. Rehabil. Med. 2016, 40, 902–914. [Google Scholar] [CrossRef] [Green Version]
- Low, J.; Kong, A.; Castro, G.; Rodriguez de la Vega, P.; Lozano, J.; Varella, M. Association Between Diabetes Mellitus and Carpal Tunnel Syndrome: Results From the United States National Ambulatory Medical Care Survey. Cureus 2021, 13, e13844. [Google Scholar] [CrossRef]
- Pramchoo, W.; Geater, A.F.; Tangtrakulwanich, B. Physical Ergonomic Risk Factors of Carpal Tunnel Syndrome among Rubber Tappers. Arch. Environ. Occup. Health 2020, 75, 1–9. [Google Scholar] [CrossRef] [PubMed]
- Kiani, J.; Goharifar, H.; Moghimbeigi, A.; Azizkhani, H. Prevalence and Risk Factors of Five Most Common Upper Extremity Disorders in Diabetics. J. Res. Health Sci. 2014, 14, 92–95. [Google Scholar] [PubMed]
- Maghsoudipour, M.; Moghimi, S.; Dehghaan, F.; Rahimpanah, A. Association of Occupational and Non-Occupational Risk Factors with the Prevalence of Work Related Carpal Tunnel Syndrome. J. Occup. Rehabil. 2008, 18, 152–156. [Google Scholar] [CrossRef] [PubMed]
- Hashimoto, S.; Ikegami, S.; Nishimura, H.; Uchiyama, S.; Takahashi, J.; Kato, H. Prevalence and Risk Factors of Carpal Tunnel Syndrome in Japanese Aged 50 to 89 Years. J. Hand Surg. Asian Pac. Vol. 2020, 25, 320–327. [Google Scholar] [CrossRef] [PubMed]
- El-Helaly, M.; Balkhy, H.H.; Vallenius, L. Carpal Tunnel Syndrome among Laboratory Technicians in Relation to Personal and Ergonomic Factors at Work. J. Occup. Health 2017, 59, 513–520. [Google Scholar] [CrossRef] [Green Version]
- Ulbrichtová, R.; Jakušová, V.; Osina, O.; Zibolenová, J.; Kuka, S.; Hudečková, H. Association of the Role of Personal Variables and Nonoccupational Risk Factors for Work-Related Carpal Tunnel Syndrome. Cent. Eur. J. Public Health 2020, 28, 274–278. [Google Scholar] [CrossRef]
- Bhanderi, D.; Mishra, D.; Parikh, S.; Sharma, D. Computer Use and Carpal Tunnel Syndrome: A Case-Control Study. Indian J. Occup. Environ. Med. 2017, 21, 109–114. [Google Scholar] [CrossRef]
- Guan, W.; Lao, J.; Gu, Y.; Zhao, X.; Rui, J.; Gao, K. Case-Control Study on Individual Risk Factors of Carpal Tunnel Syndrome. Exp. Ther. Med. 2018, 15, 2761–2766. [Google Scholar] [CrossRef] [Green Version]
- Coggon, D.; Ntani, G.; Harris, E.C.; Linaker, C.; van der Star, R.; Cooper, C.; Palmer, K.T. Differences in Risk Factors for Neurophysiologically Confirmed Carpal Tunnel Syndrome and Illness with Similar Symptoms but Normal Median Nerve Function: A Case-Control Study. BMC Musculoskelet. Disord. 2013, 14, 240. [Google Scholar] [CrossRef] [Green Version]
- Mattioli, S.; Baldasseroni, A.; Bovenzi, M.; Curti, S.; Cooke, R.M.T.; Campo, G.; Barbieri, P.G.; Ghersi, R.; Broccoli, M.; Cancellieri, M.P.; et al. Risk Factors for Operated Carpal Tunnel Syndrome: A Multicenter Population-Based Case-Control Study. BMC Public Health 2009, 9, 343. [Google Scholar] [CrossRef] [Green Version]
- Fung, B.K.; Chan, K.Y.; Lam, L.Y.; Cheung, S.Y.; Choy, N.K.; Chu, K.W.; Chung, L.Y.; Liu, W.W.; Tai, K.C.; Yung, S.Y.; et al. Study of Wrist Posture, Loading and Repetitive Motion as Risk Factors for Developing Carpal Tunnel Syndrome. Hand Surg. 2007, 12, 13–18. [Google Scholar] [CrossRef]
- Karpitskaya, Y.; Novak, C.B.; Mackinnon, S.E. Prevalence of Smoking, Obesity, Diabetes Mellitus, and Thyroid Disease in Patients with Carpal Tunnel Syndrome. Ann. Plast. Surg. 2002, 48, 269–273. [Google Scholar] [CrossRef] [PubMed]
- Ferry, S.; Hannaford, P.; Warskyj, M.; Lewis, M.; Croft, P. Carpal Tunnel Syndrome: A Nested Case-Control Study of Risk Factors in Women. Am. J. Epidemiol. 2000, 151, 566–574. [Google Scholar] [CrossRef] [PubMed] [Green Version]
- Wieslander, G.; Norback, D.; Gothe, C.J.; Juhlin, L. Carpal Tunnel Syndrome (CTS) and Exposure to Vibration, Repetitive Wrist Movements, and Heavy Manual Work: A Case-Referent Study. Br. J. Ind. Med. 1989, 46, 43–47. [Google Scholar] [CrossRef] [PubMed] [Green Version]
- Harris-Adamson, C.; Eisen, E.A.; Dale, A.M.; Evanoff, B.; Hegmann, K.T.; Thiese, M.S.; Kapellusch, J.M.; Garg, A.; Burt, S.; Bao, S.; et al. Personal and Workplace Psychosocial Risk Factors for Carpal Tunnel Syndrome: A Pooled Study Cohort. Occup. Environ. Med. 2013, 70, 529–537. [Google Scholar] [CrossRef]
- Werner, R.A.; Franzblau, A.; Gell, N.; Hartigan, A.G.; Ebersole, M.; Armstrong, T.J. Incidence of Carpal Tunnel Syndrome among Automobile Assembly Workers and Assessment of Risk Factors. J. Occup. Environ. Med. 2005, 47, 1044–1050. [Google Scholar] [CrossRef]
- Nathan, P.A.; Meadows, K.D.; Istvan, J.A. Predictors of Carpal Tunnel Syndrome: An 11-Year Study of Industrial Workers. J. Hand Surg. 2002, 27, 644–651. [Google Scholar] [CrossRef]
- Hulkkonen, S.; Auvinen, J.; Miettunen, J.; Karppinen, J.; Ryhänen, J. Smoking as Risk Factor for Carpal Tunnel Syndrome: A Birth Cohort Study. Muscle Nerve 2019, 60, 299–304. [Google Scholar] [CrossRef]
- Kozak, A.; Schedlbauer, G.; Wirth, T.; Euler, U.; Westermann, C.; Nienhaus, A. Association between Work-Related Biomechanical Risk Factors and the Occurrence of Carpal Tunnel Syndrome: An Overview of Systematic Reviews and a Meta-Analysis of Current Research. BMC Musculoskelet. Disord. 2015, 16, 231. [Google Scholar] [CrossRef] [Green Version]
- Violante, F.S.; Farioli, A.; Graziosi, F.; Marinelli, F.; Curti, S.; Armstrong, T.J.; Mattioli, S.; Bonfiglioli, R. Carpal Tunnel Syndrome and Manual Work: The OCTOPUS Cohort, Results of a Ten-Year Longitudinal Study. Scand. J. Work Environ. Health 2016, 42, 280–290. [Google Scholar] [CrossRef] [Green Version]
- Möllestam, K.; Englund, M.; Atroshi, I. Association of Clinically Relevant Carpal Tunnel Syndrome with Type of Work and Level of Education: A General-Population Study. Sci. Rep. 2021, 11, 19850. [Google Scholar] [CrossRef]
- Palmer, K.T.; Syddall, H.; Cooper, C.; Coggon, D. Smoking and Musculoskeletal Disorders: Findings from a British National Survey. Ann. Rheum. Dis. 2003, 62, 33–36. [Google Scholar] [CrossRef]
- Kuharić, M.; Zibar, L. Screening for Carpal Tunnel Syndrome in Patients on Chronic Hemodialysis. Acta Med. Acad. 2019, 48, 167–176. [Google Scholar] [CrossRef] [PubMed]
- Ganel, A.; Engel, J.; Sela, M.; Brooks, M. Nerve Entrapments Associated with Postmastectomy Lymphedema. Cancer 1979, 44, 2254–2259. [Google Scholar] [CrossRef]
- Vecht, C.J. Arm Pain in the Patient with Breast Cancer. J. Pain Symptom Manag. 1990, 5, 109–117. [Google Scholar] [CrossRef]
- Bozentka, D.; Beredjiklian, P.; Chan, P.; Schmidt, S. Hand Related Disorders Following Axillary Dissection for Breast Cancer. Univ. PA Orthop. J. 2001, 14, 35–37. [Google Scholar]
- Brigham, J.; Lessov-Schlaggar, C.N.; Javitz, H.S.; Krasnow, R.E.; Tildesley, E.; Andrews, J.; Hops, H.; Cornelius, M.D.; Day, N.L.; McElroy, M.; et al. Validity of Recall of Tobacco Use in Two Prospective Cohorts. Am. J. Epidemiol. 2010, 172, 828. [Google Scholar] [CrossRef]
- Means, B.; Habina, K.; Swan, G. Cognitive Research on Response Error in Survey Questions on Smoking. National Center for Health Statistics. Vital Health Stat. 1992, 6, 22–31. [Google Scholar]


| Search | Query | No of Items Found |
|---|---|---|
| PubMed | ||
| (carpal tunnel[tiab] OR carpal tunnel syndrome[MeSH] OR median nerve[tiab] OR median neuropathy[tiab]) AND (smok * OR tobacco[tiab] OR cigar * OR life-style OR lifestyle) | 144 | |
| Embase | ||
| (‘carpal tunnel syndrome’:ab,ti OR ‘median nerve compression’:ab,ti OR ‘median nerve’:ab,ti OR ‘carpal tunnel syndrome’/exp OR ‘median nerve compression’/exp OR ‘median nerve injury’/exp) AND (smok *:ab,ti OR cigar *:ab,ti OR ‘smoking’/exp OR ‘cigarette’/exp OR ‘cigar’/exp OR ‘tobacco’/exp OR tobacco:ab,ti OR lifestyle:ab,ti OR life-style:ab,ti) | 278 | |
| Scopus | ||
| (carpal tunnel OR median nerve OR median neuropathy) AND (smok * OR tobacco OR cigar * OR life-style OR lifestyle) | 311 | |
| Risk of Bias | Ever Smoking | Current Smoking | ||||||
|---|---|---|---|---|---|---|---|---|
| No. of Studies | OR | 95% CI | I2 (%) | No. of Studies | OR | 95% CI | I2 (%) | |
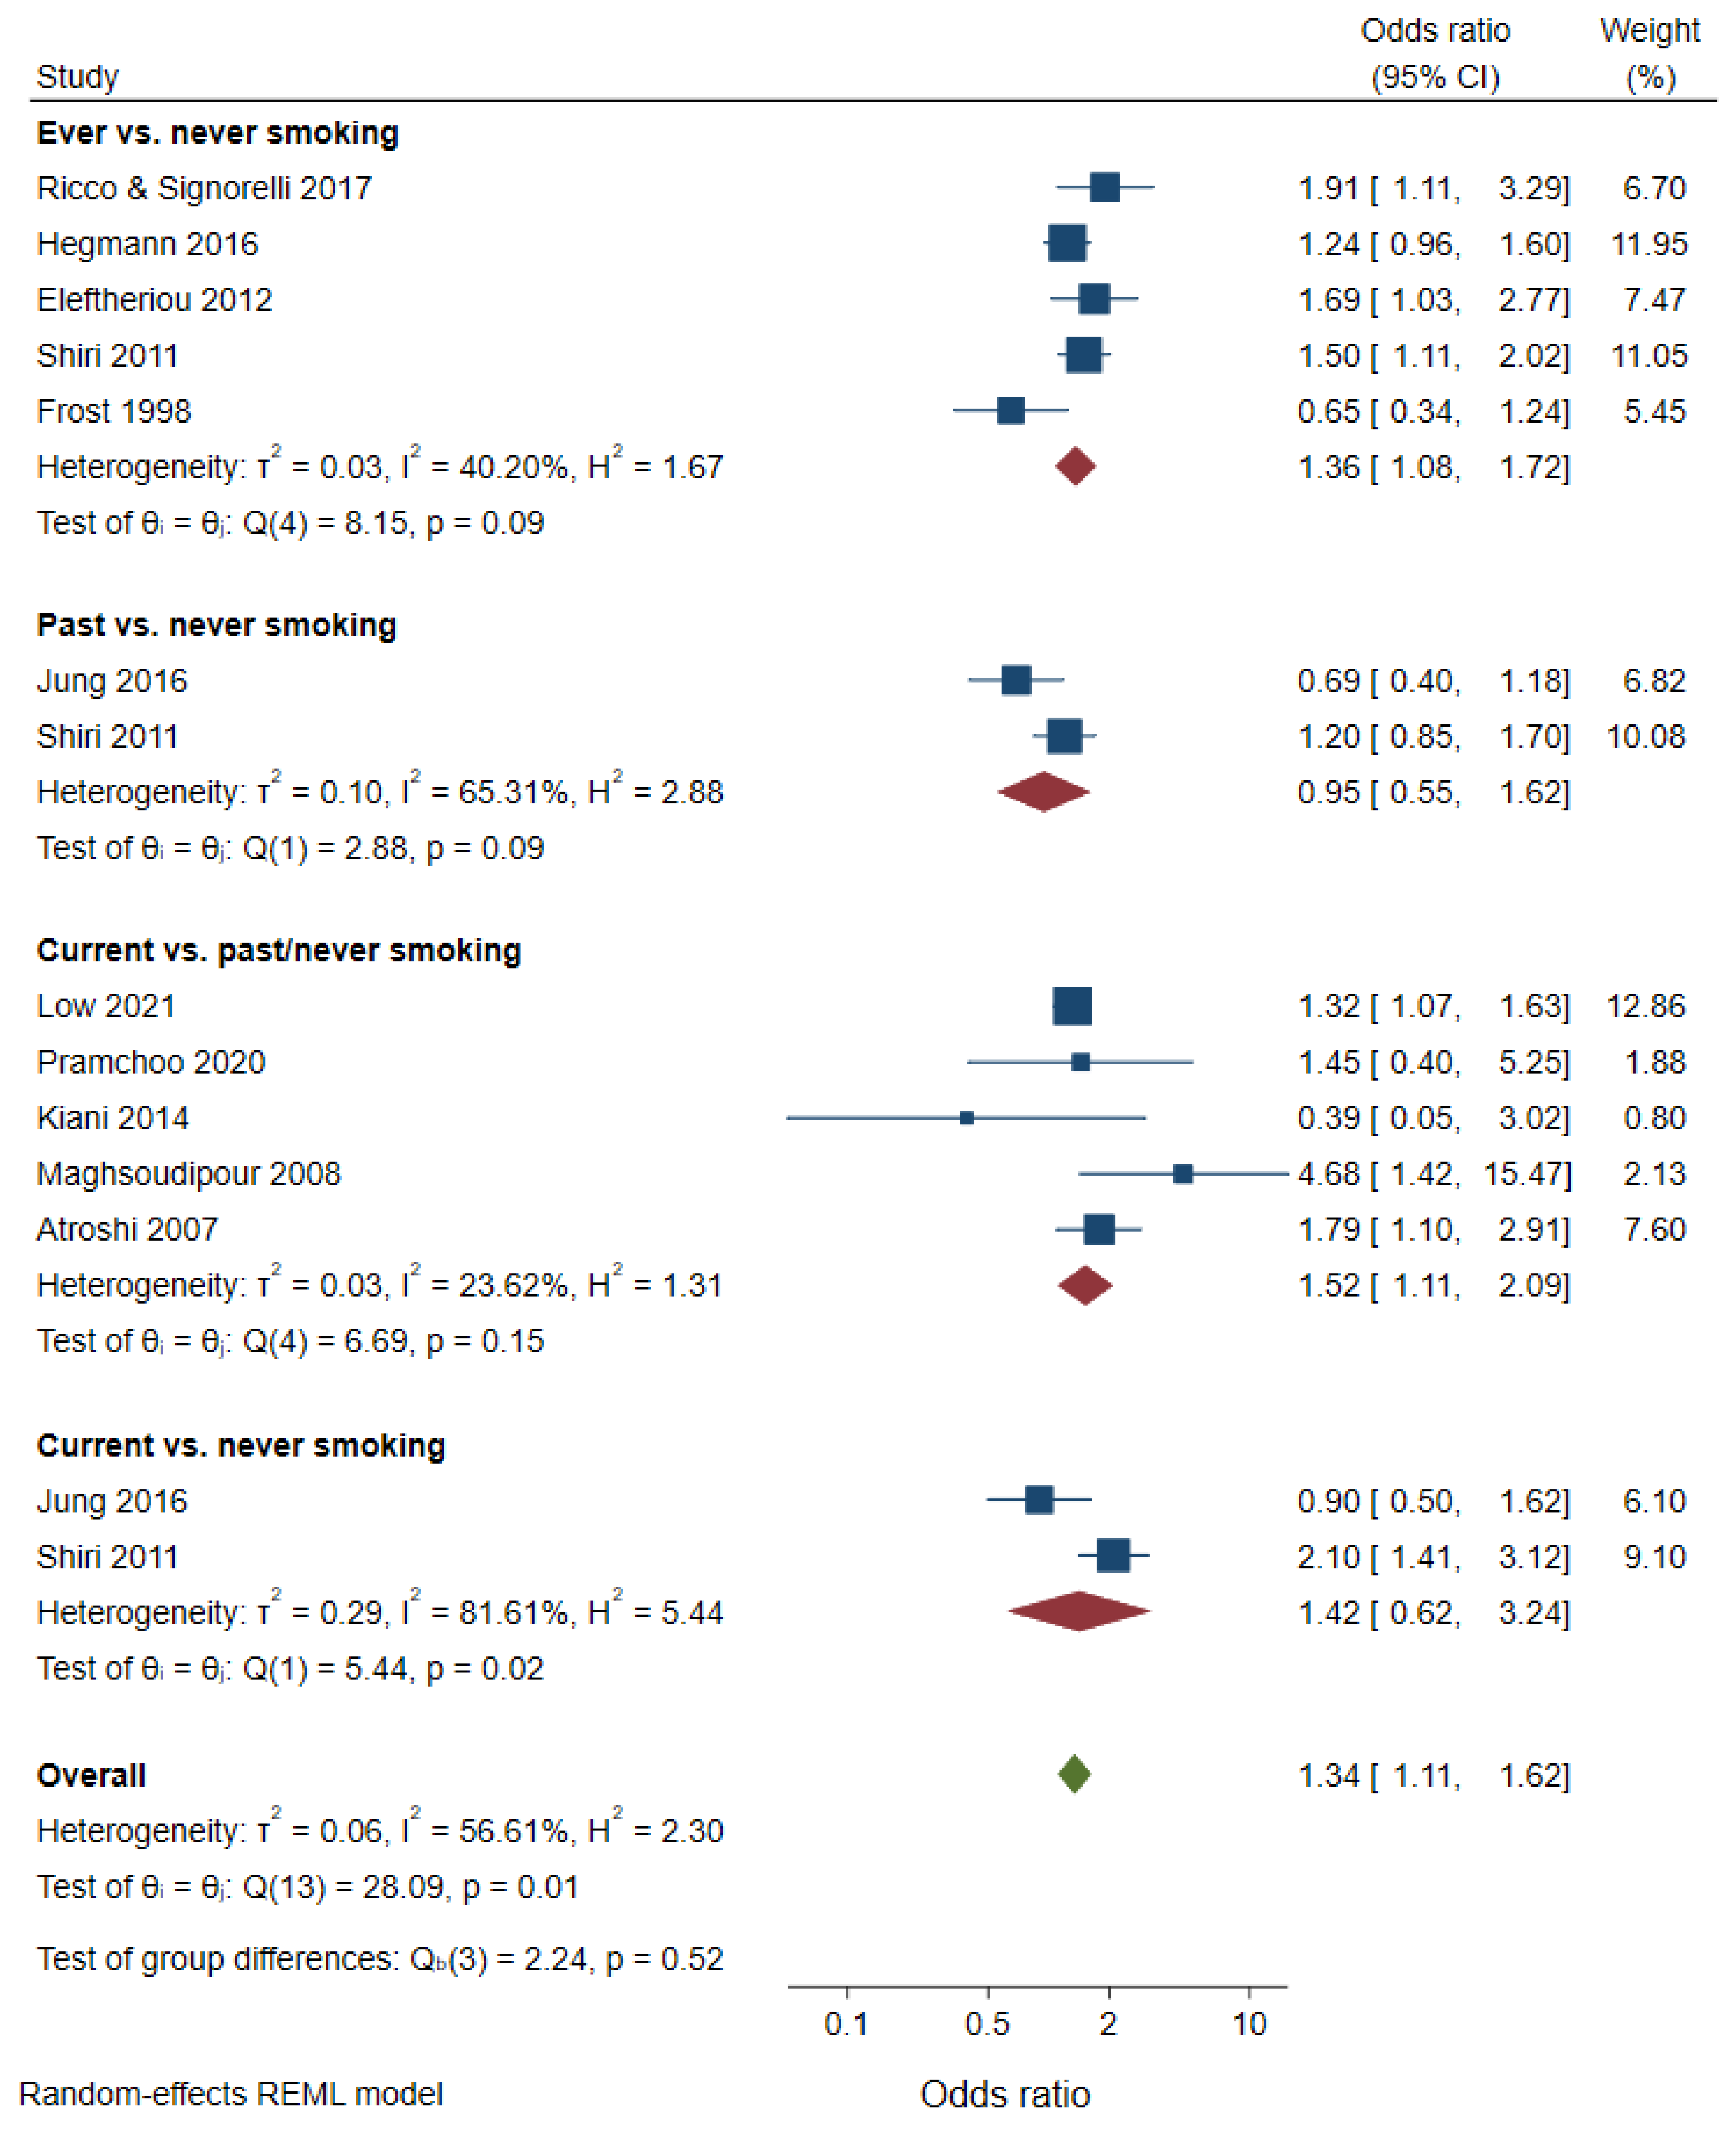
| Overall | 5 | 1.36 | 1.08–1.72 | 40 | 7 | 1.54 | 1.13–2.09 | 49 |
| Adjustment for publication bias | 6 | 1.28 | 0.99–1.65 | 7 | 1.54 | 1.13–2.09 | ||
| Selection bias | ||||||||
| Low | 1 | 1.50 | 1.11–2.02 | - | 2 | 1.97 | 1.45–2.68 | 0 |
| Moderate | 3 | 1.16 | 0.73–1.85 | 69 | 4 | 1.39 | 0.87–2.21 | 50 |
| High | 1 | 1.91 | 1.11–3.29 | - | 1 | 0.39 | 0.05–3.02 | - |
| Confounding | ||||||||
| Low | 2 | 1.04 | 0.46–2.34 | 81 | 2 | 2.55 | 1.30–5.00 | 36 |
| Moderate | 2 | 1.34 | 1.03–1.75 | 16 | 3 | 1.40 | 1.13–1.75 | 6 |
| High | 1 | 1.91 | 1.11–3.29 | - | 2 | 0.84 | 0.48–1.49 | 0 |
| Detection bias | ||||||||
| Low | 3 | 1.19 | 0.69–2.04 | 74 | 4 | 1.63 | 0.89–3.00 | 58 |
| Moderate | 2 | 1.55 | 1.20–2.00 | 0 | 3 | 1.52 | 0.97–2.36 | 62 |
| Attrition bias | ||||||||
| Low | 3 | 1.31 | c | 75 | 5 | 1.48 | 0.82–2.65 | 52 |
| Moderate | 2 | 1.34 | 1.11–1.63 | 0 | 2 | 1.61 | 1.03–2.53 | 76 |
Publisher’s Note: MDPI stays neutral with regard to jurisdictional claims in published maps and institutional affiliations. |
© 2022 by the authors. Licensee MDPI, Basel, Switzerland. This article is an open access article distributed under the terms and conditions of the Creative Commons Attribution (CC BY) license (https://creativecommons.org/licenses/by/4.0/).
Share and Cite
Lampainen, K.; Hulkkonen, S.; Ryhänen, J.; Curti, S.; Shiri, R. Is Smoking Associated with Carpal Tunnel Syndrome? A Meta-Analysis. Healthcare 2022, 10, 1988. https://doi.org/10.3390/healthcare10101988
Lampainen K, Hulkkonen S, Ryhänen J, Curti S, Shiri R. Is Smoking Associated with Carpal Tunnel Syndrome? A Meta-Analysis. Healthcare. 2022; 10(10):1988. https://doi.org/10.3390/healthcare10101988
Chicago/Turabian StyleLampainen, Kaisa, Sina Hulkkonen, Jorma Ryhänen, Stefania Curti, and Rahman Shiri. 2022. "Is Smoking Associated with Carpal Tunnel Syndrome? A Meta-Analysis" Healthcare 10, no. 10: 1988. https://doi.org/10.3390/healthcare10101988
APA StyleLampainen, K., Hulkkonen, S., Ryhänen, J., Curti, S., & Shiri, R. (2022). Is Smoking Associated with Carpal Tunnel Syndrome? A Meta-Analysis. Healthcare, 10(10), 1988. https://doi.org/10.3390/healthcare10101988