Article

Role of Service Quality in Improving Customer Loyalty towards Telecom Companies in Hungary during the COVID-19 Pandemic

1
Institute of Agricultural and Food Economics, Hungarian University of Agriculture and Life Sciences, 2100 Godollo, Hungary
2
Vanderbijlpark Campus, Northwest University, Vanderbijlpark 1900, South Africa
*
Author to whom correspondence should be addressed.
Economies 2021, 9(4), 200; https://doi.org/10.3390/economies9040200
Submission received: 18 November 2021 / Revised: 15 December 2021 / Accepted: 16 December 2021 / Published: 20 December 2021

Abstract

:
The telecommunication sector is one of the most rapidly growing sectors in the world. The COVID-19 pandemic has created an increased dependence of customers on telecommunications to continue their work and studies. The increased usage of internet and telecom services during the COVID-19 pandemic has brought many risks and challenges for the telecom companies to meet the requirements of the consumers. In this regard, it is crucial to understand the factors affecting customer loyalty towards telecom companies during the COVID-19 pandemic. This study is conducted to evaluate the effect of service quality, perception towards promotional packages, and customer delight on customer loyalty towards telecom companies in Hungary. The study also examined the mediating role of customer delight and perception towards promotional packages between service quality and customer loyalty. Another aim of the study is to compare the behavior of Hungarian customers and foreign customers living in Hungary towards telecom companies in the course of the COVID-19 pandemic. The study used a linear snowball sampling method and a well-structured questionnaire to collect the data. In total, 589 completed responses were used for analysis out, of which 208 responses are from Hungarian customers and 381 are from foreigners. To analyze the collected data, regression analysis was applied by using AMOS 22 package. The results of our study revealed that service quality and perception towards promotional packages positively influence customer loyalty among both Hungarian and foreign customers. On the other hand, customer delight significantly influences customer loyalty only among foreign customers. The results also proved the mediating role of promotional packages and customer delight between service quality and customer delight. This study will provide significant practical implications for managers of telecom companies in Hungary.

1. Introduction

The greatest challenge for organizations in this current scenario is the increasing competition and customer expectations. This strong environment of competition has changed the marketing ideology from the acquisition of consumers to consumer loyalty (Shahzad et al. 2021). However, achieving customer loyalty is becoming a challenge for businesses because of the competitive market situation. Thus, marketers and practitioners show an increasing concern towards maintaining a long-term relationship with the consumers. However, increasing demand and publicity from various marketing players are making it harder to please and satisfy the existing customers (Moreira et al. 2016). These trends are apparent in the telecommunication sector as well, and the telecom service providers are still facing difficulties in creating long-term loyalty development, irrespective of huge investments and plans to enhance customer experiences. Long-term customer loyalty is still a dream for many organizations, which indicates that there is still much to research about the subject (Karjaluoto et al. 2012). The concept regarding the loyal customers states that they are less expensive to work for, they are ready to pay premium prices, and they perform as strong advocates of the organization (Reinartz and Kumar 2002). The capability to retain existing customers and strengthen loyalty is essential to gain a competitive advantage (López-Miguens and Vázquez 2017).
The current situation of the COVID-19 pandemic has created big challenges for many companies and in this regard, telecommunication companies have gone through great trials as millions of employees had to switch to work from home. These companies worked hard to catch up with the rising demand and surge in internet usage. The telecommunication sector has played a crucial role in building up the economy as well as meeting increased demand from consumers. It was reported that mobile internet data traffic has increased to 20–25% during the emergency of Coronavirus. The significance of digital channels was recognized more during the pandemic and according to Telenor, this high usage of online channels has never been seen previously (BBJ 2020). The risk caused by the COVID-19 pandemic, such as lockdowns and compulsory home office working, created a high level of uncertainty (Gorgenyi-Hegyes et al. 2021). In Hungary, during the lockdown period, the most frequent kind of online consumption through the internet was downloading and watching movies, during which the respondents were using 73 percent of their internet share (Statista 2020). Internet usage has drastically increased during the COVID-19 pandemic for online activities, social media usage, watching movies, working from home, online meetings, and education. This has created an opportunity for telecom companies to attract new customers or to retain existing ones. Many telecom companies had offered multiple promotional offers for their customers in Hungary; for instance, Telenor offered 100Gb free internet to its users and comparatively, Vodafone and Telekom gave free internet to all students and teachers (Hungary Today 2020). These three companies are the major players in the Hungarian telecommunication market, holding 44%, 27%, and 26% of the market share for Telekom, Telenor, and Vodafone, respectively, in the second quarter of the year 2020 (Statista 2021).
This pandemic has changed the entire work environment and forced people to become dependent on online technology. The COVID-19 pandemic has shifted face-to-face communication to virtual. The governments’ restrictive regulations and restricted movement of the global population have transformed the market into the world of digital technologies (Valaskova et al. 2021), and consumers prefer the use of digital devices for their online purchase or retrieving information (Štefko et al. 2019). Education, work meetings, online workshops, management, and academic conferences were forced to adjust to the change according to the risks and challenges this pandemic has posed (Mheidly et al. 2020; Appolloni et al. 2021). To keep work and studies going, telecommunication played a crucial role. The internet has become an integral part of our lives (Horvath et al. 2021), and the current situation of pandemic made us more dependent on the internet than ever before. Hence, it is necessary to examine the behavior of the customers towards their telecom companies during the COVID-19 pandemic. Previous literature has supported the factors that can maintain or increase customer loyalty. For instance, studies conducted by Santouridis and Trivellas (2010), and Dhasan and Kowathanakul (2021) reported a significant positive influence of service quality on customer loyalty, and they considered service quality as a major antecedent of loyalty. In addition to this, other predictors of customer loyalty have been examined by different studies, such as customer delight (Elias-Almeida et al. 2016), satisfaction (Anabila et al. 2021), trust (Karjaluoto et al. 2012), and competitive promotional package (Dhasan and Kowathanakul 2017), etc. However, the current scenario of the internet and digitization require more supportive studies for a better understanding of customer loyalty during the COVID-19 pandemic.
Therefore, this study was conducted to analyze customer loyalty by investigating the influence of service quality, customer delight, and perception towards promotional packages on the loyalty of the consumer towards telecom companies in Hungary. The current study will provide a comparison between the behavior of Hungarian and foreign customers living in Hungary towards telecom companies. To investigate customer loyalty, this comparison between Hungarian and foreign customers was examined because cultural differences affect the perception of service quality and also influence loyalty (Malai and Speece 2005). As mentioned above, previous studies have been conducted to examine customer loyalty, including several variables such as service quality and customer delight, etc., but few studies have adopted the competitive promotional package to analyze customer loyalty (Dhasan and Kowathanakul 2017). Previous studies did not consider the competitive promotional package as the main antecedent of customer loyalty. Therefore, the authors attempted to provide evidence to contribute to the above-mentioned research gap within the current scenario of COVID-19.
This study aims to investigate the impact of service quality on customer loyalty towards telecom companies in Hungary during the COVID-19 pandemic. It will also examine the mediating effect of promotional packages and customer delight between service quality and customer loyalty. The study will further provide insights into the behavioral comparison regarding customer loyalty between Hungarian customers and foreign customers living in Hungary because it is important for the policymakers and managers to identify the differences in the perception of two targeted segments of the consumers. As both consumer segments have cultural and behavioral differences, their perception towards service quality and loyalty might differ. To the best of the authors knowledge, no previous studies have been conducted in the context of telecom companies in Hungary during the COVID-19 pandemic to examine customer loyalty by the above-mentioned variables. This study attempted to fill this research gap by providing valuable insights into this field of research. The present study will answer the following research questions: Does service quality increase customer loyalty towards telecom companies in Hungary during the COVID-19 pandemic? Do other variables such as perception towards competitive promotional packages and customer delight have any significant impact on customer loyalty? Is there any difference between Hungarian and foreign customer’s loyalty towards telecom companies in Hungary? Do customer delight and perception towards competitive promotional packages have any mediation effect between customer loyalty and service quality?
The present study will first provide a review of the literature by discussing previous studies conducted before and during the COVID-19 pandemic. Then the sample and procedures will be explained. After that, the study will discuss the analysis and findings. In this study, the evaluation and proposed hypothesis tests were performed by using confirmatory factor analysis (CFA) and regression analysis. Lastly, discussion, implications, conclusion, and future research directions will be provided.

2. Literature Review

The researchers and scholars in the field of marketing are constantly attempting to identify determinants of customer loyalty. Therefore, for several years, a significant number of studies were conducted in this field of research. However, the changes and disruptions that occurred due to the COVID-19 pandemic concerning consumer behavior and marketing strategies necessitated more studies to identify factors affecting customer loyalty. This review of literature will provide an insight into the studies conducted in this field of research before or during the COVID-19 pandemic.

2.1. Customer Loyalty

Customer Loyalty means to develop, create, maintain, and retain the functional and emotional long-term relationship between an organization and consumers. According to Watson et al. (2015, p. 803), loyalty is “a collection of attitudes aligned with a series of purchase behaviors that systematically favor one entity over competing entities”. In addition, customer loyalty was conceptualized by Casidy and Wymer (2016, p. 196) as “one’s feelings of devoted attachment to the loyalty object, rather than repeated commercial transactions”. An organization needs to have the ability to hold its customers and to make them loyal to their products and services for continuous success (Hossain and Ullah 2011). The customers who show their loyalty towards a business will help it grow by continuously purchasing, paying premium prices, and introducing and inviting new consumers through positive word of mouth (Ganesh et al. 2000; Naz et al. 2020). In this regard, Oliver (1997) also described customer loyalty as a profound commitment to continuously re-purchasing or re-utilizing a particular product and recommending it to their peers, even though certain factors such as marketing and situational influences are attempting to persuade them to switch behavior.
The loyalty of the customers towards their telecom company will fade if they are using multiple service providers and they are getting better services from another service provider, or if their needs are not fulfilled (Morgan and Govender 2017). According to Reichheld and Schefter (2000), companies generate a high return on investment when they have high retention rates, as loyal consumers refer the services to potential customers with positive word of mouth (Hur et al. 2010), which leads to lower costs. A key strategy to remain competitive in a challenging telecommunication market is to create a pool of loyal consumers (Izogo 2017). According to Solimun and Fernandes (2018), the main reason for a company to retain its customers is to maintain the viability of the firm and to improve financial performance, in which customer loyalty plays an important role. Therefore, telecommunication companies should be concerned about a loss of customers and make necessary strategies to overcome this issue (Sweeney and Swait 2008). Several studies have been conducted in different sectors to examine customer loyalty through different variables, such as in the hospitality sector (Bowen and Chen 2001), banking sector (Anwar et al. 2019), and tourism sector (Kandampully et al. 2011), etc.
However, examining customer loyalty during the time of the pandemic is crucial in understanding the consumer response towards their telecom companies. To examine customer loyalty, a study was conducted by Rachmawati (2020) on Indonesian customers of mobile operators; it was reported that users remain loyal if they enjoy a good experience from their telecom company or have good value for money during the COVID-19 pandemic. In another study conducted on telecom users in Pakistan, it was suggested that to retain consumers, telecommunications companies should employ more rational approaches concerning customer loyalty. Retaining existing consumers has been proven to be more profitable than attracting new consumers (Shahzad et al. 2021). On the other hand, Thai telecom consumers tend to become more loyal to their telecom company if they are provided with more efficient technical services (Dhasan and Kowathanakul 2021). However, there is a lack of literature regarding customer loyalty towards telecom companies during the time of the COVID-19 pandemic. Therefore, this study was conducted to emphasize the role of telecom companies during the pandemic to provide better services for employees and students working from home. Moreover, the current study evaluates the mediating impact of promotional packages and customer delight between customer loyalty and service quality.

2.2. Service Quality

Service quality is considered as a measure of the extent to which service is delivered to the consumers as per their expectations (Lewis and Booms 1983). In other words, within a company, it is regarded as the comparison between expected service and service received from that company (Liu and Wu 2007). It is also termed as the gap between expectations of consumers and the actual service provided to them (Parasuraman et al. 1988). It is an important determining factor that will make consumers show positive behavior towards the company and refer its product to their peers (Gounaris et al. 2003; Stefko et al. 2020). To deliver quality service implies constantly fulfilling customer expectations. Previous studies have proposed the notion that to measure service quality, SERVQUAL instrument can be used (Parasuraman et al. 1988), and it can be managed using the expectations–performance gap model (Zeithaml and Bitner 1996). The SERVQUAL instrument as a reliable multiple-item scale has been accepted widely as a valid instrument to measure service quality (Kandampully 1998).
According to Zeithaml and Bitner (1996), consumers will show their loyalty to an organization or product if the value of the product or service is relatively higher than that expected from other competitors. Service quality is regarded as an essential factor to make customers choose one service organization over another; therefore, many organizations have understood that to earn customer loyalty, it is imperative to maintain a constant standard of excellence in service. A strong shift in positioning service promise from service strategy has been created from this long-term perspective (Kandampully 1998). Previous studies support the positive influence of service quality on customer loyalty in the telecommunication sector (Malhotra and Malhotra 2013; Shen and Yahya 2021; Santouridis and Trivellas 2010). The study conducted by Dhasan and Kowathanakul (2021) on Thai mobile consumers reported that consumers who are satisfied with the service quality provided by their mobile network companies tend to be more loyal consumers. In another study conducted by Shen and Yahya (2021) it was reported that service quality and price play a significant role in improving customer loyalty towards low-cost airlines during the COVID-19 pandemic. A recent study on telecom customers in India reported that for customer loyalty towards telecom companies, the strongest antecedent is service quality (Turaga 2021). Omar et al. (2021) conducted a study in the UK during the COVID-19 pandemic to analyze the impact of mobile shopping service quality on customer loyalty; the results suggested that customers need to perceive high service quality to remain loyal to the company. Hence, the following hypothesis was framed.
Hypothesis 1 (H1).
Service quality positively and significantly influences customer loyalty in the telecommunication sector.

2.3. Promotional Package

In selecting the telecommunications service provider, promotional offers play an important role that directly influences the choice of the consumers (Haque et al. 2010). A relevant and cohesive promotional offer integrated with customer engagement channels will directly influence the consumer to purchase that brand (Keylock and Faulds 2012). According to Rowley (1998), a properly designed competitive promotional package addressing the target audience requires direct marketing, advertising, and proper sales promotions. Consumers are progressively involved in sharing the promotional package information with their friends and family because of the prevalence of competitive promotional packages (Theingi et al. 2016). These competitive promotional packages and prices offered play a significant role in influencing the consumers to continue using the service (Dhasan and Kowathanakul 2021). However, McMullan and Gilmore (2008) reported that consumers who are not loyal to the company are not interested in maintaining the relationship but seem to be very interested in promotional offers. This shows that customers benefiting from promotional packages does not necessarily equate to customer loyalty.
To continue using a service, the price offers and promotional packages create an impact on the willingness of consumers (Dhasan and Kowathanakul 2021). In previous studies concerning customer loyalty, the researchers found a significant positive relationship between customer loyalty and perceived price fairness (Santouridis and Trivellas 2010; Kaura et al. 2015). According to Agu (2021); many researchers considered promotional packages as one of the drivers of customer loyalty (Kotler and Keller 2007; Agbonifoh et al. 2007; Okpara 2012) in the complex and multifaceted behavior of consumer preferences and choices, as it directly influences the decision-making of target consumers. Many companies have continued to give importance to total promotional package (Agbonifoh et al. 2007), because of their competitive role (Onuoha 2016; Agu and Uduak 2018), mainly leading to positive reactions of consumers and driving customer loyalty (Agu 2021; Farris and Quelch 2004; Okpara 2012). Alsulami (2021) conducted a study to identify the customer loyalty of supermarket retailers in Saudi Arabia and found that promotional packages are among the factors that encourage customer loyalty. However, in previous literature based on the telecommunication sector, very few studies considered promotional packages as an antecedent of consumer loyalty, in order to assess the direct or indirect relationship between them in the telecommunication sector (Dhasan and Kowathanakul 2017; Dhasan and Kowathanakul 2021). Hence, there is a lack of literature that provides evidence of the significant impact of promotional packages on the consumer loyalty of the telecom customers during COVID-19 in Hungary.
In addition, it will be interesting to identify the impact of promotional packages on customer delight during the COVID-19 pandemic, as it was reported in previous studies that promotional packages can act as an antecedent for customer delight (Berman 2005; Finn 2005). Therefore, it could be assumed that promotional packages will lead to customer delight, which will further enhance customer loyalty. Moreover, it is assumed in this study that service quality could also pose a significant positive impact on perception towards promotional packages, which could lead to customer loyalty. Shamout (2016) reported that promotional tools such as samples or price discounts have a significant relationship with consumer buying behavior, which involves customer loyalty. Therefore, to provide evidence for the influence of promotional packages on customer loyalty during the COVID-19 pandemic, this study has taken it as the main variable, and the following hypotheses were developed.
Hypothesis 2 (H2).
Service quality positively and significantly influences perception towards promotional packages in the telecommunication sector.
Hypothesis 3 (H3).
Perception towards promotional packages positively and significantly influences customer delight in the telecommunication sector.
Hypothesis 4 (H4).
Perception towards promotional packages positively and significantly influences customer loyalty in the telecommunication sector.

2.4. Customer Delight

Customer delight can be explained as an emotional response that is the result of surprising or positive levels of performance (Finn 2005). Patterson (1997, p. 224) defined delight as “…going beyond satisfaction to delivering what can be best described as a pleasurable experience for the client.” It could also be regarded that delighting the consumers can be related to satisfying their needs (Schneider and Bowen 1999). It was found by Westbrook and Oliver (1991) that the customer group that reports the highest level of joy and surprise is found to be more satisfied than other consumers. On the contrary, Rust and Oliver (2000) stated that it is not always the best alternative to delight a customer for the business, as delighting a customer could bring out incremental benefits and it could also lead a business to suffer incremental costs. A recent study conducted by Ji and Prentice (2021) on the transactional experience of customers in a casino resort in Macau reported the mediating impact of customer delight on customer loyalty; however, customer delight had little impact on customer loyalty. Previous research suggests that delight, which is a positive emotional response, has crucial behavioral outcomes (Mattila and Enz 2002; Oliver 1997).
Nevertheless, it was found in a study that customers who are delighted have a greater propensity to become engaged in a positive suggestion through word-of-mouth (Arnold et al. 2005). Some studies found that delight directly influences the repurchase intentions of customers for a product or service (Finn 2005; Oliver 1997). On the other hand, in the hotel industry of Ghana, Anabila et al. (2021) found a positive impact of service quality on customer delight and a positive mediating impact of customer delight between service quality and customer loyalty. Pratondo and Zaid (2021) conducted their study to analyze customer loyalty during the COVID-19 pandemic towards the online ride-hailing industry in Indonesia, and the findings of their study suggested that service quality has a positive impact on customer delight, and customer delight positively mediates the relationship between service quality and customer loyalty. Contrary to this, Hadiwijaya et al. (2021) reported that there is no significant effect of service quality on customer delight. On the other hand, previous studies constructively supported the positive influence of delight on customer loyalty (Elias-Almeida et al. 2016; Finn 2005). However, there is a lack of studies which analyze the impact of customer delight on customer loyalty in the context of telecom companies during the COVID-19 pandemic. So, the current study attempted to identify the relationship amongst customer delight, service quality, and customer loyalty during the COVID-19 pandemic in telecom companies in Hungary. Therefore, the following hypotheses are proposed.
Hypothesis 5 (H5).
Service quality positively and significantly influences customer delight in the telecommunication sector.
Hypothesis 6 (H6).
Customer delight positively and significantly influences customer loyalty in the telecommunication sector.

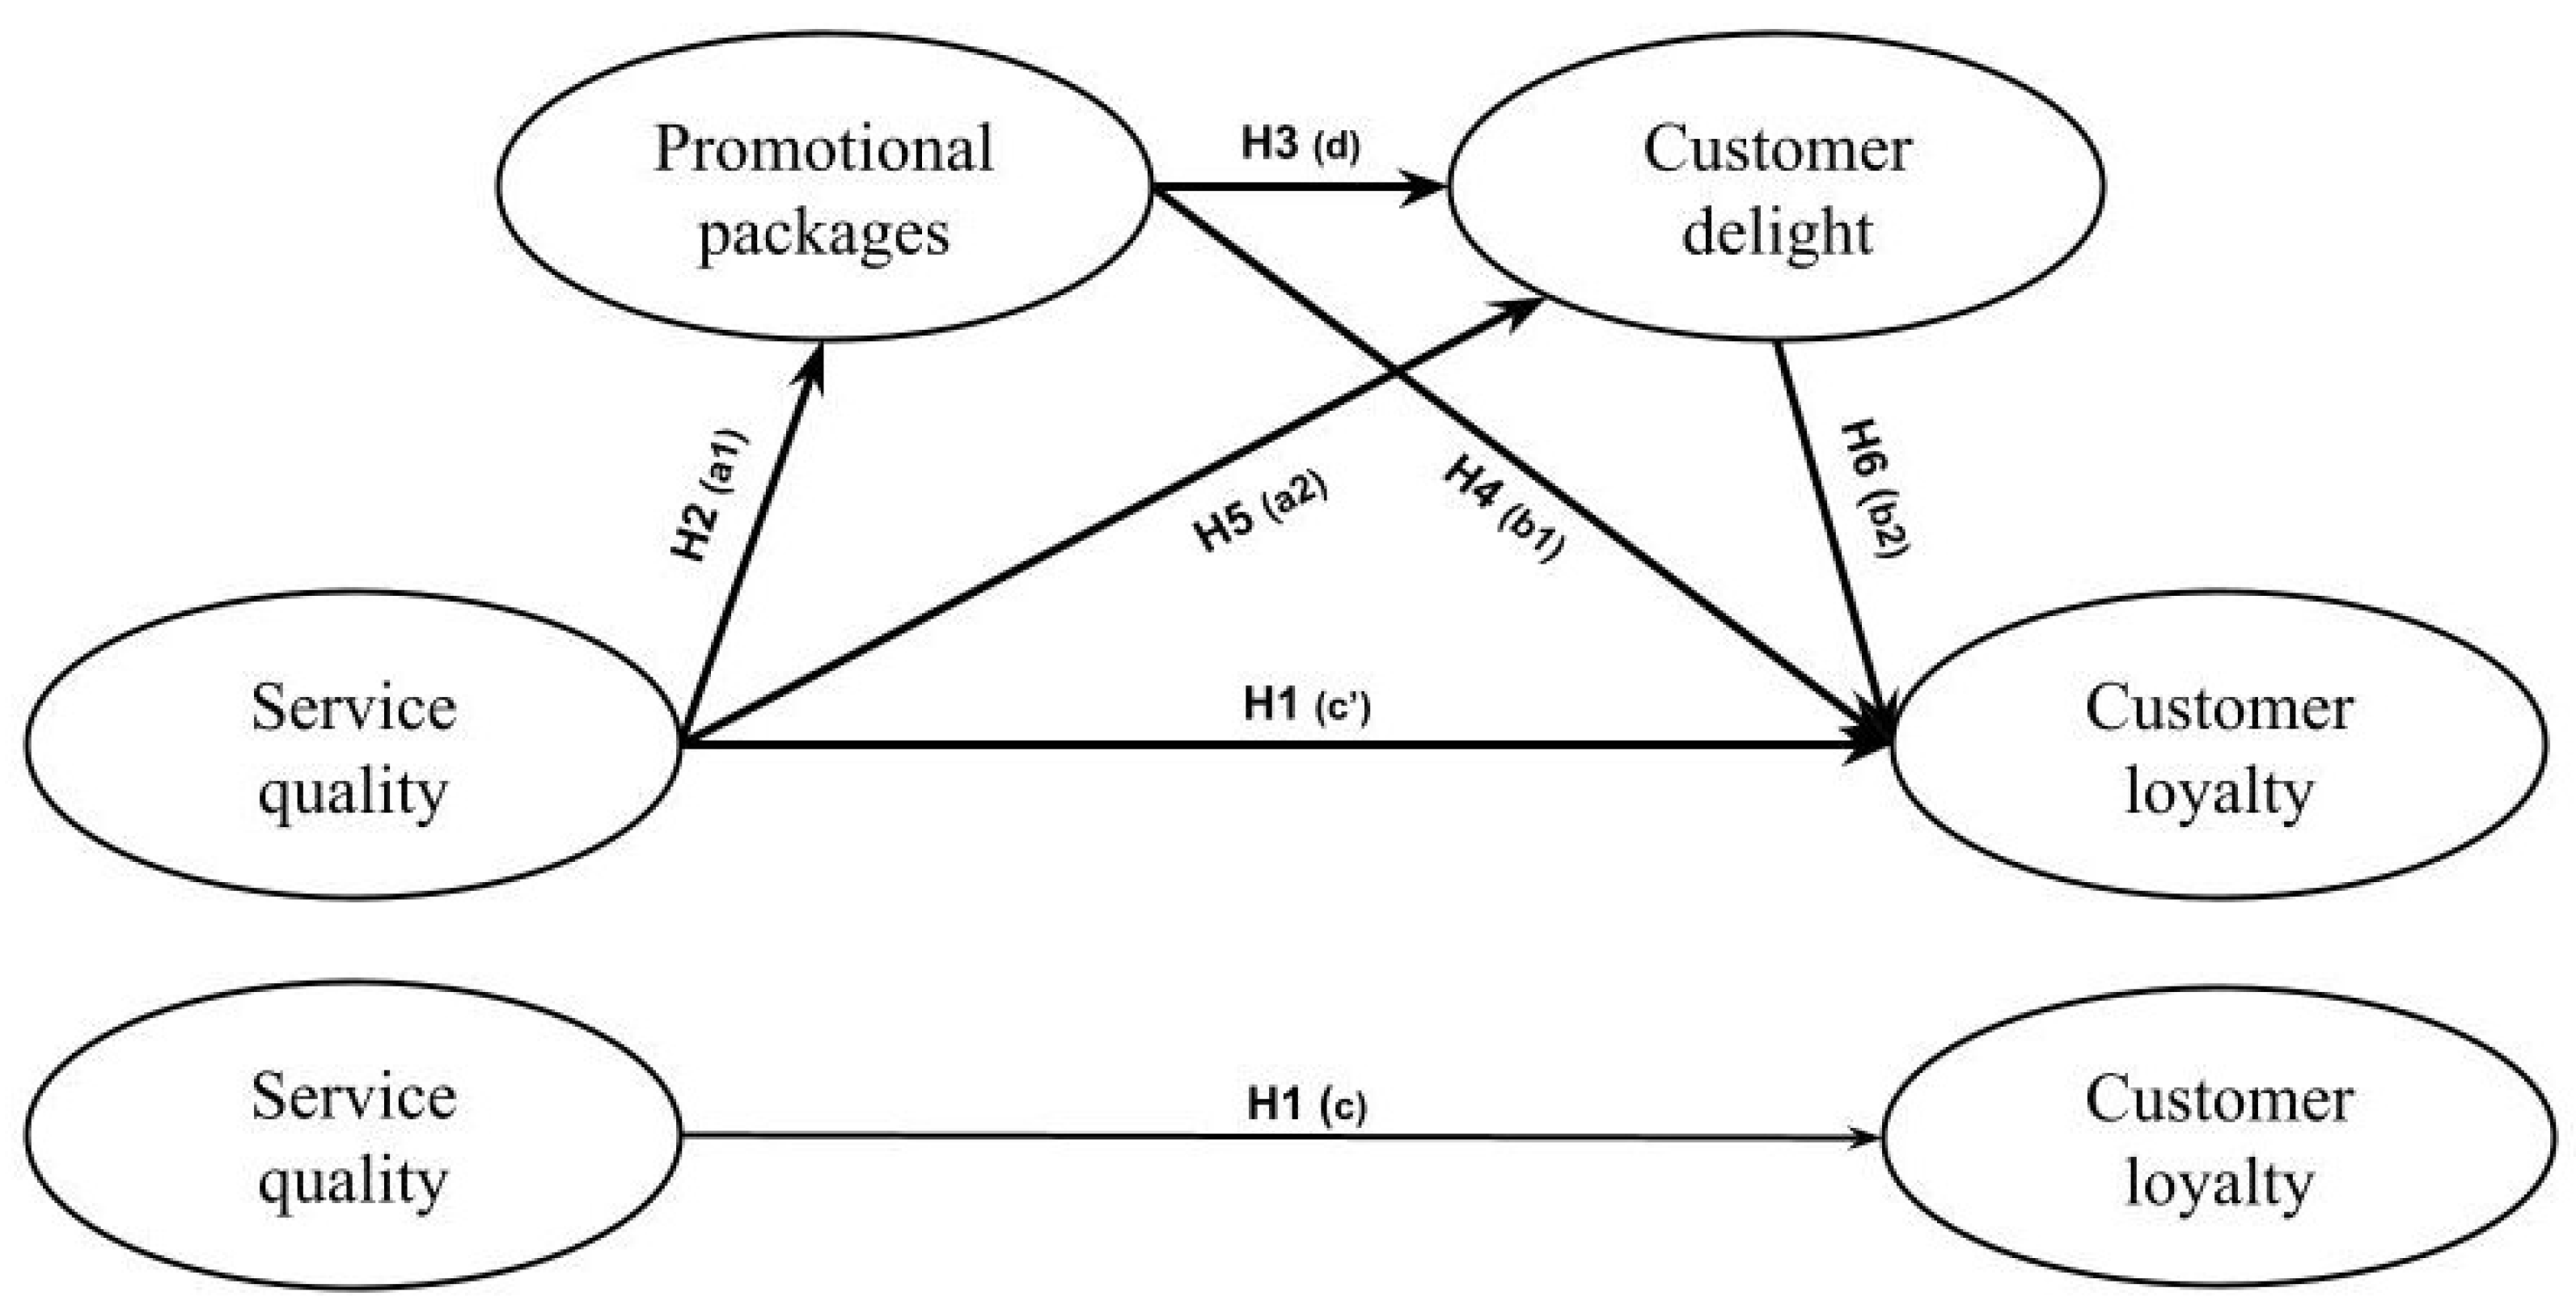
2.5. Mediation Effects

As far as mediation effects of customer delight between service quality and customer loyalty are concerned, several researchers found that customer delight significantly and positively mediates the indirect effect of service quality on customer loyalty (Ali et al. 2016; Desiyanti et al. 2018; Anabila et al. 2021). Ahrholdt et al. (2017) stressed the role of the quality–delight–loyalty system and found that the predicted relationship is possible and that customer delight poses a significant positive mediating effect between service quality and customer loyalty. On the other hand, Pelet et al. (2018) analyzed the mediating impact of promotional offers between website loyalty and buying behavior and found a significant positive mediating effect of promotional offers between the two variables. Similarly, Lee and Chen-Yu (2018) analyzed the mediating effect of price discounts on perceived quality and perceived value of consumers’ perception towards apparel products and they found a significant mediating role of price discounts. However, it was discussed above that perception towards promotional package can pose a significant positive impact on customer loyalty, but to the best of our knowledge, none of the previous literature has analyzed its mediating role between service quality and customer loyalty. Therefore, this study proposes to incorporate the theory of perception towards promotional packages into the service quality–customer loyalty framework. Hence, the following hypotheses are developed.
Hypothesis 7 (H7).
Perception towards promotional packages significantly mediates the relationship between service quality and customer loyalty.
Hypothesis 8 (H8).
Customer delight significantly mediates the relationship between service quality and customer loyalty.
Hypothesis 9 (H9).
The relationship between service quality and customer loyalty is serially mediated by perception towards promotional packages and customer delight.
Based on the review of the literature, the study proposed the following conceptual model (Figure 1).

3. Materials and Methods

3.1. Sample and Procedures

This research’s participants are the customers of the 3 main telecommunications companies in Hungary. The three companies are Telenor, Vodafone, and T-Mobile. The data for the research were collected through online channels and by using the linear snowball sampling method. A structured questionnaire was distributed to the customers in an electronic form through social media platforms such as Facebook and LinkedIn, with an introductory message clarifying the aim of the study and its scope. The questionnaire was written in both Hungarian and English languages. The total number of the sent requests was 1000 during a period of three months (February to April) with one reminder message at the end of April. A total of 589 customers completed the questionnaire and submitted it to the researchers; this is a response rate of nearly 59%, which is considered as an adequate response rate (Baruch and Holtom 2008). On the other hand, a minimum sample size of 150 cases is considered adequate to conduct confirmatory factor analysis and the final analysis (Muthén and Muthén 2002). Moreover, in this study, out of 589 respondents, there were 381 foreigners and 208 Hungarians. Table 1 shows the “personal characteristics” of the sample, divided into Hungarian and foreigners.
As it could be noticed from Table 1, males are prevailing among foreigners (59.8%), whereas females are the prevailing gender among Hungarian respondents (55.7%). The majority of respondents were “between 25 to 34 years old” for both foreigners (N = 244) and Hungarians (N = 89). Most of the respondents used Vodafone, foreigners (N = 212) and Hungarians (N = 100). Finally, most of the respondents, both Hungarian and foreigners, did not contact customer service frequently.

3.2. Measures

Customers reported their perception about service quality, customer delight, promotional packages, and customer loyalty through a standard online questionnaire comprising four sections:
Service quality: the study used a scale adopted from Zameer et al. (2018); the scale consisted of 8 items, using a 5 points Likert scale “1 = totally-disagree to 5 = totally-agree”. A sample of the items is “Staff here always behave professionally”.
Promotional packages: the study used a measure of 4 items adapted from Dhasan and Kowathanakul (2021). The measurement was based on a 5 points Likert scale “1 = totally-disagree to 5 = totally-agree”. A sample of the items include “The company I use gives attractive promotional packages”.
Customer delight: the study used the measure of Al-Hawari (2011), which consists of 3 items, by using a 5 points Likert scale “1 = totally-disagree to 5 = totally-agree”. A sample of the items is “I am pleased to deal with my telecom company”.
Customer loyalty: to measure the last variable, the researchers adopted the study of Yee et al. (2011), which consisted of 5 items, with a 5 points Likers scale “1 = totally-disagree to 5 = totally-agree”. A sample of the items is “I say something good about this company to others”. All the measures were used and validated widely by previous researchers.

3.3. Data Analysis

To test the hypothesized mediation relationships, a three-path mediated effect model was tested following the recommendations of Hayes (2013); some previous researchers have followed this method, such as Huertas-Valdivia et al. (2018) and van Jaarsveld et al. (2010). To estimate the path coefficients, the researchers used regression analysis with the PROCESS macro for SPSS developed by Hayes (2013). The advantage of this approach is that it allows separation of each mediator’s direct and indirect effect. It also helps in the investigation of the indirect effect that passes through the two mediators in a series (van Jaarsveld et al. 2010). This approach in addition “directly tests the indirect effect between the predictor and the criterion variables through the mediator via a bootstrapping procedure, addressing some weaknesses associated with the Sobel test” (van Jaarsveld et al. 2010, p. 1497). Therefore, to test the hypothetical model, it is important to specify the confident interval level and the bootstrap samples.
The researchers also used “confirmatory factor analysis” (CFA) by using AMOS 22 package to test the model fit along with testing the regression analysis (Hair et al. 2016). First, CFA was performed on the data set and the goodness of the model fit was identified. Afterward, Cronbach alpha reliability, “average variance extracted (AVE)”, and “composite reliability (CR)” were calculated. Following that, the correlation between variables was examined, and to test the hypotheses, the coefficients were estimated.

4. Results

4.1. Measurement Model

To test the model fit, the recommendations of (Schumacker and Lomax 2004) were used. These recommendations suggest that before making any conclusion about the study’s model, the researchers are required to consider model diagnostics by assessing the goodness of the fit indices. By using CFA, the researchers investigated the model fit indices of the study’s model.
The main indices to be reported according to Bentler (1990) and Schumacker and Lomax (2004), include the “model’s chi-square” (χ2), “degree of freedom of the model” (df), “the ratio of the chi-square statistic to the respective degrees of freedom (χ2/df)”, “comparative fit index” (CFI), “the root mean square error of approximation” (RMSEA), “the Tucker-Lewis index” (TLI), and “the standardized root mean residual” (SRMR). According to Awang (2012), for a good model fit measure, the accepted thresholds’ values of the mentioned indices must be met. The recommended values of these indices are χ2/df < 5, RMSEA ≤ 0.08, CFI > 0.90, TLI > 0.90, GFI > 0.95, AGFI > 0.90, and SRMR < 0.05 (Awang 2012). Before conducting the final analysis, it is necessary to examine the model fit. In Table 2, the key diagnostics are shown for both Hungarians and foreign customers separately, and the values support the model fit. (The hypothesized model is presented in Figure 1).

4.2. Reliability and Validity Analysis

Before doing the final analysis, the Cronbach alpha reliability was conducted to examine the “internal consistency” of the study’s variables for both Hungarians and foreigners separately. This test was based on the calculations of all variables’ items separately, indicating their alpha Cronbach values, considering that this value should be over 0.60 to be considered as an accepted reliability level of the variable items, as was recommended by Sekaran and Bougie (2016). The results of the reliability test shown in Table 3 indicate an accepted reliability value of all variables for both Hungarian and foreigner customers.
The validity test was conducted after reliability analysis, and to check and test the variables, CFA was applied, and to this end, first factor loadings were calculated (Table 4), then the “convergent validity” test was performed. The degree of correlation of a variables’ items is assessed from the latent variables’ average variance extracted (AVE) and the composite reliability (CR) (Bagozzi et al. 1991; Chin 1998). These two studies suggested that the value of AVE of each variable should be higher than 0.5, whereas the “composite reliability” (CR) value should not be under 0.7. The calculations of AVE and CR are shown in Table 3, and as it could be noticed that their values for both Hungarians and foreign customers are in the accepted threshold.
Discriminant validity clarifies whether the measures of one variable are distinct from the other one. To test it, we used the methods of Fornell and Larcker (1981), to assess the measured discriminant validity by making a comparison of the relationship between the correlations among the study’s constructs and “the square root” of the AVE of the constructs. As shown in Table 5, Table 6 and Table 7, “the square roots” of the AVE of all variables are higher than the correlations among constructs for both Hungarians and foreigners, thus indicating good discriminant validity. Therefore, the study tool is considered validated.

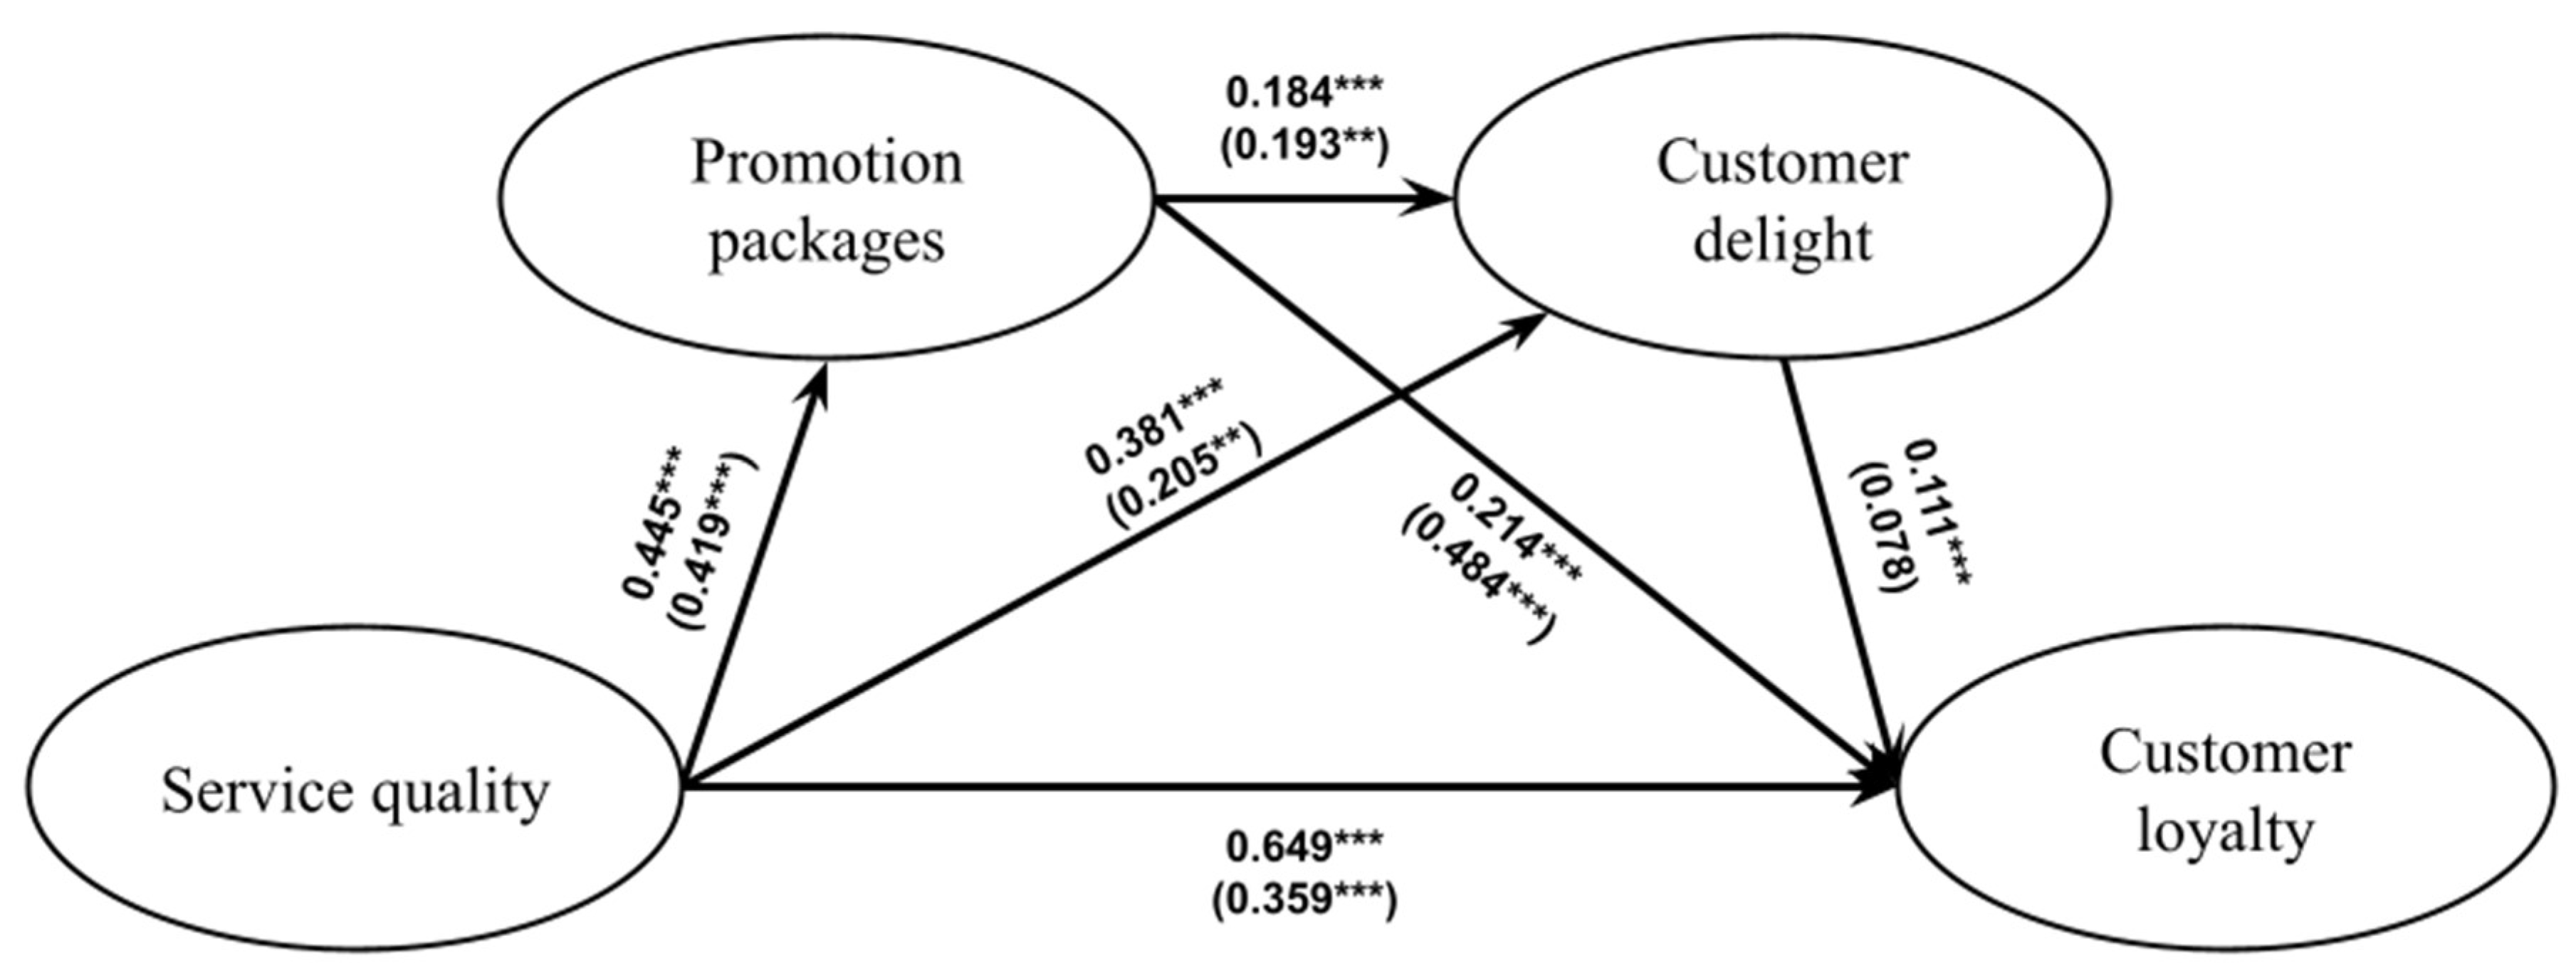
4.3. Hypotheses Test

Following the approach of Hayes, 2013, for testing the three-path mediated effect model, the researchers have used regression analysis with the PROCESS macro for SPSS developed by Hayes, 2013. The researchers specified a 95% “confidence interval” with 5000 bootstrap samples. Figure 2 displays the variables of the model with the estimates of the standard path coefficients.
The results of the regression analysis are presented in Table 8, which indicates that for foreign customers, service quality of the telecommunication companies directly and significantly influenced their loyalty toward the company (β = 0.73, SE = 0.04, p < 0.001) (path c); therefore, it could be noted that this impact is strong. Similarly, for Hungarians, the service quality can influence their loyalty significantly in a positive way (β = 0.59, SE = 0.06, p < 0.001); however, this effect is less when compared to foreign customers. Therefore, we could conclude that (hypothesis H1) is accepted for both international and Hungarian customers.
Table 8 also shows that service quality can influence perceptions toward promotional packages significantly in a positive way for both foreign and Hungarian customers (β = 0.445, SE = 0.04, p < 0.001) (β = 0.419, SE = 0.06, p < 0.001) (path a1), respectively. Moreover, it could be noticed that this effect is very close to each other in both segments of customers, which leads the researchers to accept hypothesis H2.
The perceptions toward promotional packages significantly influence customer delight for both international and Hungarian customers at a weak level (β = 0.184, SE = 0.05, p < 0.001) (β = 0.193, SE = 0.07, p = 0.008) (path d), respectively. Therefore, hypothesis H3 was accepted.
The results also showed that the perceptions towards promotional packages significantly influence customer loyalty for both international and Hungarian customers (β = 0.214, SE = 0.03, p < 0.001) (β = 0.484, SE = 0.06, p < 0.001) (path b1), respectively. It could be noticed that this impact between international customers is low compared to Hungarians. Based on the previous results we could conclude to accept hypothesis H4 for both customer segments.
In the same way, the service quality was found to significantly predict customer delight for both international and Hungarian customers of telecommunication companies (β = 0.380, SE = 0.05, p < 0.001) (β = 0.205, SE = 0.07, p = 0.005) (path a2), respectively. However, this effect is weak for Hungarian customers, while it was moderate for international customers. Therefore, hypothesis H5 was accepted.
The regression analysis table also showed that customer delight could significantly influence customer loyalty, but this effect was weak for international customers (β = 0.110, SE = 0.03, p = 0.009) (path b2). However, this effect was not significant for Hungarians (β = 0.078, SE = 0.05, p = 0.114), which led to accepting hypothesis H6 for internationals and rejecting it for Hungarians.
The model explained 11% of the variance in customer delight for Hungarian customers compared to 24% for international customers. This means that service quality is more greatly perceived as a reason for higher customer delight for international customers. Comparatively, the variance in promotional packages was very close to each other for both international and Hungarians, which means that for both segments, service quality can affect the way that customers perceived the promotional packages. Finally, for the variance in customer loyalty, the results showed that the three variables could explain 68.5% of the variance in customer loyalty for internationals compared to 55% for Hungarians (See Table 8).
The standardized coefficients for the direct effects are shown in Figure 2, indicating the standardized weights.
For testing the mediation influences of promotional packages and customer delight, the researchers used the bootstrapping method, which resampled the data to analyze the mediation effects and to validate the direct, indirect, and total effects (Hayes 2017). Then, the researchers conducted indirect path analysis from service quality to loyalty through promotional packages and customer delight by checking the 95% confidence interval of model results.
The findings shown in Table 9 showed that there was a significant positive total indirect effect between service quality and customer loyalty for both Hungarians and international customers of telecommunication companies.
However, the results showed that for Hungarian customers, only customers’ perceptions toward promotional packages could mediate the effect of service quality on customer loyalty. Whereas for international customers, both customer delight and the perception toward promotional packages mediated the relationship between service quality and customer loyalty. This leads to accepting hypothesis H7 for both segments of customers, whereas hypothesis H8 could be accepted for the international customers only.
Furthermore, the results showed that the three-path mediation was significant for foreign customers but insignificant for Hungarian customers. However, it was weak in the case of foreign customers as well. Therefore, the last hypothesis was accepted for international customers and rejected for Hungarian customers.

5. Discussion

This study was conducted to examine the customer loyalty towards telecom companies in Hungary during the COVID-19 pandemic. The study explored the impact of service quality, perception towards promotional packages, and customer delight on customer loyalty in the context of telecom companies, namely Vodafone, T-Mobile, and Telenor, in Hungary. It also examined the mediating impacts of promotional packages and customer delight between service quality and customer loyalty. The findings of this study reveal the behavioral comparison towards telecom companies between Hungarians and foreigners in Hungary and determine the measures of customer loyalty among both customer segments.
The results of this study show that service quality plays a significant positive role in enhancing customer loyalty towards telecom consumers in Hungary. Hence, hypothesis H1 is strongly supported. The result is in accordance with previous studies conducted during or before the COVID-19 pandemic (Dhasan and Kowathanakul 2021; Shen and Yahya 2021; Malhotra and Malhotra 2013; Santouridis and Trivellas 2010), indicating the importance of service quality on the loyalty of the customers. However, according to our findings, these effects can vary regarding their nationality (Hungarian or foreigners), as our results showed that the impact of service quality is stronger among foreign customers to influence their loyalty in comparison to Hungarian customers. This result suggests that foreign customers living in Hungary are more influenced by the service quality of their telecom companies. The reason behind this might be that the foreigners are more frequent in calling customer service and in return receive better feedback. Moreover, foreigners often receive English-speaking executives to provide assistance for their problems, which makes them happy with the provided service Furthermore, other dimensions of service quality such as time of waiting, location of customer service office, availability of customer services, and helpfulness of the employees affects the consumer’s perception towards service quality. On the other hand, Hungarian customers are not very influenced by service quality, which should be the topic of concern for the managers of Hungarian telecom companies.
Secondly, the influence of service quality on perception towards promotional packages was examined. The results of our study showed that service quality positively influences the perception of consumers towards promotional packages. So, hypothesis H2 is also strongly supported. It suggests that if the customers are happy with the service quality, then they are more likely to perceive promotional packages as additional benefits. This result is in line with Paulrajan and Rajkumar (2011), who noted that perceptions of customers toward promotional packages can be the key reason for choosing a particular telecom company over others. The results showed that perceptions of promotional packages positively impact customer delight, which proved our proposed hypothesis H3. This result provided support to the previous studies, which suggested that perceptions towards promotional packages could be the antecedents of customer delight (Berman 2005; Finn 2005). Furthermore, Dubey et al. (2020) explained that perceptions of promotional packages of mobile companies are one of many dimensions of the company’s perceived value for the customers and it positively enhances customer delight. These results are almost the same for both Hungarian and foreign customers in Hungary, but the impact of promotional packages on customer delight is relatively low for both customer segments. This implies that even if the customers perceive promotional packages as additional benefits, it still does not lead to a high level of customer delight. This may lead us to conclude that the current promotional packages are not sufficient in increasing the cheerfulness of the customers and their delight.
Further, promotional packages positively influence customer loyalty and support our proposed hypothesis H4. This result is in accordance with the previous literature (Dhasan and Kowathanakul 2017; Dhasan and Kowathanakul 2021). The findings of our study implied that during the COVID-19 pandemic, the promotional packages provided by the telecom companies lead to improved customer loyalty. However, this influence is rather low among foreigners in comparison to Hungarian customers. There could be several reasons behind this low-level influence of promotional packages among foreign customers, such as fewer packages available for foreign customers, inability to understand and avail existing packages, the language barrier in understanding the terms and conditions for the packages, or unawareness regarding available promotional packages.
Next, the findings suggested that service quality significantly and positively affects customer delight. Hence, our proposed hypothesis H5 is also supported. In support of this, Pratondo and Zaid, 2021, explained the significant positive impact of service quality on customer delight. The findings also indicated that the influence of service quality on delight is higher among foreign customers in comparison to Hungarians. This implies that Hungarian customers are less likely to be delighted by the quality of service of telecom companies, while foreign customers show a moderate level of delight. On the other hand, customer delight significantly influences customer loyalty among foreign customers but is not significant for Hungarian customers. This supports our proposed hypothesis H6 for foreigners but not supported for Hungarian customers. However, in the case of foreign customers, the influence of delight on customer loyalty is also very weak. These findings imply that even if the companies aim to delight their customers, it will not result in improving their loyalty towards the company. These results are supported by Bowden and Dagger (2011), who reported in their study that delight cannot be considered as the determining factor for customer loyalty. However, delight could be a segment-specific phenomenon (Bowden 2009).
In addition to this, our findings also suggested that in the case of Hungarian customers, it is only the customer’s perception towards promotional packages that positively mediated the relationship between service quality and customer loyalty. When analyzing the mediation effect of customer delight between service quality and customer loyalty, we could not find any significant effect among Hungarian customers. However, in the case of foreign customers, both promotional packages and customer delight individually mediate the relationship between service quality and customer loyalty. Hence, our hypothesis H7 is supported for both customer segments, and hypothesis H8 is supported only for foreign customers. The results imply that to enhance customer loyalty, both promotional packages and customer delight can act as a mediator in the case of foreign customers living in Hungary.
Lastly, the mediation effects of promotional packages and customer delight between service quality and customer loyalty were examined. The results of our study showed that there is a significantly positive mediation effect of promotional packages and customer delight between service quality and customer loyalty among foreign customers only. Hence, our hypothesis H9 is supported for foreign customers and rejected for Hungarians. This implies that quality of service will significantly influence the perception of customers towards promotional packages, which will further lead to delighting customers and as a result will improve their loyalty towards telecom companies among foreign customers. Quach et al. (2016) explained that promotion strategies and perceived reliability of promotional packages enable firms to retain their customers and, apart from service quality, other factors also affect consumer behavior, such as perceived value, promotional offers, and positive word of mouth. To the best of the authors knowledge, none of the studies were conducted to analyze the mediation effect of both promotional packages and customer delight together. This finding will provide evidence for the mediation effect of promotional packages and customer delight between service quality and customer loyalty in the context of telecom companies during the COVID-19 pandemic.

6. Implications

Several theoretical implications concerning consumer behavior are associated with this study. First, the findings of this study provide a holistic model for service quality, promotional packages, and delight, to develop loyalty in the telecommunication industry in Hungary. Second, it provided a systematic comparison between Hungarian customers and foreigners living in Hungary to show the difference in the behaviors of each segment.
Previously, it has been widely argued that service quality affects customer loyalty positively, but there is a lack of studies that investigate the role of the other two mediating variables in this effect. The study highlighted the role of service quality in enhancing the customers’ perceptions of promotional packages indicating that this role is significant for both Hungarian and non-Hungarian customers. To the best of the authors knowledge, none of the previous studies have identified the influence of service quality on customers’ perceptions toward promotional packages. These perceptions toward promotional packages are important for organizations because they are an important element of the company’s perceived value of the customers (Dubey et al. 2020). Furthermore, these perceptions towards promotional packages can influence the customers’ willingness to pursue the usage of the service (Dhasan and Kowathanakul 2021) and increase the loyalty and perceived fairness of the customers (Santouridis and Trivellas 2010). Thus, the presented mediation process in the current study proposed a comprehensive framework to understand the influence of service quality on customer loyalty. This research work is also a significant contribution to the current literature because it has addressed the customer loyalty issues in the telecom sector in Hungary; moreover, it made a comparison between local and foreign customers related to the study’s framework variables. This is especially important as this sector is facing various challenges during the pandemic due to overloaded and strong competition. There are few studies on promotional packages and customer delight (Berman 2005; Finn 2005), and the largest part of those studies has focused on them as a predictor of other customer behaviors; therefore, this study is examining the impact of these variables, and the interaction between them, on customer loyalty, for the first time. In addition, their role as serial mediators is also considered to be a new model for understanding customer loyalty.
This study provides several practical implications. During the COVID-19 pandemic, the telecom industry has faced various challenges. In this regard, understanding the impact of various factors on customer loyalty is necessarily significant. Hence, this study incorporates three variables to examine customer loyalty, such as service quality, perception towards promotional packages, and customer delight. The results of the study suggested the impact of these variables on the customer loyalty of Hungarian as well as foreign customers living in Hungary. These results will provide a better understanding of the consumer behavior of both segments and will help policymakers and managers to create marketing strategies accordingly. The service quality of selected telecom companies poses a different impact on Hungarian and foreign customers’ loyalty. The results suggest that among Hungarian customers, service quality is a weak predictor of customer loyalty. Therefore, managers can modify their service quality dimensions concerning Hungarian customers. In addition, managers and policymakers should create various promotional packages, which can help in increasing customer loyalty during the COVID-19 pandemic. Our results also suggested that customer delight had a weak influence on customer loyalty among foreign customers and had an insignificant relationship among Hungarian customers. Therefore, companies should work towards making service quality and promotional packages better to enhance customer loyalty, as delighting customers is not positively affecting loyalty.

7. Conclusions and Future Research Directions

The impact of the COVID-19 pandemic has created risks and challenges for every sector in every country. The rapid surge in demand and data traffic were some of the challenges faced by the telecommunication sector. The shift to virtual work and study environments has created a huge burden on telecom companies to provide essential services to the customers. In this regard, it is necessary to understand the impact of service quality on the loyalty of the customers towards telecom companies. This study was conducted to examine the role of service quality, promotional packages, and customer delight in improving customer loyalty towards telecom companies in Hungary during the COVID-19 pandemic. This study also provided the difference in the impact of these antecedents of loyalty among Hungarian and foreign customers’ loyalty, which is important for policymakers and managers to identify the behavioral differences and cater to each segment accordingly. The results suggested that foreign customers are more delighted by the service quality of telecom companies than Hungarian customers. In the case of both Hungarian and foreign customers, promotional packages play a significant role in improving customer loyalty. Service quality is a stronger predictor of customer loyalty in the case of foreign customers. However, in both customer segments, promotional packages positively mediate the relationship between service quality and customer loyalty, while customer delight mediates the relationship between service quality and customer loyalty among foreign customers only. The findings of our study will fill the research gap and provide future research directions in the framework of service quality and customer loyalty.
Future studies can be conducted on different sectors by following the model presented in this study. The current study did not identify the impact of demographic variables such as age, gender, and income on customer loyalty, hence future researchers can identify its impact on customer loyalty. Future studies can add more variables into the model such as customer satisfaction, trust, perceived value, and customer expectation, etc. This study did not clarify the services provided by the company, so future studies can focus on different services and then, based on service quality, can identify loyalty.

Author Contributions

Conceptualization, F.N. and A.A.; methodology, A.A. and F.N.; software, A.A.; validation, A.A. and F.N.; formal analysis, A.A. and F.N.; investigation, F.N. and A.A; resources, F.N., R.M., I.R., and A.A.; data curation, A.A.; writing—original draft preparation, F.N. and A.A.; writing—review and editing, R.M. and F.N.; visualization, F.N., A.A., and R.M.; supervision, R.M. and I.R.; project administration, R.M. and A.A.; funding acquisition, R.M. and I.R. All authors have read and agreed to the published version of the manuscript.

Funding

There is no funding provided for this research.

Institutional Review Board Statement

Not applicable.

Informed Consent Statement

Not applicable.

Data Availability Statement

Not applicable.

Conflicts of Interest

The authors declare no conflict of interest.

References

  1. Agbonifoh, Barnabas Aigbojie, Ogwo E. Ogwo, D. A. Nnolim, and Anayo D. Nkamnebe. 2007. Marketing in Nigeria, Concepts, Principles and Decisions. Aba: ABA ABIA, ABIA State, Aba Afritowers Limited Nigeria. [Google Scholar]
  2. Agu, Godswill Agu. 2021. Perceived sales promotion transparency and customer intention to participate: Insight from student-bank customers in Nigeria. Journal of Marketing Communications 27: 762–79. [Google Scholar] [CrossRef]
  3. Agu, Godswill Agu, and Joseph Uduak. 2018. Promotional incentives and customer perception of brewery products in Aba. The Journal of Marketing and Business Policy 1: 55–72. [Google Scholar]
  4. Ahrholdt, Dennis C., Siegfried P. Gudergan, and Christian M. Ringle. 2017. Enhancing service loyalty: The roles of delight, satisfaction, and service quality. Journal of Travel Research 56: 436–50. [Google Scholar] [CrossRef]
  5. Al-Hawari, Mohammad A. 2011. Automated service quality as a predictor of customers’ commitment: A practical study within the UAE retail banking context. Asia Pacific Journal of Marketing and Logistics 23: 346–66. [Google Scholar] [CrossRef]
  6. Ali, Faizan, Yuan Zhou, Kashif Hussain, Pradeep K. Nair, and Neethiahnanthan A. Ragavan. 2016. Does higher education service quality effect student satisfaction, image and loyalty? A study of international students in Malaysian public universities. Quality Assurance in Education 24: 70–94. [Google Scholar] [CrossRef]
  7. Alsulami, Hemaid. 2021. A Framework for Improving Customer Loyalty at Retailers in Jeddah City: A Case Study. American Journal of Industrial and Business Management 11: 973–83. [Google Scholar] [CrossRef]
  8. Anabila, Peter, Leeford E. K. Ameyibor, Michael M. Allan, and Clemence Alomenu. 2021. Service Quality and Customer Loyalty in Ghana’s Hotel Industry: The Mediation Effects of Satisfaction and Delight. Journal of Quality Assurance in Hospitality & Tourism, 1–23. [Google Scholar] [CrossRef]
  9. Anwar, Shahzad, Li Min, and Gulam Dastagir. 2019. Effect of service quality, brand image, perceived value on customer satisfaction and loyalty in the Chinese banking industry. International Journal of Business, Economics and Management Works 6: 24–30. [Google Scholar]
  10. Appolloni, Andrea, Nathalie Colasanti, Chiara Fantauzzi, Gloria Fiorani, and Rocco Frondizi. 2021. Distance learning as a resilience strategy during Covid-19: An analysis of the Italian context. Sustainability 13: 1388. [Google Scholar] [CrossRef]
  11. Arnold, Mark J., Kristy E. Reynolds, Nicole Ponder, and Jason E. Lueg. 2005. Customer delight in a retail context: Investigating delightful and terrible shopping experiences. Journal of Business Research 58: 1132–45. [Google Scholar] [CrossRef]
  12. Awang, Zainudin. 2012. Structural Equation Modeling Using AMOS Graphic. Selangor: Penerbit Universiti Teknologi MARA. [Google Scholar]
  13. Bagozzi, Richard P., Youjae Yi, and Lynn W. Phillips. 1991. Assessing construct validity in organizational research. Administrative Science Quarterly 36: 421–58. [Google Scholar] [CrossRef]
  14. Baruch, Yehuda, and Brooks C. Holtom. 2008. Survey response rate levels and trends in organizational research. Human Relations 61: 1139–60. [Google Scholar] [CrossRef] [Green Version]
  15. Bentler, Peter M. 1990. Comparative fit indexes in structural models. Psychological Bulletin 107: 238–46. [Google Scholar] [CrossRef] [PubMed]
  16. Berman, Barry. 2005. How to Delight Your Customers. California Management Review 48: 129–51. [Google Scholar] [CrossRef]
  17. Bowden, Jana Lay-Hwa. 2009. The process of customer engagement: A conceptual framework. Journal of Marketing Theory and Practice 17: 63–74. [Google Scholar] [CrossRef]
  18. Bowden, Jana L. H., and Tracey S. Dagger. 2011. To delight or not to delight? An investigation of loyalty formation in the restaurant industry. Journal of Hospitality Marketing & Management 20: 501–24. [Google Scholar]
  19. Bowen, John T., and Shiang-Lih Chen. 2001. The relationship between customer loyalty and customer satisfaction. International Journal of Contemporary Hospitality Management 13: 213–17. [Google Scholar] [CrossRef]
  20. Budapest Business Journal (BBJ). 2020. COVID-19 Sees Hungary’s Data Traffic Surge. Available online: https://bbj.hu/business/tech/telco/COVID-19-sees-hungarys-data-traffic-surge (accessed on 29 June 2021).
  21. Casidy, Riza, and Walter Wymer. 2016. A risk worth taking: Perceived risk as moderator of satisfaction, loyalty, and willingness-to-pay premium price. Journal of Retailing and Consumer Services 32: 189–97. [Google Scholar] [CrossRef]
  22. Chin, Wynne W. 1998. Commentary: Issues and opinion on structural equation modeling. MIS Quarterly 22: 7–16. [Google Scholar]
  23. Desiyanti, Ni Luh, I. Nengah Sudja, and Luh Kadek Budi Martini. 2018. Effect of service quality on customer satisfaction, customer delight and customer loyalty (Study on LPD Desa Adat Sembung and LPD Desa Adat Seseh). International Journal of Contemporary Research and Review 9: 20660–68. [Google Scholar] [CrossRef] [Green Version]
  24. Dhasan, Darwin, and Suwanna Kowathanakul. 2017. Building Customer Loyalty Through Service Quality, Customer Engagement and Commitment: The Case of Mobile Network Providers in Thailand. Paper presented at the XVI International Business & Economy Conference (IBEC)-Chile, Puerto Montt, Chile, January 4–7. [Google Scholar]
  25. Dhasan, Darwin, and Suwanna Kowathanakul. 2021. The impact of service quality, promotions and customer engagement in determining customer loyalty in the Thai mobile network industry. ABAC Journal 41: 209–40. [Google Scholar]
  26. Dubey, Prince, Naval Bajpai, Sanjay Guha, and Kushagra Kulshreshtha. 2020. Mapping gender and marital roles on customer delight by value perception for mobile technology in India. Technology in Society 62: 101275. [Google Scholar] [CrossRef]
  27. Elias-Almeida, Anabela, Francisco J. Miranda, and Paulo Almeida. 2016. Customer delight: Perception of hotel spa consumers. European Journal of Tourism, Hospitality and Recreation 7: 13–20. [Google Scholar] [CrossRef] [Green Version]
  28. Farris, Paul W., and John A. Quelch. 2004. In Defense of Price Promotion. Sloan Management Review 29: 63–70. [Google Scholar]
  29. Finn, Adam. 2005. Reassessing the Foundations of Customer Delight. Journal of Service Research 8: 103–16. [Google Scholar] [CrossRef]
  30. Fornell, Claes, and David F. Larcker. 1981. Evaluating structural equation models with unobservable variables and measurement error. Journal of Marketing Research 18: 39–50. [Google Scholar] [CrossRef]
  31. Ganesh, Jaishankar, Mark J. Arnold, and Kristy E. Reynolds. 2000. Understanding the customer base of service providers: An examination of the differences between switchers and stayers. Journal of Marketing 64: 65–87. [Google Scholar] [CrossRef] [Green Version]
  32. Gorgenyi-Hegyes, Eva, Robert J. Nathan, and Maria Fekete-Farkas. 2021. Workplace Health Promotion, Employee Wellbeing and Loyalty during COVID-19 Pandemic—Large Scale Empirical Evidence from Hungary. Economies 9: 55. [Google Scholar] [CrossRef]
  33. Gounaris, Spiros P., Vlassis Stathakopoulos, and Antreas D. Athanassopoulos. 2003. Antecedents to perceived service quality: An exploratory study in the banking industry. International Journal of Bank Marketing 21: 168–90. [Google Scholar] [CrossRef]
  34. Hadiwijaya, Ony Thoyib, Amiartuti Kusmaningtyas, and Abdul Halik. 2021. Relationship between Service Quality and Customer Delight and Customer Loyalty at the Fitness Center Business in East Java. Journal of Asian Multicultural Research for Economy and Management Study 2: 117–24. [Google Scholar] [CrossRef]
  35. Hair, Joseph F., Rolph E. Anderson, William C. Black, and Barry J. Babin. 2016. Multivariate Data Analysis. New York: Pearson Education. [Google Scholar]
  36. Haque, Ahasanul, Sabbir Rahman, and Mahbubur Rahman. 2010. Factors determinants the choice of mobile service providers: Structural equation modeling approach on Bangladeshi consumers. Business and Economics Research Journal 1: 17–34. [Google Scholar]
  37. Hayes, Andrew F. 2013. Introduction to Mediation, Moderation, and Conditional Process Analysis. New York: Guilford Publications. [Google Scholar]
  38. Hayes, Andrew F. 2017. Introduction to Mediation, Moderation, and Conditional Process Analysis: A Regression-Based Approach. New York: Guilford Publications. [Google Scholar]
  39. Horvath, Jakub, Beata Gavurova, Radovan Bacik, and Richard Fedorko. 2021. Identification of Uncertainty Factors in the Consumer Behaviour of the New Generation of Customers at the E-commerce Level. Journal of Tourism and Services 22: 168–83. [Google Scholar] [CrossRef]
  40. Hossain, Munir, and Anowar Ullah. 2011. Customer loyalty and influencing factors: A correlation analysis. World Review of Business Research 1: 1–9. [Google Scholar]
  41. Huertas-Valdivia, Irene, F. Javier Llorens-Montes, and Antonia Ruiz-Moreno. 2018. Achieving engagement among hospitality employees: A serial mediation model. International Journal of Contemporary Hospitality Management 30: 217–41. [Google Scholar] [CrossRef]
  42. Hungary Today. 2020. Available online: https://hungarytoday.hu/free-internet-should-be-requested-at-service-providers-telekom-and-vodafone-ready/ (accessed on 26 June 2021).
  43. Hur, Won-Moo, Jungkun Park, and Minsung Kim. 2010. The role of commitment on the customer benefits–loyalty relationship in mobile service industry. The Service Industries Journal 30: 2293–309. [Google Scholar] [CrossRef]
  44. Izogo, Ernest Emeka. 2017. Customer loyalty in telecom service sector: The role of service quality and customer commitment. The TQM Journal 29: 19–36. [Google Scholar] [CrossRef]
  45. Ji, Chunli, and Catherine Prentice. 2021. Linking transaction-specific satisfaction and customer loyalty—The case of casino resorts. Journal of Retailing and Consumer Services 58: 102319. [Google Scholar] [CrossRef]
  46. Kandampully, Jay. 1998. Service quality to service loyalty: A relationship which goes beyond customer services. Total Quality Management 9: 431–43. [Google Scholar] [CrossRef]
  47. Kandampully, Jay, Thanika Devi Juwaheer, and Hsin-Hui Hu. 2011. The influence of a hotel firm’s quality of service and image and its effect on tourism customer loyalty. International Journal of Hospitality & Tourism Administration 12: 21–42. [Google Scholar]
  48. Karjaluoto, Heikki, Chanaka Jayawardhena, Matti Leppäniemi, and Minna Pihlström. 2012. How value and trust influence loyalty in wireless telecommunications industry. Telecommunications Policy 36: 636–49. [Google Scholar] [CrossRef]
  49. Kaura, Vinita, Ch S. Prasad, and S. Sharma. 2015. Service quality, service convenience, price and fairness, customer loyalty, and the mediating role of customer satisfaction. International Journal of Bank Marketing 33: 404–22. [Google Scholar] [CrossRef]
  50. Keylock, Matthew, and Malcolm Faulds. 2012. From customer loyalty to social advocacy. Journal of Direct, Data and Digital Marketing Practice 14: 160–65. [Google Scholar] [CrossRef] [Green Version]
  51. Kotler, Philip, and Kevin Lane Keller. 2007. Marketing Management, 12th ed. Hoboken: Prentice Hall. [Google Scholar]
  52. Lee, Jung Eun, and Jessie H. Chen-Yu. 2018. Effects of price discount on consumers’ perceptions of savings, quality, and value for apparel products: Mediating effect of price discount affect. Fashion and Textiles 5: 1–21. [Google Scholar] [CrossRef] [Green Version]
  53. Lewis, Robert, and Bernard Booms. 1983. The marketing aspects of service quality. Emerging Perspectives on Services Marketing 65: 99–107. [Google Scholar]
  54. Liu, Tsung-Chi, and Li-Wei Wu. 2007. Customer retention and cross-buying in the banking industry: An integration of service attributes, satisfaction and trust. Journal of Financial Services Marketing 12: 132–45. [Google Scholar] [CrossRef]
  55. López-Miguens, M. Jesús, and Encarnación González Vázquez. 2017. An integral model of e-loyalty from the consumer’s perspective. Computers in Human Behavior 72: 397–411. [Google Scholar] [CrossRef]
  56. Malai, Veerapong, and Mark Speece. 2005. Cultural impact on the relationship among perceived service quality, brand name value, and customer loyalty. Journal of International Consumer Marketing 17: 7–39. [Google Scholar] [CrossRef]
  57. Malhotra, Arvind, and Claudia Kubowicz Malhotra. 2013. Exploring switching behavior of US mobile service customers. Journal of Services Marketing 27: 13–24. [Google Scholar] [CrossRef]
  58. Mattila, Anna S., and Cathy A. Enz. 2002. The role of emotions in service encounters. Journal of Service Research 4: 268–77. [Google Scholar] [CrossRef] [Green Version]
  59. McMullan, Rosalind, and Audrey Gilmore. 2008. Customer loyalty: An empirical study. European Journal of Marketing 42: 1084–94. [Google Scholar] [CrossRef]
  60. Mheidly, Nour, Mohamad Y. Fares, and Jawad Fares. 2020. Coping with stress and burnout associated with telecommunication and online learning. Frontiers in Public Health 8: 672. [Google Scholar] [CrossRef] [PubMed]
  61. Moreira, Antonio Carrizo, Pedro Miguel Silva, and Victor F. Moutinho. 2016. Differences between stayers, switchers, and heavy switchers: A study in the telecommunications service market. Marketing Intelligence & Planning 34: 843–62. [Google Scholar] [CrossRef]
  62. Morgan, Simon, and Krishna Govender. 2017. Exploring customer loyalty in the South African mobile telecommunications sector. Cogent Business & Management 4: 1–16. [Google Scholar] [CrossRef]
  63. Muthén, Linda K., and Bengt O. Muthén. 2002. How to use a Monte Carlo study to decide on sample size and determine power. Structural Equation Modeling 9: 599–620. [Google Scholar] [CrossRef]
  64. Naz, Farheen, Judit Oláh, Dinu Vasile, and Róbert Magda. 2020. Green Purchase Behavior of University Students in Hungary: An Empirical Study. Sustainability 12: 10077. [Google Scholar] [CrossRef]
  65. Okpara, Gazie. 2012. Contemporary Marketing: Topical and Tropicalised. Owerri: Avan Global Publications. [Google Scholar]
  66. Oliver, Richard L. 1997. Satisfaction: A Behavioral Perspective on the Consumer, International ed. New York: McGraw-Hill. [Google Scholar]
  67. Omar, Suha, Kholoud Mohsen, Georgios Tsimonis, Adam Oozeerally, and Jen-Hsien Hsu. 2021. M-commerce: The nexus between mobile shopping service quality and loyalty. Journal of Retailing and Consumer Services 60: 102468. [Google Scholar] [CrossRef]
  68. Onuoha, A. O. 2016. Sale Promotion. In Intermediate Marketing: Bridging the Gap between Foundational and Specialized Marketing Thoughts. Edited by G. S. Okpara and G. A. Agu. Owerri: Avan Global Press, pp. 146–67. [Google Scholar]
  69. Parasuraman, A., Valarie A. Zeithaml, and Leonard L. Berry. 1988. SERVQUAL: A multiple-item scale for measuring consumer perceptions of service quality. Journal of Retailing 64: 12–40. [Google Scholar]
  70. Patterson, Kimberly. 1997. Delighted clients are loyal clients. Rough Notes 140: 221–34. [Google Scholar]
  71. Paulrajan, Rajkumar, and Harish Rajkumar. 2011. Service quality and customers preference of cellular mobile service providers. Journal of Technology Management & Innovation 6: 38–45. [Google Scholar]
  72. Pelet, Jean-Eric, Benoît Lecat, Jashim Khan, Sharyn Rundle-Thiele, Linda W. Lee, Debbie Ellis, Marianne McGarry Wolf, Androniki Kavoura, Vicky Katsoni, and Anne Lena Wegmann. 2018. Winery website loyalty: The role of sales promotion and service attributes. International Journal of Wine Business Research 30: 138–52. [Google Scholar] [CrossRef]
  73. Pratondo, Katon, and Zaid Zaid. 2021. Customer Loyalty During Pandemy: Understanding Loyalty through the Lens of Online Ride Hailing Service Quality. International Journal of Social Science and Business 5: 68–75. [Google Scholar] [CrossRef]
  74. Quach, Thu Nguyen, Charles Jebarajakirthy, and Park Thaichon. 2016. The effects of service quality on internet service provider customers’ behaviour: A mixed methods study. Asia Pacific Journal of Marketing and Logistics 28: 435–63. [Google Scholar] [CrossRef]
  75. Rachmawati, Indira. 2020. Importance-Performance (IPMA) Analysis of Loyalty in Indonesia Cellular Operator During COVID-19 Pandemic. Jurnal Manajemen Teknologi 19: 177–95. [Google Scholar] [CrossRef]
  76. Reichheld, Frederick F., and Phil Schefter. 2000. E-loyalty: Your secret weapon on the web. Harvard Business Review 78: 105–13. [Google Scholar]
  77. Reinartz, Werner, and Viswanathan Kumar. 2002. The mismanagement of customer loyalty. Harvard Business Review 80: 86–94. [Google Scholar] [PubMed]
  78. Rowley, Jennifer. 1998. Promotion and marketing communications in the information marketplace. Library Review 47: 383–87. [Google Scholar] [CrossRef]
  79. Rust, Roland T., and Richard L. Oliver. 2000. Should we delight the customer? Journal of the Academy of Marketing Science 28: 86–94. [Google Scholar] [CrossRef]
  80. Santouridis, Ilias, and Panagiotis Trivellas. 2010. Investigating the impact of service quality and customer satisfaction on customer loyalty in mobile telephony in Greece. The TQM Journal 22: 330–43. [Google Scholar] [CrossRef]
  81. Schneider, Benjamin, and David E. Bowen. 1999. Understanding customer delight and outrage. Sloan Management Review 41: 35–45. [Google Scholar]
  82. Schumacker, Randall E., and Richard G. Lomax. 2004. A Beginner’s Guide to Structural Equation Modeling. New York: Psychology Press. [Google Scholar]
  83. Sekaran, Uma, and Roger Bougie. 2016. Research Methods for Business: A Skill Building Approach. New York and Hoboken: Wiley. [Google Scholar]
  84. Shahzad, Arfan, Rana Muhammad Shahid Yaqub, Assunta Di Vaio, and Rohail Hassan. 2021. Antecedents of customer loyalty and performance improvement: Evidence from Pakistan’s telecommunications sector. Utilities Policy 70: 101208. [Google Scholar] [CrossRef]
  85. Shamout, Mohamed Dawood. 2016. The impact of promotional tools on consumer buying behavior in retail market. International Journal of Business and Social Science 7: 75–85. [Google Scholar]
  86. Shen, Chao, and Yazkhiruni Yahya. 2021. The impact of service quality and price on passengers’ loyalty towards low-cost airlines: The Southeast Asia’s perspective. Journal of Air Transport Management 91: 101966. [Google Scholar] [CrossRef]
  87. Solimun, Solimun, and Adji Achmad Rinaldo Fernandes. 2018. The mediation effect of customer satisfaction in the relationship between service quality, service orientation, and marketing mix strategy to customer loyalty. Journal of Management Development 37: 76–87. [Google Scholar] [CrossRef] [Green Version]
  88. Statista. 2020. Share of Hungarians Consuming Culture through the Internet during the Coronavirus (COVID-19) Pandemic in 2020. Available online: https://www.statista.com/statistics/1202080/hungary-online-culture-consumption-during-COVID-19/ (accessed on 29 June 2021).
  89. Statista. 2021. Market Share of Hungarian Mobile Network Providers from 4th Quarter 2015 to 2nd Quarter of 2020. Available online: https://www.statista.com/statistics/1116642/hungary-market-share-of-mobile-network-providers/ (accessed on 27 June 2021).
  90. Štefko, Róbert, Radovan Bačík, Richard Fedorko, Mária Oleárová, and Martin Rigelský. 2019. Analysis of consumer preferences related to the use of digital devices in the e-commerce dimension. Entrepreneurship and Sustainability Issues 7: 25. [Google Scholar] [CrossRef]
  91. Stefko, Robert, Richard Fedorko, Radovan Bacik, Martin Rigelsky, and Maria Olearova. 2020. Effect of service quality assessment on perception of TOP hotels in terms of sentiment polarity in the Visegrad group countries. Oeconomia Copernicana 11: 721–42. [Google Scholar] [CrossRef]
  92. Sweeney, Jill, and Joffre Swait. 2008. The effects of brand credibility on customer loyalty. Journal of Retailing and Consumer Services 15: 179–93. [Google Scholar] [CrossRef] [Green Version]
  93. Theingi, Theingi, Suchira Phoorithewet, Yunmei Wang, and Sikankaew Panthongprasert. 2016. The antecedents and consequences of customer engagement: An exploratory study on mobile network business in Thailand. SSRN Electronic Journal 2731321: 1–15. [Google Scholar] [CrossRef]
  94. Turaga, Nagendra K., Salaka Girish, Jeeban K. Patibandla, and Turaga Mohana. 2021. Complaint Handling, Customisation & Service Quality-Impact on Customer loyalty in Mobile services, India. Turkish Journal of Computer and Mathematics Education (TURCOMAT) 12: 4932–37. [Google Scholar]
  95. Valaskova, Katarina, Pavol Durana, and Peter Adamko. 2021. Changes in Consumers’ Purchase Patterns as a Consequence of the COVID-19 Pandemic. Mathematics 9: 1788. [Google Scholar] [CrossRef]
  96. van Jaarsveld, Danielle D., David D. Walker, and Daniel P. Skarlicki. 2010. The role of job demands and emotional exhaustion in the relationship between customer and employee incivility. Journal of Management 36: 1486–504. [Google Scholar] [CrossRef] [Green Version]
  97. Watson, George F., Joshua T. Beck, Conor M. Henderson, and Robert W. Palmatier. 2015. Building, measuring, and profiting from customer loyalty. Journal of the Academy of Marketing Science 43: 790–825. [Google Scholar] [CrossRef]
  98. Westbrook, Robert A., and Richard L. Oliver. 1991. The dimensionality of consumption emotion patterns and consumer satisfaction. Journal of Consumer Research 18: 84–91. [Google Scholar] [CrossRef]
  99. Yee, Rachel W. Y., Andy C. L. Yeung, and T. C. E. Cheng. 2011. The service-profit chain: An empirical analysis in high-contact service industries. International Journal of Production Economics 130: 236–45. [Google Scholar] [CrossRef]
  100. Zameer, Hashim, Ying Wang, Humaira Yasmeen, Amirhossein A. Mofrad, and Abdul Waheed. 2018. Corporate image and customer satisfaction by virtue of employee engagement. Human Systems Management 37: 233–48. [Google Scholar] [CrossRef]
  101. Zeithaml, Valerie, and Mary J. Bitner. 1996. Services Marketing. New York: McGraw-Hill. [Google Scholar]
Figure 1. Conceptual model.
Economies 09 00200 g001
Figure 2. Hypotheses results. *** p < 0.001, ** p < 0.01. Note: The numbers between the two brackets are for Hungarian customers.
Economies 09 00200 g002
Table 1. Sample characteristics.
TraitsItemForeignersHungarians
CountPercentage %CountPercentage %
GenderMale22859.88842.4
Female14337.511655.7
Prefer not to say102.641.9
Age18–2484226531.3
25–34244648942.8
35–444211146.7
45–5482.13516.8
≥55 years30.852.4
Tele ProviderVodafone21255.610048.1
T-Mobile80217033.6
Telenor8923.43818.3
Customer service contactVery infrequently13234.67837.5
Infrequently10126.55325.5
Occasionally11028.96631.7
Somewhat frequently277.194.3
Very frequently112.921
(Source: Author).
Table 2. The goodness of fit indices of the total models for foreign customers and Hungarian customers.
Fit Index χ2df χ2/dfTLICFIGFIAGFIRMSEASRMR
Foreigners332.6431432.3260.9490.9620.9510.9020.0570.034
Hungarians270.6361421.9060.9000.9310.9360.8990.0600.046
(Source: Author).
Table 3. The reliability tests. Foreigners (N = 381), Hungarians (N = 208).
ForeignersHungarians
VariableNo. ItemsCronbach’s alphaCronbach’s alpha
Independent variables
Service quality80.900.79
Promotional packages40.840.74
Customer delight30.850.78
Dependent variables
Customer Loyalty 50.910.83
(Source: Author).
Table 4. Factor loadings.
VariableLoadingsHungariansForeigners
Service qualitySQs10.8070.810
SQs20.8690.719
SQs30.7570.737
SQs40.7840.791
SQs50.5390.754
SQs60.6480.795
SQs70.7150.818
SQs80.7080.802
Promotional packagesPa10.6380.763
Pa20.7720.872
Pa30.8450.825
Pa40.8810.822
Customer delightCD10.7030.878
CD20.7740.908
CD30.8020.843
Customer loyaltyCLs10.6620.805
CLs20.8470.825
CLs30.8340.921
CLs40.7200.862
CLs50.7850.855
(Source: Author).
Table 5. The convergent validity tests (AVE and CR).
ForeignersHungarians
VariableNo. ItemsAVECRAVECR
Independent variables
Service quality80.610.920.540.90
Promotional packages40.670.890.620.87
Customer delight30.770.910.580.80
Dependent variables
Customer loyalty50.730.930.600.88
(Source: Author).
Table 6. Discriminant validity of Hungarians and descriptive analysis.
VariablesMeanSD1234
1. Service quality3.530.60(0.72)
2. Promotional packages3.630.560.419 **(0.79)
3. Customer delight3.420.600.286 **0.278 **(0.76)
4. Customer loyalty3.370.680.584 **0.656 **0.286 **(0.79)
(Source: Author). ** p < 0.01.
Table 7. Discriminant validity of foreigners and descriptive analysis.
VariablesMeanSD1234
1. Service quality3.630.70(0.78)
2. Promotional packages3.400.710.445 **(0.82)
3. Customer delight3.250.800.463 **0.353 **(0.88)
4. Customer loyalty3.510.790.771 **0.541 **0.486 **(0.86)
(Source: Author). ** p < 0.01.
Table 8. Direct effects.
Direct Path CoefficientForeign CustomersHungarian Customers
Standard Coefficient βS.E.pStandard Coefficient βS.E.pPath Code
Service qualityPromotional packages0.4450.046***0.4190.060***a1
Service qualityCustomer delight0.3800.057***0.2050.0730.005a2
Promotional packageCustomer loyalty0.2140.036***0.4840.064***b1
Customer delightCustomer loyalty0.1100.035***0.0780.0560.114b2
Promotional packagesCustomer delight0.1840.056***0.1930.0780.008d
Service qualityCustomer loyalty0.6490.039***0.3590.060***c’
R2Promotional packages0.190.17
Customer delight0.240.11
Customer loyalty0.680.55
(Source: Author). *** p < 0.001.
Table 9. Indirect paths.
Indirect PathForeignersHungarians
β(LLCI-ULCI)β(LLCI-ULCI)
Quality → promotional packages → customer loyalty0.100 ***(0.06–0.14)0.201 ***(0.13–0.30)
Quality → customer delight → customer loyalty0.043 ***(0.01–0.08)0.016(−0.05–0.05)
Quality → promotional packages → customer delight → customer loyalty0.010 ***(0.01–0.02)0.007(−0.02–0.02)
*** p < 0.001. (Source: Author).
Publisher’s Note: MDPI stays neutral with regard to jurisdictional claims in published maps and institutional affiliations.

