Article

The Evolution and Takeoff of the Ecuadorian Economic Groups

by
Ana Belén Tulcanaza-Prieto
1,*,† and
Manuel Eugenio Morocho-Cayamcela
2,†
1
Escuela de Negocios, Universidad de Las Américas, UDLA, Vía a Nayón, Quito 170124, Ecuador
2
School of Mathematical and Computational Sciences, Yachay Tech University, Hda. San José s/n y Proyecto Yachay, Urcuquí 100119, Ecuador
*
Author to whom correspondence should be addressed.
These authors contributed equally to this work.
Economies 2021, 9(4), 188; https://doi.org/10.3390/economies9040188
Submission received: 12 October 2021 / Revised: 18 November 2021 / Accepted: 23 November 2021 / Published: 1 December 2021
(This article belongs to the Special Issue The Impact of COVID-19 on Financial Markets and the Real Economy)

Abstract

:
An economic group is a collection of parent and subsidiary corporations that operates as a single economic organism under the same legislature of control. The decisions taken by the economic groups in any country are among the most influential factors that impact its market and the country’s economic political scenario. This work studies the impact of the Ecuadorian economic groups from 2015 to 2019, where a historical peak of 300 economic groups was reached. However, the taxes representativeness of the Ecuadorian economic groups remained stable during the same period of analysis. We analyzed the financial and fiscal variables of the Ecuadorian ranking of firms, and detected the following of its economic groups: (i) They are still concentrating wealth despite the implementation of hard government policies to transparent the financial and economic information; (ii) They tend to compete in oligopolistic markets, given that their economic and financial decisions are interconnected with their family firms or consortium groups; (iii) They operate in a behavioral nature that follows a linear association between the total income, total assets, total equity, and total tax collection. We hope this work will serve as a future reference for researchers focused on the economic groups of Ecuador and Latin American countries.

1. Introduction

An economic group is defined as a conglomerate of firms that are grouped together by their financial capital (Navarro 1975). The economic groups of a given country can be articulated in agencies, associations, industry, banks, and commerce, granting them the possibility to be an articulated in blocks as well (Fierro 1991). These groups usually have interest in the majority of economic sectors in a country, creating new fields of investment. Peralta (2015) mentioned that there is a bourgeois-tripod in Latin America that integrates the agricultural, industrial, and commercial financial sectors. Marchán (2017) studied the economical behavior of Latin America during the 19th century and introduced the concept of nation-state to describe the Republic of Ecuador, where the political strategies have been always focused on the economic elites. The nation-state concept coined by the author is justified on the economical and financial integration of Ecuador, mainly based on the idea of an economy open to both exports and local production, enabling the governability of the country.
Historically speaking, Acosta (2006) reported that the concentration of economic power in Ecuador began just after the foundation of the Republic in 1830. The author defined the four periods of the economic history of Ecuador as (i) the surplus of the colonial era, (ii) the primary-exporter modality period, (iii) the period of industrialization and import substitution, and (iv) the period of modern economy. Most of the Ecuadorian elite groups have been, throughout history, concentrated in Quito, Guayaquil, and Cuenca. The pressure of these economic groups on the government decisions have been visible across (i) the primary products exportation program (mainly for the coastal region), (ii) the manufacturing project for the north-central Andes region, and (iii) by the law of agricultural and industrial development from 1981. Cueva (1988) explained the economical and political history of Ecuador as the domination of the wealthy groups and the struggle for power between social classes. This domination process granted power to landowners, agro-exporters, and the bourgeoisie, furnishing a permanent economic power to the privileged classes. It is worth noting that the 70% of the Ecuadorian financial institutions that went bankrupt in the financial crisis of 1999 belonged to only 200 persons of the 5 largest economic groups (evincing the power of oligarchies in the country) (El Comercio 2010). Ever since, the inclusion of economic groups in the political and economic decisions of the Ecuadorian government has weakened the state, leading to a successive overthrow of presidents, an unexpected freeze of deposits (banking holiday), the devaluation of the local currency (Sucre), and the adoption of the American dollar (USD) as the official currency in 2000.
On the other hand, the economic groups in Latin America have shown small risk-diversification, compared to the international standards (Schneider 2013). This investment diversification ranges from the agro-export sector to the private financial sector. Lazzarini et al. (2008) referred that the Latin American economic groups are mostly integrated by families. The author stated that Latin America is living in the capitalism of family ties, which is sustained by the close and intertwined relationships between (i) the economy, (ii) politics, and (iii) the state. This triangular alliance has been managing the national and international market opportunities and local political economies. The study of the economic groups in Latin America intensified in the late 1950s (Garrido and Peres 1996), but its actual importance was boosted in the 1970s due to the protectionism of the economic groups by the industrialization and substitution of imports (Vanoni and Rodríguez 2017). Clear evidence of this phenomena was the several economic concentration studies in Chile (Dahse 1981; Lagos 1960), Colombia (Misas 1975; Silva 1977; Wilches and Rodríguez 2016), Nicaragua (Strachan 1976), and Ecuador (Centro de Estudios y Difusión Social (CEDIS) 1986; Fierro 1991, 2019; Minaya 2006; Navarro 1975; Pástor 2015; Solano and Tobar 2017; Tobar and Solano 2017; Tulcanaza 2010; Tulcanaza-Prieto 2018; Tulcanaza-Prieto and Morocho-Cayamcela 2018; Vanoni and Rodríguez 2017). Moreover, the economic groups in Latin America have revealed six standard features: (i) they obey their family’s ties, (ii) they are influenced by the inheritance of the colony, (iii) their production is diversified, (iv) they are technology consumers, not producers, (v) they are structured by subsidiaries, and (vi) they are usually intermediaries of multinationals.
In this study, we have empirically examined the financial and fiscal variables of the Ecuadorian economic groups, using the rankings of firms provided by the Servicio de Rentas Internas del Ecuador (SRI) from 2016 to 2020 (data correspond to 2015 to 2019) (Servicio de Rentas Internas del Ecuador 2021). Our results show that the number of Ecuadorian economic groups increased during the period of 2015–2019. However, their contribution on the Ecuadorian fiscal variables remained stable over the period of study. Moreover, we have proven the linear association between (i) the total income, (ii) the total assets, and (iii) the total equity-to-tax collection of the economic groups under study. The database incorporates the most up-to-date data from the Ecuadorian economic groups from the last 5 years. Our results identified that the regulator entities and policymakers are the key actors to establish conditions to avoid the economic concentration in the country. Therefore, their role is to monitor the business mergers or the industry strengthening, using a deeper analysis in the short-, medium-, and long-term to identify the possible collusion and fusion risks of the market.
Our manuscript contributes to the literature since the study period corresponding to 2015–2019 shows that the entry of new economic groups is increasing. Only between 2015 and 2019 were 175 Ecuadorian economic groups incorporated, which indicates that the government regulations have begun to be more transparent in the presentation of economic groups’ relationships between the parent company and its subsidiaries, exhibiting that the business environment is constantly expanding and the main actors in the dynamics of globalization continue to be the large industries and financial groups, which serve as a model for small- and medium-sized enterprises. It should also be noted that the research is timely, given the contribution to the gross domestic product (GDP) of the Ecuadorian economic groups. The trend of analysis of the Ecuadorian economic groups is developed in this article. Basically, with a descriptive approach, we are able to understand how the Ecuadorian economic groups participate in the local environment and contribute by taxes to the national economy.
The remaining of the article is organized as follows: Section 2 presents the literature review regarding the formation of economic groups in Ecuador; Section 3 presents our research methodology; Section 4 reveals the empirical findings and discusses the results; and finally Section 5 highlights the conclusions and offers recommendations and research directions for future researchers.

2. Literature Review

2.1. The Establishment and Control of the Ecuadorian Economic Concentration

The Ecuadorian market can be understood as the place where the suppliers and demanders of goods and services execute their transactions. This market structure allows a deep analysis of the economic and operational establishment of the industry, stimulating the markets to increase their efficiency. In the Ecuadorian market, the number of suppliers and demanders have determined the degree of concentration of the industrial economy, which is measured by the number of firms and their similarity (Furió and Alonso 2008). Under equal conditions, as the number of firms increases, the market concentration decreases, revealing a negative relationship between both variables. The degree of market concentration is also associated with the business’ volume and the number of workers. The business’ volume is linked to the market share (i.e., the relationship between the firm’s sales or production and the same industry variables), and the number of workers refers to the technical and operational collaborators involved in that business. However, this ratio does not always constitute a good proportion since it also depends on the line of business, the characteristics of the economic activity, and the technological level of goods and services. Table 1 shows the market structure according to the number of suppliers and demanders. The maximum degree of market concentration is the pure monopoly, contrary to the perfect competition, which is an economic structure with several suppliers and demanders.
Article 334, numeral 1, of the Constitución de la República del Ecuador (2008) states that the government must avoid the concentration or hoarding of the productive resources, reducing the presence of monopolies and oligopolies. Moreover, the Superintendency of Control of the Power of Market and the Ley Orgánica de Regulación y Control del Poder de Mercado (2011) determine whether an operation of economic concentration can be created or modified, providing the attribution to deny the concentration transaction or determine its conditions. The economic operators involved in economic concentration operations must inform the superintendency when the volume of total business in Ecuador exceeds the amount established by the board of regulation. The superintendency then determines, using a detailed study, if the concentration is authorized, denied, or subordinated, in order to avoid the overall market affectation.
The analysis of the economic concentration has changed during the last decade. For instance, in the 1970s, the analysis focused on the relationship of power between firms and the establishment of economic groups, whereas in the 2010s, its perspective was focused on the administrative capabilities and the corporate governance of firms and economic groups (Manosalve 2015; Tulcanaza-Prieto et al. 2020). A global economic concentration involves hierarchical capitalism, which studies the relationship between the firm’s development, labor market, and capital markets (Schneider 2013). In Latin America, this type of capitalism is predominant, in part due to the fragmentation of labor markets and deficiencies in the educational systems, but also due to the reduced qualification of the workforce, which mitigates the investment in research and development (Tulcanaza-Prieto and Lee 2018).
Conclusively, there are two types of concentration that can be identified, a horizontal and a vertical one. The horizontal concentration is usually called side or wide concentration, and includes the set of firms that work on the same production stage to scale the operation process, reducing the price of raw materials through a wholesale mechanism (Robinson 1957). On the other hand, firms work in different successive production stages in the vertical concentration, including the value-chain in the transformation of raw material into the final product. However, this integrated process is linked to the establishment and propagation of monopolies, which also generate an upward integration, securing the supply of raw material for entrepreneurs, and a downward integration, providing market stability through production (Tulcanaza-Prieto and Lee 2018).

2.2. The Development and Integration of Ecuadorian Economic Groups

The definition of economic groups were developed by the economist and academic Francesco Vito during the Great Depression in 1929 (Vito 1935). This definition was linked with the corporate theory and political economy as an alternative to the classical and neoclassical economic theories (Llosas 2005). In Ecuador, article 5 of the Reglamento para la Aplicación de la Ley de Régimen Tributario Interno (LORTI) defined an economic group as the set of individuals and firms, national or foreign, which directly or indirectly own 40% (or more) of the shareholding on other firms (Servicio de Rentas Internas del Ecuador 2015). An economic group can be easily formed when the owner(s) controls several firms, makes financial decisions, and defines the investment policies of the economic surplus (Dahse 1981). Moreover, a group can be structured by a family, friendship, or any other business bond (Leff 1978). It can also be integrated by different companies of diverse economic sectors that only share the administrative and financial control, corporate governance plan, or property management strategies (Anaya 1990). The integration of Ecuadorian economic groups has been impulsed by market failures, such as business’ information asymmetry, agency problems, institutional immaturity, or high transaction costs. Therefore, the economic groups act as intermediary institutions to join bidders and demands in the same place, facilitating transactions to organizations and business networks (Chavarín 2011). These intermediary institutions are the response to the economic development strategy driven by the local government (Guriev and Rachinsky 2005; Khanna and Yafeh 2007).
Among the main characteristics of the economic groups, we can distinguish the productive conglomeration, a limited separation of ownership and control between firms, and the transversal integration of the financial sector (Leff 1978). Schneider (2013) discussed that the economic groups influence the institutionality and the political economy of a country, given their technology innovation, skills development, and interaction with the political environment.

A Brief History of the Research Efforts on the Ecuadorian Economic Groups

The Ecuadorian economy has been studied since the Republic was established. Several research efforts have found a strong dependence between the Ecuadorian economy and the international market and investments. Regarding the foreign investments, and since family groups have strong links with foreign capital, they have been investing with firms from other countries as well. In addition, the productive branches have been controlled by few families and several firms, which regulate more than half of the national market (Fierro 1991).
During the 1970s, the Ecuadorian economic concentration was centralized on foreign economic groups, with low national capital and with the oil exportation as its major economic activity. At that time, Guayaquil and Filantrópica were the two family supergroups, which concentrated the economic and financial decisions of the country and excluded new participation in the business (Navarro 1975). Moreover, the powerful economic classes were the ones that distributed the surplus originated in the centralization and capital concentration (Centro de Estudios y Difusión Social (CEDIS) 1986). During the 1980s, the country experienced a monopolization as a result of the creation of conglomerates, accumulation, vertical and horizontal integrations, and diversification. In the same decade, the Ecuadorian productive capital was grounded in the agricultural sector, specifically in agricultural products and primary products that represented the base of the country’s economy. For instance, the cocoa boom emerged between the period of 1880 to 1920, while the banana boom was exploited during the period of 1948 to 1965, allowing the accumulation of wealth and the appearance of one of the most influential economic groups in Ecuador, Grupo Noboa; this was associated with international capitals from transnationals, such as United Fruit and Standard Fruit. Navarro (1975) is one of the pioneer researchers that studied the behavior of the economic groups in Ecuador. He is recognized for (i) having measured the high levels of economic concentration in Ecuador for the first time, (ii) having recognized the economic groups in Ecuador as family clusters, which control a significant number of firms, (iii) having stated that a small number of families were the main actors in the economic dynamic and economic activities in Ecuador, and (iv) having showed that Ecuadorian firms that appear to be independent behave in the same way as a family economic group when they serve the same shareholder. However, Navarro (1975) dedicated his life to studying the economic concentration based on family groups, but not analyzing their impact on the Ecuadorian economy. Similarly, the Center of Studies and Social Broadcasting of Ecuador identified the most important monopolies in the country. They analyzed the levels of concentration and capital centralization of these groups in different branches of the Ecuadorian economy (Centro de Estudios y Difusión Social (CEDIS) 1986). On the other side, Fierro (1991) identified the economic areas where the economic groups are not only consolidated, but also generating oligopolistic or monopolistic opportunities. Fierro (1991) showed that a small number of firms that belonged to a specific economic group concentrated a significant level of the national sales. Other previous studies also confirmed the relationship between the amount of sales of firms and the prevalence of economic concentration (Cañas 2015; EKOS 2012; Pástor 2015; Unda and Bethania 2010).
Centro de Estudios y Difusión Social (CEDIS) (1986) classified the Ecuadorian economic groups as economic elites that control firms and operate in more than one city, mainly located in the provinces of Pichincha, Guayas, and Azuay. It was also proved that when those economic elites are linked to financial institutions, they grant them several advantages, such as the facilitation of obtaining credits with preferential interest rates (Centro de Estudios y Difusión Social (CEDIS) 1986; Fierro 1991). Furthermore, the authors explained that the economic groups in Ecuador have access to the main distribution, transportation, and commercialization chains, evincing a perfect control of the entire production processes inside the country. Solano and Tobar (2017) exposed that the economic groups represented about the 50% of the Ecuadorian GDP during 2015. Moreover, the Ecuadorian economic groups are linked to the management of the national media and banking system; for instance, the largest Ecuadorian bank is part of one of the most important economic groups. Tobar and Solano (2017) showed that the link between the Ecuadorian banking system and the corporate sectors is a key factor in the development of the economic groups and economic concentration. The authors debated that, (i) in the majority of the cases, the economic power groups have obtained financial support from bank allies, leveraging their corporate growth, and (ii) proved the significant positive correlation (at the 1% level) between the credit offered by the financial system, and the incomes generated by production units in the city of Cuenca. Finally, Fierro (2019) showed that the divorce between financial institutions and investors in the media sector might decrease the conflict of interest between firms.
Conclusively, despite all the legal control and all the technological efforts to stop the formation of economic concentration in Ecuador, the presence of economic groups and important oligopolies is evident in the country.
Therefore, the hypothesis of this study can be summarized as follows.
Hypothesis 1.
The number of Ecuadorian economic groups exploited during the period from 2015 to 2019. However, their contribution on the Ecuadorian fiscal variables have remained stable.

3. Data Source and Methodology

The information from the economic groups in Ecuador is available through request to the Ecuadorian tax control entity (Servicio de Rentas Internas del Ecuador 2020). The tax control entity is in charge of compiling and publishing information of this nature, which is considered an effective and transparent tool to trace the trajectory and behavior of the Ecuadorian economic groups.
We analyzed the transcendental financial and fiscal variables from the Ecuadorian economic groups in the following periods:
(a)
2015–2019 (financial and fiscal variables);
(b)
2016–2020 (ranking of the economic groups).
We included the composition and financial behavior of the economic groups, and their contribution to the Ecuadorian macroeconomic variables. The information collected from the register of economic groups, corresponds to the most recent database published by Servicio de Rentas Internas del Ecuador (2021). However, the report from 2017 is not available through the server; thus, the exclusion of this year in our study was beyond our reach. The total sample consists of 1.028 observations of the Ecuadorian economic groups. We also computed the correlation coefficients of the total tax collected by the economic groups, and their association with the total income, total assets, and total equity. We assume a positive Pearson correlation coefficient, given that the independent variables (i.e., total income, total assets, and total equity) have been proved to be linearly positively related with the dependent variable (i.e., tax collected) (Tobar and Solano 2017; Tulcanaza-Prieto 2018).
To prove our hypothesis, the methodology of the study includes (i) descriptive statistics, and (ii) a correlation analysis of the financial and fiscal variables from the Ecuadorian economic groups. All variables employed in this study are described in Table 2.
We have included the following analysis to verify our hypothesis:
(a)
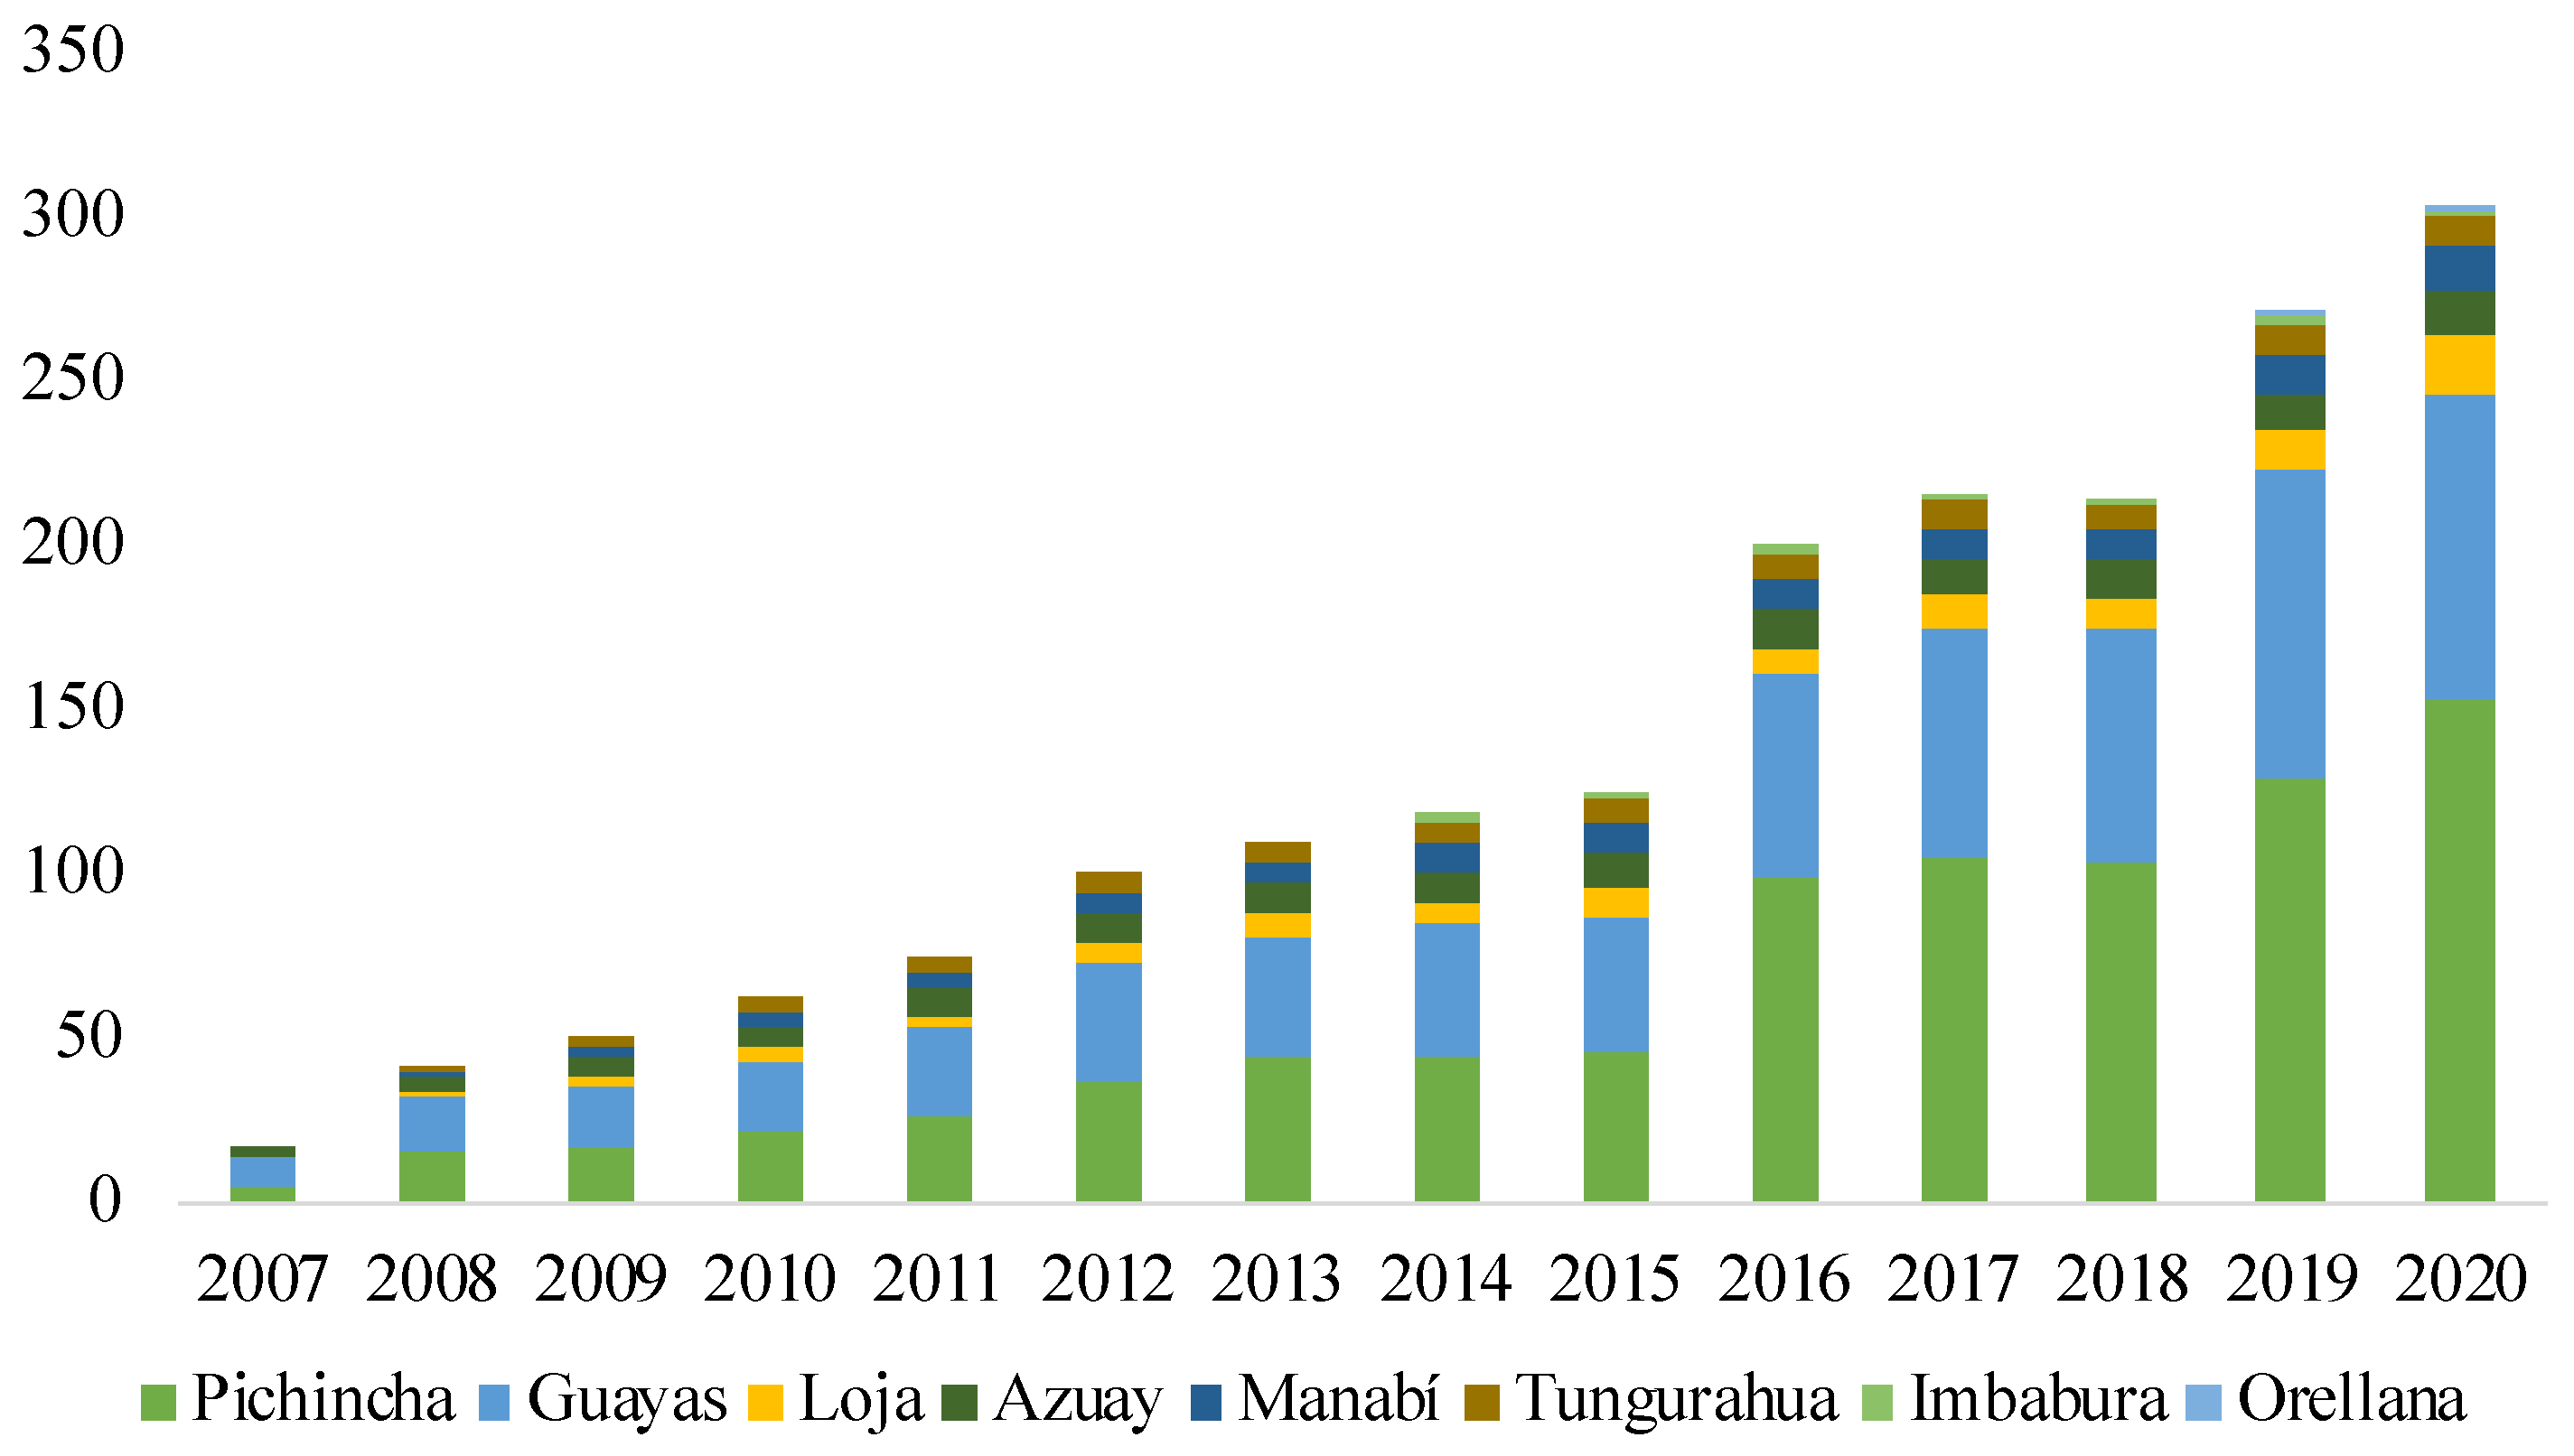
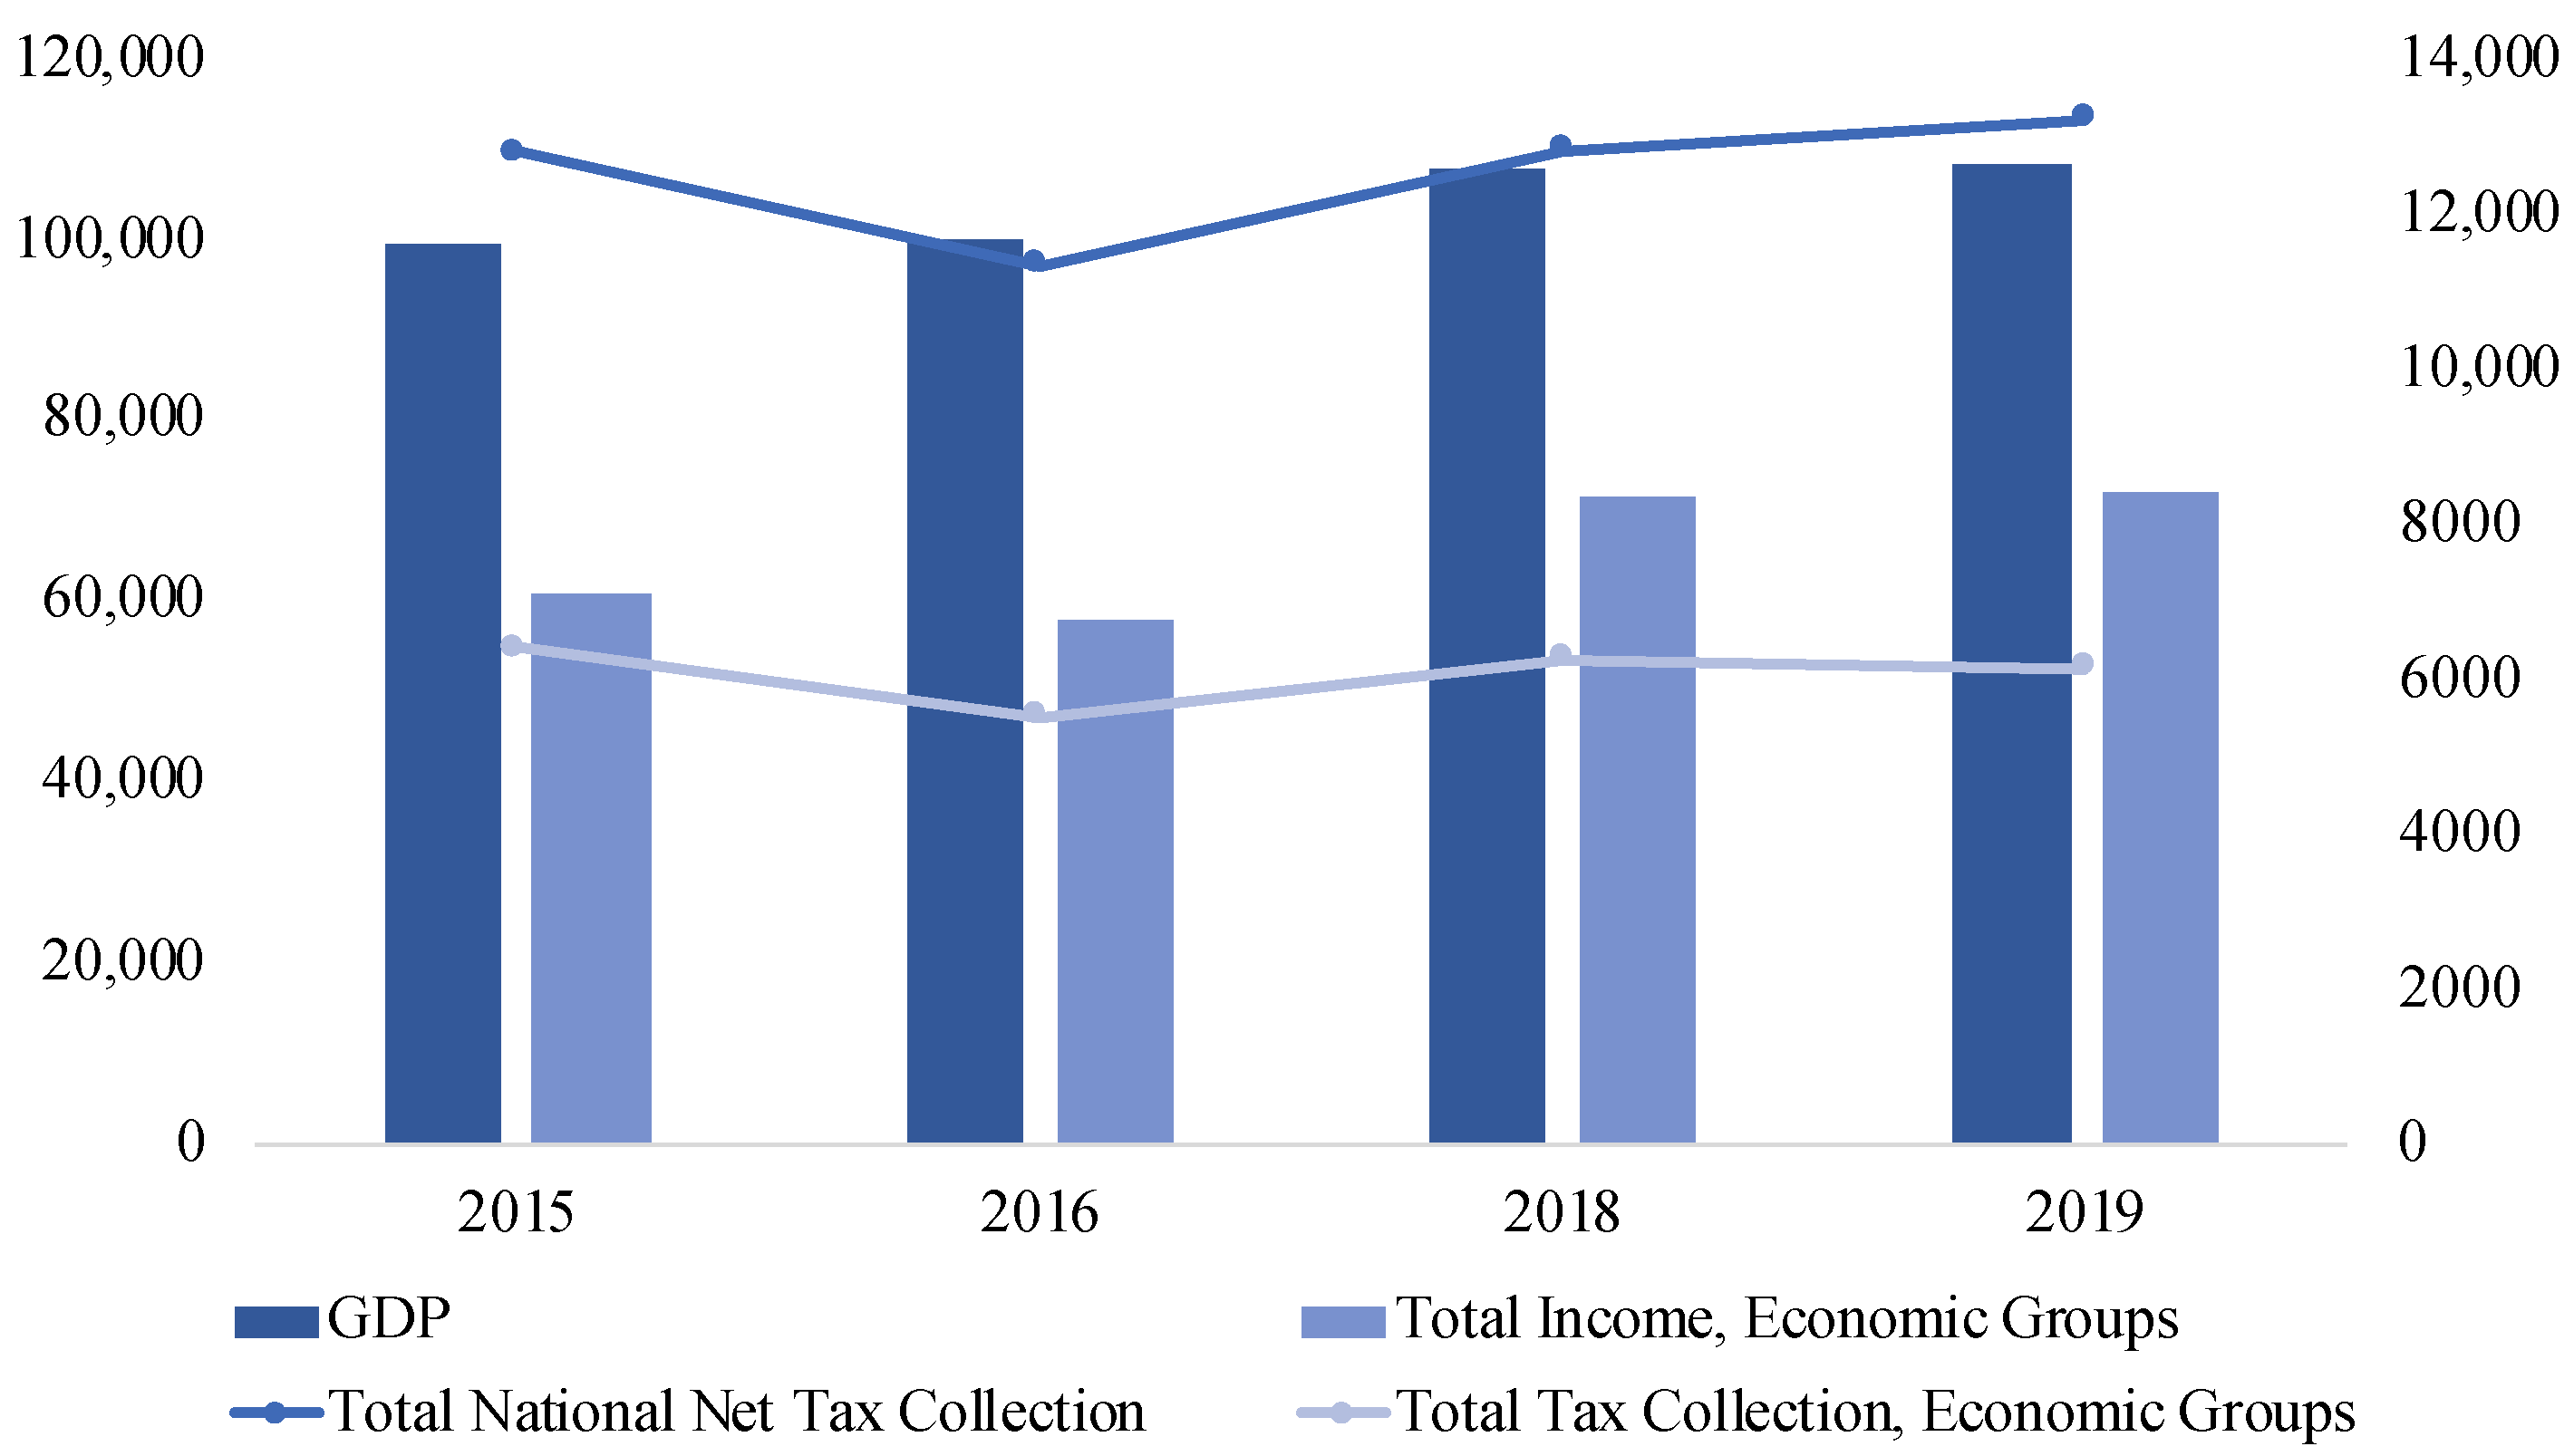
A graphic analysis of the evolution of the Ecuadorian economic groups, and the evolution of the most representative macroeconomic and fiscal variables of Ecuador. This analysis establishes the representativeness of the Ecuadorian economic groups in the local economy.
(b)
A comparative analysis of the composition of the Ecuadorian economic groups, and the evolution of their financial and fiscal variables. This analysis compares figures from 2015 to 2019 to determine if the Ecuadorian economic groups have increased over time.
(c)
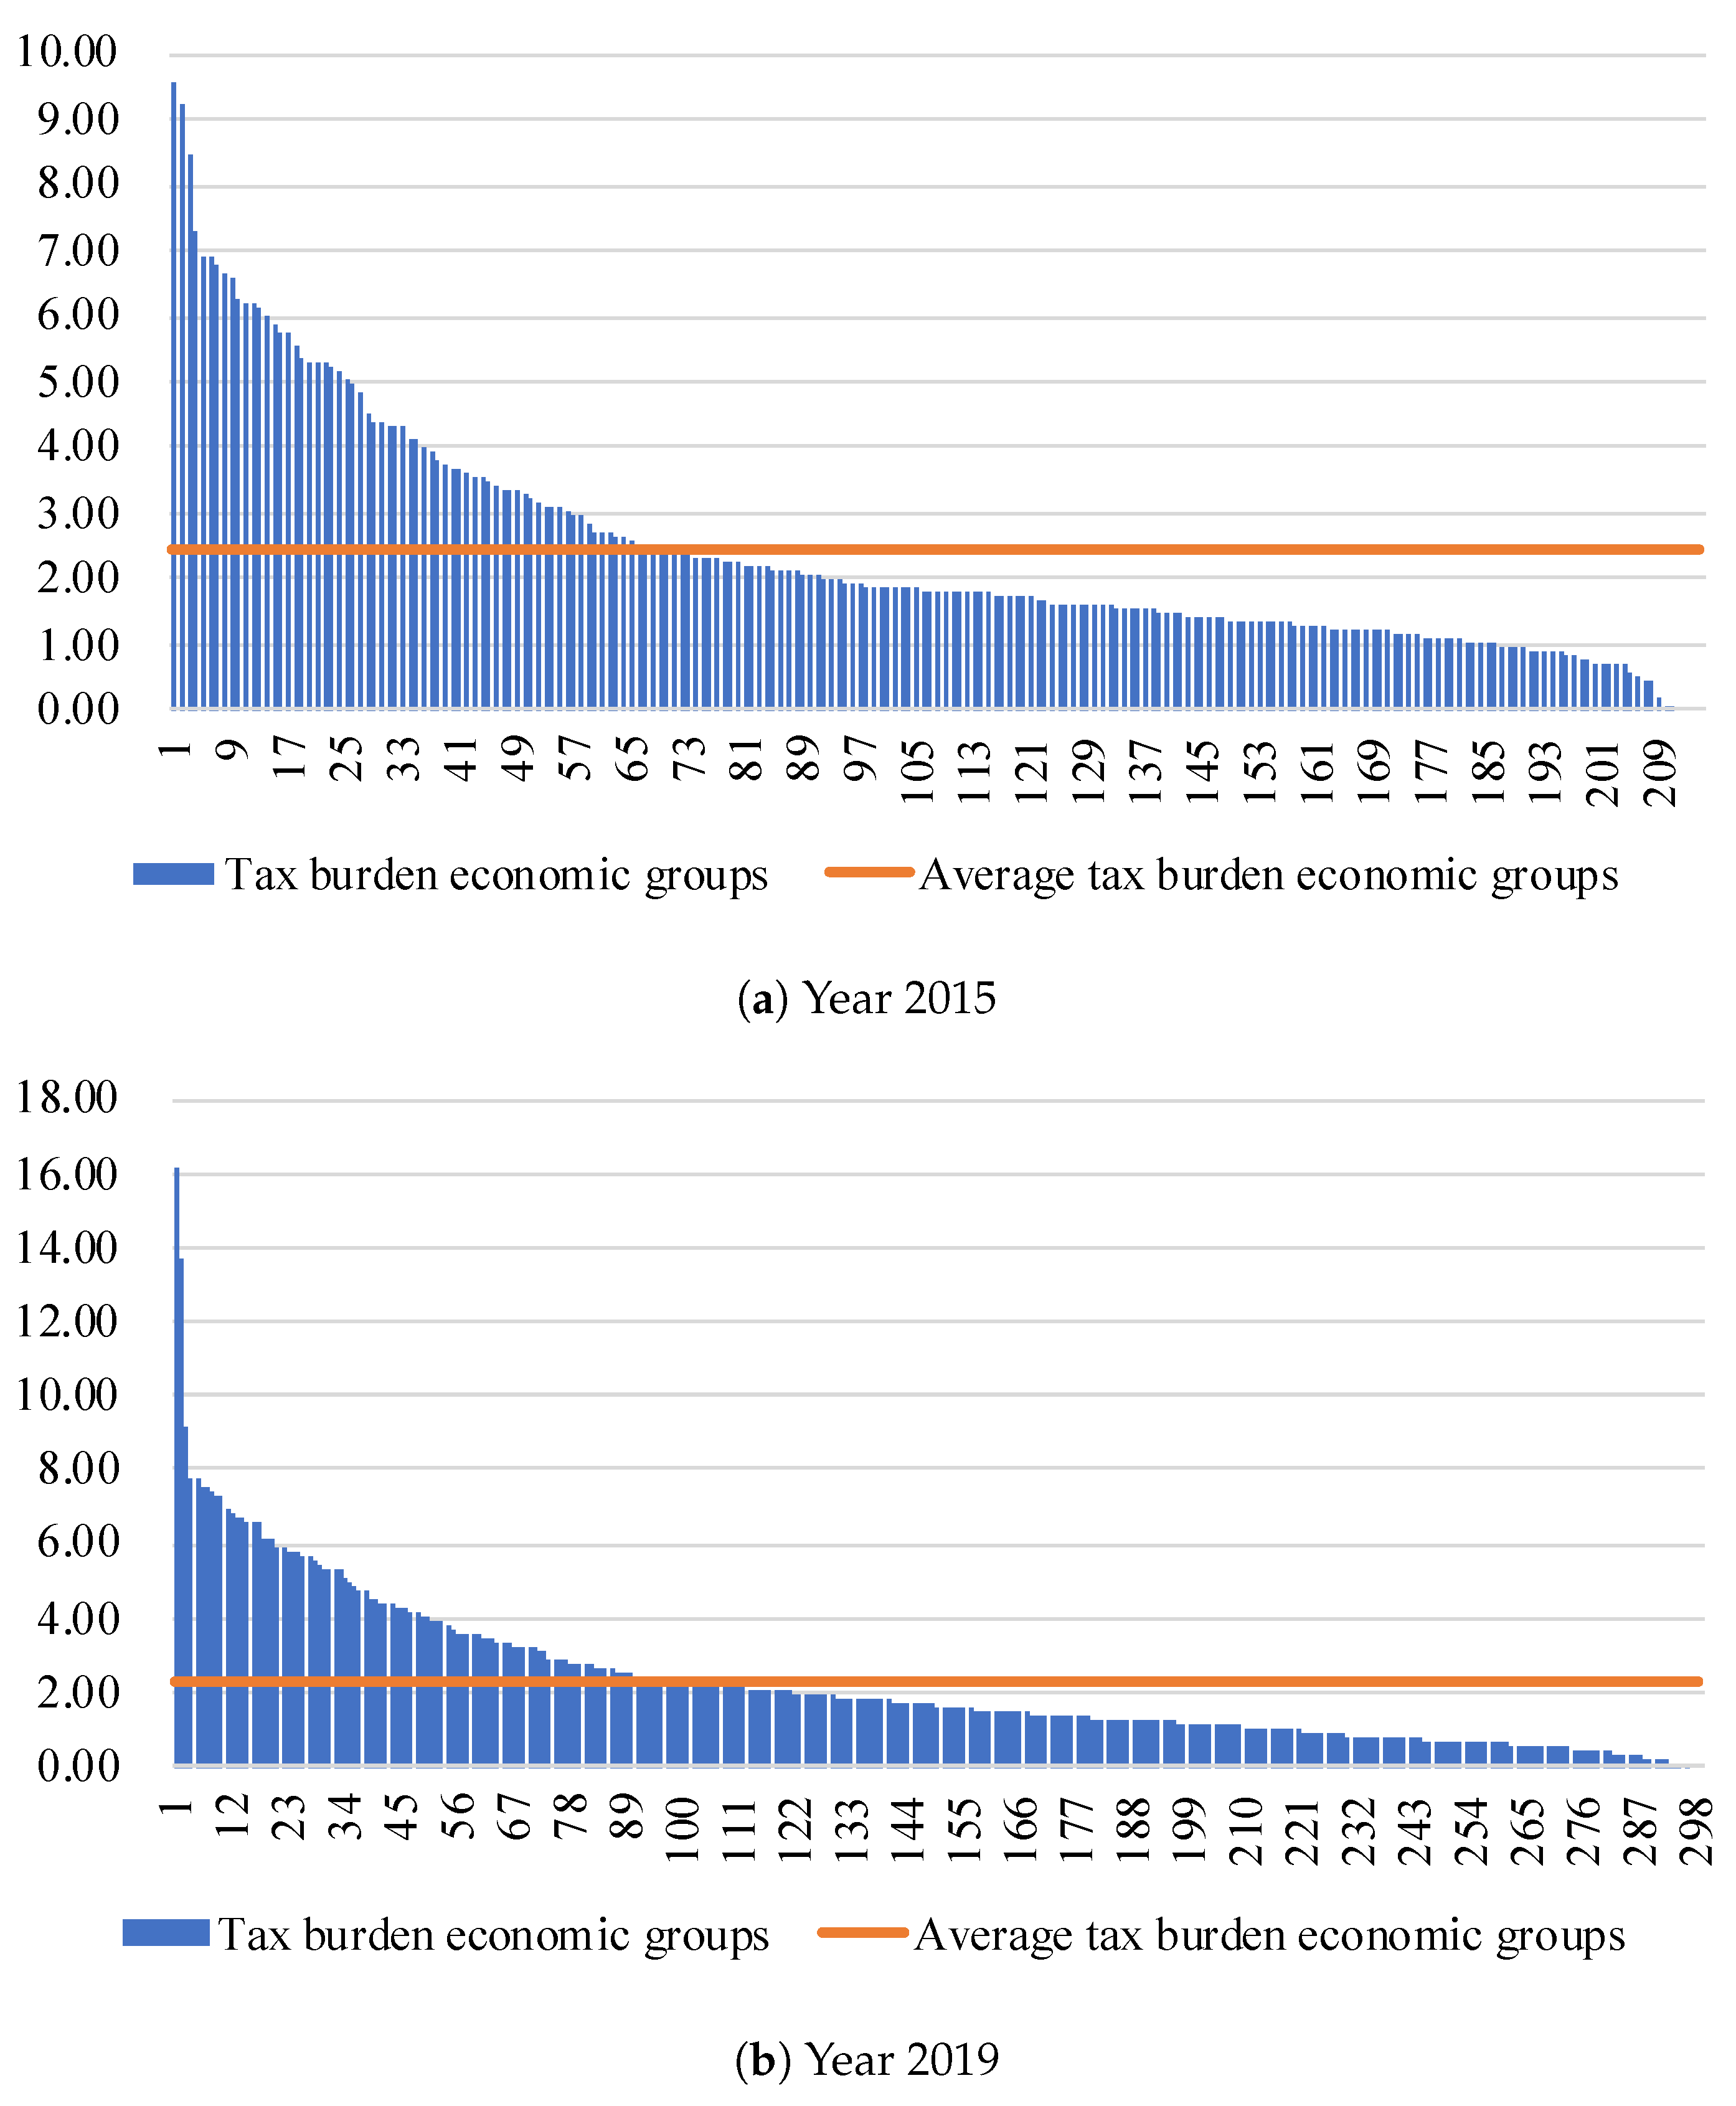
A descriptive analysis of the tax burden of the Ecuadorian economic groups to showcase the amount of paid taxes (considered as a proportion of the total income) in a specified period.
(d)
An analysis of the evolution of the top-10 Ecuadorian economic groups (according to their size and tax collection). This analysis explains the tax representativeness of the top 10 Ecuadorian economic groups vs. all the remaining economic groups and compared the outcome with the total national net tax collection. Moreover, the analysis of the Ecuadorian economic groups includes the contribution on the national net tax collection to verify if their representativeness have remained stable over time.
(e)
A correlation analysis between the financial variables of the Ecuadorian economic groups, and the total tax collection to prove the linear association between variables.

4. Results and Discussion

Figure 1 illustrates the evolution of the Ecuadorian economic groups from 2007 to 2020. Specifically, in the period of our analysis, we found an increase of 140.0% of the number of economic groups in Ecuador, raising from 125 (2015) to 300 (2020) economic groups. The provinces of Pichincha and Guayas concentrated an average of 79.3% of economic groups from 2015 to 2020, which denotes the poles of concentration in the provinces with the highest economic growth in Ecuador. The Andes region (provinces of Azuay, Imbabura, Loja, Pichincha, and Tungurahua) showed the highest agglutination of economic groups (on average 62.7%), while the economic groups located in the coastal provinces (Guayas and Manabí) represented an average of 37.2%. The province of Orellana in the Amazon region showed the presence of one economic group during the period of 2019–2020. Moreover, from 2015 to 2016, we found the most significant increase in the number of economic groups, growing from 125 to 200. Vanoni and Rodríguez (2017) explained the raise of 60.0% in the number of economic groups by the implementation of most efficient business strategies.
Figure 2 shows us the most important macroeconomic and fiscal variables from 2015 to 2019 (excluding 2017 given the absence of information on the data source). The total income of economic groups represented on average 63.0% of the gross domestic product (GDP) from 2015 to 2019. Likewise, the total national net tax collection, and the total tax collection of economic groups, implied on average 12.1%, and 5.9% of the Ecuadorian GDP, respectively. The total tax collection of economic groups represented on average the 48.5% of the total national net tax collection.
Table 3 displays the composition of the Ecuadorian economic groups using rankings from 2017 to 2020, as provided by the Servicio de Rentas Internas del Ecuador (2021). Note that in 2017, there were 215 Ecuadorian economic groups with 7126 members; which were integrated by 84.4% of national and foreign firms, and 15.6% from natural and foreign individuals. The economic groups increased by 39.5% during 2020, which means there were 300 economic groups, which were integrated by 9.121 members, represented by 7712 national and foreign firms (84.6% of members of economic groups) and 1409 natural and foreign individuals (15.4% of total members). Moreover, 433 and 453 members were located in tax havens during 2017 and 2020, respectively, while 307 and 393 members of economic groups were related to off-shore firms (i.e., Panama Papers records) in the same period. Tax havens are linked to the international financial system and globalization (Iturralde 2017). Tax havens are also associated with the expansion and concentration of economic groups, which increase their economic and political power by the evasion or elusion of taxes, moving their capitals to countries or cities with tax havens. The economic group Juan Eljuri is the most visible group associated with tax havens and offshore firms, which represented 9.9% and 10.7% of the total economic groups domiciled in tax havens and offshore firms, respectively (Servicio de Rentas Internas del Ecuador 2020). Furthermore, the number of members of economic groups related to financial institutions increased from 15 to 46 from 2017 to 2020, while there was an increase of 17.0% in the number of members associated with media entities. Navarro (2006) advocated that the media is a factual power, given that it provides stability to the government. This factual power has influence in economic power, political permanency, and social response. Therefore, he concluded that the media and financial institutions might be considered a new economic group.
Table 4 exhibits the evolution of the financial and fiscal variables of the Ecuadorian economic groups from 2015 to 2019. The income tax grew 27.5%; however, the total tax collection decreased in 4.3%, varying from USD 6.394 million (2015) to USD 6.121 million (2019). The total income, total assets, and total equity increased by 17.8%, 36.8%, and 37.0%, respectively. The effective tax rate, computed by the ratio between income tax and total income, was 2.3% in 2015 and 2.5% in 2019, meaning that for every USD 100 that the Ecuadorian economic groups earned, they paid around USD 2.3 and USD 2.5 in 2015 and 2019, respectively.
Table 5 and Figure 3 portray the tax burden of the Ecuadorian economic groups. The tax burden is calculated by the ratio between the income tax and the total income of each economic group. The tax burden showed a decrease of 5.1%, changing from 2.42 (2015) to 2.29 (2019). Its median value decreased by 10.5%, while its standard deviation value increased by 0.34 units, showing more dispersion and risk in the distribution of the tax burden during 2019 compared to 2015. The tax burden heavily depends on the productive activity, profit (depending on the economic sector), and the taxes according to the firm size and industry. Therefore, the tax burden does not necessarily show an increase in the profit of firms, but rather, it represents the productive stage of economic groups (Revista Líderes 2017). The highest tax burden in 2015 is 9.56 units represented by Grupo Degfer, while Nuevo Rancho Nuransa showed the highest tax burden in 2019 with 16.17 units.
Table 6 shows the top 10 Ecuadorian economic groups classified by their size. Six out of the ten largest economic groups have maintained their position in the top 10 when comparing 2016 to 2020. The total asset of the top ten economic groups in 2020 were USD 53.145 million, with a few financial institutions (Banco Pichincha, Banco de Guayaquil, Produbanco, and Banco Bolivariano CA) concentrating the 60.9% of the total assets of the top 10 ranking.
Table 7 presents the top 10 Ecuadorian economic groups classified by their tax collection using the ranking 2016–2020. Eight out of the ten economic groups have maintained their position in the top ten ranking, comparing 2016 to 2020. If we compare Table 6 and Table 7, we can notice that five economic groups were present in both rankings (classified by size and tax collection) during 2020. The total tax collection of the top 10 economic groups represented 43.8% and 44.7% of the total tax collection of the Ecuadorian economic groups for 2015 and 2019, respectively. What is more, the representativeness of the total tax collection of the top 10 economic groups over the total national net tax collection varied from 21.9% to 20.8% from 2015 to 2019. Ultimately, the total tax collection of economic groups represented at least half of the total national net tax collection.
Table 8 shows the principal financial variables of the ranking between 2016 and 2020 of the top 10 Ecuadorian economic groups classified by their size. Among our findings, it is worth mentioning that (i) the income contribution of the ten largest economic groups to the total income of all Ecuadorian groups was 25.5% and 22.4% in 2015 and 2019, respectively; (ii) the total assets grew by 35.5% and 36.8% for the top ten economic groups and total economic groups from 2015 to 2019, respectively; (iii) the total assets of the top ten economic groups represented 41.3% and 40.8% of the total assets of total economic groups during 2015 and 2019, respectively; and the total equity of the ten largest economic groups varied in 38.0%, increasing from USD 11.701 million in 2015 to USD 16.145 million in 2019. The increase represents 33.2% (2015) and 33.5% (2019) when compared to the total equity of the economic groups.
Lastly, Table 9 offers the linear correlation coefficients of the most important financial variables and the total tax collection. Total income, total assets, and total equity revealed a significant positive association at the 1% level with the total tax collection. The highest correlation coefficient is obtained between the total income and the total tax collection, showing coefficient values of 0.808, 0.784, 0.837, and 0.793 for 2015, 2016, 2018, and 2019, respectively. Most of the correlation values themselves were higher than 0.700, which means that the multicollinearity problem might arise in the regression analysis, given that the dependent variable is strongly associated with all independent variables, verifying one more time that the total tax collection directly depends on the total income, total assets, and total equity.

5. Conclusions

We have seen how a small cluster of family groups controls the economic power in Ecuador. Those clusters, also called economic groups, have influenced the Ecuadorian market and politics, in part due to their economic power, but also due to their financial, communicational, and political concentration. We have verified that the economic groups in Ecuador manage higher concentrations of wealth despite the implementation of government policies for transparency of the financial and economic information of economic groups. Our findings are aligned with previous research studies that showed a significant positive linear association between total tax collection, total income, total assets, and total equity during the period of 2015–2019. Furthermore, our analysis discloses that Ecuadorian economic groups tend to compete in oligopolistic markets, given that their economic and financial decisions are interconnected with their family firms or consortium groups. We have detected an exponential growth of the economic groups in Ecuador, in view of the fact that the number of economic groups take off from 17 groups in 2007 to 300 in 2020. Notwithstanding, we predict a stagnation of the economic groups during the post-COVID-19, mainly due to the contraction of 7.8% in the GDP that affects home and government consumption, investment, and exports. For future studies, we recommend conducting an analysis for economic groups, using the industry integration indexes. We would also like to suggest incorporating the labor market characteristics as a crucial variable for the development and analysis of economic policies. Similarly, we recommend focusing on the longitudinal analysis and financial trend indicators for the forthcoming Ecuadorian economic groups. On a final note, and since the period of study employed for this research is from 2015–2019, future researchers can analyze the impact of the concentration of economic power in Ecuador, as well as the impact of the number of economic groups in other countries.

Author Contributions

All authors contributed extensively to the work presented in this paper. Writing—original draft preparation, A.B.T.-P.; writing—review and editing, M.E.M.-C. All authors have read and agreed to the published version of the manuscript.

Funding

We extend our gratitude and acknowledgment to the Universidad de las Américas, which financially supported this research (2021).

Data Availability Statement

The datasets used and analyzed in this study are available from the corresponding author on justified request.

Conflicts of Interest

The authors declare no conflict of interest. The funders had no role in the design of the study; in the collection, analyses, or interpretation of data; in the writing of the manuscript, or in the decision to publish the results.

References

  1. Acosta, Alberto. 2006. Breve Historia Económica del Ecuador. Quito: Corporación Editora Nacional. [Google Scholar]
  2. Anaya, Eduardo. 1990. Los Grupos de Poder Económico: Un Análisis de la Oligarquía Financiera. Lima: Editorial Horizonte. [Google Scholar]
  3. Banco Central del Ecuador. 2021. Información Estadística Mensual. Available online: https://contenido.bce.fin.ec/home1/estadisticas/bolmensual/IEMensual.jsp (accessed on 12 August 2021).
  4. Cañas, R. 2015. Caracterización de los grupos económicos en el Ecuador. Investigación Económica 8: 76–114. [Google Scholar]
  5. Centro de Estudios y Difusión Social (CEDIS). 1986. Los Grupos Monopólicos en el Ecuador: Un Ensayo de Difusión Popular. Accra: Centro de Estudios y Difusión Social (CEDIS). Portada. [Google Scholar]
  6. Chavarín, Rubén. 2011. Los grupos económicos en México a partir de una tipología de arquitectura y gobierno corporativos, Una revisión de sus explicaciones teóricas. El Trimestre Económico 30: 193–234. [Google Scholar] [CrossRef]
  7. Constitución de la República del Ecuador. 2008. Available online: https://www.oas.org/juridico/pdfs/mesicic4_ecu_const.pdf (accessed on 12 August 2021).
  8. Cueva, Agustín. 1988. El proceso de dominación política en el Ecuador. Setagaya: Planeta. [Google Scholar]
  9. Dahse, Fernando. 1981. Mapa de la extrema riqueza. Los grupos económicos y el proceso de concentración de capitales. NS, NorthSouth 6: 99–103. [Google Scholar] [CrossRef]
  10. EKOS. 2012. Los colosos de la economía nacional. EKOS Negocios 215: 28–70. [Google Scholar]
  11. El Comercio. 2010. 28 Entidades que Quebraron por la Crisis de 1998 Fueron Cerradas. Available online: https://www.elcomercio.com/actualidad/28-entidades-quebraron-crisis-1998.html (accessed on 12 August 2021).
  12. Fierro, Luis. 1991. Los Grupos Financieros en el Ecuador. Bunkyō: Centro de Educación Popular, CEDEP. [Google Scholar]
  13. Fierro, Luis. 2019. Financial Groups in Ecuador—25 Years Later. Revista PUCE 108: 139–75. [Google Scholar]
  14. Frank, Robert H. 2005. Microeconomía y Conducta. Edited by Quinta Edi. New York: McGraw-Hill. [Google Scholar]
  15. Furió, Elies, and Matilde Alonso. 2008. Concentración económica: Algunas consideraciones sobre su naturaleza y medida. Boletín económico de ICE, Información Comercial Española 2947: 41–54. [Google Scholar]
  16. Garrido, Celso, and Wilson Peres. 1996. Grandes empresas y grupos industriales latinoamericanos. Revista CEPAL 66: 127–47. [Google Scholar] [CrossRef]
  17. Guriev, Sergei, and Andrei Rachinsky. 2005. The Role of Oligarchs in Russian Capitalism. Journal of Economic Perspectives 19: 131–50. [Google Scholar] [CrossRef] [Green Version]
  18. Iturralde, Pablo. 2017. Grupo Eljuri: Paraísos Fiscales y Corruptelas: Modelo Para (Des)armar. Available online: https://lalineadefuego.info/grupo-eljuri-paraisos-fiscales-y-corruptelas-modelo-para-desarmar-por-pablo-iturralde-ruiz/ (accessed on 12 August 2021).
  19. Khanna, Tarun, and Yishay Yafeh. 2007. Business Groups in Emerging Markets: Paragons or Parasites? Journal of Economic Literature 45: 331–72. [Google Scholar] [CrossRef] [Green Version]
  20. Lagos, Ricardo. 1960. La Concentración del Poder Económico. Ph.D. Thesis, Universidad de Chile, Santiago, Chile. [Google Scholar]
  21. Lazzarini, Sergio G., Gary J. Miller, and Todd R. Zenger. 2008. Dealing with the Paradox of Embeddedness: The Role of Contracts and Trust in Facilitating Movement Out of Committed Relationships. Organization Science 5: 709–28. [Google Scholar] [CrossRef] [Green Version]
  22. Leff, Nathaniel H. 1978. Industrial Organization and Entrepreneurship in the Developing Countries: The Economic Groups. Economic Development and Cultural Change 26: 661–75. [Google Scholar] [CrossRef]
  23. Ley Orgánica de Regulación y Control del Poder de Mercado. 2011. Available online: https://www.planificacion.gob.ec/ley-organica-de-regulacion-y-control-del-poder-de-mercado/ (accessed on 12 August 2021).
  24. Llosas, Hernán. 2005. El Pensamiento Corporativo en Italia. Ph.D. Thesis, Universidad Nacional de La Plata, La Plata, Argentina. [Google Scholar]
  25. Manosalve, Martín. 2015. Reseñas—Schneider, Ben Ross. Hierarchical Capitalism in Latin America. Business, Labor and the Challenges of Equitable Development. Economía-Reseñas 38: 231–33. [Google Scholar]
  26. Marchán, Carlos. 2017. Origenes del Ecuador Republicano; Arquitectura Institucional Malograda del Estado Nacional. Quito: Editorial IAEN. [Google Scholar]
  27. Minaya, Manuel. 2006. Concentración Industrial en el Sector Comercio al por Menor del Ecuador: Un Análisis a Nivel de Subramas, Período 2000–2005. Quito: Pontificia Universidad Católica del Ecuador. [Google Scholar]
  28. Misas, Gabriel. 1975. Contribución al estudio del grado de concentración en la industria colombiana—Gabriel Misas Arango—Google Books. Edited by Tiempo Presente. Santiago de Chile: Inst. Latinoamericano de Investigaciones Sociales (ILDIS). [Google Scholar]
  29. Navarro, Guillermo. 1975. La Concentración de Capitales en el Ecuador. Quito: Universidad Central del Ecuador—Escuela de Sociología Editorial Universitaria. [Google Scholar]
  30. Navarro, Guillermo. 2006. Los Poderes Fácticos Poder Económico, Poder políTico y Poder Factico. Quito: Ediciones Zitra. [Google Scholar]
  31. Pástor, Carlos. 2015. Los Grupos Económicos en el Ecuador. pp. 1–82. Available online: https://repositorio.uasb.edu.ec/handle/10644/5529 (accessed on 15 July 2021).
  32. Peralta, Pablo Ospina. 2015. Protesta social, crisis económica y escenario político Ecuador. In Análisis de Coyuntura. Quito: Centro Ecuménico de Proyectos. [Google Scholar]
  33. Revista Líderes. 2017. 215 Grupos Económicos Tiene el País; 25 se Sumaron en este año. Available online: https://www.revistalideres.ec/lideres/informe-grupos-economicos-ecuador-sri.html (accessed on 15 July 2021).
  34. Robinson, E .A. G. 1957. La Dimensión óptima de la Empresa. Buenos Aires: El Ateneo. [Google Scholar]
  35. Schneider, Ben Ross. 2013. Hierarchical Capitalism: Business, Labor, and the Challenge of Equitable Development in Latin America. Cambridge: Cambridge University Press. [Google Scholar]
  36. Servicio de Rentas Internas del Ecuador. 2015. Reglamento Para la Aplicación de la Ley de Régimen Tributario Interno, LORTI. Quito: Servicio de Rentas Internas del Ecuador. [Google Scholar]
  37. Servicio de Rentas Internas del Ecuador. 2020. Catastro de Grupos Económicos 2020. Quito: Servicio de Rentas Internas del Ecuador. [Google Scholar]
  38. Servicio de Rentas Internas del Ecuador. 2021. Ranking of Ecuadorian Firms. Quito: Servicio de Rentas Internas del Ecuador. [Google Scholar]
  39. Silva, Julio. 1977. Los Verdaderos dueños del país: Oligarquía y Monopolios en Colombia—Julio Silva Colmenares—Google Books. Fondo Editorial Suramérica. Available online: https://www.worldcat.org/title/verdaderos-duenos-del-pais-oligarquia-y-monopolios-en-colombia/oclc/679746155 (accessed on 15 July 2021).
  40. Solano, Santiago, and Luis Tobar. 2017. Caracterización de los grupos económicos en Ecuador según el Servicio de Rentas Internas al año 2015. Observatorio Economía Latinoamericana 20. Available online: https://www.researchgate.net/publication/333659229CARACTERIZACIONDELOSGRUPOSECONOMICOSENECUADORSEGUNELSERVICIODERENTASINTERNASSRIALANO2015 (accessed on 15 July 2021).
  41. Strachan, Harry W. 1976. Family and Other Business Groups in Economic Development: The Case of Nicaragua. Westport: Praeger. [Google Scholar]
  42. Tobar, Luis, and Santiago Solano. 2017. La concentración financiero y los grupos de poder: Evidencias en la ciudad de Cuenca—Ecuador. Revista Internacional Administración y Finanzas 10: 81–90. [Google Scholar]
  43. Tulcanaza, Ana Belén. 2010. Concentración del Poder Económico en el Sector Comercio en Ecuador, período 2002–2008. Available online: http://repositorio.puce.edu.ec/handle/22000/742 (accessed on 15 July 2021).
  44. Tulcanaza-Prieto, A. 2018. Grupos Económicos Ecuatorianos: Una Mirada hacia su Comportamiento 2015–2016. Estado y Comunes—Instituto de Altos Estudios Nacionales (IAEN) 7: 181–200. [Google Scholar] [CrossRef] [Green Version]
  45. Tulcanaza-Prieto, A., and Younghwan Lee. 2018. Factors Associated with the Financial Performance of Commercial Firms in Ecuador. Global Business Administration Review 15: 1–26. [Google Scholar] [CrossRef]
  46. Tulcanaza-Prieto, Ana Belén, and Manuel Morocho-Cayamcela. 2018. Elasticity of the total production measured by the investment in information and communication technologies: Evidence from the ecuadorian manufacturing companies. X-Pedientes Económicos 2: 6–27. [Google Scholar]
  47. Tulcanaza-Prieto, Ana Belen, HoKyun Shin, Younghwan Lee, and Chang Won Lee. 2020. Relationship among CSR Initiatives and Financial and Non-Financial Corporate Performance in the Ecuadorian Banking Environment. Sustainability 12: 1621. [Google Scholar] [CrossRef] [Green Version]
  48. Unda, M., and E. Bethania. 2010. Burguesía ciudadana, nueva hegemonía, nueva alianza de clases. Revista R 69: 19–31. [Google Scholar] [CrossRef]
  49. Vanoni, Giuseppe, and Carlos Rodríguez. 2017. Estrategias de crecimiento implementadas por los grupos económicos del Ecuador (2007–2016). Revista Innovar Journal 27: 39–55. [Google Scholar] [CrossRef]
  50. Vito, Francesco. 1935. L’essenza Dell’economia Corporativa. Milano: Economía corporativa. [Google Scholar]
  51. Wilches, Giovanna, and Carlos Rodríguez. 2016. El proceso evolutivo de los conglomerados o grupos económicos en Colombia. Innovar 26: 11–34. [Google Scholar] [CrossRef]
Figure 1. Evolution of the Ecuadorian Economic Groups. Source: Own elaboration based on the data collected from Servicio de Rentas Internas del Ecuador (2020).
Economies 09 00188 g001
Figure 2. Evolution of macroeconomic and fiscal variables (measured in USD millions). Note: Information from 2017 was not available on the data source. Source: Own elaboration based on the data obtained from Servicio de Rentas Internas del Ecuador (2020) and Banco Central del Ecuador (2021).
Economies 09 00188 g002
Figure 3. Tax burden of Ecuadorian economic groups related to the income tax from the years (a) 2015, and (b) 2019. Source: Own elaboration based on Servicio de Rentas Internas del Ecuador (2020).
Economies 09 00188 g003
Table 1. Market structure according to the number of suppliers and demanders.
Number of DemandersNumber of Suppliers
OneFewMany
OneBilateral monopolyPartial monopsonyMonopsony
FewPartial monopolyBilateral oligopolyOligopsony
ManyPure monopolyOligopolyPerfect competition
Source: Own elaboration based on the information obtained from Frank (2005).
Table 2. Financial and fiscal variables of the study.
VariablesFormula / Description
Total AssetsLiabilities + Total Equity
Total EquityTotal Assets − Liabilities
Total IncomeRevenue − Cost of goods sold
Income Tax(Taxable base a − returns − discounts − costs − all deductions) * 25%
Tax Burden(Income Tax/Total Income) * 100
Total National Net Tax Collection     Total Tax Collection - credit notes − compensations − returns
Total Tax CollectionSum of all Ecuadorian taxes b
Note: a composed by ordinary and extraordinary taxed income, b includes: (1) income tax collected, (2) value added tax, (3) tax on special consumption, (4) environmental promotion tax, (5) motor vehicle tax, (6) currency outflow tax, (7) abroad assets tax, (8) RISE, (9) royalties, patents, and mining conservation profits, (10) contribution for comprehensive cancer care, (11) one-time and temporary contribution, (12) interest for tax delay, (13) tax fines, and (14) other income. Source: Own elaboration based on Servicio de Rentas Internas del Ecuador (2020).
Table 3. Composition of Ecuadorian economic groups.
Detail  Ranking 2017     Ranking 2020   
Number of economic groups215300
Number of members of the economic group71269121
Number of members domiciled in tax havens433453
Number of members as offshore firms (Panama Papers) a307393
Number of members related with financial institutions1546
Number of members related with media entities4755
Note: a Panama Papers are related to members of economic groups which have been identified in the records of Panama Papers, website: https://panamapapers.icij.org Source: Own elaboration based on the information provided by the Servicio de Rentas Internas del Ecuador (2020).
Table 4. Financial and fiscal variables of Ecuadorian economic groups (in USD millions).
Detail20152019Variation
Income Tax1389177238227.5%
Total Tax Collection63946121−273−4.3%
Total Income60,90371,74410,84117.8%
Total Assets95,214130,26235,04836.8%
Total DebtN.A.12341234
Total Equity35,20648,21613,00937.0%
Note: Total debt is not reported for 2015 (N.A.). Source: Own elaboration based on Servicio de Rentas Internas del Ecuador (2020).
Table 5. Descriptive statistics of tax burden of Ecuadorian economic groups.
YearAverage Tax BurdenMedianStandard DeviationMaximum
20152.421.831.789.56
20192.291.642.1116.17
Source: Own elaboration based on the data from Servicio de Rentas Internas del Ecuador (2020).
Table 6. Top 10 Ecuadorian economic groups per year, classification according to their size.
Rk. 2020Rk. 2019Rk. 2017Rk. 2016Variation 2016–2020Economic Group
11110Banco Pichincha
22320Almacenes Juan Eljuri
33441Corporación Favorita
44251Schlumberger del Ecuador
57783Banco de Guayaquil
66671Produbanco
7553−4OCP Ecuador
8810113Holdingdine Corporación Industrial y Comercial
9911101Corporación El Rosado
101012122Banco Bolivariano C.A.
111286−5Claro
171799−8Industria Pronaca
Note: Ranking of 2018, which contains information of 2017, was not available on the SRI webpage. Source: Own elaboration based on Servicio de Rentas Internas del Ecuador (2020).
Table 7. Top 10 Ecuadorian economic groups per year, classification according to tax collection.
Ranking 2020Ranking 2019Ranking 2017Ranking 2016Variation 2016–2020Economic Group2015201620182019
11110Banco Pichincha664,261,405498,739,821607,395,054667,872,343
22220Dinadec350,974,788352,100,364390,791,027427,107,715
33341Produbanco264,294,993222,306,816274,261,174299,941,296
45784Banco de Guayaquil191,614,215175,517,131222,582,890234,359,513
56672Banco Bolivariano C.A.197,354,449180,440,219206,430,145209,149,340
6753−3Claro315,489,121185,073,552186,042,898190,495,917
74992Almacenes Juan Eljuri183,909,249157,333,985229,738,403190,328,750
88 −8Banco Internacional185,639,529182,165,876
99 −9Arca Ecuador183,298,823168,714,088
101010100Citibank N. A., Ecuador179,366,431144,775,146179,592,586166,635,702
455Itabsa239,723,714205,429,092
866Schlumberger dl Ecuador210,851,012157,866,766
(a) Total Tax Collection, Top 10 Economic Groups2,797,839,3782,279,582,8922,665,772,5292,736,770,540
(b) Total Tax Collection, Economic Groups6,393,835,7445,499,929,7646,256,788,5236,120,831,840
(c) Total National Net Tax Collection12,755,076,18111,309,307,28212,809,502,10713,180,846,182
(a)/(b)43.8%41.4%42.6%44.7%
(a)/(c)21.9%20.2%20.8%20.8%
(b)/(c)50.1%48.6%48.8%46.4%
Note: Ranking of 2018, which contains information of 2017, was not available on the SRI webpage. Source: Own elaboration based on Servicio de Rentas Internas del Ecuador (2020).
Table 8. Financial variables, top 10 Ecuadorian economic groups per year, classification according to their size (in USD millions).
Economic GroupTotal IncomeTotal AssetsTotal Equity
201520162018201920152016201820192015201620182019
Banco Pichincha205521022387272713,20314,48416,58017,8922658260134773681
Almacenes Juan Eljuri189418133106274042944575650664181244128720351947
Corporación Favorita269725082880291921322245286733441567169021542315
Schlumberger del Ecuador129720271724183431374537396836171546196623972306
Banco de Guayaquil4844675256023840419045705334644670727792
Produbanco3423575336093905432449355337617623539571
OCP Ecuador187716612013157937203749377132121593145520041455
Holdingdine 10199651030 212521852325 169318892031
Corporación El Rosado1591 160516571635 16551838520 454477
Banco Bolivariano C.A. 289342 35653828 523571
Claro15421447 19691968 521555
Industria Pronaca17541655 14691523 791845
(a) Total Top 1015,53315,05716,02716,03939,30443,72050,60353,14511,70113,38616,19916,145
(b) Total Economic Groups60,90357,99471,45571,74495,214102,044122,032130,26235,20636,47946,52548,216
(a)/(b)25.5%26.0%22.4%22.4%41.3%42.8%41.5%40.8%33.2%36.7%34.8%33.5%
Note: Ranking of 2018, which contains information of 2017, was not available on the SRI webpage. Source: Own elaboration based on Servicio de Rentas Internas del Ecuador (2020).
Table 9. Pearson correlation coefficients, Ecuadorian economic groups.
Financial Variables vs. Total Tax Collection            2015201620182019
Total Income0.808 ***0.784 ***0.837 ***0.793 ***
Total Assets0.537 ***0.544 ***0.736 ***0.698 ***
Total Equity0.677 ***0.716 ***0.802 ***0.772 ***
Note: Information of 2017 was not available in the SRI webpage, *** indicates statistical significance at the 1% level. Source: Own elaboration based on Servicio de Rentas Internas del Ecuador (2020).
Publisher’s Note: MDPI stays neutral with regard to jurisdictional claims in published maps and institutional affiliations.

