
Mapping the Moderating Role of Logistics Performance of Logistics Infrastructure on Economic Growth in Developing Countries


Abstract
:1. Introduction
2. Model, Data and Methodology
Variable Description and Data Sources
- 1
- Real Gross Domestic Product (Yit)
- 2
- Real Capital Stock (Kit)
- 3
- Employed Labor Force (Lit)
- 4
- Logistics Performance (LPIit)
3. Results and Discussion
3.1. Descriptive Statistics
3.2. Panel Data Analysis
3.3. Empirical Results
4. Conclusions and Policy Recommendations
Author Contributions
Funding
Institutional Review Board Statement
Informed Consent Statement
Data Availability Statement
Conflicts of Interest
References
- Akbar, Minhas, and Akbar Ahsan. 2015. An empirical analysis of foreign direct investment in Pakistan. Studies in Business and Economics 10: 5–15. [Google Scholar] [CrossRef] [Green Version]
- Arimah, Ben. 2017. Infrastructure as a Catalyst for the Prosperity of African Cities. Procedia Engineering 198: 245–66. [Google Scholar] [CrossRef]
- Arvis, Jean-François, Monica Alina Mustra, Lauri Ojala, Ben Shepherd, and Daniel Saslavsky. 2010. Connecting to Compete—Trade Logistics in the Global Economy. Washington, DC: World Bank. [Google Scholar]
- Arvis, Jean-François, Daniel Saslavsky, Lauri Ojala, Ben Shepherd, Christina Busch, Anasuya Raj, and Tapio Naula. 2016. Connecting to Compete: Trade Logistics in the Global Economy. Washington, DC: World Bank, pp. 1–76. [Google Scholar]
- Aschauer, David Alan. 1989. Is public expenditure productive? Journal of Monetary Economics 23: 177–200. [Google Scholar] [CrossRef]
- Banister, David, and Yossi Berechman. 2001. Transport investment and the promotion of economic growth. Journal of Transport Geography 9: 209–18. [Google Scholar] [CrossRef]
- Batool, Irem, and Kathrin Goldmann. 2020. The role of public and private transport infrastructure capital in economic growth. Evidence from Pakistan. Research in Transportation Economics. Available online: https://doi.org/10.1016/j.retrec.2020.100886 (accessed on 9 October 2021).
- Candemir, Yücel, and Dilay Çelebi. 2017. An inquiry into the analysis of the Transport & Logistics Sectors’ Role in Economic Development. Transportation Research Procedia 25: 4692–707. [Google Scholar]
- Chu, Zhang. 2012. Logistics and economic growth: A panel data approach. The Annals of Regional Science 49: 87–102. [Google Scholar] [CrossRef]
- D’Aleo, Vittorio, and Bruno S. Sergi. 2017. Does logistics influence economic growth? The European experience. Management Decision 55: 1613–28. [Google Scholar] [CrossRef]
- Deng, Taotao. 2013. Impacts of Transport Infrastructure on Productivity and Economic Growth: Recent Advances and Research Challenges. Transport Reviews 33: 686–99. [Google Scholar] [CrossRef]
- Feenstra, Robert C., Robert Inklaar, and Marcel P. Timmer. 2015. The Next Generation of the Penn World Table. American Economic Review 105: 3150–82. [Google Scholar] [CrossRef] [Green Version]
- Fugate, Brian S., John T. Mentzer, and Theodore P. Stank. 2010. Logistics Performance: Efficiency, Effectiveness, and Differentiation. Journal of Business Logistics 31: 43–62. [Google Scholar] [CrossRef]
- Gani, Azmat. 2017. The Logistics Performance Effect in International Trade. The Asian Journal of Shipping and Logistics 33: 279–88. [Google Scholar] [CrossRef]
- Hesse, Markus, and Jean-Paul Rodrigue. 2006. Global production networks and the role of logistics and transportation. Growth and Change 37: 499–509. [Google Scholar] [CrossRef]
- Hong, Junjie, Zhaofang Chu, and Qiang Wang. 2011. Transport infrastructure and regional economic growth: Evidence from China. Transportation 38: 737–52. [Google Scholar] [CrossRef]
- Lean, Hooi, Wei Huang, and Junjie Hong. 2014. Logistics and economic development: Experience from China. Transport Policy 32: 96–104. [Google Scholar] [CrossRef]
- Hussain, Ammar, Irem Batool, Minhas Akbar, and Marina Nazir. 2021. Is ICT an enduring driver of economic growth? Evidence from South Asian economies. Telecommunications Policy 45: 102202. [Google Scholar] [CrossRef]
- Ilhéu, Fernanda, and Gonçalo Simões. 2017. Is the Logistics Sector in China Still a Constraint to Supplying Its Domestic Market? Working Paper Series: CEsA CSG 162/2017. Available online: https://www.repository.utl.pt/bitstream/10400.5/14493/1/wp162.pdf (accessed on 9 October 2021).
- Kalim, Rukhsana, Noman Arshed, and Sadaf Shaheen. 2019. Does competitiveness moderate inclusive growth: A panel study of low-income countries. Competitiveness Review: An International Business Journal 29: 119–38. [Google Scholar] [CrossRef]
- Khadim, Zunaira, Irem Batool, and Muhammad Bilal Lodhi. 2021. China–Pakistan Economic Corridor, Logistics Developments and Economic Growth in Pakistan. Logistics 5: 35. [Google Scholar] [CrossRef]
- Kodongo, Odongo, and Kalu Ojah. 2016. Does infrastructure really explain economic growth in Sub-Saharan Africa? Review of Development Finance 6: 105–25. [Google Scholar] [CrossRef]
- Lan, Shulin, Chen Yang, and George Q. Huang. 2017. Data analysis for metropolitan economic and logistics development. Advanced Engineering Informatics 32: 66–76. [Google Scholar] [CrossRef]
- Levin, Andrew, Chien-Fu Lin, and Chia-Shang James Chu. 2002. Unit root tests in panel data: Asymptotic and finite-sample properties. Journal of Econometrics 108: 1–24. [Google Scholar] [CrossRef]
- Li, Kevin X., Mengjie Jin, Guanqiu Qi, and Adolf K. Y. Ng. 2018. Logistics as a driving force for development under the Belt and Road Initia tive–the Chinese model for developing countries. Transport Reviews 38: 457–78. [Google Scholar]
- Mahpula, Abduwali, DeGang Yang, Alishir Kurban, and Frank Witlox. 2013. An overview of 20 years of Chinese logistics research using a content-based analysis. Journal of Transport Geography 31: 30–34. [Google Scholar] [CrossRef] [Green Version]
- Martí, Luisa, Rosa Puertas, and Leandro García. 2014. The importance of the Logistics Performance Index in international trade. Applied Economics 46: 2982–92. [Google Scholar]
- Nazir, Marina, Minhas Akbar, Irem Batool, and Ammar Hussain. 2019. Is Tourism an Accelerator of Economic Growth? An Evidence from South Asian Region. SSRN. Available online: https://papers.ssrn.com/sol3/papers.cfm?abstract_id=3894334 (accessed on 15 September 2020).
- Perkins, Peter, Johann Fedderke, and John Luiz. 2005. An Analysis of Economic Infrastructure Investment in South Africa. South African Journal of Economics 73: 211–28. [Google Scholar] [CrossRef] [Green Version]
- Pradhan, Rudra P., Neville R. Norman, Yuosre Badir, and Bele Samadhan. 2013. Transport Infrastructure, Foreign Direct Investment and Economic Growth Interactions in India: The ARDL Bounds Testing Approach. Procedia-Social and Behavioral Sciences 104: 914–21. [Google Scholar] [CrossRef] [Green Version]
- Saidi, Samir, Muhammad Shahbaz, and Pervaiz Akhtar. 2018. The long-run relationships between transport energy consumption, transport infrastructure, and economic growth in MENA countries. Transportation Research Part A: Policy and Practice 111: 78–95. [Google Scholar] [CrossRef]
- Tang, Chor Foon, and Salah Abosedra. 2019. Logistics performance, exports, and growth: Evidence from Asian economies. Research in Transportation Economics 78: 100743. [Google Scholar] [CrossRef]
- Vutha, Hing, and Larry Strange. 2013. Leveraging Trade for Economic Growth in Cambodia. Working Paper Series by CDRI. T & S printing: Cambodia. Available online: http://cdri.org.kh/storage/pdf/wp81e_1617793442.pdf (accessed on 9 October 2021).
- Wang, Eric C. 2002. Public infrastructure and economic growth: A new approach applied to East Asian economies. Journal of Policy Modeling 24: 411–35. [Google Scholar] [CrossRef]
- Xu, Xinxing, and Yuhong Wang. 2017. Study on spatial spillover effects of logistics industry development for economic growth in the Yangtze River delta city cluster based on spatial durbin model. International Journal of Environmental Research and Public Health 14: 1508. [Google Scholar] [CrossRef] [Green Version]


| Components | Description |
|---|---|
| CUSit (Customs) | Speed, simplicity and predictability of CUSTOM formalities of panel data |
| INFit (Trade and Transport Infrastructure) | Ports, railroads, roads, information technology of panel data |
| SHIPit (Priced Shipment) | The ease of arranging competitively priced shipments |
| QOLit (Logistics Services) | The competence and quality of logistics services (e.g., transport operators, customs brokers) of panel data |
| TTit (Track and Trace) | The ability to track and trace consignments of panel data |
| EDTit (Expected Delivery Time) | The frequency with which shipments reach consignees within scheduled or expected delivery time of panel data |
| Variable | Description |
|---|---|
| Yit | Real GDP of country ‘i’ at time ‘t’ |
| Kit | Real capital stock of country ’i’ at time ‘t’ |
| Lit | Number of employed persons of country ‘i’ at time ‘t’ |
| LPIit | LPI index of country ‘i’ at time ‘t’ |
| Variables | Yit | Kit | Lit | LPIit | ||||
|---|---|---|---|---|---|---|---|---|
| High Performer LPI | Low Performer LPI | High Performer LPI | Low Performer LPI | High Performer LPI | Low Performer LPI | High Performer LPI | Low Performer LPI | |
| Average | 3.40 | 0.21 | 12.39 | 0.94 | 167 | 13.01 | 3.14 | 2.55 |
| Maximum | 19.84 | 2.96 | 76.68 | 16.78 | 799 | 127.06 | 3.78 | 3.34 |
| Minimum | 0.06 | 0.001 | 0.15 | 0.005 | 1.26 | 0.14 | 2.37 | 1.72 |
| Std. Dev. | 5.05 | 0.41 | 17.8 | 2.28 | 263 | 21.65 | 0.31 | 0.28 |
| Skewness | 2.08 | 3.86 | 2.10 | 4.38 | 1.58 | 3.09 | −0.35 | −0.04 |
| Kurtosis | 6.34 | 21.14 | 6.91 | 24.16 | 3.89 | 13.43 | 2.85 | 2.81 |
| Variable Description | LPI Performance Level | Model Specification | Levin, Lin and Chut * Test Value at Level | PP Fisher Chi Square | Decision |
|---|---|---|---|---|---|
| Ln Yit | High Performer LPI | Constant | −2.11804 *** | 52.1407 ** | I(0) |
| Low Performer LPI | Constant | −3.26145 *** | 201.898 *** | I(0) | |
| Ln Kit | High Performer LPI | Constant | −10.0344 *** | 110.961 *** | I(0) |
| Low Performer LPI | Constant | −5.84648 *** | 242.704 *** | I(0) | |
| Ln Lit | High Performer LPI | Constant | −8.25271 *** | 65.1819 *** | I(0) |
| Low Performer LPI | Constant | −10.6591 *** | 149.638 *** | I(0) | |
| Ln LPIit | High Performer LPI | Constant | −8.00306 *** | 52.8056 *** | I(0) |
| Low Performer LPI | Constant | −13.0586 *** | 170.597 *** | I(0) |
| Dependent Variable: LnYit | |||
|---|---|---|---|
| Variables | Developing Countries | High Performer LPI Countries | Low Performer LPI Countries |
| C | 2.68 *** 8.38 | 2.86 *** 5.89 | 2.33 *** 7.51 |
| LnKit | 0.62 *** 19.31 | 0.67 *** 16.07 | 0.66 *** 22.9 |
| LnLit | 0.49 *** 7.46 | 0.23 *** 3.18 | 0.37 *** 8.58 |
| R2 | 0.9989 | 0.9370 | 0.8901 |
| Adj-R2 | 0.9987 | 0.9346 | 0.8892 |
| F-Statistic | 4719.065 | 379.802 | 984.924 |
| Prob (F-statistic) | 0.00 | 0.00 | 0.00 |
| Cross Sections Included: | 50 | 09 | 41 |
| Total Panel (Balanced) Observations: | 300 | 54 | 246 |
| Dependent Variable: LnYit | |||
|---|---|---|---|
| Variables | Coefficients | ||
| Developing Economies | High Performer LPI | Low Performer LPI | |
| Constant | 2.67 *** 8.19 | 2.93 *** 5.79 | 2.71 *** 6.86 |
| LnKit | 0.62 *** 18.55 | 0.66 *** 14.36 | 0.61 *** 15.17 |
| LnLit | 0.49 *** 7.41 | 0.23 *** 3.04 | 0.52 *** 6.90 |
| LnLPIit | −0.01 −0.23 | 0.07 0.57 | −0.01 −0.16 |
| R-Square | 0.99 | 0.94 | 0.99 |
| Adjusted R-squared | 0.99 | 0.94 | 0.99 |
| F-Statistic | 4611.09 | 245.43 | 2724.57 |
| Prob (F-statistic) | 0.00 | 0.00 | 0.00 |
| Cross Sections Included: | 50 | 09 | 41 |
| Total Panel (Balanced) Observations: | 300 | 54 | 246 |
| Dependent Variable: LnYit | |||
|---|---|---|---|
| Variables | Coefficients | ||
| Developing Economies | High Performer LPI | Low Performer LPI | |
| Constant | 4.32 *** 14.25 | 3.76 *** 8.50 | 4.55 *** 12.90 |
| Ln(K*LPI)it | 0.42 *** 15.01 | 0.55 *** 14.11 | 0.39 *** 12.25 |
| LnLit | 0.73 *** 10.64 | 0.29 *** 3.84 | 0.79 *** 10.60 |
| R-Square | 0.9986 | 0.9217 | 0.9977 |
| Adjusted R-squared | 0.9983 | 0.9186 | 0.9973 |
| F-Statistic | 3596.05 | 300.45 | 2180.27 |
| Prob (F-statistic) | 0.00 | 0.00 | 0.00 |
| Cross Sections Included: | 50 | 09 | 41 |
| Total Panel (Balanced) Observations: | 300 | 54 | 246 |
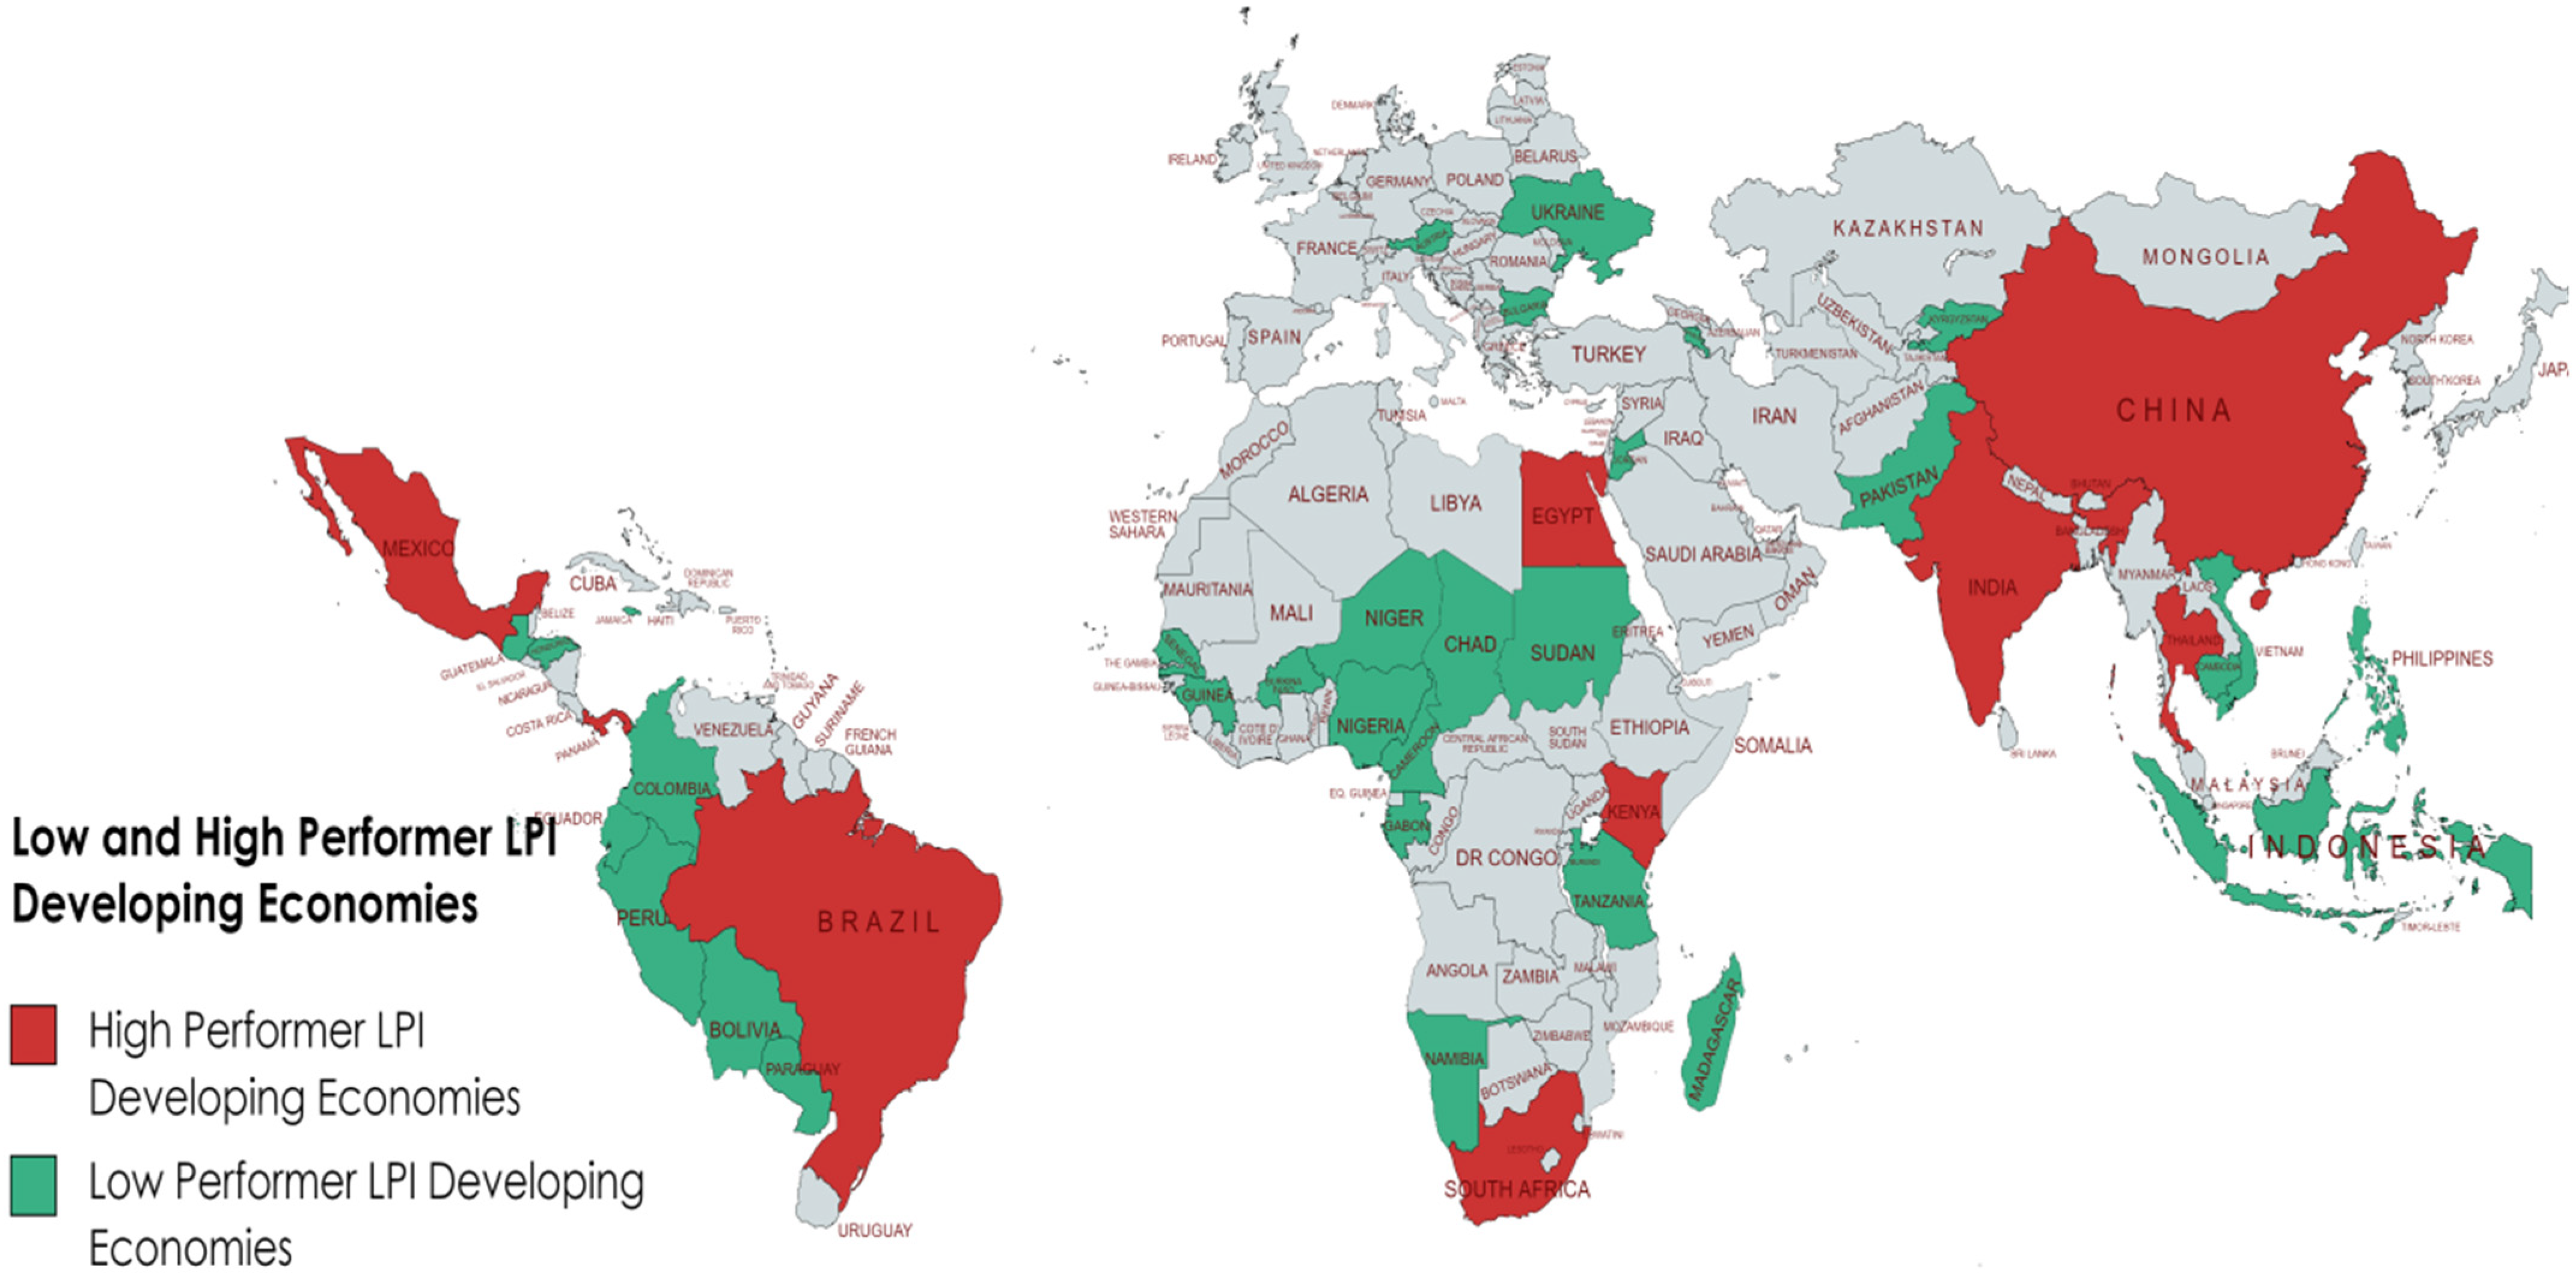
| Sr. No. | Name of the Country | Region | Sr. No. | Name of the Country | Region |
|---|---|---|---|---|---|
| High Performer LPI Developing Countries | 16 | Honduras | North America | ||
| 1 | South Africa | Africa | 17 | Indonesia | Asia |
| 2 | China | Asia | 18 | Jamaica | North America |
| 3 | India | Asia | 19 | Jordan | Asia |
| 4 | Panama | North America | 20 | Kyrgyz republic | Asia |
| 5 | Kenya | Africa | 21 | Madagascar | Africa |
| 6 | Thailand | Asia | 22 | Namibia | Africa |
| 7 | Egypt Arab rep. | Africa | 23 | Nepal | Asia |
| 8 | Mexico | North America | 24 | Niger | Africa |
| 9 | Brazil | South America | 25 | Nigeria | Africa |
| Low Performer LPI Developing Countries | 26 | Pakistan | Asia | ||
| 1 | Armenia | Asia | 27 | Paraguay | South America |
| 2 | Benin | Africa | 28 | Philippines | Asia |
| 3 | Bhutan | Asia | 29 | Rwanda | Africa |
| 4 | Bolivia | South America | 30 | Senegal | Africa |
| 5 | Burkina Faso | Africa | 31 | Sudan | Africa |
| 6 | Cambodia | Asia | 32 | Tanzania | Africa |
| 7 | Cameroon | Africa | 33 | Togo | Africa |
| 8 | Chad | Africa | 34 | Ukraine | Europe |
| 9 | Comoros | Africa | 35 | Vietnam | Asia |
| 10 | Ecuador | South America | 36 | Algeria | Africa |
| 11 | El Salvador | North America | 37 | Bulgaria | Europe |
| 12 | Guatemala | North America | 38 | Colombia | South America |
| 13 | Guinea | Africa | 39 | Lebanon | Asia |
| 14 | Guinea-Bissau | Africa | 40 | Peru | South America |
| 15 | Haiti | North America | 41 | Gabon | Africa |
Publisher’s Note: MDPI stays neutral with regard to jurisdictional claims in published maps and institutional affiliations. |
© 2021 by the authors. Licensee MDPI, Basel, Switzerland. This article is an open access article distributed under the terms and conditions of the Creative Commons Attribution (CC BY) license (https://creativecommons.org/licenses/by/4.0/).
Share and Cite
Khadim, Z.; Batool, I.; Akbar, A.; Poulova, P.; Akbar, M. Mapping the Moderating Role of Logistics Performance of Logistics Infrastructure on Economic Growth in Developing Countries. Economies 2021, 9, 177. https://doi.org/10.3390/economies9040177
Khadim Z, Batool I, Akbar A, Poulova P, Akbar M. Mapping the Moderating Role of Logistics Performance of Logistics Infrastructure on Economic Growth in Developing Countries. Economies. 2021; 9(4):177. https://doi.org/10.3390/economies9040177
Chicago/Turabian StyleKhadim, Zunaira, Irem Batool, Ahsan Akbar, Petra Poulova, and Minahs Akbar. 2021. "Mapping the Moderating Role of Logistics Performance of Logistics Infrastructure on Economic Growth in Developing Countries" Economies 9, no. 4: 177. https://doi.org/10.3390/economies9040177
APA StyleKhadim, Z., Batool, I., Akbar, A., Poulova, P., & Akbar, M. (2021). Mapping the Moderating Role of Logistics Performance of Logistics Infrastructure on Economic Growth in Developing Countries. Economies, 9(4), 177. https://doi.org/10.3390/economies9040177