1. Introduction
Ratings are widely used for the assessment of credit rating during the placement of financial assets. Accordingly, institutions, companies, and even countries are evaluated for their creditworthiness. Long-term ratings of companies are used by investors as objective information about the risks affecting their funds provided to firms. Credit risk is a problem for the banking sector, due to legal requirements, as well as the financial and economic environment variability. Furthermore, the entities that provide financing to companies must worry about their financial health; thus, it is in their interest to correctly assess the risk involved in their aggregated position with a particular firm. Credit rating agencies provide this information for the most important companies, as they estimate a rating associated with the default probability of complying with their financial obligations. The extension of securitization bonds makes this task more difficult; hence, a clear vision of each firm situation is necessary. If Moody’s ratings are believed to be stricter than the rates awarded by other agencies, a model to replicate these ratings awarded to firms could be useful for assessing the rates published by the main agencies, as well as for obtaining equivalent information for nonrated companies. A model to estimate ratings in the retail and industrial sectors is proposed, as the abundance of statistical information permits the estimation of these ratings without having to aggregate them in a subset of categories, as was the norm in several previous publications.
In the financial world, the credit rating of companies is completed worldwide by just a few agencies, which have elaborated models to obtain a final evaluation which is presented as an ordinal variable depending, theoretically, to the probability of defaulting its financial obligations. As the rating’s methodology is only partially disclosed, there is no possibility of externally assessing the correctness of the rating attributed to a particular company. This could be of interest to the company rated, which may want to confirm or disagree with the assigned rating by an agency; alternatively, this information could be used by investors who would like to have a ‘second opinion’ of the creditworthiness of a particular firm, without having to rely exclusively on the agencies. In these cases, the ability to estimate the rating that should be attributed to a company or to confirm a published rating would have to rely on an external analysis. In this paper, an easy-to-implement procedure is presented, relying only on public financial data from companies in the industrial and retail sectors.
Moody’s Ratings is, along with Standard and Poor’s and Fitch, one of the top three credit rating agencies (CRAs), all established in America and Europe. Moody’s bases their ratings on various factors, such as the kind of debt that a company holds and how sensitive it is to systemic changes, such as interest rates, as stated in Investopedia (
Moody’s Investors Service 2018). This agency has provided, for more than a century, short- and long-term rates for the country’s risk, credit, companies, bond issues, and other financial products. With respect to company ratings, several thousand firms have been evaluated using a historical database to analyze default probabilities. Ratings are considered, by the CRAs, mere opinions related to financial health or operational strength, and they are not intended to be predictors of possible benefits or losses. Long-term rates are divided into two main categories, investment and noninvestment grades, using a letter scale. Investment grades start (according to Moody’s scale) at ‘
Aaa’, which is related to the highest credit quality and, consequently, the lowest expectation of default risk; such a rating reflects an exceptionally strong capacity of a company to fulfil their financial commitments, with no foreseen future events that could alter this situation. The ‘
Aa’ rating is linked to a very high credit quality and low default risk. This is followed by the ‘
A’ level, associated with a high credit quality and low possibility of default, but also susceptibility to changes in the business environment. Lastly, the ‘
Baa’ level is associated with medium risk. The junk-grade level starts with ‘
Ba’ and ‘
B’, associated with a high risk of default, followed by ‘
Caa’ and ‘
Ca’, associated with the highest risks; lastly, level ‘
C’ is associated with firms in default, that is, those with a presence of credit events of failure to pay interest or principal of a loan or security when due, whereby the debtor is unable to meet the legal obligation of debt repayment. The information provided by these values is ordinal and not directly associated with probabilities of default. More troubling is that the risk increase linked to a notch downgrade is not constant along the scale; furthermore, these variations are not comparable, and they cannot be quantified.
Figure 1 depicts the long-term rating scale used by Moody’s, along with the definitions of each grade.
Moody’s opinions are related to credit risk; however, as stated by the rating agency,
‘they are not intended to be a guide for investors’, although, in practice, their main interest is precisely in guiding (or justifying) investment decisions. Historically, their primary role was established in an attempt to fight against the information asymmetry in financial markets; the rating of a borrower publicizes its creditworthiness using a theoretically independent judgment, thereby facilitating their access to funding. Potential investors typically do not have access to the internal information of firms; thus, they can only rely on the assessments made by agencies. Many regulators base, at least in part, their administrative decisions on these published ratings, which are included in many regulatory requirements and financial contracts (
Ligeti and Szörfi 2016).
A downturn in credit ratings is usually associated with deteriorating finances, such as an increase in debt levels; this can be associated with the possible fact that a firm may not be able to service its debt as per schedule or may even be at risk of going bankrupt. This additional function can be viewed as an outside consultation, warning a firm about its difficulties and prompting corrective actions.
In the last few years, credit rating agencies tend to make available part of their methodology used in obtaining their results. Within rating agencies, Moody’s seems, apparently, more transparent about the process of rating companies. Rates are based on its KMV
1 model (
Baltaev and Chavdarov 2014), which, for estimating a company’s
Probability of Default (PD) or, in Moody’s terminology, the
Expected Default Frequency (EDF)2, uses three main sets of information: the value of the assets, their riskiness, and the amount of leverage protecting these, estimating the volatility of the assets and the so called ‘distance to default’, base for evaluating the probability of default.
In the evaluation of companies published ratings, one has to take into account that there is an additional asymmetry in the results, due to the fact that credit rating agencies main income is originated by contracts with the companies that are supposed to be rated. Firms are free to choose the rating agency, so there is a possible incentive to assign higher rates than those due in an objective assessment. A higher credit rating favors companies who are relying on markets for obtaining finance, originating an easier access and lower costs: thus, when a firm chooses a credit agency, rating inflation may be viewed as a plus: a potential conflict of interest is evident. On the other hand, long-term rates have an inertia in remaining at their present level, and the CRA’s methodology and administrative process, contribute to it. Additionally, downgrading a firm can have and additional effect in its creditworthiness as a ‘self-fulfilling prophecy’, adding an additional internal resistance by the agencies. These deviations of objectivity produce very risky situations: when the US company Enron defaulted in 2002, it had investment grade rating awarded by the three main agencies, which reacted when it was too late. Later on, several additional failures, and mostly when the global financial crisis of 2008 started, more than half of the risk products associated with these events had the maximum investment grade.
Kim (
2005) follows the same approach when developing a model to predict bond ratings using financial variables introducing, in addition, non-financial variables. Such a model is based on an artificial intelligence technique that is non-parametric and designed to capture a dynamic relationship between input and output variables, his results show quite accuracy in bond rating assessments and distinguishes successfully the investment grade bonds from the speculative ones.
The opinion shopping of firms when choosing a CRA or an auditor has been treated in the literature;
Newton et al. (
2016) try to measure this phenomenon, and its occurrence, particularly in competitive audit markets.
Chen et al. (
2016) detect an increase in favorable audit opinions after switching auditors, while
Lu (
2006) finds that neither the predecessor nor the successor consultant are affected by these changes.
It was during the financial crisis, in the period 2007–2009, when the credit turmoil has sparked a plethora of allegations that the rating agencies have failed to produce credible and timely analyses of financial products, such as bonds or derivatives and mostly the well-known subprime securities, partly because their interests have been closely entwined with the firms arranging and issuing such financial products. What came after, as usually said, is history. Causing a loss of credibility to the rating agencies, in the following years US and Europe investors, legislators and politicians were very critical about the role played by Moody’s, Fitch, and Standard & Poor’s, what resulted in a deep review of financial control systems and the increase in security measures and requirements to financial institutions when granting loans to individuals and companies.
In the next section the main contributions to the forecasting models for ratings are reviewed.
Section 3 describes the methodology, the data and sample used in the modeling process. Additionally, then, in the following section, the model is specified and tested. Finally, the main conclusions are addressed, and future developments and therefore lines of work, proposed.
2. An Overview of Rating Forecasting Literature
The possibility of estimating ratings directly from data in the balance sheet of companies, was envisaged by
Merton (
1974) in his seminal model based on the careful analysis of these accounts: equity can be considered as it is a call option upon the firm’s assets; so if the assets are greater than the liabilities, the global situation can be assessed pricing this option, and, therefore, evaluating the level of risk associated with corporate debt.
Since then, academics, researchers, and private banking and investment firms have developed a vast amount of literature on modeling default rates, however,
Fons (
1991) made the first attempts to develop a statistical model to predict issuer-based aggregate default rates; he found that nearly 52% of the variability in past default rates is related to only two factors, credit quality and the state of the economy. Based on Fons’ framework,
Helwege and Kleiman (
1996), established a method where their model was able to explain the annual fluctuation in default rates with an adjusted R-squared of 81%. Upon later publication,
Jonsson and Fridson (
1996), proposed a set of default rate forecasting models able to explain more than 86% of the variation in Moody’s rates (annual speculative-grade default rates) and Moody’s introduces models for forecasting default rates and predictive models for Moody’s monthly speculative-grade and all corporate for lags of 12-month in default rates, ‘which predict default rates up to 12 months out on a rolling basis’ (
Moody’s Investors Service 2018). However, as stated by
Kamstra et al. (
2001), different statistical models can yield different ratings forecast and there is no particular rule for which model is better.
Cimpoeru (
2011) uses neural networks in credit risk assessment.
Belás et al. (
2018) analyze the impact of exogenous factors in the credit risk using structural analysis modeling. Thus, they use several forecasting methods to predict bond ratings in the transportation and industrial sectors listed by Moody’s bond rating service, concluding that a variant of the ordered-logit regression-combining method yields statistically significant and quantitatively meaningful improvements over its competitors. All the previous models assumed non-Markovian behavior and industry heterogeneity, nevertheless,
Boguslauskas et al. (
2011) use multivariate methodologies to classify risks.
Frydman and Schuermann (
2008), showed evidence that in credit rating dynamics it is convenient that the rating process is time homogeneous in Markov’s sense; in doing so and based on empirical evidence, they present also an approach based on mixture model using Markov chains that assumes there are two subpopulations of firms, each moving according to its own Markov chain. In this line of work,
Xing et al. (
2012) also modeled credit transition matrix under Markov processes but with unobserved structural breaks and
Petropoulos et al. (
2016) propose a credit rating method for corporation, using student’s-t hidden Markovian stochastic processes (SHMMs)
3 under this approach, the authors use a selected set of financial ratios to perform credit scoring modeling them via SHMMs, whereas
Figlewski et al. (
2012), focus on the reduced form models
4 and using the semi-parametric Cox regression model (adapted from survival analysis), which allows the hazard rate for a given issuer to be a function of both firm-specific factors and macroeconomic conditions, the authors estimate extended reduced-form models for the occurrence of credit events. Some alternatives are proposed by
Sun et al. (
2015), based on branch and bound and other multivariate statistical techniques using imbalanced data in credit risk evaluation. On the other hand,
Huang (
2011) argues that the subprime mortgage crisis and its effects across the global markets and financial system had a deep impact in the banking sector which caused a lack of faith in credit rating forecasting methods of rating agencies. For that reason, and with the aim of improving the accuracy of the credit scoring, the author introduces the idea of a new Gaussian process-based kernel classifier for credit rating predictions.
Ulucan and Atici (
2013) study alternative classifications based on multi-criteria decision methods. In this sense,
Kang and Ausloos (
2017) assess the corporate governance and capital structure of Chinese listed companies according the credit risk ratings from relevant agencies.
Cardoso et al. (
2013) propose a simpler method based on a regression model to estimate probabilities of default, which replicates those used by the rating agencies and is based on financial statements. They conclude that the model was able to predict ratings within three notches of accuracy for about 90% of the cases. An alternative to this approach is the use of financial ratios to forecast the PD, based on statistical past information. RiskCalc©, provided by Moody’s Investors Service to estimate default frequencies on an interval from one to five years, uses a probit model, (
Falkenstein et al. 2000); however, the use of different predictive variables in the KMV models cited above means that not much attention was paid when finding and selecting the most important exogenous variables. In this sense,
Yeh et al. (
2012) propose a hybrid model, which combines random trees and rough set theory to extract useful information for credit rating, using market-based information as the predictive variable.
A third method, used here, is linked to obtain direct forecasts of awarded rates, using statistical or econometric models based on public data available from companies in a similar way to the proposal of
Doumpos et al. (
2015), which is based on a multi-criteria classification approach, combining accounting data with a structural default prediction model in order to obtain improved predictions and test the incremental information obtained from the structural model. The difficulties in obtaining enough statistical information can be overcome using well known databases, such as Bloomberg’s, which provide balance sheet details of most rated companies, including ratings awarded by the three main agencies. Of course, this modeling considers that the published rates are consistent with the real probability of default, so that the models involved can be used to forecast novel ratings when balance-sheet data are available for a non-rated company. In most previous works, ratings are predicted on an aggregate scale (prime, not-prime, or in three to five classes). Here, it is the full range of rates that are forecasted, and using non-linear data-based methods, such as neural networks. However, more difficult is to measure the probability of defaulting for small enterprises, where financial data are insufficient or even not very reliable, thus,
Chi and Zhang (
2017) propose a multi-criteria credit rating model for this kind of companies using a nonparametric method based on qualitative and quantitative criteria.
3. Methodology
The agencies methodology is not public, although the CRA’s provide partial information about their procedures. Moody’s is more informative for this purpose, (
Caridad y López del Río et al. 2020), and the main factors influencing the final rating is based on each firm balance sheet variables or financial ratios derived from the latter, plus some ‘qualitative’ information.
Engvall (
2015) proposes a set of parameters previously used by different authors; these variables include profitability data, leverage ratios, liquidity measures, interest coverage ratios, company size parameters, and, even,
Altman and Rijken (
2004) Z-scores. Within the profitability ratios, the most usual are ‘return on assets’ (ROA), used by
Kaplan and Urwitz (
1979);
Ohlson (
1980) employs some additional variables, such as returns ‘on capital’, ‘on equity’, ‘on invested capital’, EBITDA margin, ‘gross margin’, ‘incremental operating margin’, ‘net income to common margin’, ‘operating margin’;
Gray et al. (
2006) use some of the later; ‘profit margin’ as can be found in
Resti (
2002) or in
Amdouni and Soumaré (
2014). In the category of leverage ratios, several can be used, as ‘common equity to total assets’, ‘long term debt to equity or to capital’,
Kaplan and Urwitz (
1979), ‘long term debt to total assets’,
Gray et al. (
2006), ‘total debt to capital’, ‘to equity’, ‘to total assets’,
Resti (
2002), ‘to EBITDA’,
Amdouni and Soumaré (
2014), or ‘to EBIT’,
Gray et al. (
2006). In some cases, net debt is used in place of total debt. Liquidity ratios are used by several authors: ‘cash ratio’,
Resti (
2002) ‘current ratio’, ‘CFO to debt ratio’ or ‘to short term debt ratio’.
Interest coverage ratios are less frequent: ‘EBITDA to interest expense’ or ‘to cash interest paid’,
Gray et al. (
2006); in some cases, EBIT or EVITDA-CapEx are taken into account. Size magnitudes are quite common: EBITDA, Resti 2002, EBIT, EBITDA-CapEx, total assets,
Ohlson (
1980), total equity or debt. In
Engvall (
2015), a summary of variables employed in the literature is presented. Risks are associated with the possibility of financial losses, but they can be originated by different factors,
Caridad y Ocerin et al. (
2014) although in this approach, only public account’s data are included in the models.
Moody’s Investors Services (2017) include a set of eleven metrics using EBITA over average assets, or interest expenses or the operating margin, or the FFO over debt or debt over EBITA and several others as can be seen in
Table 1. In its publications, Moody’s state that they can be modified by non-public data, entering, thus, in the grey zone of the so-called ‘qualitative’ analyses. When using these magnitudes over the firms, a clear trend can be observed.
Additionally, the average cumulative default rates are higher for firms with lower credits rates. It can be observed in
Figure 2, in fact, more than a half of the ‘
C’ rated companies entered default after a decade, white ‘
Aaa’ firms were almost free of financial problems, even after longer periods.
Some multivariate analysis methods used to estimate rates produce less accurate classifications; for example, discriminant analysis leads to only 20.7% of correct forecasted ratings; but only 16.7% when using jack-knife methods to exclude one case at the time, as trial set. Multivariate logit models (or similar models) are in the same range. Although non-linear methods, such as artificial neural networks, provide much better results, if a sufficiently large sample is used to train the model, as will be shown in the next sections.
With data and figures from 2017, 91 of Moody’s rated corporate issuers defaulted. That represents a significant improvement over 2015 and 2016 when the global defaults numbered over 100 being the first year since 2014 that global defaults numbered fewer than 100. By volume, about USD 78 billion of debt went into default in 2017, which was comprised of USD 52 billion in bonds and USD 26 billion in loans. In comparison, the default volume was USD 136 billion in 2016, consisting of USD 93 billion in bonds and USD 43 billion in loans (
Moody’s Investors Service 2018). Most of the corporate defaults occurred in North America 61 defaults out of 91 (which means 67%). Europe had 21 (which represents 23%) while the rest were in Asia-Pacific (6), Latin America (2), and the Middle East (1). In terms of dollar volume, USD 39 billion, or half of defaulted debt, was from North America, followed by Latin America and Europe, which had defaulted debt of USD 21 billion (27%) and USD 16 billion (20%), respectively. The 2017 defaults were mainly due to distressed exchanges and bankruptcies, each accounting for 40% of the defaults. The rest was linked to payment defaults, as can be seen in
Figure 3.
According to this, in
Table 2, it can be seen the sectors with the highest rates of default, which are
Forest Products and Papers with 9% of default rate and
Retail sector with 7%.
Our proposal falls in that context of high default rates for retail and industrial companies and given that the CRA’s methodology is not totally public.
4. Data
The main objective proposed is to elaborate models that can reproduce Moody’s long-term ratings using publicly available data. For this, a sample has been obtained using a random selection in Bloomberg corporate database, extracting the balance sheet and profit statements of 1182 cases in both sectors (industrial and retailing), corresponding to 227 companies, where 827 cases had no missing data for all classification variables. Their balance-sheet data are available for a five-year period. Forecasted values of the rating (long term) were considered for the last year. As expected, the more frequent ratings are located in the investment grade middle range.
Table 3 shows the rating distribution of companies in the sample, of a total of 827 companies, 627 (78%) belongs to the industrial sector and the remaining 200 (22%) are retailing firms. For the companies within the industrial sector, 440 companies are rated between ‘
A2’ and ‘
Ba1’, and this also happens in the retailing sector, with 132 companies out of 200. The distribution of ratings in both sectors are quite similar, and, thus, using data from these two groups allows a larger sample, without having to consider a dummy classification variable.
Some classes include a small number of companies. This is natural, as most industrial firms are rated in the ranges between ‘Aa3’ and ‘Caa1’. There is just a small number top rated or in the lower ‘Caa’ classes; the mortality in the later is quite high. This state of affairs is characteristic of the whole population of companies, and the sample reflects this fact.
The variables obtained for a five year period are the following: EBITDA (X1), EBIT (X2), net margin (X3), interest cover (X4), debt over equity plus debt (X5), net financial debt over EBITDA (X6), financial autonomy (X7), financial debt over operational cash flow (X8), cash flow (X9), total debt (X10), dividend paid (X11), and market value (X12). Some of these variables are used in previous studies, as shown in the literature review section. Additionally, Moody’s ratings (Y) are available for all cases in the sample and the sector where each company is included. IBM’s SPSS software is used for the statistical treatment and modeling. The first discriminant function is based on market value, dividends, and cash flow; the second is more related to EBIDTA and to the net margin. However, they cannot achieve reasonable forecasts of the final ratings, although, when considering a weighting method taking into account the sample size in each group, the correct forecasts are 26.4% and 23.0% (using jack-knife procedure).
Each if the X variables, by itself, has no forecasting power on the Moody’s rating. A multivariate non-linear approach is, thus, necessary.
5. Results and Discussion: A Model for Moody’s Corporate Industrial and Retailing Ratings
The industrial and retailing sectors are main actors in the financial markets. The large rating agencies provide assessment of their respective creditworthiness as a firm and of their debt instruments and transactions. Several authors have developed models aimed at forecasting ratings attributed by CRA’s; Moody’s propose one of such models (Moody’s Investor Service 2006). Additionally,
Du (
2003), includes the prediction of rating changes using multi-period logit models.
Yakymova and Kuz (
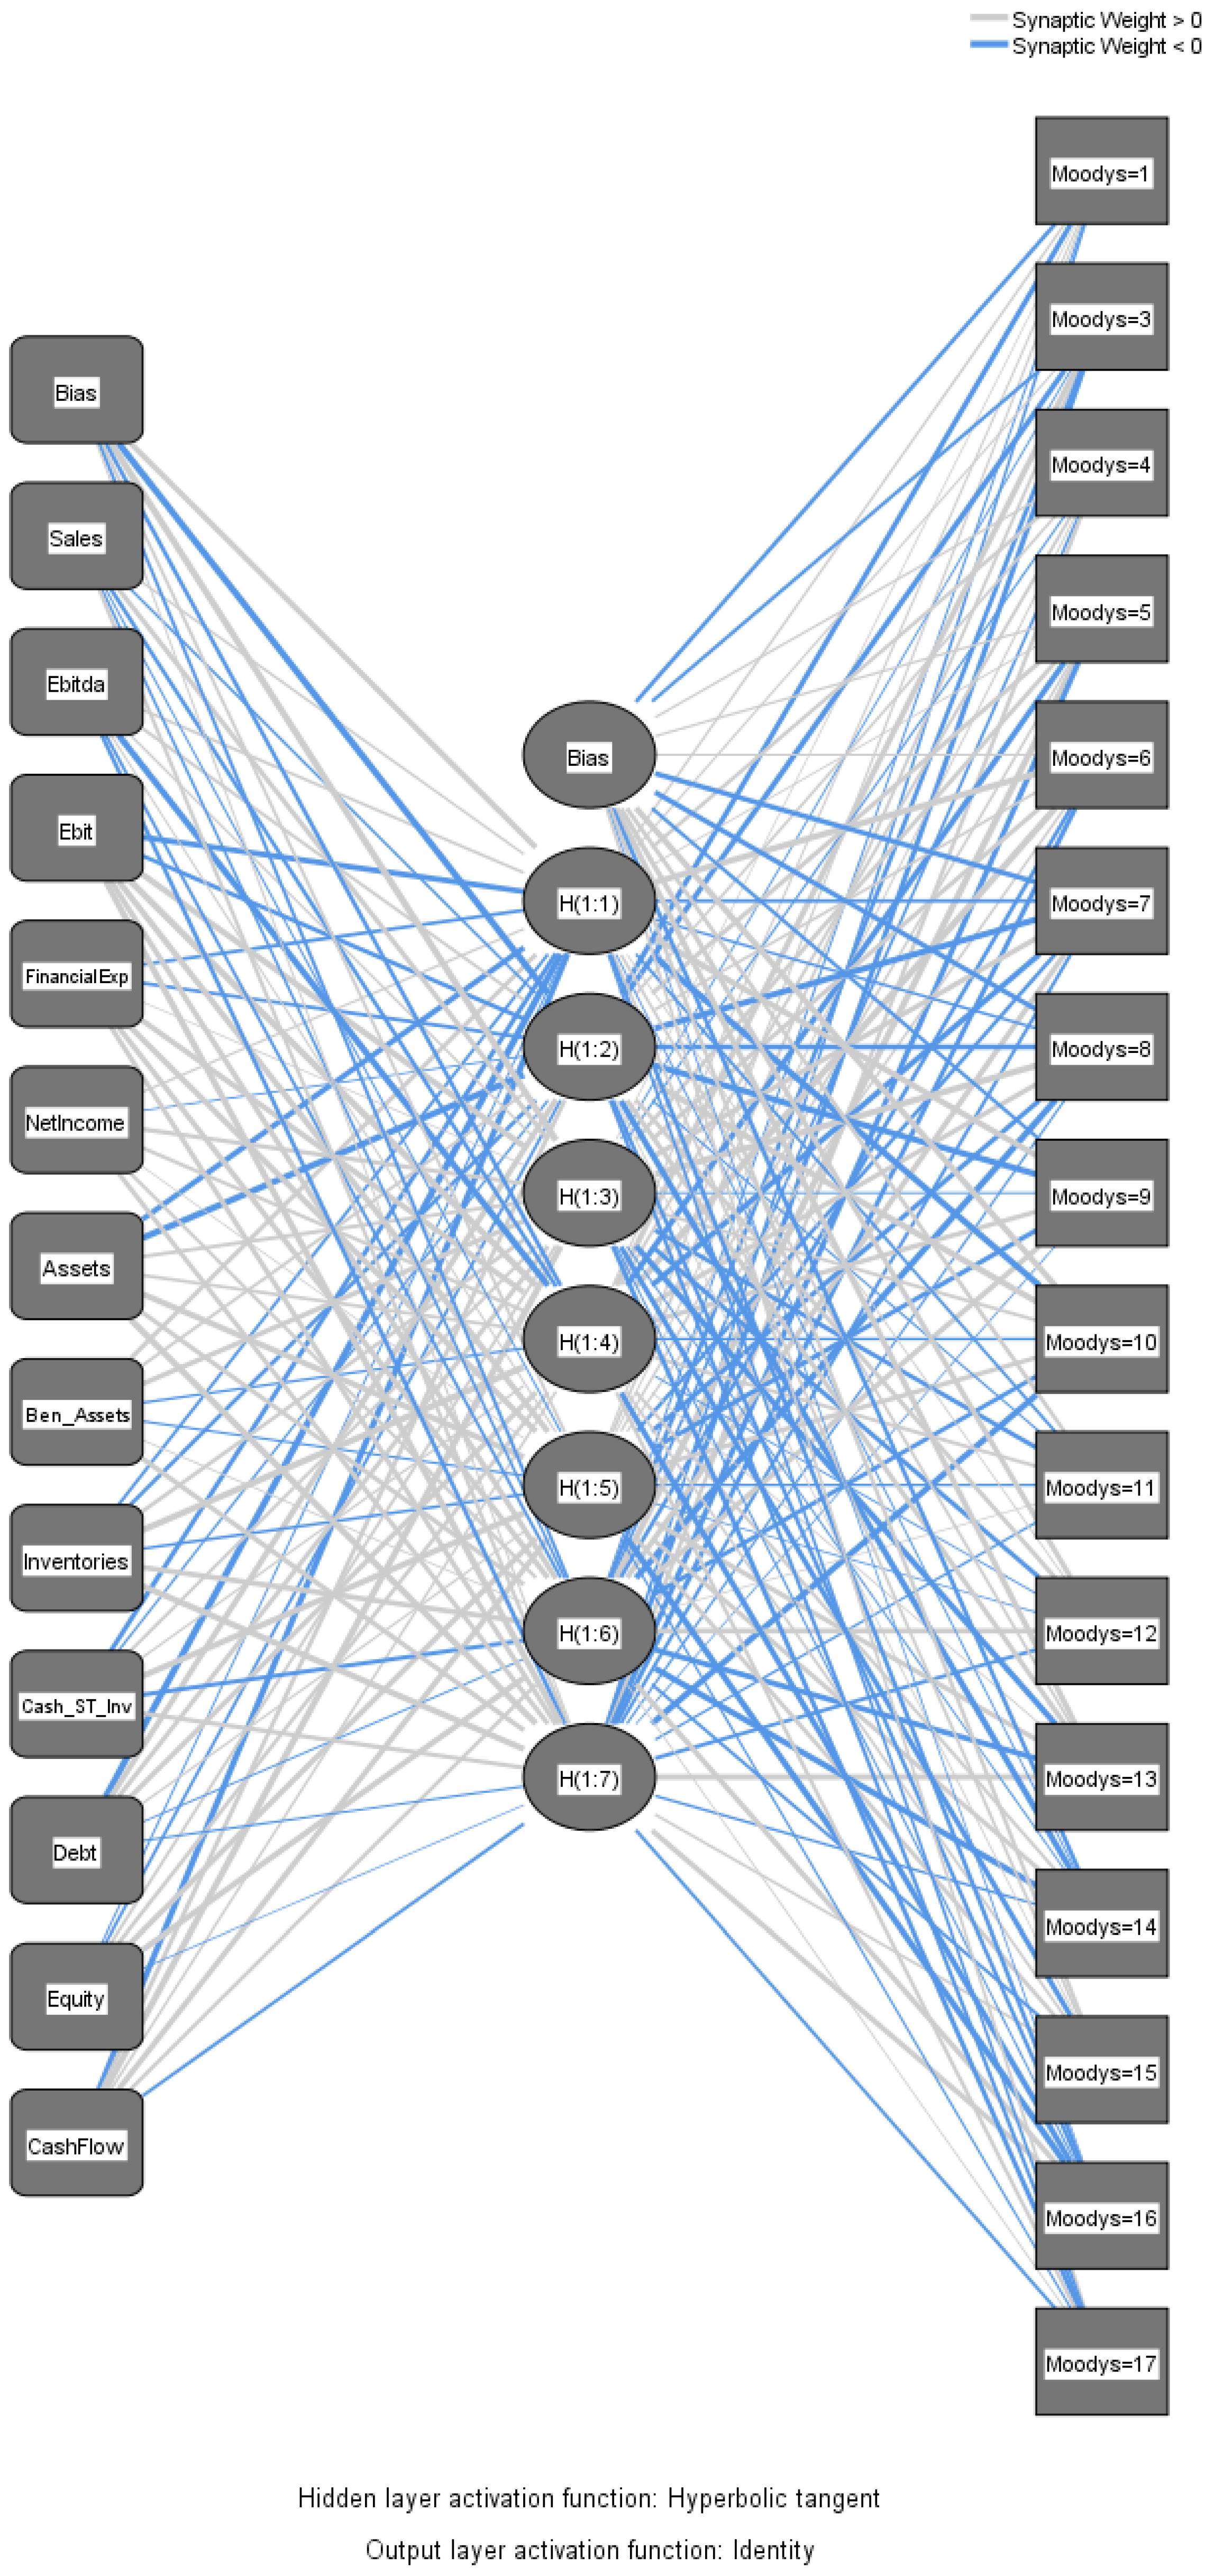
2019) use multivariate statistical techniques to forecast the rating levels of municipal bonds. To forecast the long-term rating attributed by Moody’s in this sector, a multi-layer perceptron, MLP (12, 7, 1) is proposed, using public data from the balance sheets of 827 companies, replicated over a five-year period, using usual transformation into financial ratios with several additional variables. The endogenous variable is Moody’s rating with all the categories defined by the agency, that is, without any aggregation of contiguous categories, but at the lower end of the non-prime.
An artificial neural network
Caridad et al. (
2019) is a non-linear model that aims to explain the variability of (one, in our case) endogenous variables (the rating of a firm), using several exogenous variables (its public account data). The model specification is completed using one or several layers of latent variables (the neurons). Each neuron received inputs from the variables of the previous layer, being the first layer composed by the explanatory variables; these inputs are processed using a linear combination of their values, obtaining a net measure, which is filtered using an activation function that can modify or even block this net input. The output information from each neuron is transmitted to all variables of the next layer, and so on, until it reaches the output layer formed by the endogenous variables, that are estimated. The estimation process aims to the reduction in the differences between the estimated output values and the real values of the exogenous variables, and it is completed using an iterative procedure. In case of the MLP, the information flows only in one direction, and the parameters estimated adapt to the data, so there is no need to specify a priori a defined function as in, for example, regression models.
To attain the proposed model, several alternative topologies were selected, with one or two hidden layers, and different number of neurons in them. In addition, several previous normalizations in the input layer were used and different activation functions (the hyperbolic tangent in the hidden layer was finally adopted); 80% of the firms were used to train the network, and the remaining 20% out of sample cases were used for validation purposes. The SPSS© package disposes of several parameterization alternatives, which can be useful in dealing with different topologies and specifications, such as selecting the number of hidden layers (one in the proposed network), and limiting the number of hidden neurons. Finally, the gross result in the classification process can be summarized in the 38.9% correct forecasted values,
Table 4 (in the test out of sample set of cases). This could, logically be improved, aggregating several rating classes.
The topology finally used in the artificial neural network is presented in
Figure 4:
The sensibility vs. specificity curves for each rating category show a homogeneous behavior across the whole range of values.
This can be assessed with the areas under these curves, showed in
Table 5.
The importance of the variables (
Table 6) used in the model is in line with previous works, although some usual ratios are not used in the model. Profitability variables, such as the EBIT and gross net margin are of primary importance, with several debt related ratios; the size of a company is also a significant parameter, and ratios related to the cash flow.
The detail of the forecasting power of the model, as it is really a classification problem, is presented in
Table 7, replicated for the training and for the tests sets. The results are similar confirming the stability of the model proposed for new companies in these sectors.
As shown in
Table 3, the number of companies top rated or at the bottom of the scale are scarce; this happens in the whole population of firms, and, consequently, in the sample; also, when dividing it in training and test sets, this situation is more evident.
Considering a correct forecast if the deviation is at most one notch from the Moody’s forecast, there are over 61% (65.6%, in investment grade category) of companies, in the out-of-sample test set with a forecasted ratio, and over 76% if two notches deviations are permitted. Some simpler models can be proposed, not taking into account several variables, such as the total debt, the dividend or the EBITDA, but the forecasting power decreases, so it is worth maintaining the whole set of exogenous variables.
6. Conclusions
Statistical methods have been used in the past to obtain the probability of default of corporations, as an alternative to published figures by the main rating agencies, with mixed results. Almost all of the published works refer to classification in broad aggregated rating classes, such a prime/non-prime, or prime 1-2-3 and non-prime, and with limited statistical information. Today the availability of large databases of company’s economic and financial data makes possible the use of artificial intelligence methods to process large or very large sets of data and, either, create models to estimate the probability of default of firms, or to reproduce the rating scale attributed to them by the main rating agencies. Here, the objective is to forecast the almost full range of ratings (long-term for firms by Moody’s), and in two main economic sectors; only in the bottom classes Caa, the cases are aggregated, as for such as low rates the mortality of companies is quite high to be able to attain a full discrimination. Other techniques to carry out statistical analysis of datasets of complex objects is based on object-oriented data analysis (OODA) where our modeling issue can be seen as a population of tree-structured object (
Sánchez-Rodríguez and Caridad y Ocerin 2014). However, is difficult to deal with the opacity of the CRAs when trying to find out the motivations of the agencies to change their ratings, as they are supposed to be accurate and stable. In spite of that, it seems that the pattern of rating changes over the last decades suggests that ratings agencies behave in more complex ways, perhaps as a response to the incentives of the rating business (
Viegas de Carvalho et al. 2014).
Whatever the motivations are, surely, the methodology that produces better results is based on artificial neural networks, such as the multi-layer perceptron as we have analyzed here, and in the line of
Bahrammirzaee (
2010), what is more, the research field proposed here is currently under development using deep learning techniques, more accurate which allows us to work with bigger datasets and improved techniques as we have seen that multivariate statistical methods, such as discriminant analysis cannot grasp the non-linearity involved in the creation of an ordinal scale. On the other hand, econometric models or dependent ordinal variables models are not easy to specify, so they usually are not able to reproduce ratings with a reasonable accuracy. Moreover, it would be convenient to include in the model external variables somehow related with different sources of risk, there are internal risk factors in a company that may have an impact on the balance sheet, benefit and loss account, and, consequently, on ratios and metrics if they are not well managed; at the same time, also external risk factors between different companies within the same sector, could have an impact and affect them. The number of exogenous variables to estimate ratings can be reduced to a subset of the original data; the ratio debt/EBITDA is considered the most important, followed by the market value and the cash flow. Some ratios related to debt are also to be taken into account. With the proposed methodology, and having access to statistical information, such as the provided (at a cost) by Bloomberg, it is possible to assess the reliability of rating provided by CRA’s, or to estimate a rating for a new company without having to support the costs of the rating process. Several of these alternatives to review and analyze are currently used by market participants across Europe (
European Commission 2015), according to this report, they include, for instance, internal measures and ratings where bulk of the analysis is performed in-house by the investor using quantitative and qualitative information collected from a variety of sources; market implied ratings, e.g., bonds/equity pricing information, CDS spreads; and accountancy based measures such as profitability and leverage ratios. Some applications include the possibility to assess published rates, to detect rating inflation in some cases, or to obtain ratings directly from easy to implement models based on public data, are some follow up that can be derived from the approach presented. Additionally, without incurring on the not-low cost of contracting a rating with one of the main agencies. The procedures presented can be extended to other sectors and rating agencies, with a minimum effort. The main limitation in the forecasting process is the lack of availability of the so-called qualitative information used by the CRAs, and the impossibility of using recent facts as the fall of Kabul, that surely will have impact of some companies. The opportunities aroused due to the advances in portfolio risk measurement and management techniques, the growth in credit derivatives trading, the new European insurance regulatory regime and the introduction of Solvency II are challenging for the future of the financial world.


 ,
, 


