Article

Predicting the Economic Impact of the COVID-19 Pandemic in the United Kingdom Using Time-Series Mining

1
School of Business, Nottingham University, Nottingham NG8 1BB, UK
2
School of Computing and Digital Technology, Birmingham City University, Birmingham B4 7XG, UK
3
Economics Department, George Washington University, Washington, DC 20052, USA
4
Faculty of Computer Science and Engineering, Galala University, Suez 435611, Egypt
5
School of Medicine, Nottingham University, Nottingham NG8 1BB, UK
6
Faculty of Computers and Information, Assiut University, Assiut 71515, Egypt
*
Author to whom correspondence should be addressed.
Denotes equal contribution.
Economies 2021, 9(4), 137; https://doi.org/10.3390/economies9040137
Submission received: 29 July 2021 / Revised: 16 September 2021 / Accepted: 22 September 2021 / Published: 27 September 2021
(This article belongs to the Special Issue The Economics of Health Outbreaks and Epidemics)

Abstract

:
The COVID-19 pandemic has brought economic activity to a near standstill as many countries imposed very strict restrictions on movement to halt the spread of the virus. This study aims at assessing the economic impacts of COVID-19 in the United Kingdom (UK) using artificial intelligence (AI) and data from previous economic crises to predict future economic impacts. The macroeconomic indicators, gross domestic products (GDP) and GDP growth, and data on the performance of three primary industries in the UK (the construction, production and service industries) were analysed using a comparison with the pattern of previous economic crises. In this research, we experimented with the effectiveness of both continuous and categorical time-series forecasting on predicting future values to generate more accurate and useful results in the economic domain. Continuous value predictions indicate that GDP growth in 2021 will remain steady, but at around −8.5% contraction, compared to the baseline figures before the pandemic. Further, the categorical predictions indicate that there will be no quarterly drop in GDP following the first quarter of 2021. This study provided evidence-based data on the economic effects of COVID-19 that can be used to plan necessary recovery procedures and to take appropriate actions to support the economy.

1. Introduction

The COVID-19 pandemic has triggered a massive health crisis across the globe and forced many countries to take severe preventive measures to mitigate the spread of the virus including enforcing national lockdowns and social distancing measures (Huang et al. 2020). Subsequently, many businesses were pushed to the brink of collapse and the national economy suffered significantly in almost all aspects (Song and Zhou 2020). Although all countries and businesses are affected, the magnitude of the impacts have varied massively. The duration and the pattern of the lockdown and the social distance measures imposed by the governments to limit the spread of the pandemic has caused asymmetric effects not only between countries but also between business sectors and in the demand-supply chains within each country. This asymmetry of the economic shock may indicate that predicting the gross domestic products (GDP) will be challenging and could be unexpectedly different from the forecasted figures (BFPG 2020).
The first United Kingdom (UK) government advice on social distancing was published on 12 March 2020, before a formal “lockdown”, which was announced on 23 March 2020. As in other affected countries, this led to a fall in the consumer demand and business and factory closures, as well as supply chain disruptions. Although early data indicated that the UK is less affected compared to some other European countries, as the pandemic developed the performance of the UK relative to these other European countries worsened (Boissay and Rungcharoenkitkul 2020). While initially much emphasis had been placed upon the UK’s favourable performance compared to other countries, with time the UK government has attempted to provide a positive representation of trends of the disease spread (Balmford et al. 2020; Paisley 2020).
The unstable and changing situations make forecasting the economic performance and predicting the immediate and long-term economic impacts challenging for many reasons. These include the global nature of the pandemic with disruption of the demand and supply chains, transportation restrictions, the national measures taken, which affecting almost all business, and extended duration of the pandemic, the huge job losses, and the significant rise in the unemployment rates, the way education and other business are delivered and the lack of similar models that can be used to predict the future performance (Saker et al. 2004). The stagnation of business, the drop in the national tax income and GDP will limit the ability of the government to react and take remedial actions to ensure a balanced recovery of all sectors (Child 2021). Therefore, data on the performance of different sectors, and accurate forecasting of the performance and recovery are needed to allow future planning and distribution of the already stretched resources (Kim et al. 2021). In addition, a robust forecasting model that can consider the multidimensional nature of the pandemic, and learn from previous economic crises and pandemics is needed.
Artificial intelligence (AI) has been successful in a variety of fields including computer vision, robotics, fraud detection, drug discovery, and epidemiology (Ahuja 2019; Ibrahim et al. 2020; Wahl et al. 2018; Arslan and Benke 2021; Fu et al. 2019). There is a great hope that AI approaches can be a key to supporting studies of COVID-19 and future crises to build dynamic and resilient forecasting models that can utilise the data of previous pandemics and other economic crises. Developing intelligent systems that can help governments predicting performance and economic outcomes, offering solution models can be very helpful in such multidimensional crises and help to tackle future crises and challenges.
This study aims to characterise the impacts of COVID-19 on the UK macroeconomic indicators with comparison to previous economic crises in the recent history and to utilise AI to predict the future economic impacts of COVID-19 in the UK. We mainly focused on both continuous and categorical time series forecasting methods to predict future measures. Even though there was a high tendency to use continuous forecasting methods for such predictions, we involved categorical forecasting to mitigate the impact of unexpected variations due to the pandemic situation on predictions. Data on the macroeconomic indicators, gross domestic products (GDP) and GDP growth, and data on the performance of three primary industries in the UK (construction, production, and service) were analysed.

2. Literature Review

In this section, we provide an overview of some of the rapidly growing literature on the economic impact of COVID-19 to synthesize the insights emerging from these studies, allow for a comparative review, and relate the results to our study.
-
The impact of COVID-19, associated behaviours and policies on the UK economy has been studied by a computable general equilibrium model (Keogh-Brown et al. 2020). The authors of the study used a computable general equilibrium (CGE) model linked to a population-wide epidemiological demographic model to analyse the potential macroeconomic impact of the COVID-19 on the UK economy. The study found out that the mitigation strategies that the government imposes for 12 weeks would reduce case fatalities by 29% but impose a total cost to the economy of 13.5% of GDP, due to business closure and labour loss from working parents during school closures. The mitigation strategies to face the pandemic that lasts for a longer period would reduce deaths by 95% but would increase the total cost to the UK economy to 29.2% of GDP, where 7.3% of GDP is due to school closures and 21.9% of GDP to business closures. The authors concluded that COVID-19 has the potential to impose unprecedented economic impact on the UK economy and those impacts are likely to be dominated by the indirect costs of mitigation of the pandemic. The duration of the policies of mitigating the spread of the disease is a key to determining the economic impact.
-
The impacts of COVID-19 and Brexit on the UK economy were investigated (De Lyon and Dhingra 2021) using real-time data provided by the Confederation of British Industry (CBI) to assess the impact of COVID-19 on firms’ activities and predicted the economic consequences of the preventive measures that the government imposed. The authors have demonstrated that the pandemic has caused a sharp reduction in the growth rate of nominal wages. Before the pandemic, in January 2020 nominal wages had grown by 3.1% over the previous 12-month period compared with 0.9% a year later. However, average prices have continued to increase 0.5% throughout the pandemic, with a producer price inflation of 0.6% reported by the ONS for all manufactured products. Lower wages often reduce demand for goods and services and put downward pressure on prices. Yet despite lower earnings growth since the pandemic, prices have increased. This is partially explained by rising average costs, at least in the manufacturing sector. The increase in costs was mainly due to the increased input costs by increasing barriers to trade between the UK and the EU imposed by Brexit in addition to delays at the border, burdensome administrative costs, the adopted new technologies and management practices due to the pandemic. These costs contributed to the sharp fall in UK trade in 2021, leading to rising costs, higher prices, and reduced competitiveness.
-
Another study (Stephens et al. 2020) has been conducted on the UK economy by analysing the overall impacts of the (COVID-19) pandemic on GDP during July 2020 using an online questionnaire, and the Monthly Business Survey (MBS) as the primary data source for 75% of production industries and 50% of services industries. The authors concluded that total services output during July 2020 were significantly affected by the COVID-19 pandemic and fell at 12.6% below the February 2020 level, the last full month of “normal” operating conditions. The transport sector remained one of the biggest areas of services affected by the coronavirus as people have been homeworking, land transport has been affected by a reduction in commuters, especially the London Underground, which in July 2020 was at 23% of its usage in July 2019. Production output during July 2020 was at 7.0% below the level of February 2020, the last full month of “normal” operating conditions. In July 2020, wearing apparel was 32.9% below the February 2020 level. Construction output was 11.6% below its February 2020 level.A five-part framework (O’Donnell and Begg 2020) has been proposed for assessing why the UK performed poorly compared with other countries regarding the medical, social and economic challenges brought about by the COVID-19. They suggested that there have been problems as to how evidence about the pandemic and its anticipated effects has been collected, processed and circulated. Subsequently, this affected policy maker’s ability to evaluate the risk and providing them with inadequate information to face the multidimensional challenges brought about by the pandemic with the proper policy response. The study also revealed that the UK’s institutional setting may have been a driver of this poor performance towards the pandemic. The authors argued that UK policymakers may have over-relied on the medical sciences at the expense of other (social) scientific evidence. Another study emphasised the importance of widening organisational decision making as an approach (Child 2021) to address the problems that were brought about by the pandemic. The author defined ‘organisational participation’ and provided a framework for the different forms of participation, concluding that a combination of co-determination and workplace self-management is likely to have the most consequential effects. The author argued that the public response to the crisis might lead to a constructive way forward to deal with the pandemic and emphasised the need to develop effective systems of participation at all levels of human organization.
-
Moreover, the main challenges facing policymakers, when trying to balance between finding jobs for the layout workers and getting them back to the right jobs, were highlighted in the study by (Costa et al. 2020). These authors concluded that the nature of the economic shock associated with the COVID-19 pandemic is highly unusual; it has led to not only a sharp fall in labour demand in many sectors of the economy, much more than in a typical downturn or slowdown in economic activity, but also a radical change in the types of economic activity in the UK which will cause employers to expect large changes to their workforce over the next year. This would lead the government to take a forward-looking approach and equip people with the skills that are likely to be in demand in the future, provided a potential shift towards e-commerce, and the need to move to a net-zero, which is the target for the UK to reach by 2050.
-
The Impact of COVID-19 on share prices in the UK (Griffith et al. 2020) was investigated by Rachel Griffith and colleagues. These authors described how the impacts of the COVID-19 pandemic have varied across industries, using data on the share prices of the firms listed on the London Stock Exchange. The value of traded shares in the stock market reflects not only how well a company is doing today, but also how well it is expected to do in the future. In addition, share prices reflect market expectations about changes in final demand, intermediate demand, and restrictions in supply. The authors concluded that the industries that have been hit the hardest include tourism and leisure, fossil fuels production and distribution, banking, insurance, and retailers. On the other hand, other industries have outperformed the market, including food and drug manufacturers and retailers, utilities, high-tech manufacturing, tobacco, and firms in medical and biotech research. As social distancing measures continue, capital-intensive firms might lose the skills and experience of their workers. If those firms are not able to reduce their costs, they are more likely to suffer in the future if not backed by government support.
From the above section, we conclude that most of the research that investigated the impact of the COVID-19 on the UK economy has focused on the different sectors of the economy and the overall GDP growth rate. However, none of these studies used AI model to forecast the pattern of change in the future and to compare with the pattern of previous economic crises, which highlights the importance and uniqueness of our study.

3. Methodology

3.1. Sample Section

The data for this study were collected from the Office for National Statistics (ONS 2021), which is the UK’s largest independent producer of data. It was essential to consider the pandemic will affect various sectors differently, and each industry will impact the economy differently (Coakley et al. 2014). In this study, data on three industries (the service, manufacturing and construction industries) and gross domestic product (GDP) were collected on a monthly, quarterly, and yearly basis. Prediction analysis utilised the quarterly data collected from January 1997 to January 2021. Data on GDP were also collected from 1947 to February 2021 to allow the comparison with more previous outbreaks and for the calculation of economic growth (ONS 2021). For the service industry, the data were collected from the Monthly Business Survey (MBS) report for turnover of services industries. The total output of all of the sectors and 37 different sections inside the industry were observed (ONS 2021). The data for the manufacturing industry were collected from the MBS turnover of the production industries. The total turnover for the production and manufacturing sectors and 45 different sectors inside the industries were observed (ONS 2021). For the construction industry, data for the outputs, seasonally and non-seasonally adjusted were observed. Furthermore, yearly and quarterly growth was observed (ONS 2021). For this study, a nowcasting model based on a dynamic factor model was used to predict quarterly GDP for 2021 by analysing monthly GDP data. This model uses real-time and high-frequency data to establish a closer examination of the UK economic impact before the official data gets released.

3.2. Prediction Using AI

This section presents the methodology used for economic predictions. Both continuous and categorical time-series forecasting methods were focused. A time-series is defined to be a collection of observations made sequentially through time (Chatfield 2000). The concept of time-series forecasting is to predict future values based on previous observations. Based on the data type, forecasting can be divided into two categories (continuous and categorical). Among them, continuous-value forecasting is widely used in different domains such as meteorology (Singh and Mohapatra 2019), epidemiology (Benvenuto et al. 2020), and economics. Following this tendency, initially, we used a continuous time-series forecasting approach to make future predictions, as detailed in the section ‘Continuous Time-series Forecasting’.
However, results obtained by initial experiments demonstrated that continuous time-series forecasting cannot accurately capture the unexpected fall of the economy due to COVID-19. It was an extreme fall compared to the previous values, which are used to train the models. From the perspective of machine learning, models cannot accurately predict such unseen behaviours. Therefore, we decided to conduct categorical forecasting considering the growth and fall of the economic measures as described in the ‘Categorical Time-series Forecasting’ section. The growth or fall of a particular time point t was measured compared to a previous time point. The main purpose of using categories is to convert unexpected variations into known formats.

3.2.1. Continuous Time-Series Forecasting

For continuous time-series forecasting, we chose the Autoregressive Integrated Moving Average (ARIMA) model, considering its popularity among previous research and simplicity 24. Referring to recent literature, the ARIMA model was successfully used to predict the epidemiological trend of COVID-19 (Hewamalage et al. 2021), food demand (Fattah et al. 2018), and growth in GDP. As a statistical model, ARIMA works well with small data sets, while artificial neural network-based models such as long short-term memory (LSTM) need a huge amount of data for proper learning.
ARIMA model is a generalised version of the Autoregressive Moving Average (ARMA) model. As the name depicts, ARIMA combines the Autoregression (AR), Moving Average (MA) model and a differencing preprocessing step named integration (I) which makes the time-series stationery. Based on these three components, ARIMA requires three hyperparameters, the order of AR ( p ) , the order of differencing ( d ) and the order of MA ( q ) . Mathematically, A R I M A ( p ,   d ,   q ) model is formed using the equation:
x t = c + i = 1 p i x t i + ϵ t + j = 0 q θ j ϵ t j
where x are time-series values, c is the constant term, i is the coefficient of ith autoregressive parameter, θ j is the coefficient of jth moving average parameter and ϵ are residuals or error terms (Fattah et al. 2018).

3.2.2. Categorical Time-Series Forecasting

We propose a categorical time-series forecasting approach to mitigate the impact of unexpected changes on model predictions. Due to unexpected variations, the error rate between the actual and the predicted values can be highly increased, and predictions can become less useful. To provide useful predictions in such situations, we can use categorical time-series forecasting, since the limitation of possible values by categories allows the conversion of anomalous variations into known representations.
ARIMA-based Categorical Forecasting: As the initial approach, we converted actual time-series and predictions by the ARIMA model into a series of categories considering consecutive value changes. After the conversion, we used a set of evaluation metrics commonly used with classification tasks to evaluate the model performance from the aspect of categorical predictions.
The categories need to be defined considering the targeted user group and information requirements. Focusing on these aspects, we considered three categories ((1) growth, (2) constant, and (3) fall) in this research. Each value at time t is converted into the categorical format according to the strategies mentioned below.
  • value at t > value at t 1 Growth
  • value at t = value at t 1 Constant
  • value at t < value at t 1 Fall
SAX-VSM-based Categorical Forecasting: Later, we applied a classification procedure named SAX-VSM which combines Symbolic Aggregate approXimation (SAX) and Vector Space Model (VSM) to make categorical predictions. SAX was found to be an efficient algorithm for finding time series discords (Keogh et al. 2005) and it was widely used with time-series pattern discovery tasks such as heatwave event detection (Herrera et al. 2016) and micro-blog event discovery (Stilo and Velardi 2016). Since the focused economic measures have unexpected changes due to the pandemic situation, this algorithm’s abilities can be effectively used to make accurate predictions. The VSM model is combined with SAX to facilitate time-series classification.
SAX converts a time series ( C ) to a w -dimensional space c ¯ = c 1 ¯ ,   c 2 ¯ ,     c w ¯ using Piecewise Aggregate Approximation (PAA) following the equation:
c i ¯ = w n j = n w ( i 1 ) + 1 n w i c j
where c j is the jth element and n is the length of the original series. Then each PAA representation is converted into a symbol of an alphabet of size a using a lookup table so that the series is finally represented by a word which uses for further analyses (Keogh et al. 2005). SAX-VSM converts a training set into a bag of words per class using a sliding window of length w over the series and SAX algorithm. In summary, three hyper-parameters word size ( w ), alphabet size ( a ), and window size ( w ) are required by SAX-VSM. Using the generated words, a term frequency-inverse document frequency (tf-idf) weighted vector space is built for the training data to facilitate the classification (Senin and Malinchik 2013).
Given a series, we converted it to a set of subseries with corresponding classes to use with this algorithm. Similar to the above-mentioned approach; ARIMA-based categorical forecasting, we considered three categories ((1) growth, (2) constant, and (3) fall) as the classes in this approach too. However, unlike the above scenario, comparisons between values will not always happen between consecutive values, since the comparisons should use at least one known value during the data preparation. For example, if the focus is to predict the category of the value at p succeeding time points, initially the original time series need to be separated into s -length subseries as shown in Figure 1 to prepare training data. Then the values in the last time point of each subseries are compared with the values at p succeeding time point to generate classes. For subseries 1, class assignment happens according to the following strategies.
  • x s + p > x s   Growth
  • x s + p = x s   Constant
  • x s + p < x s   Fall
Similarly, classes are assigned to other subseries and the target of the model built using these training data is to predict the category of value at p succeeding time point compared to the last available value. If p = 1 , values at consecutive time points and otherwise, values at non-consecutive time points will be compared during category generation. Also, unlike the above-mentioned approach, separate SAX-VSM models need to be generated per each targeted p   value.

4. Results

This study included data on GDP and three industries over an extensive period to compare the impact of COVID-19 with previous economic crises observed in the recent history of the UK economy in which reliable data are available. When the pattern of changes of GDP was analysed since 1947, which is the data first available in ONS, we identified significant drops which were related to specific events. However, the drop resulted from COVID-19 is unprecedented (Figure 2 and Table A1 in Appendix A). Appendix A represents the most significant economic recessions in quarterly GDP since records began in 1955.
Table 1 shows that the decline in the quarterly GDP following the initial period of the COVID-19 pandemic is severe (−21%) compared to other drops in the quarterly GDP over the last 60 years in the UK (p < 0.0001).
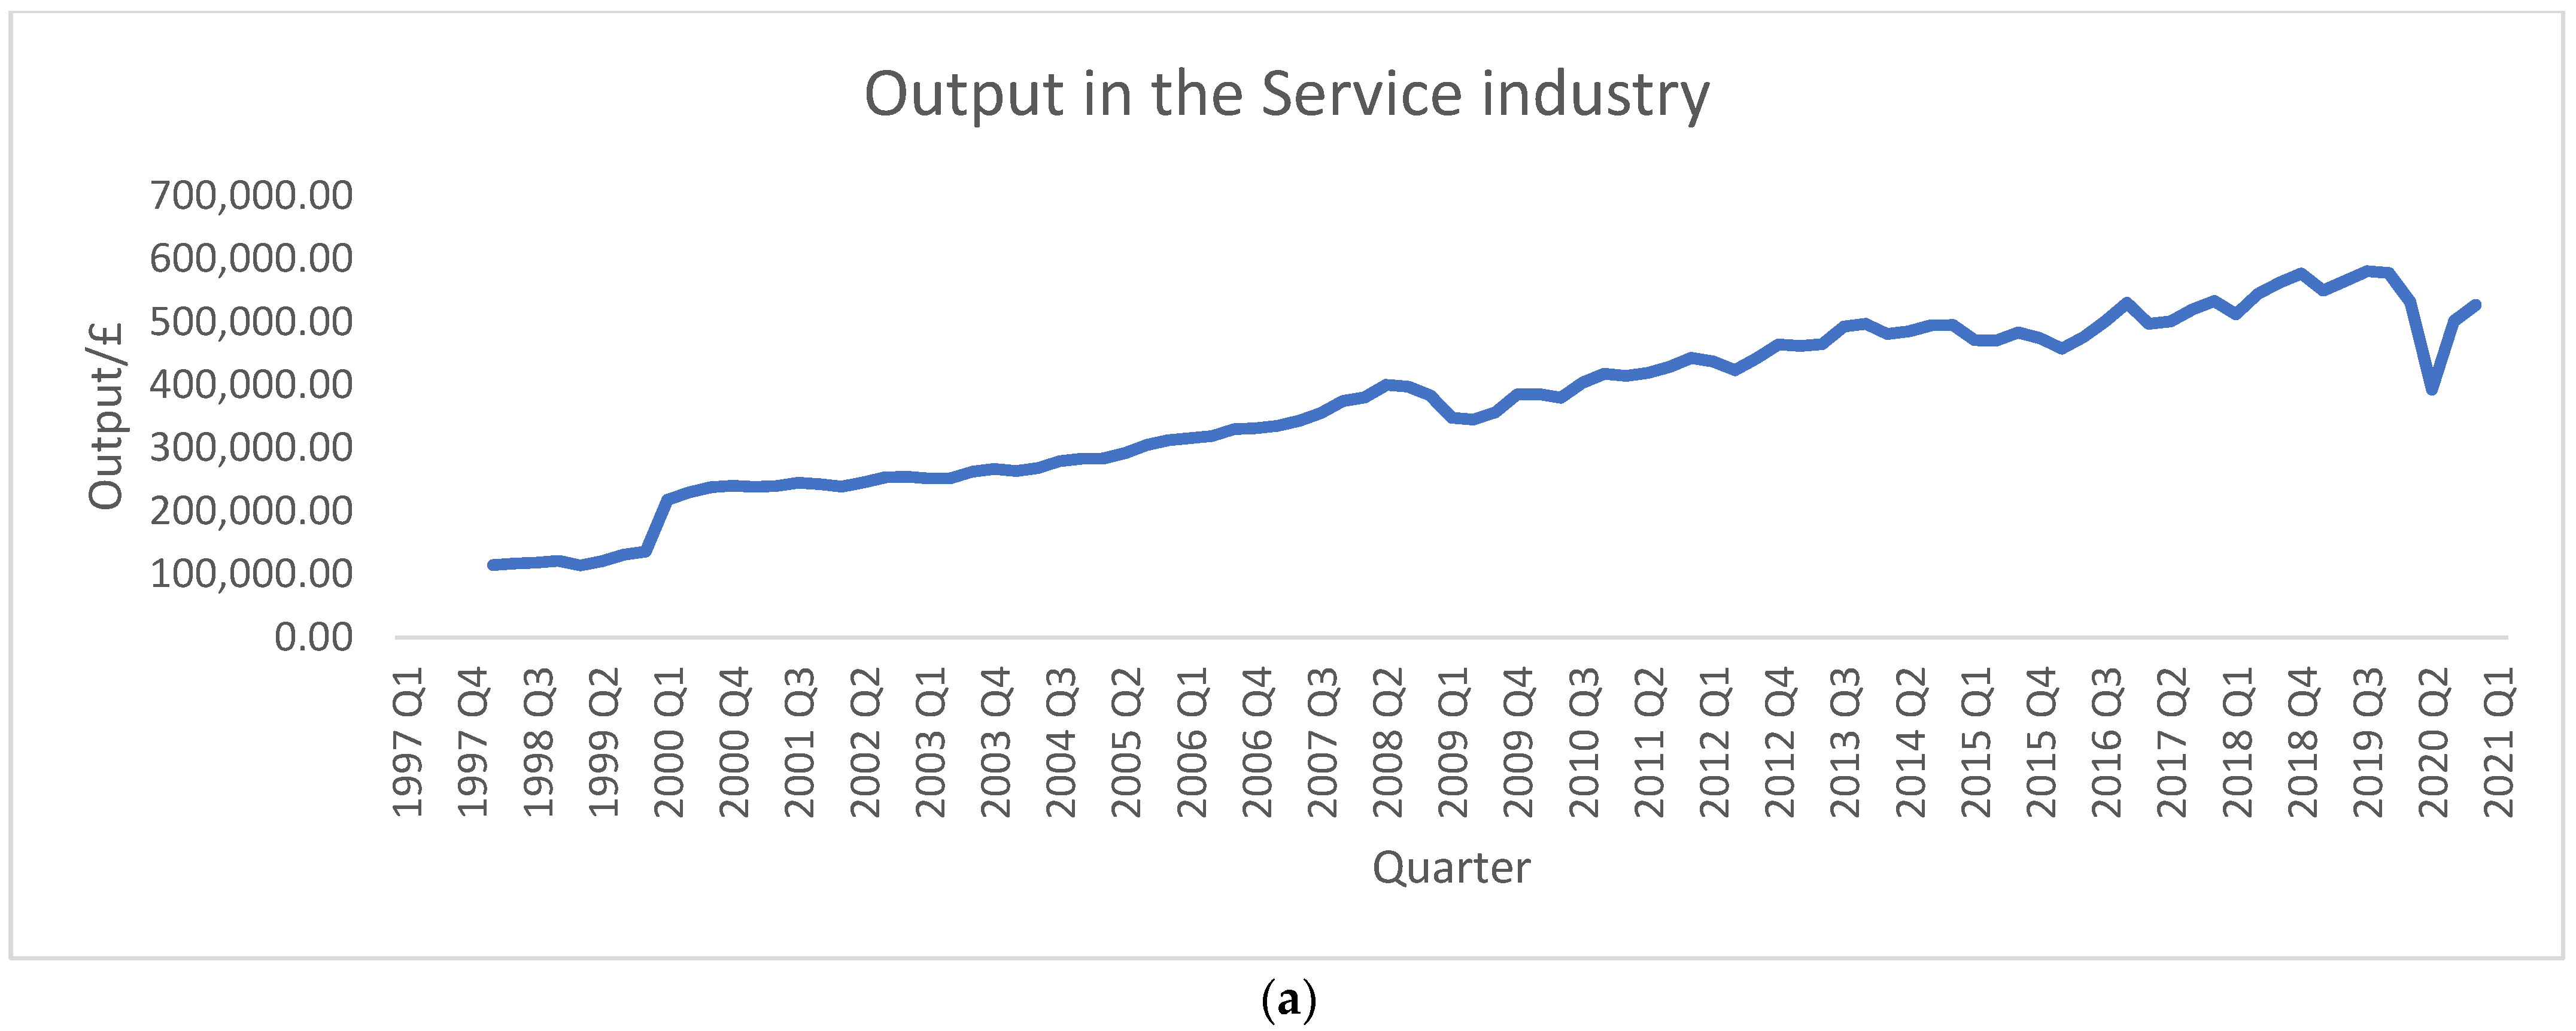
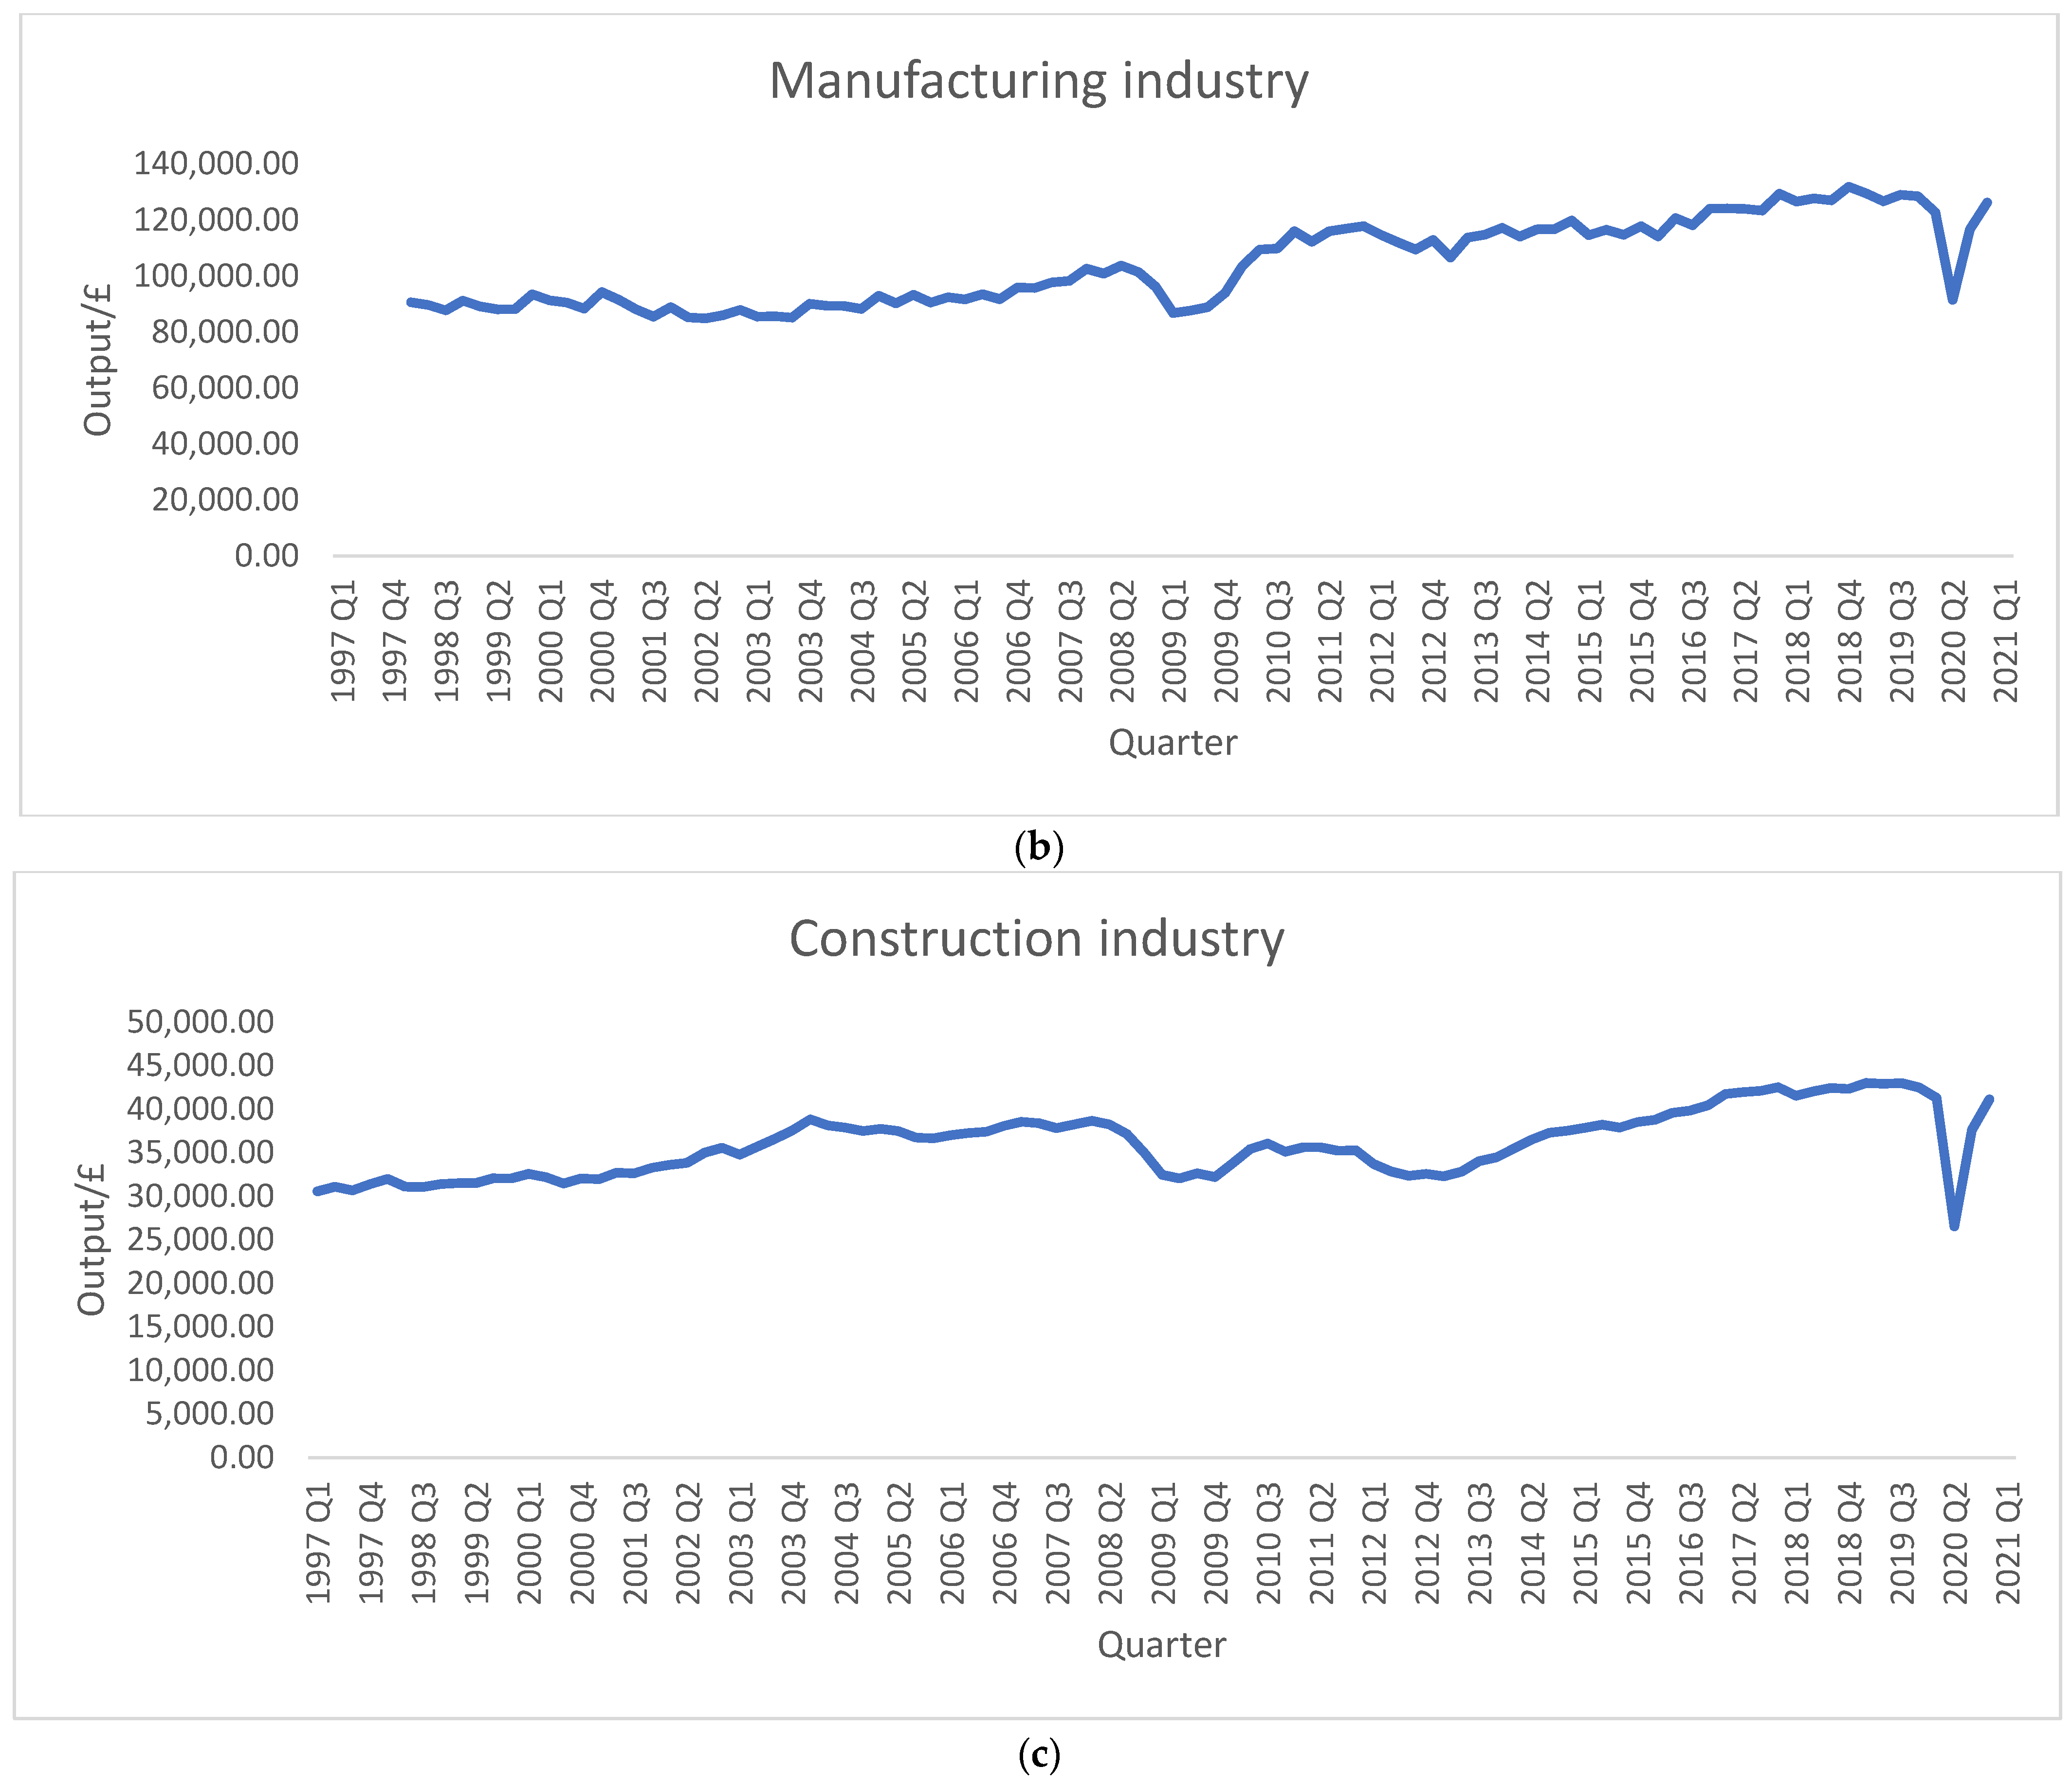
The second most significant drop was observed following the global financial-economic crisis of 2008, and the influenzas pandemic that hit the UK at the same time (Barro et al. 2020). However, the GDP drop was >3.5 folds smaller than that observed in COVID-19 (−5.9%) and it took 4fourquarters to reach the greatest drop compared to two quarters in the COVID-19 pandemic. The two other crises in the recent UK economic history were observed in 1974 (Miners’ strikes) and 1980 (economic downturn) with GDP drops of −5.4% and −5.3%, respectively. During the first few months of 1974, there was a four-week miners’ strike across England. During that period, the UK unemployment increased, and inflation hit 26% (Partington 2020). No other crises were associated with a drop greater than 5% as the following decline identified was −2% that was associated with the early 1990′s recession (Table 1). The output level for each industry (service industry, manufacturing industry and construction industry), can be seen in Figure 3.

4.1. AI-Based Model Predictions

As mentioned in the ‘Predictions Using AI’ section, we experimented with two approaches (i.e., continuous and categorical time-series forecasting) to generate AI-based predictions. Following these approaches, separate models were built for GDP (CVM) and industrial outputs (service, manufacturing, and construction (CVM)) using quarterly data. For the model generation, GDP measures and construction outputs from 1997 Q1 to 2020 Q4 were considered. Due to lack of data availability for the other two industries, data from 1998 Q1 to 2020 Q4 were used. With the target of predicting values until the end of 2021, each model was built to predict four future values. More details about continuous and categorical predictions including used evaluation metrics, evaluation results, and predicted values are described in the following sections.

4.1.1. Continuous Time-Series Forecasting

The approach described in the ‘Continuous Time-series Forecasting’ section was used to make continuous predictions. We used two commonly used error metrics to validate the results. Details of evaluation metrics, evaluation results, and future predictions are described in the following sub-sections.
Evaluation Metrics: To validate continuous value predictions, the rolling forecasting method was used. Each model was validated on 30% of the time series using rolling predictions. During the validation phase, model predictions were evaluated using the following evaluation metrics which are negatively-oriented. In the equations stated below, x i represent the actual values, x ^ i represent the predictions, and n represents the total number of observations used for testing.
  • Root Mean Squared Error (RMSE): Square root of the average of squared differences between actual and predicted values. This measure was widely used and preferred by this research considering its sensitivity to large errors.
R M S E = 1 n i = 1 n ( x i x ^ i ) 2
  • Mean Absolute Percentage Error (MAPE): Average of absolute percent error. Unlike the RMSE, MAPE is a unit-free measure, which can use to compare performance between models.
M A P E = 1 n i = 1 n | x i x ^ i x i |
Performance Evaluation: The evaluation results obtained for continuous time-series forecasting of each model are summarised in Table 2. Here we list the results of the best models obtained by parameter optimisation. ARIMA model requires three hyperparameters and all possible combinations were tested to recognise optimal parameter settings. According to the results, GDP predictions have the lowest error and service predictions have the highest error in MAPE. RMSE measure mainly depends on the underlying value range and it cannot be used for comparisons.
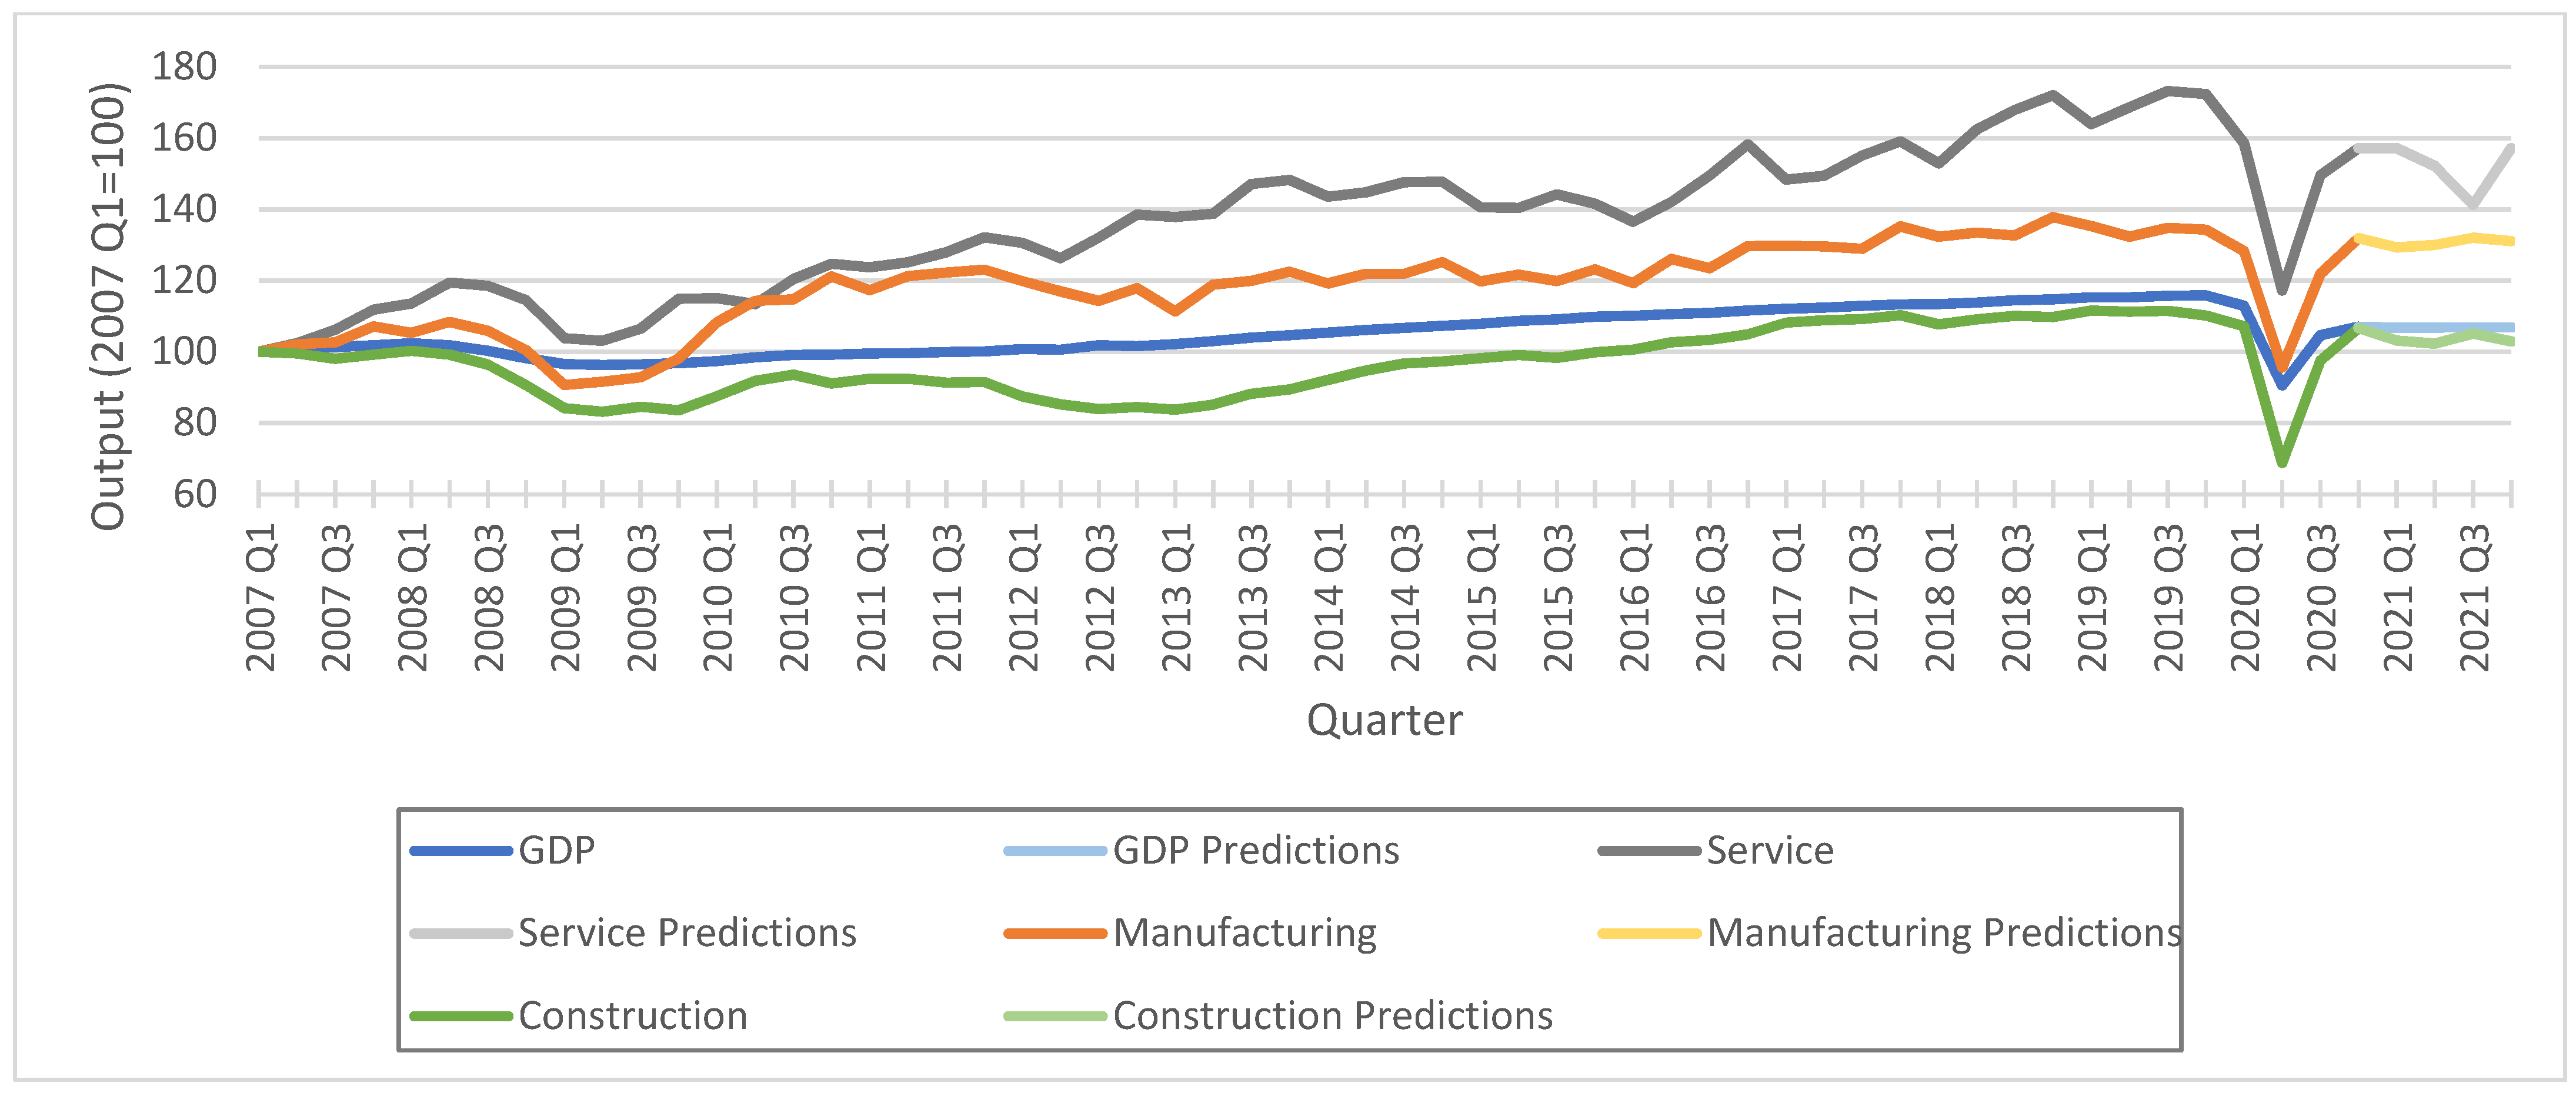
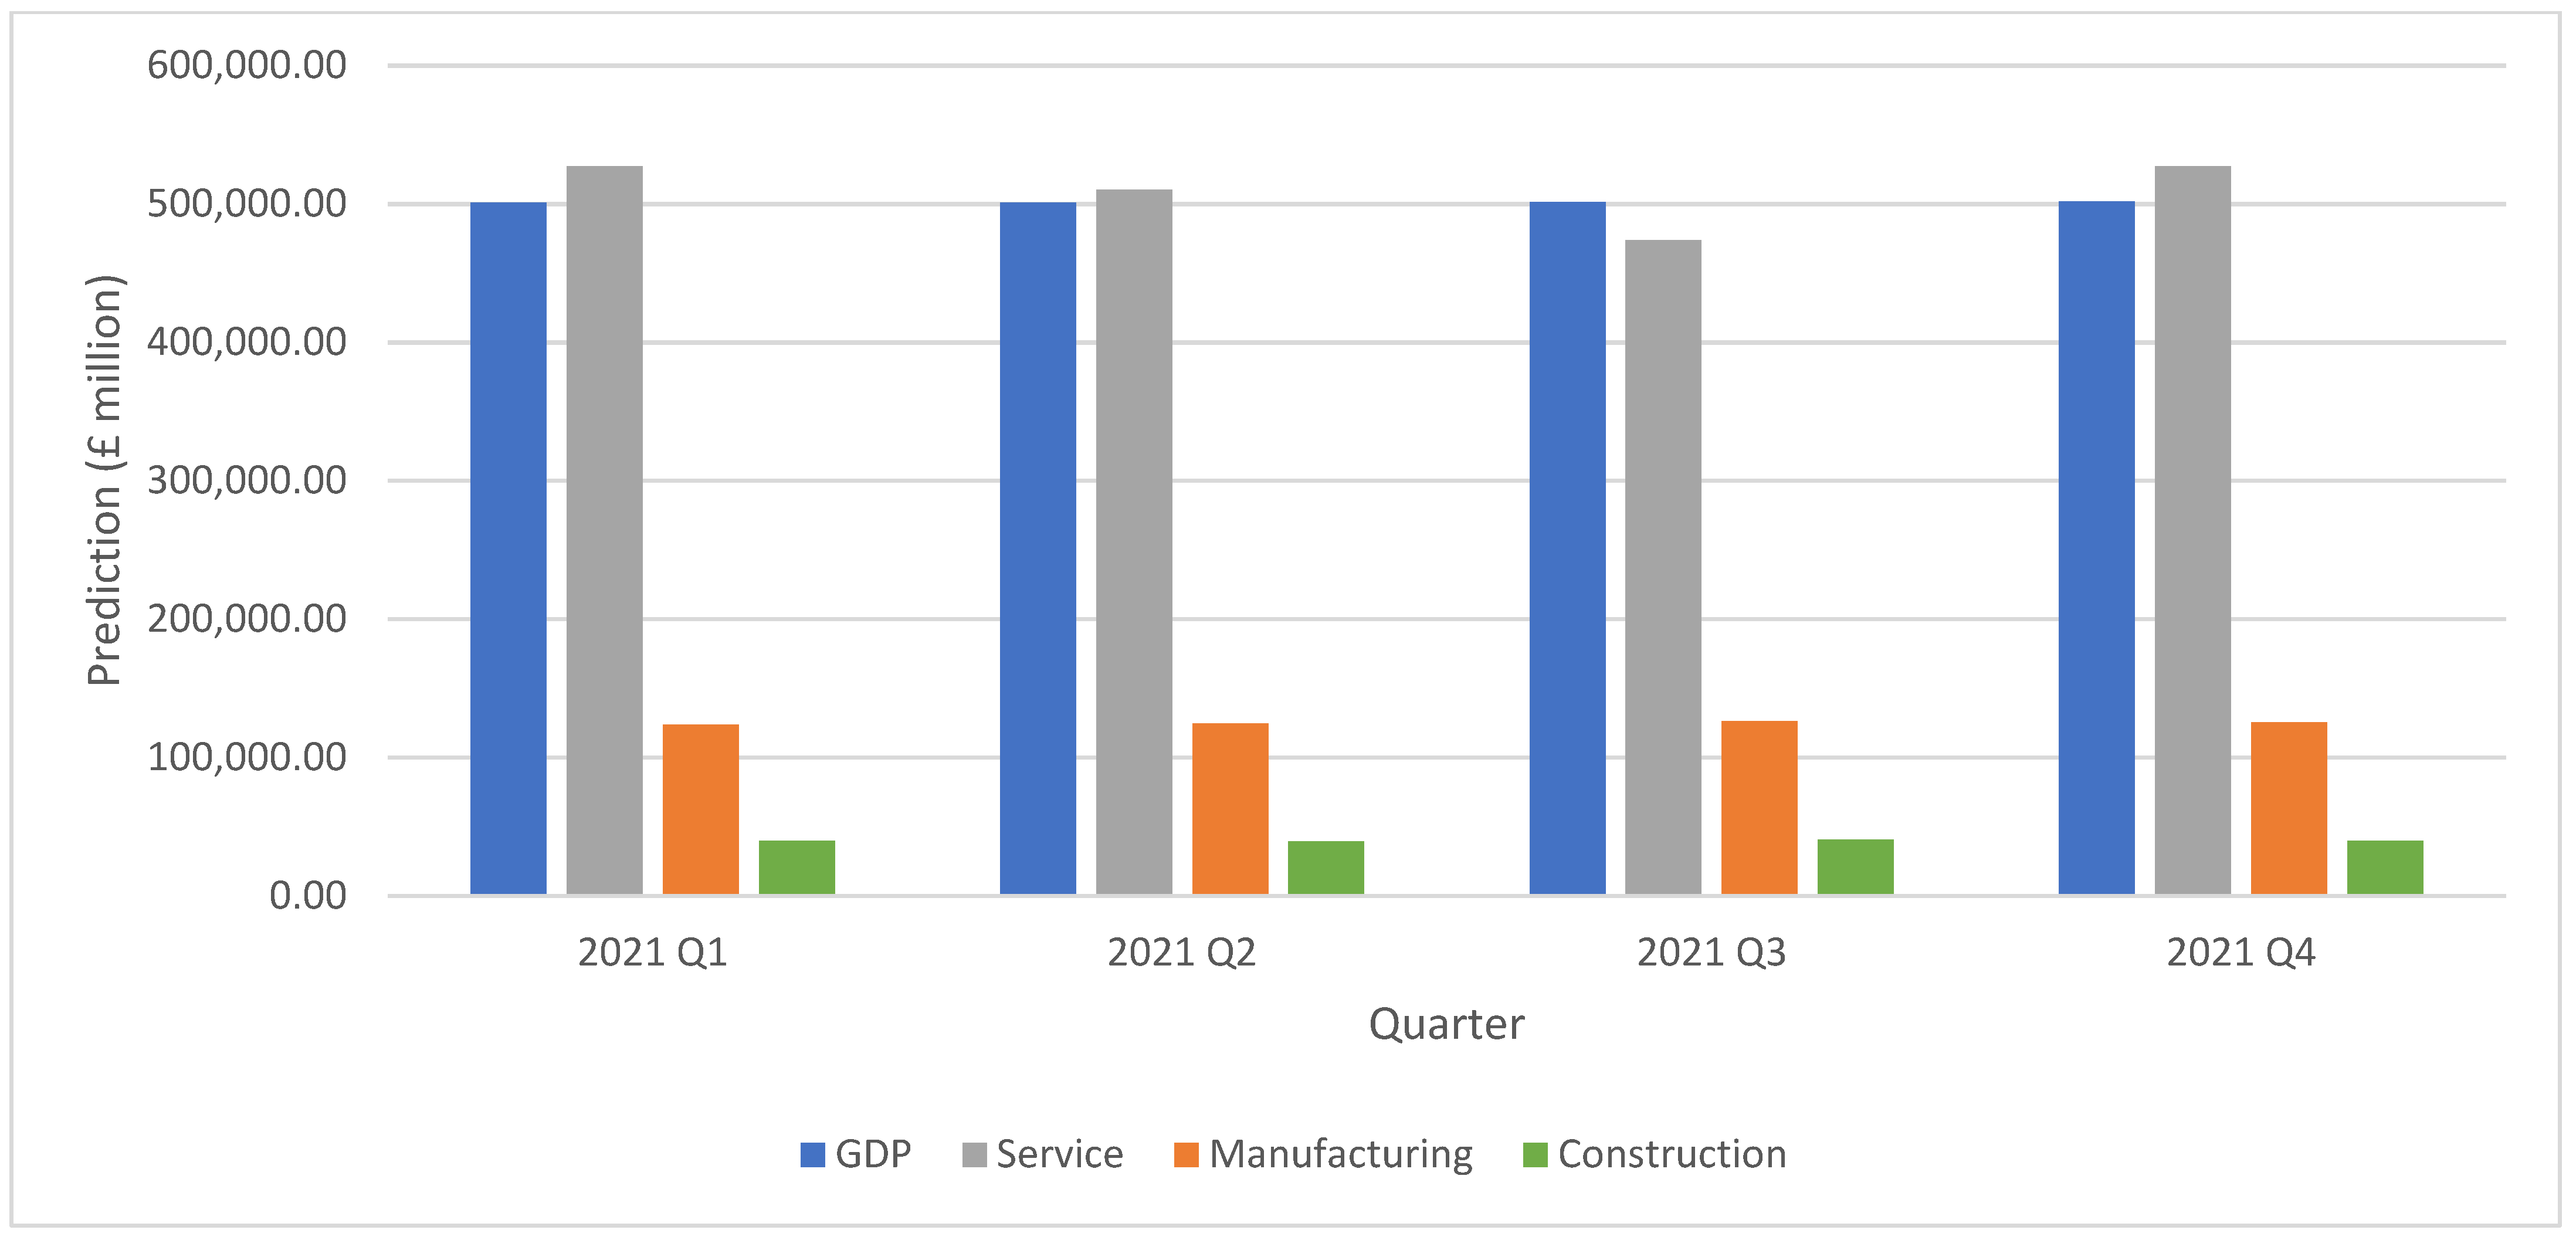
Future Predictions: We used the optimal model built per each time-series to make future predictions. Using available data, values of four future quarters until 2021 Q4 were predicted. The summary of predictions is plotted in Figure 4. To make the visualisation clear, we only used values from 2007 Q1 with a relative index. More details about the prediction are available with Figure 5 which summarises the predictions over the next four quarters corresponding to GDP and industry outputs.

4.1.2. Categorical Time-Series Forecasting

Following the strategies mentioned in the Categorical Time-series Forecasting section, we converted continuous time-series into categorical series to conduct categorical forecasting. Even though we defined three categories as growth, constant and fall, within the used data sets no constant scenarios were found. Similar to continuous value evaluations, a set of commonly used evaluation metrics were used to evaluate model performance. Details of evaluation metrics, results, and future predictions are further described below.
Evaluation Metrics: To evaluate the accuracy of categorical predictions, we used the following evaluation metrics which are commonly used with classification tasks. Unlike the measures used with continuous predictions, these are positively-oriented. In the below equations, t p stands for the number of true positives, f p stands for the number of false positives, and f n stands for the number of false negatives.
  • Recall: Fraction of the correctly identified categories among the total observations.
R e c a l l = t p t p + f n
  • Precision: Fraction of correctly identified categories among the predicted categories.
P r e c i s i o n = t p t p + f p
  • F1: Weighted harmonic mean of precision and recall.
F 1 = 2 × p r e c i s i o n × r e c a l l p r e c i s i o n + r e c a l l
Due to the imbalance class distribution in the data set, we used the weighted average to calculate the final recall, precision and F1 values. After calculating the metrics for each category, the average values were calculated using a weight that is based on the number of actual instances for each group.
Performance Evaluation—ARIMA-based Categorical Forecasting: The evaluation results obtained for ARIMA-based categorical forecasts are summarised in Table 3. According to the results, similar to the scenario of continuous forecasting, GDP values are more accurately predicted by the model with the highest F1 than the other industrial values. The second highest F1 is reported with the construction industry and the lowest F1 is reported with the manufacturing industry.
Future Predictions—ARIMA-based Categorical Forecasting: Using ARIMA-based categorical forecasting, we predicted whether it can be a growth or a fall in the next quarter value compared to its previous quarter value. Similar to continuous forecasting, categories of the next four quarters were predicted until 2021 Q4. The obtained results are summarised in Figure 6.
According to the predictions, in 2021 Q1 there will be a fall in GDP and other industry outputs compared to 2020 Q4 values. Outputs of the industries service and construction will be further dropped in 2021 Q2. However, in contrast to them, GPD and the manufacturing industry show growth in 2021 Q2 than 2021 Q1. GDP has a further growth until 2021 Q4 and the manufacturing industry has growth until 2021 Q3 with a fall in 2021 Q4. After having falls until 2021 Q3, the outputs of the service industry show growth in 2021 Q4. The construction industry is predicted to follow a fall in 2021 Q4 after its growth in 2021 Q3.
Performance Evaluation—SAX-VSM-based Categorical Forecasting: The evaluation results obtained for SAX-VSM-based categorical forecasts are summarised in Table 4. Targeting the generation of predictions for all quarters in 2021 compared to the values in 2020 Q4, four SAX-VSM models ( p = 1 ,   2 ,   3 ,   4 ) were fine-tuned. As subseries length, values from 3 to 6 were considered to have a sufficient number of instances for model training and validation. For other hyper-parameters, we considered all possible values to identify the optimal setting. Only the F1 values are reported because they represent the overall performance concerning recall and precision. To provide insight into the overall prediction effectiveness of a measure, the average F1 value was also reported.
According to the results, the F1 measure is improved in all time-series predictions compared to ARIMA-based categorical forecasts. However, similar to continuous and ARIMA-based categorical forecasts, GDP values are more accurately predicted than other industry outputs. All the other outputs were also predicted with above 0.74 F1 values with the lowest F1 of 0.7414 from the construction industry.
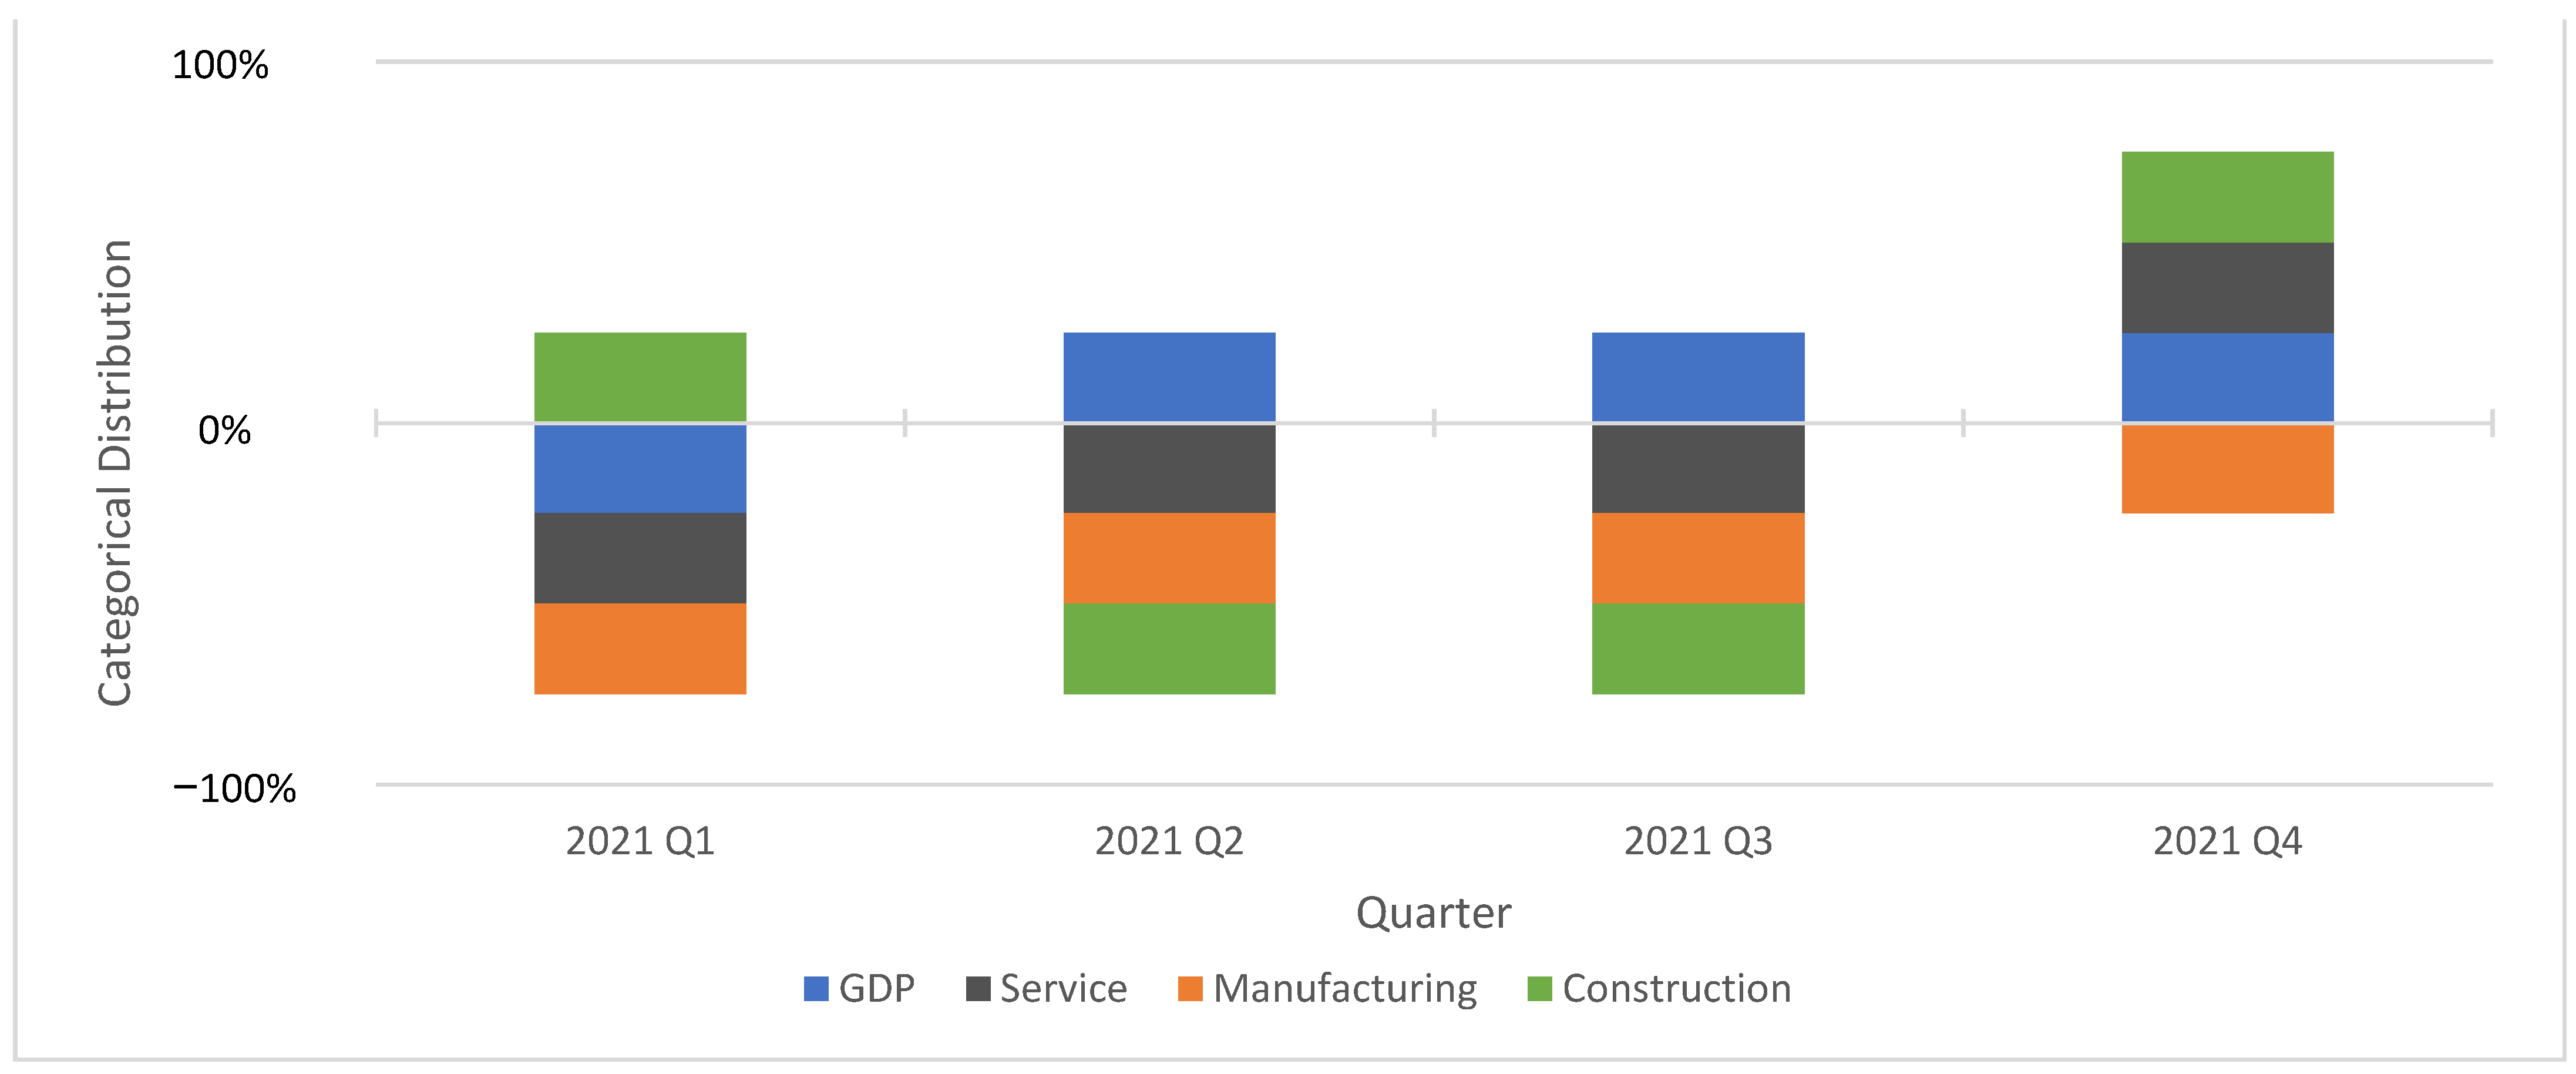
Future Predictions—SAX-VSM-based Categorical Forecasting: Using SAX-VSM-models, we predicted whether the economic measures can show growth or fall in the quarters of 2021 compared to the values reported in 2020 Q4. The obtained results are summarised in Figure 7.
According to the predictions, in 2021 Q1 there will be a fall in GDP and other industry outputs except construction output compared to 2020 Q4 values. In 2021 Q2 and Q3, all industry outputs are predicted to have a fall while GDP is having a growth relative to 2020 Q4. In the last quarter of 2021, relative growth in GDP, service and construction can be expected. There will be no growth in manufacturing industry outputs though out all the quarters in 2021 than the values in 2020 Q4.

5. Discussion

The COVID-19 pandemic has resulted in significant negative impacts on the global economy and the UK economy is not an exception (Kelso 2020). The impact on the UK is likely to be more than many other countries (Beckett 2020). Our results indicate that the pandemic has caused the largest fall in quarterly GDP in the UK since consistent records began in 1948 (ONS 2021). During this study, a steep decline in the GDP index was observed from February 2020, following the sharp rise in the spread of the virus in the UK and the lockdown. The largest fall in quarterly GDP figures was observed in the second quarter of 2020, from April to June. This decline in the quarterly GDP was more than any other drop in the quarterly GDP over the last 60 years in the UK (−20.4%, p < 0.0001). The 2020 Quarter 4 (Oct to Dec) GDP increased by 1.0% following a rise of 16.1% in 2020 Quarter 3 (July to Sept). However, GDP in 2020 Quarter 4 was 6.6% below 2019 Quarter 4 levels (ONS 2021). The headline 2020 GDP declined by 9.9%, which is more than twice the fall in 2009 (ONS 2021). In comparison with other crises, the second-largest quarterly GDP drop was observed in the first quarter of 1974 (miners’ strike crises (Partington 2020)), which was −2.7%, eight times smaller than the observed decrease in COVID-19 Quarter 2. The 1958 economic recession comprised the third most significant drop in the second quarter of 1958 in which the GDP declined by −2.4%. The other drop (−2.0%) was observed in the last quarter of 2008, which resulted from the 2008 (and 2009) financial crisis and the influenzas pandemic that hit the UK at the same time (Barro et al. 2020). When comparing the drop in GDP caused by COVID-19 and Influenza outbreaks, two infectious diseases, COVID-19 had more than ten times the impact of the influenza outbreak on the national GDP (Grantz et al. 2016). For the COVID-19 impacts on the individual industry see Appendix B.
The published data indicate that the UK economy is following a kinked recovery profile (Forrest et al. 2021) and accurate predictions remain a challenging task. Given the unexpected variations and uncertainty, it is important to analyse the impacts of this complex situation on the future economy with and without further restrictions. However, economists differ in their forecasts and how quickly they expect the economy to recover. For instance, the latest surge in COVID-19 cases in late 2020 and early 2021 has led to a re-introduction of stricter lockdowns across the UK by the beginning of January 2021. As a result, the GDP is expected to fall significantly more than expected during the first 2 quarters of 2021 (Harari et al. 2021). However, the fall in GDP is not expected to be as large as that resulting from the first lockdown. The 2020 annual GDP growth was forecasted to be −12.4% (Harari et al. 2021) and −5.2% in the economic prospect forecast (TWB 2021), while the observed decline was −8.4%. The PwC group (Forrest et al. 2021) using the dynamic factor model predicted GDP growth rate yearly and monthly. However, their prediction model showed a slight difference from the observed figures. For instant, in September 2020 they predicted a decrease of −14% for the third quarter of 2020 and that the overall decrease in GDP would be between −11% and −12%. However, the observed ONS data indicated that the third-quarter GDP was +15.5% compared to the previous quarter and it was −12.4% compared to the baseline quarter (Q4 2019) whereas the yearly GDP decrease was −8.4%. In 2020 Quarter 4, GDP showed an increase of 2.2%, which was significantly higher than the predicted figure of −3.7% in the previous PwC economic report (Forrest et al. 2021). The published average forecast for 2021 GDP growth was from 3.7% to 4.3% (Harari et al. 2021). The average forecast of 2021 Q1 GDP was a decline by 3.5% (HM Treasury 2021) to 4% (BoE 2021) compared with the previous quarter based on the effect of the lockdown.
In this study, we used continuous and categorical time-series forecasting-based approaches to make future predictions considering their successful application in a wide range of fields. Unlike most studies conducted in the area of economic analysis, we focused on categorical forecasting in our approach to mitigate the impact of unexpected variations on predictions. Our predictions cover the future values of GDP and other industry (service, manufacturing and construction) outputs in all the quarters in 2021. In addition to the continuous-value predictions, we predicted the categorical values considering the categories growth, constant and fall compared to the values in the previous time point and the last quarter of 2020 to provide more insight into the future economy.
Based on the predictions, GDP indicates a nearly steady-state with a growth of around 0.1% in all quarters of 2021 with no significant increase or decrease. This figure seems different when it is compared to the predicted figure of PwC using their forecasting model ranging from +3% to +7%, depending on their quick or slow response scenarios. Furthermore, when comparing the predictions made for yearly GDP growth compared to the final quarter of 2019, they obtained a decrease ranging from −6%–−8%. This is comparable to the results we have obtained from −8.4% in GDP growth compared to the baseline using our AI model. Our predictions on GDP estimate that in the first quarter of 2021 there will be a decrease of 0.3%. This can be expected as the third lockdown was enforced during the first quarter of the year and businesses were much more prepared than the previous lockdown to be able to still operate and thrive under the new conditions. However, in the rest of the quarters of 2021, there will be growth in GDP according to the predictions.

6. Conclusions

Most studies that analysed the impacts of the COVID-19 on the UK economy have similar conclusions to our study, emphasizing the extraordinary impacts on the different sectors of the UK economy. The common line in the economic literature is represented in the unprecedented impacts of the pandemic on the UK economy, which is associated with the mitigation strategies that the government imposes and is depending on how long these strategies will last. The costs of these strategies are due to lost jobs because of lower demand and business closures. The research papers also revealed a similar negative impact of the pandemic on the same sectors we focused on in our study (construction, services, and production.)
The specific nature of the UK makes it more likely to face larger economic impacts of the pandemic due to Brexit which is likely to increase input costs by increasing barriers to trade between the UK and the EU. Furthermore, the UK is likely to face a major change in its labour market, which will require more support from the government to improve skills and cope with this change to efficiently allocate its resources. The UK’s institutional setting may also have been a driver of this poor performance towards the pandemic, which leads to the provision of inadequate information that affected the evaluation process of the pandemic and the implementation of the proper policy. One of the important policies in dealing with the pandemic is the need to develop effective systems of participation at all levels of human organization.
The pandemic represents not only additional costs on the UK’s economy but also the challenges of the balance between the different economic goals of the government, increasing jobs and promoting efficiency on the one hand and balancing between the burden of the pandemic on the UK economy and the burden of the post-pandemic costs on the other. Imposing mitigation strategies would lower death rates and fight the pandemic, but it imposes much higher costs, in the long run, costs that would represent even much more challenges for the policymaker in the future.
In short, the case of the UK economy with its nature facing the pandemic creates a dilemma that represents a major challenge to any decision maker.
Studying the pattern of recovery following previous economic crises may help to accurately forecast the pattern of change in the future. In addition, studying the impacts of the crisis utilising a sufficient time period following the pandemic is likely to provide more accurate figures on the long-term changes in the economy as the very early figures may be misleading and could exaggerate the impacts. AI provides an important tool for large scale analysis of economic data and can provide the robust tool for multiparameter and multidimensional data analysis for evaluating the impacts and predicting future patterns. The forecasts provided in the current study can help make better decisions, determine monetary and fiscal policies, and could be used by the government and business to help determine their future strategy, budgets and multi-year plans. However, further validation of AI models is warranted to ensure more reliability and utility of this approach. The more variables, events, and time points are used in the model, the more accurate the prediction.

Author Contributions

Conceptualization, A.R., M.M.G., E.R. and M.M.A.; methodology, H.H., M.M.G. and M.M.A.; software, H.H.; validation, A.R. and H.H.; formal analysis, A.R. and H.H.; investigation, A.R. and H.H.; resources, A.R.; writing—original draft preparation, A.R. and H.H.; writing—review and editing, A.R., H.H., D.R., M.M.G., E.R. and M.M.A.; visualization, A.R. and H.H.; supervision, M.M.A.; project administration, M.M.A.; All authors have read and agreed to the published version of the manuscript.

Funding

This research received no external funding.

Institutional Review Board Statement

Not applicable.

Informed Consent Statement

Not applicable.

Data Availability Statement

The data used in this study were collected from the Office for National Statistics (ONS 2021) and the implementation code is available online at https://github.com/HHansi/Economic-Prediction.

Conflicts of Interest

The authors declare no conflict of interest.

Appendix A

Table A1. The main eight recessions in quarterly GDP observed since records began in 1955.
First QuarterLast QuarterNumber of Quarters of Negative GrowthTotal Decline/%
1956 Q21956 Q3Two quarters−0.3
1961 Q31961 Q4Two quarters−0.7
1973 Q31974 Q1Three quarters−4.1
1975 Q21975 Q3Two quarters−2.0
1980 Q11981 Q1Five quarters−4.2
1990 Q31991 Q3Five quarters−2.0
2008 Q22009 Q2Five quarters−6.0
2020 Q12020 Q2 (Keogh-Brown et al. 2020)Two quarters−22.1

Appendix B

The construction industry was the most affected industry showing a decrease of 35%. This is the largest quarterly fall in the construction industry’s GDP since records began, more than four times bigger than the second-largest fall in the construction industry. The influenzas pandemic for instance resulted in a reduction in the GDP by −2.25% to −5.2% (Keogh-Brown et al. 2020; McKibbin and Fernando 2020). This study also showed that all new investments in the construction industry have decreased by 11% since February 2020, an index of 473,444 was obtained for the figures in July. The most significant drop and the lowest value obtained were in April, just following the introduction of the first lockdown; the index dropped by 35.6% from 503,234 to 298,961. Following on from April, the output levels for the industry as a whole started to rise, as businesses began to adapt to the situation. The sector that was the most significantly affected was public housing. This sector’s output levels dropped by 67% in April 2020, as the majority of public construction work on new housing was halted (Boissay and Rungcharoenkitkul 2020). Keogh-Brown et al. (2020) identified a reduction in the consumer industry output level during the influenzas outbreak, which was 9% higher than the index obtained in this study. The only sector of the construction industry that achieved a higher index was the public infrastructure sector, achieving an index that was 6.1% higher than before the lockdown. This sector was least affected by the lockdown overall.
The production industry was affected but not as badly affected as the construction industry. The second quarter of 2020 GDP for the production industry was −20%. The second-largest quarterly fall for the production industry was observed in the first quarter of 2009. However, the fall in GDP was 5%, Four times smaller than the decrease in GDP in the second quarter of 2020. This is further evidence that each industry was affected differently by the pandemic, which represents that the production industry was the most affected industry by the lockdown period, but not to the extent that the construction industry’s GDP had dropped. As highlighted above, the absolute reduction in the three categories indicated that construction was affected the most with a 35% reduction compared to the service industry and production industry (19% and 20%). However, when analysing the relative reduction as compared to the previous falls in these industry performances during the recent economic history in the UK, we found that the relative reduction in the service industry was the highest with more than 24 folds compared to influenzas outbreak which affected the UK in 2009. At the same time, the drops in construction and service were five times and four times when compared to the 2009 economic hit, respectively. Interestingly in the 2009 virus outbreak, the biggest impact was observed in the construction and production industry, and the least affected industry was the service with a relative reduction in service was nine times and six times less compared to the construction and production industry. However, during the COVID-19 crisis, the relative reduction in the service industry was three times as big as the construction industry and was two times as big as the production industry. These changes in the patterns of drops of various industries are likely to be a reflection in the scale of the preventive measures taken in both outbreaks and the global nature of the COVID-19 compared to the limited effect of the influence outbreak in 2009.
The service industry GDP saw the smallest decline of all three industries. In the second quarter of 2020, the GDP fell by 19% because of the lockdown imposed in March. That is nearly ten times the value of the second-largest decrease in the service industry GDP of −2.3%, which was observed in the first quarter of 2020. The 2009 financial crisis and the influenza outbreak caused a decrease in the first quarter by 0.8%. This decrease is 96% smaller than the decline observed due to the lockdown imposed. This is further evidence that each industry was affected differently by the pandemic and represented that the service industry was the least affected industry by the lockdown period. This indicates that the service industry was affected significantly, but lower than the construction industry, as a result of the national lockdown.

References

  1. Ahuja, Abhimanyu S. 2019. The impact of artificial intelligence in medicine on the future role of the physician. PeerJ 7: e7702. [Google Scholar] [CrossRef] [PubMed]
  2. Arslan, Janan, and Kurt K. Benke. 2021. Artificial Intelligence and Telehealth may provide early warning of epidemics. Frontiers in Artificial Intelligence 4: 556848. [Google Scholar] [CrossRef]
  3. Balmford, Ben, James D. Annan, Julia C. Hargreaves, Marina Altoè, and Ian J. Bateman. 2020. Cross-country comparisons of COVID-19: Policy, politics and the price of life. Environmental and Resource Economics 76: 525–51. [Google Scholar] [CrossRef] [PubMed]
  4. Barro, Robert J., José F. Ursúa, and Joanna Weng. 2020. The Coronavirus and the Great Influenza Pandemic: Lessons from the “Spanish Flu” for the Coronavirus’s Potential Effects on Mortality and Economic Activity (No. w26866). Cambridge: National Bureau of Economic Research. [Google Scholar]
  5. Beckett, Andy. 2020. Nobody Denies Johnson’s Government is Incompetent. But Do Enough Voters Care? The Guardian. August 22. Available online: https://www.theguardian.com/commentisfree/2020/aug/22/boris-johnson-government-incompetent-prime-minister-competent (accessed on 28 September 2020).
  6. Benvenuto, Domenico, Marta Giovanetti, Lazzaro Vassallo, Silvia Angeletti, and Massimo Ciccozzi. 2020. Application of the ARIMA model on the COVID-2019 epidemic dataset. Data in Brief 29: 105340. [Google Scholar] [CrossRef] [PubMed]
  7. BFPG. 2020. The British Foreign Policy Group. Available online: https://bfpg.co.uk/2020/04/covid-19-timeline/ (accessed on 1 October 2020).
  8. BoE (Bank of England). 2021. Monetary Policy Report. London: Bank of England, p. 2. [Google Scholar]
  9. Boissay, Frederic, and Phurichai Rungcharoenkitkul. 2020. Macroeconomic Effects of COVID-19: An Early Review (No. 7). Basel: Bank for International Settlements. [Google Scholar]
  10. Chatfield, Chris. 2000. Time-Series Forecasting. Boca Raton: CRC Press. [Google Scholar]
  11. Child, John. 2021. Organizational participation in post-covid society—Its contributions and enabling conditions. International Review of Applied Economics 35: 117–46. [Google Scholar] [CrossRef]
  12. Coakley, Jerry, Periklis Kougoulis, and John C. Nankervis. 2014. Comovement and FTSE 100 index changes. International Journal of Behavioural Accounting and Finance 4: 93–112. [Google Scholar] [CrossRef]
  13. Costa Dias, Monica, Robert Joyce, Fabien Postel-Vinay, and Xiaowei Xu. 2020. The challenges for labour market policy during the COVID-19 pandemic. Fiscal Studies 41: 371–82. [Google Scholar] [CrossRef]
  14. De Lyon, Josh, and Swati Dhingra. 2021. The Impacts of COVID-19 and Brexit on the UK Economy: Early Evidence in 2021. London: Centre for Economic Performance, London School of Economics and Political Science. [Google Scholar]
  15. Fattah, Jamal, Latifa Ezzine, Zanab Aman, Haj El Moussami, and Abdeslam Lachhab. 2018. Forecasting of demand using ARIMA model. International Journal of Engineering Business Management 10: 1847979018808673. [Google Scholar] [CrossRef] [Green Version]
  16. Forrest, Nick, Hannah Audino, Jonathan Gillham, and Barret Kupelian. 2021. UK Economic Update. ©PriceWaterhouse Coopers LLP (PwC Network). Available online: https://www.pwc.co.uk/ (accessed on 1 March 2021).
  17. Fu, Xin, Hao Yang, Chenxi Liu, Jianwei Wang, and Yinhai Wang. 2019. A hybrid neural network for large-scale expressway network OD prediction based on toll data. PLoS ONE 14: e0217241. [Google Scholar] [CrossRef] [Green Version]
  18. Grantz, Kyra H., Madhura S Rane, Henrik Salje, Gregory E. Glass, Stephen E. Schachterle, and Derek A.T. Cummings. 2016. Disparities in influenza mortality and transmission related to sociodemographic factors within Chicago in the pandemic of 1918. Proceedings of the National Academy of Sciences of the United States of America 113: 13839–44. [Google Scholar] [CrossRef] [Green Version]
  19. Griffith, Rachel, Peter Levell, and Rebekah Stroud. 2020. The Impact of COVID-19 on Share Prices in the UK. Fiscal Studies 41: 363–69. [Google Scholar] [CrossRef] [PubMed]
  20. Harari, Daniel, Matthew Keep, and Philip Brien. 2021. Coronavirus: Economic Impact. Briefing Paper. Number 8866, 26 February 2021. London: The House of Commons Library. Available online: https://commonslibrary.parliament.uk/research-briefings/cbp-8866/ (accessed on 24 September 2021).
  21. Herrera, Manuel, Aida A Ferreira, David Coley, and Ronaldo R.B. de Aquino. 2016. SAX-quantile based multiresolution approach for finding heatwave events in summer temperature time series. AI Communications 29: 725–32. [Google Scholar] [CrossRef] [Green Version]
  22. Hewamalage, Hansika, Christoph Bergmeir, and Kasun Bandara. 2021. Recurrent neural networks for time series forecasting: Current status and future directions. International Journal of Forecasting 37: 388–427. [Google Scholar] [CrossRef]
  23. HM Treasury. 2021. Survey of Independent Forecasts for the UK Economy: February 2021. London: HM Treasury. [Google Scholar]
  24. Huang, Chaolin, Yeming Wang, Xingwang Li, Lili Ren, Jianping Zhao, Zhang Hu, Fan Li, Guohui Yi, Jiuyang Xu, and Xiaoying Gu. 2020. Clinical features of patients infected with 2019 novel coronavirus in Wuhan, China. Lancet 395: 497–506. [Google Scholar] [CrossRef] [Green Version]
  25. Ibrahim, Asmaa, Paul Gamble, Ronnachai Jaroensri, Mohammed M Abdelsamea, Craig H. Mermel, Po-Hsuan Cameron Chen, and Emad A. Rakha. 2020. Artificial intelligence in digital breast pathology: Techniques and applications. Breast 49: 267–73. [Google Scholar] [CrossRef] [PubMed] [Green Version]
  26. Kelso, Paul. 2020. Coronavirus: Economic Impact Bigger than First Feared, Warns IMF. Sky News. Available online: https://news.sky.com/ (accessed on 10 October 2020).
  27. Keogh, Eamonn, Jessica Lin, and Ada Fu. 2005. Hot sax: Efficiently finding the most unusual time series subsequence. In Proceedings of the Fifth IEEE International Conference on Data Mining (ICDM’05), Houston, TX, USA, November 27–30; p. 8. [Google Scholar]
  28. Keogh-Brown, Marcus R., Herning Tarp Jensen, John W. Edmunds, and Richard D. Smith. 2020. The impact of COVID-19, associated behaviours and policies on the UK economy: A computable general equilibrium model. SSM-Population Health 12: 100651. [Google Scholar] [CrossRef]
  29. Kim, Myung Hwa, Ju Hyung Kim, Kyoungjin Lee, and Gwang-Yong Gim. 2021. The Prediction of COVID-19 Using LSTM Algorithms. International Journal of Networked and Distributed Computing 9: 19–24. [Google Scholar] [CrossRef]
  30. McKibbin, Warwick, and Roshen Fernando. 2020. The Global Macroeconomic Impacts of COVID-19: Seven Scenarios. Centre for Applied Macroeconomic Analysis (CAMA) Working Paper 19: 1–43. [Google Scholar] [CrossRef] [Green Version]
  31. O’Donnell, Gus, and Harry Begg. 2020. Far from Well: The UK since COVID-19, and Learning to Follow the Science (s). Fiscal Studies 41: 761–804. [Google Scholar] [CrossRef]
  32. ONS. 2021. Office for National Statistics: Coronavirus and the Impact on Output in the UK Economy. Available online: https://www.ons.gov.uk/economy/grossdomesticproductgdp/articles/coronavirusandtheimpactonoutputintheukeconomy/december2020 (accessed on 20 March 2021).
  33. Paisley, Anne. 2020. COVID-19: The State of Global Pandemic Preparedness. Available online: https://www.one.org/international/blog/state-of-global-pandemic-preparedness/ (accessed on 1 October 2020).
  34. Partington, Richard. 2020. How Does UK’s COVID Recession Compare with Previous Ones? The Guardian. August 12. Available online: https://www.theguardian.com/business/2020/aug/12/how-does-uks-covid-recession-compare-with-previous-ones (accessed on 1 October 2020).
  35. Saker, Lance, Kelley Lee, Barbara Cannito, Anna Gilmore, and Diarmid Campbell-Lendrum. 2004. Globalization and Infectious Diseases: A Review of the Linkages. Geneva: UNDP/World Bank/WHO Special Programme on Tropical Diseases Research. [Google Scholar]
  36. Senin, Pavel, and Sergey Malinchik. 2013. Sax-vsm: Interpretable time series classification using sax and vector space model. In Proceedings of the 2013 IEEE 13th International Conference on Data Mining, Dallas, TX, USA, December 7–10; pp. 1175–1180. [Google Scholar]
  37. Singh, S. N., and Abheejeet Mohapatra. 2019. Repeated wavelet transform based ARIMA model for very short-term wind speed forecasting. Renewable Energy 136: 758–68. [Google Scholar]
  38. Song, Ligang, and Yixiao Zhou. 2020. The COVID-19 pandemic and its impact on the global economy: What does it take to turn crisis into opportunity? China and World Economy 28: 1–25. [Google Scholar] [CrossRef]
  39. Stephens, Mark, Sian Cross, and Gareth Luckwell. 2020. Coronavirus and the Impact on Output in the UK Economy: June 2020; London: Office for National Statistics, p. 12.
  40. Stilo, Giovanni, and Paola Velardi. 2016. Efficient temporal mining of micro-blog texts and its application to event discovery. Data Mining and Knowledge Discovery 30: 372–402. [Google Scholar] [CrossRef]
  41. TWB (The World Bank). 2021. Global Economic Prospects 2021. Available online: https://www.worldbank.org/en/publication/global-economic-prospects (accessed on 24 September 2021).
  42. Wahl, Brian, Aline Cossy-Gantner, Stefan Germann, and Nina R. Schwalbe. 2018. Artificial intelligence (AI) and global health: How can AI contribute to health in resource-poor settings? BMJ Global Health 3: e000798. [Google Scholar] [CrossRef] [PubMed] [Green Version]
Figure 1. SAX-VSM training data preparation.
Economies 09 00137 g001
Figure 2. Pattern of changes in GDP from 1955 until the end of 2020 highlighting the most significant drops and the pattern of recovery.
Economies 09 00137 g002
Figure 3. (a) Shows the output level for the service industry in the United Kingdom from 1997 to 2021. (b) shows the output level for the manufacturing industry in the United Kingdom from 1997 to 2021. (c) shows the output level for the Construction industry in the United Kingdom from 1997 to 2021.
Economies 09 00137 g003aEconomies 09 00137 g003b
Figure 4. Quarterly output of UK sectors: actual measures 2007 Q1–2020 Q4, predicted measures 2021 Q1–2021 Q4.
Economies 09 00137 g004
Figure 5. Predicted outputs of GDP (CVM), service, manufacturing, and construction (CVM) 2021 Q1–2021 Q4.
Economies 09 00137 g005
Figure 6. Categorical quarterly output of GDP (CVM), service, manufacturing and construction (CVM): actual measures 2007 Q1–2020 Q4, predicted measures 2021 Q1–2021 Q4 using ARIMA-based categorical forecasting (growth is represented by the positive side and fall is represented by the negative side of the vertical axis).
Economies 09 00137 g006
Figure 7. Categorical predictions for GDP (CVM), service, manufacturing, and construction (CVM) relative to 2020 Q4 values using SAX-VSM-based categorical forecasting (growth is represented by the positive side and fall is represented by the negative side of the vertical axis).
Economies 09 00137 g007
Table 1. Periods of major recessions in the UK with the pattern of changes in the gross domestic product (GDP).
PeriodReason for the DownturnTotal Drop in GDP over the Period/%Lowest Figure Quarter Following the Start of the CrisisHow Many Quarters Did It Take to Return to Baseline
2019 Q4 to 2020 Q2COVID-19−21.2Second quarter of 2020Ongoing
2008 Q1 to 2009 Q2The 2008 global financial crisis−5.9Fourth quarter of 2008Six quarters
1974 Q2 to 1975 Q31974 Miners’ strikes−5.4Second quarter of 1975Five quarters
1979 Q2 to 1981 Q1During the 1980′s economic downturn−5.3Second quarter of 1980Seven quarters
1990 Q2 to 1991 Q3The early 1990 recession−2.0Third quarter of 1990Five quarters
Table 2. Continuous time-series forecasting evaluation results.
Time-SeriesRMSEMAPE
GDP (CVM)27,202.42080.0227
Service42,746.63050.0559
Manufacturing7898.84700.0370
Construction (CVM)3344.79440.0489
Table 3. ARIMA-based categorical time-series forecasting evaluation results.
Time-SeriesRecallPrecisionF1
GDP (CVM)0.88890.79010.8366
Service0.51850.54720.5266
Manufacturing0.51850.51530.5104
Construction (CVM)0.59260.64420.6120
Table 4. SAX-VSM-based categorical time-series forecasting evaluation results.
Time-SeriesF1 (p = 1)F1 (p = 2)F1 (p = 3)F1 (p = 4)Average F1
GDP (CVM)0.86930.88720.95590.90070.9033
Service0.87390.91670.69010.84820.8322
Manufacturing0.77130.75000.72730.79670.7613
Construction (CVM)0.73200.73660.76410.73300.7414
Publisher’s Note: MDPI stays neutral with regard to jurisdictional claims in published maps and institutional affiliations.